jahangir aziz - icrier
TRANSCRIPT

M U M B A I
INDIA: Growth risk and policy spaceINDIA: Growth risk and policy space
ST
RI
CT
LY
PR
IV
AT
EA
ND
CO
NF
ID
EN
TI
AL
Jahangir Aziz
(91) 22-6719-8033 [email protected]
Gunjan Gulati
(91) 22-6639-3125 [email protected]
Vikas Agarwal
(91) 22-6639-2961 [email protected]

Agenda
A S I A E C O N O M I C A N D M A R K E T S R E S E A R C H
Growth risks
How the adjustment might look
Why India got hit
Global Recession
39
Policy space
IND
IA:
GRO
WTH
RIS
KS A
ND
PO
LICY
SPA
CE

A S I A E C O N O M I C A N D M A R K E T S R E S E A R C H
Recession goes global
Global Real GDPGlobal Real GDP
12
2008 2009 2010 3Q08 4Q08 1Q09 2Q09 3Q09 4Q09
United States 1.3 -1.8 2.5 -0.5 -3.8 -5.5 -0.5 1.5 2.5
Japan -0.4 -5.7 2.2 -1.8 -9.0 -12.0 -2.5 -1.0 2.0
Euro area 0.8 -2.2 0.8 -0.7 -5.0 -4.0 -1.0 0.0 1.0
United Kingdom 0.7 -2.9 1.0 -2.6 -5.9 -5.0 -1.5 0.0 1.0
Asia ex. Japan 6.0 3.4 6.6 3.6 -4.6 1.3 6.7 8.6 9.0
China 9.0 7.2 8.5 5.5 1.5 5.1 10.0 11.7 12.6
India 6.2 5.5 7.7 8.7 0.3 0.1 4.8 8.9 10.9
Latin America 4.1 -0.4 3.2 4.2 -4.7 -3.2 -0.3 2.7 3.1
Emerging Europe 4.6 -1.1 2.2 5.0 -4.7 -4.1 -1.7 0.1 1.1
Global 1.7 -1.7 2.4 0.1 -4.9 -4.8 -0.1 1.6 2.7
Developed markets 0.8 -2.6 1.8 -0.8 -5.0 -5.9 -1.1 0.5 1.8
Emerging markets 5.2 1.6 4.9 3.9 -4.5 -0.6 3.6 5.8 6.3
Source: JP Morgan Datawatch January 31, 2009
% over year ago % over previous period , saar
IND
IA:
GRO
WTH
RIS
KS A
ND
PO
LICY
SPA
CE

A S I A E C O N O M I C A N D M A R K E T S R E S E A R C H
Global downturn deep but short-lived; at least for now!
Real GDP growth Developed and Emerging MarketsReal GDP growth Developed and Emerging Markets
Source: J.P. Morgan economics. Chart shows real GDP growth QoQ saar. Shaded area forecasts.
22
IND
IA:
GRO
WTH
RIS
KS A
ND
PO
LICY
SPA
CE
-10
-5
0
5
10
15
% q/q, saar
00 02 04 06 08 10
Emerging markets
Developed markets

A S I A E C O N O M I C A N D M A R K E T S R E S E A R C H
FROM LONDON TO MUMBAIFROM LONDON TO MUMBAI
Why India got hit?
14
TED Spread and India Call Money Rate
0.0
0.5
1.0
1.5
2.0
2.5
3.0
3.5
4.0
4.5
5.0
1-Jan-08
15-Jan-08
29-Jan-08
12-Feb-08
26-Feb-08
11-Mar-08
25-Mar-08
8-Apr-08
22-Apr-08
6-May-08
20-May-08
3-Jun-08
17-Jun-08
1-Jul-08
15-Jul-08
29-Jul-08
12-Aug-08
26-Aug-08
9-Sep-08
23-Sep-08
7-Oct-08
21-Oct-08
4-Nov-08
18-Nov-08
2-Dec-08
0
2
4
6
8
10
12
14
16
18
20
TED (LHS)
Call money (RHS)
IND
IA:
GRO
WTH
RIS
KS A
ND
PO
LICY
SPA
CE

A S I A E C O N O M I C A N D M A R K E T S R E S E A R C H
Sudden stop in external financing: part coincidental, part structural
Dependence of corporates and banks on external funds
Dependence of non-bank financials (NBFCs) and mutual funds (MFs) on domestic money market and corporate investments
Dependence of SMEs, real-estate, and consumers on NBFCs and MFs
Segmented domestic financial market—regarded as a buffer to shocks—became a key vulnerability, exacerbating price volatility
2468
10121416
2000 2001 2002 2003 2004 2005 2006 2007 2008
% of GDP
Corporates' domestic investment and saving
Investment
Saving
-10
-5
0
5
10
15
Con Gov Inv NetX
India
China
India's investment led growth(Change between 2002-07)
% of GDP
02468
10
2000 2001 2002 2003 2004 2005 2006 2007 2008
% of GDPCorporates' demand for external financing
Investment india
Investment abroad
Foreign fund inflows
IND
IA:
GRO
WTH
RIS
KS A
ND
PO
LICY
SPA
CE

A S I A E C O N O M I C A N D M A R K E T S R E S E A R C H
Decoupling anyone? external openness has increased sharply
20253035404550
2000 2001 2002 2003 2004 2005 2006 2007 2008
% of GDPIndia's trade openess has doubled since the early 2000s
Export + Imports
10203040506070
2000 2001 2002 2003 2004 2005 2006 2007 2008
% of GDPIndia's capital account openess has quadrupled since the early 2000s
Inflows + Outflows
IND
IA:
GRO
WTH
RIS
KS A
ND
PO
LICY
SPA
CE
-5
0
5
10
15
%q/q, saar
00 02 04 06 08
Growth has been increasingly correlated to global conditions
IndiaPartner country wtg avg growth

A S I A E C O N O M I C A N D M A R K E T S R E S E A R C H
How the adjustment might look: a V-shaped recovery still likely …
GDP: expenditure-side details%y/y, fiscal year beginning April 1
Private cons
Government spending Investment Exports Imports GDP Inflation
2001-02 6.1 2.3 -2.9 5.7 3.4 5.2 3.62002-03 2.7 -0.4 17.0 21.8 10.4 3.8 3.42003-04 5.8 2.6 19.9 5.8 16.8 8.4 5.52004-05 5.2 2.6 19.5 28.1 16.0 8.3 6.52005-06 8.7 5.4 19.4 14.8 45.6 9.2 4.42006-07 7.1 6.2 10.9 18.9 24.5 9.7 5.42007-08 8.3 7.0 13.7 7.5 7.7 9.0 4.62008-09f 5.6 9.1 7.1 8.5 12.1 6.2 8.62009-10f 4.9 9.4 4.8 3.7 3.4 5.5 0.72010-11f 6.5 9.0 14.0 15.0 19.0 7.7 3.1
IND
IA:
GRO
WTH
RIS
KS A
ND
PO
LICY
SPA
CE
-6-5-4-3-2-101
% point change from T-3
Non-farm GDP growth
T 3 T 2 T 1 T T 1 T 2 T 3
Average of past downturns
Projected current

A S I A E C O N O M I C A N D M A R K E T S R E S E A R C H
… on investment dynamics
IND
IA:
GRO
WTH
RIS
KS A
ND
PO
LICY
SPA
CE
-4-3
-2-10
12
% point change from T-3
Private consumption growth
T-3 T-2 T-1 T T+1 T+2 T+3
Average of past downturns
Projected current downtrun
-8-6
-4-20
24
% point change from T-3
Government consumption growth
T-3 T-2 T-1 T T+1 T+2 T+3
Average of past downturns
Projected current downtrun
-20-16-12-8-404
-8-6
-4-20
24
% point change from T-3
Investment growth
T-3 T-2 T-1 T T+1 T+2 T+3
Average of past downturns
Projected current (RHS)
-16
-12
-8
-4
0
4
% point change from T-3
Export growth
T-3 T-2 T-1 T T+1 T+2 T+3
Average of past downturns
Projected current
-24-20-16-12-8-4048
% point change from T-3
Import growth
T-3 T-2 T-1 T T+1 T+2 T+3
Average of past downturns
Projected current
-3
-2
-1
0
1
2
% point change from T-3
Current account balance-to-GDP
T-3 T-2 T-1 T T+1 T+2 T+3
Average of past downturns
Projected current

A S I A E C O N O M I C A N D M A R K E T S R E S E A R C H
Inflation to fall and stay low
0
5
10
15
20
25
Jan 07 Apr 07 Jul 07 Oct 07 Jan 08 Apr 08 Jul 08 Oct 08
%oy a
Manufacturing inflation yet to price in supply-side disinflation
Manufacturing
Raw material
Headline
Energy
IND
IA:
GRO
WTH
RIS
KS A
ND
PO
LICY
SPA
CE
-6-4-202468
% point change from T-3
Inflation
T-3 T-2 T-1 T T+1 T+2 T+3
Average of past downturns
Projected current

A S I A E C O N O M I C A N D M A R K E T S R E S E A R C H
Q4 BOP carnage unlikely to be repeated; CA to take over INR dynamics
-20
-10
0
10
20
Jan-
05
Jul-0
5
Jan-
06
Jul-0
6
Jan-
07
Jul-0
7
Jan-
08
Jul-0
8
US$ billion
Capital inflows excluding trade balance, FDI, FII portfolio, and ECB
IND
IA:
GRO
WTH
RIS
KS A
ND
PO
LICY
SPA
CE
-12-10
-8-6-4-20246
2000
2001
2002
2003
2004
2005
2006
2007
2008
2009
Capital account
Current account
% of GDP
Change in balance of payments

A S I A E C O N O M I C A N D M A R K E T S R E S E A R C H
Credit growth to slow appreciably
IND
IA:
GRO
WTH
RIS
KS A
ND
PO
LICY
SPA
CE
27
28
29
30
31
32
Jan 08 Apr 08 Jul 08 Oct 08 Jan 09
70717273747576
as % of DepositsCredit has slowed compared to deposit growth
Credit
G-sec holdings
-14
-10
-6
-2
2
6
% point change from T-3
Real non-food credit growth
T-3 T-2 T-1 T T+1 T+2 T+3
Average of past downturns
Projected current

A S I A E C O N O M I C A N D M A R K E T S R E S E A R C H
GOI yields to fall; corporate bond could be a pleasant surprise
456789
10
Jan-08
Mar-08
May-08
Jul-08
Sep-08
Nov-08
Jan-09
% 10-year GOI bond yield
IND
IA:
GRO
WTH
RIS
KS A
ND
PO
LICY
SPA
CE
012345678
Jan-08
Feb-08
Mar-08
Apr-08
May-08
Jun-08
Jul-08
Aug-08
Sep-08
Oct-08
Nov-08
Dec-08
Jan-09
% difference from GOI bond y ield Long term corporate bond yields have softened
1-Y commercial paper
5-Y corporate bond

A S I A E C O N O M I C A N D M A R K E T S R E S E A R C H
Growth risks: protracted global recession
02468
101214
99Q1 00Q1 01Q1 02Q1 03Q1 04Q1 05Q1 06Q1 07Q1 08Q1 09Q1
%oy a
GDP and industrial production
IP
GDP
-10-505
10152025
%oy a
Transportation indicators confirm the slowdown
2006 2007 2008
Port traffic
Railway freight
IND
IA:
GRO
WTH
RIS
KS A
ND
PO
LICY
SPA
CE
0
5
10
15
20
3-month av erage grow th
As do demand indicators
00 02 04 06 08
Real cash balance
IP Consumer goods
-10
0
10
20
30
40
3m av erage grow th
00 02 04 06 08
IP Capital goods
Real non-food credit demand
And bank credit growth
A S I A E C O N O M I C A N D M A R K E T S R E S E A R C H
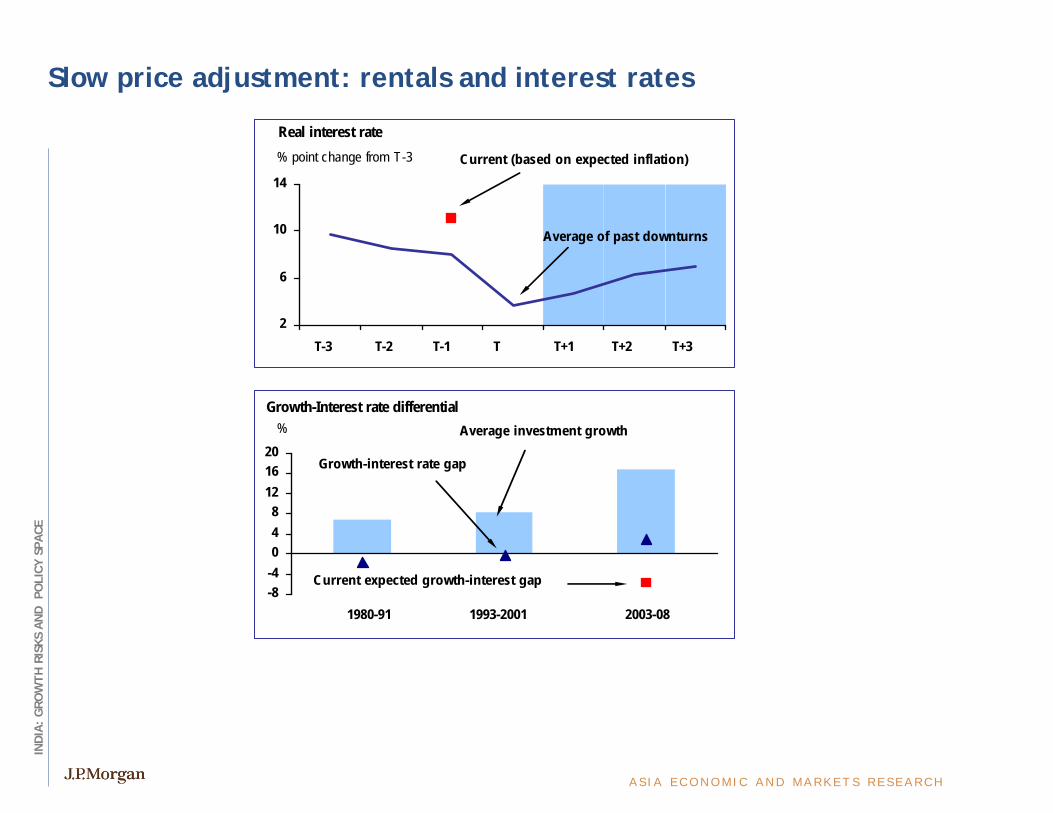
Slow price adjustment: rentals and interest rates
2
6
10
14
% point change from T-3
Real interest rate
T-3 T-2 T-1 T T+1 T+2 T+3
Average of past downturns
Current (based on expected inflation)
-8-4048
121620
% Growth-Interest rate differential
1980-91 1993-2001 2003-08
Growth-interest rate gap
Average investment growth
Current expected growth-interest gap
IND
IA:
GRO
WTH
RIS
KS A
ND
PO
LICY
SPA
CE
A S I A E C O N O M I C A N D M A R K E T S R E S E A R C H
Other risks:
Will banks lend? Bank debt restructuring and RBI forbearance important
Who will bear the risk? Expecting banks to take all the risk unreasonable and unwise. Corp bond market needs to be supportive
Coming elections: overplayed; but monetary policy only effective lever until new gov forms
Security concerns: so far restricted to tourism
IND
IA:
GRO
WTH
RIS
KS A
ND
PO
LICY
SPA
CE
A S I A E C O N O M I C A N D M A R K E T S R E S E A R C H
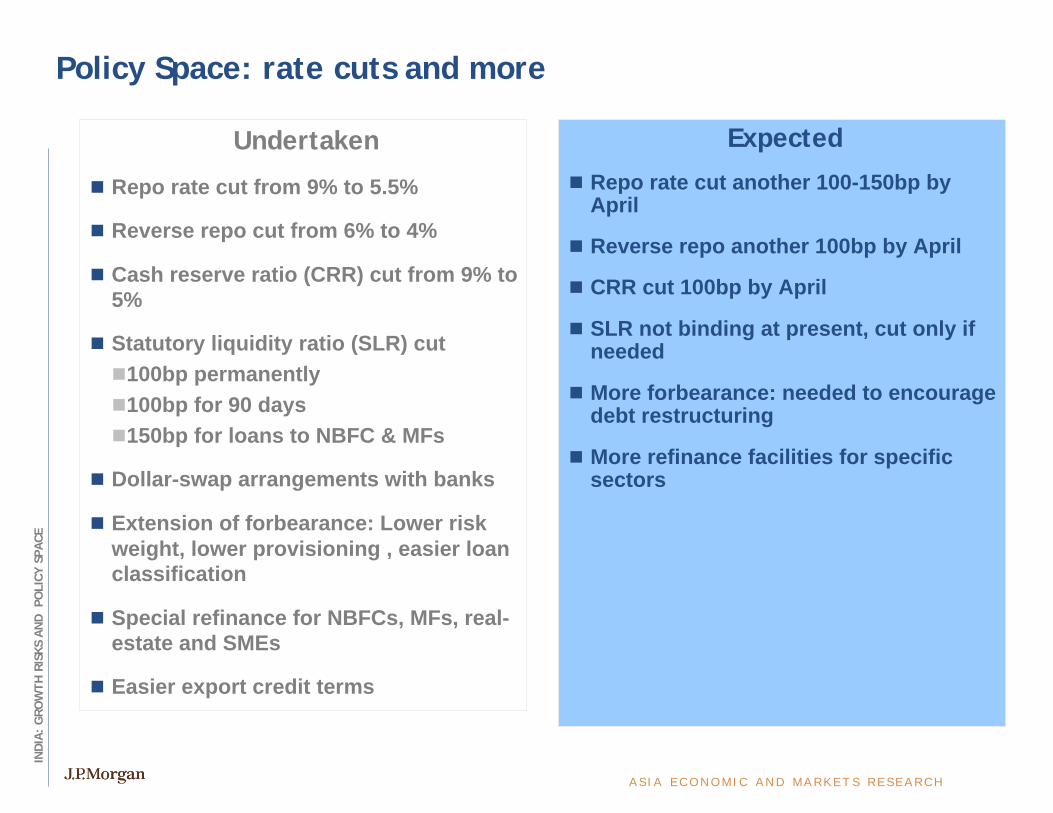
Policy Space: rate cuts and more
Undertaken
Repo rate cut from 9% to 5.5%
Reverse repo cut from 6% to 4%
Cash reserve ratio (CRR) cut from 9% to 5%
Statutory liquidity ratio (SLR) cut100bp permanently100bp for 90 days150bp for loans to NBFC & MFs
Dollar-swap arrangements with banks
Extension of forbearance: Lower risk weight, lower provisioning , easier loan classification
Special refinance for NBFCs, MFs, real-estate and SMEs
Easier export credit terms
Expected
Repo rate cut another 100-150bp by April
Reverse repo another 100bp by April
CRR cut 100bp by April
SLR not binding at present, cut only if needed
More forbearance: needed to encourage debt restructuring
More refinance facilities for specific sectors
IND
IA:
GRO
WTH
RIS
KS A
ND
PO
LICY
SPA
CE

A S I A E C O N O M I C A N D M A R K E T S R E S E A R C H
Monetary policy transmission weak but still effective
2
6
10
14
18
Mar-08
Apr-08
May-08
Jun-08
Jul-08
Aug-08
Sep-08
Oct-08
Nov-08
Dec-08
Policy CorridorCall Rate
In percentMoney market and policy rates
-8
-4
0
4
8
Mar-08
Apr-08
May-08
Jun-08
Jul-08
Aug-08
Sep-08
Oct-08
Nov-08
Dec-08
Tight liquidityEasy liquidityIn Rs trillion
RBI's Discount Window Operations
95
100
105
110
0
4
8
12
16
April 02=100
Monetary conditions and industrial growth%saar
2002 2003 2004 2005 2006 2007 2008
3-M lagged Monetary indexdowntrun
3-M avg industrial growth
IND
IA:
GRO
WTH
RIS
KS A
ND
PO
LICY
SPA
CE

A S I A E C O N O M I C A N D M A R K E T S R E S E A R C H
Fiscal policy: more space than meets the eye
Undertaken
October: 3.3% of GDP1.9% of GDP in cash1.4% of GDP in bonds
December: 0.5-0.7% of GDPExpenditure 0.4% of GDPTax cuts of 0.15% of GDPSupport for export, textile, housing, SMECuts in retail gasoline price
January: 1.5-1.8% of GDP (budget + other)Infrastructure refinancing Rs 400bn SPV for NBFCs worth Rs 250bnState borrowing Rs 300bn
Central government deficit could rise to 6.5% of GDP from 3.7% of GDP last year
Borrowing in Q1 09 Rs1.1tn (3% of deposit)
Window for more support closed for FY09
Expected
FY10 budget deficit 6.2-6.5% of GDP
Less oil and fertilizer subsidy opens up 1.5-2% of GDP space
Debt high (82% of GDP by FY09), but so are assets; divesting when cash strapped typically weakens political opposition
Lower GOI interest rates will help stabilize debt dynamics
Fears of crowding out overplayed in H1 FY10, concern in H2 FY10
FRBM-II likely in FY10
Consolidation not before FY11
Divestment important to balance stimulus with sustainable debt
IND
IA:
GRO
WTH
RIS
KS A
ND
PO
LICY
SPA
CE

A S I A E C O N O M I C A N D M A R K E T S R E S E A R C H
Capital controls: time for regime change
Undertaken
Cap on ECB interest removed but approval still needed
ECB extended to NBFCs to refinance infra loans
Cap on NRI deposit raised
FII limit on corporate bond raised to $15bn from $6bn
Expected
Gradual removal of NRI deposit cap
Gradual removal of FII limit in corporate bonds
Some increase in FII limit in GOI bonds (likely with SLR reduction)
Gradual removal of sector restrictions for VC and PE
Move towards QFI from FII regime
IND
IA:
GRO
WTH
RIS
KS A
ND
PO
LICY
SPA
CE

A S I A E C O N O M I C A N D M A R K E T S R E S E A R C H
[This presentation was prepared exclusively for the benefit and internal use of the JPMorgan client to whom it is directly addressed and delivered (including such client’s subsidiaries, the “Company”) in order to assist the Company in evaluating, on a preliminary basis, the feasibility of a possible transaction or transactions and does not carry any right of publication or disclosure, in whole or in part, to any other party. This presentation is for discussion purposes only and is incomplete without reference to, and should be viewed solely in conjunction with, the oral briefing provided by JPMorgan. Neither this presentation nor any of its contents may be disclosed or used for any other purpose without the prior written consent of JPMorgan.
The information in this presentation is based upon any management forecasts supplied to us and reflects prevailing conditions and our views as of this date, all of which are accordingly subject to change. JPMorgan’s opinions and estimates constitute JPMorgan’s judgment and should be regarded as indicative, preliminary andfor illustrative purposes only. In preparing this presentation, we have relied upon and assumed, without independent verification, the accuracy and completeness of all information available from public sources or which was provided to us by or on behalf of the Company or which was otherwise reviewed by us. In addition, our analyses are not and do not purport to be appraisals of the assets, stock, or business of the Company or any other entity. JPMorgan makes no representations as to the actual value which may be received in connection with a transaction nor the legal, tax or accounting effects of consummating a transaction. Unless expressly contemplated hereby, the information in this presentation does not take into account the effects of a possible transaction or transactions involving an actual or potential change of control, which may have significant valuation and other effects.
Notwithstanding anything herein to the contrary, the Company and each of its employees, representatives or other agents may disclose to any and all persons, without limitation of any kind, the U.S. federal and state income tax treatment and the U.S. federal and state income tax structure of the transactions contemplated hereby and all materials of any kind (including opinions or other tax analyses) that are provided to the Company relating to such tax treatment and tax structure insofar as such treatment and/or structure relates to a U.S. federal or state income tax strategy provided to the Company by JPMorgan.
JPMorgan’s policies prohibit employees from offering, directly or indirectly, a favorable research rating or specific price target, or offering to change a rating or price target, to a subject company as consideration or inducement for the receipt of business or for compensation. JPMorgan also prohibits its research analysts from being compensated for involvement in investment banking transactions except to the extent that such participation is intended to benefit investors.
IRS Circular 230 Disclosure: JPMorgan Chase & Co. and its affiliates do not provide tax advice. Accordingly, any discussion of U.S. tax matters included herein (including any attachments) is not intended or written to be used, and cannot be used, in connection with the promotion, marketing or recommendation by anyone not affiliated with JPMorgan Chase & Co. of any of the matters addressed herein or for the purpose of avoiding U.S. tax-related penalties.
JPMorgan is a marketing name for investment banking businesses of JPMorgan Chase & Co. and its subsidiaries worldwide. Securities, syndicated loan arranging, financial advisory and other investment banking activities are performed by a combination of J.P. Morgan Securities Inc., J.P. Morgan plc, J.P. Morgan Securities Ltd. and the appropriately licensed subsidiaries of JPMorgan Chase & Co. in Asia-Pacific, and lending, derivatives and other commercial banking activities are performed by JPMorgan Chase Bank, N.A. JPMorgan deal team members may be employees of any of the foregoing entities.
This presentation does not constitute a commitment by any JPMorgan entity to underwrite, subscribe for or place any securities or to extend or arrange credit or to provide any other services.
eneral
IND
IA:
GRO
WTH
RIS
KS A
ND
PO
LICY
SPA
CE