jaguar land rover - c.jcms-api.com 442 12.5% 7.9% q1 fy17 399 595 . 11 record fy17 retail sales...
TRANSCRIPT

1
JAGUAR LAND ROVERINVESTOR PRESENTATION
4th October 2017
2
KENNETH GREGOR
CHIEF FINANCIAL OFFICER, JAGUAR LAND ROVER
BENNETT BIRGBAUER
TREASURER, JAGUAR LAND ROVER
PRESENTERS
3
Business Overview and Historical Performance 4
Recent Performance 9
Looking Ahead 13
Q&A
Additional Slides 20
AGENDA
4
BUSINESS OVERVIEW AND HISTORICAL PERFORMANCE
5
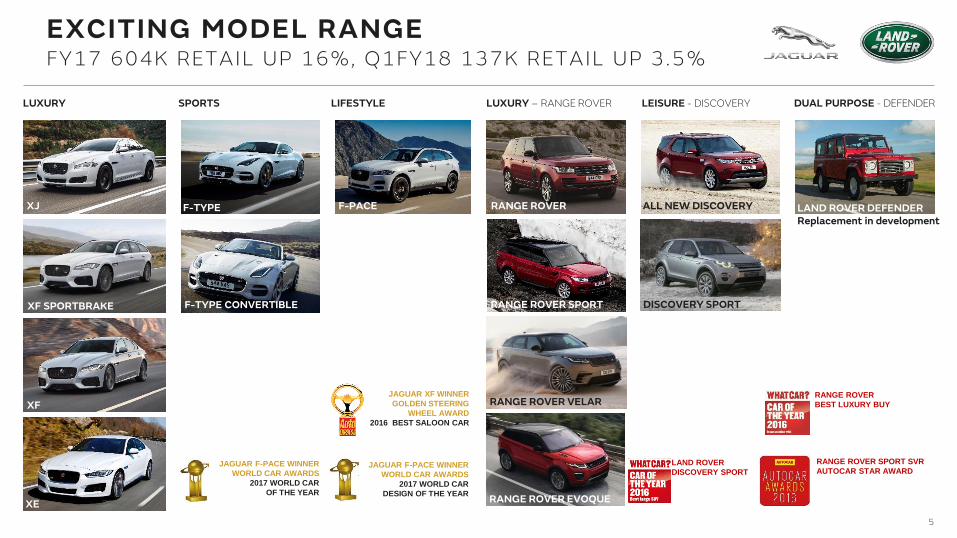
EXCITING MODEL RANGE FY17 604K RETAIL UP 16%, Q1FY18 137K RETAIL UP 3.5%
XJ
LUXURY
XF SPORTBRAKE
XE
F-TYPE Coupe
SPORTS
F-TYPE CONVERTIBLE
F-PACE
LIFESTYLE
LAND ROVER DEFENDERReplacement in development
ALL NEW DISCOVERY
LUXURY – RANGE ROVER LEISURE - DISCOVERY DUAL PURPOSE - DEFENDER
DISCOVERY SPORT
DISCOVERY SPORT
XFL
Range Rover
XEEVOQUE DISCOVERY SPORT
JAGUAR XF WINNER
GOLDEN STEERING
WHEEL AWARD
2016 BEST SALOON CAR
JAGUAR F-PACE WINNER
WORLD CAR AWARDS
2017 WORLD CAR
OF THE YEAR
JAGUAR F-PACE WINNER
WORLD CAR AWARDS
2017 WORLD CAR
DESIGN OF THE YEAR
LAND ROVER
DISCOVERY SPORT
RANGE ROVER
BEST LUXURY BUY
RANGE ROVER SPORT SVR
AUTOCAR STAR AWARD
F-TYPE RANGE ROVER
RANGE ROVER SPORT
RANGE ROVER VELAR
RANGE ROVER EVOQUE
XF
XE
6
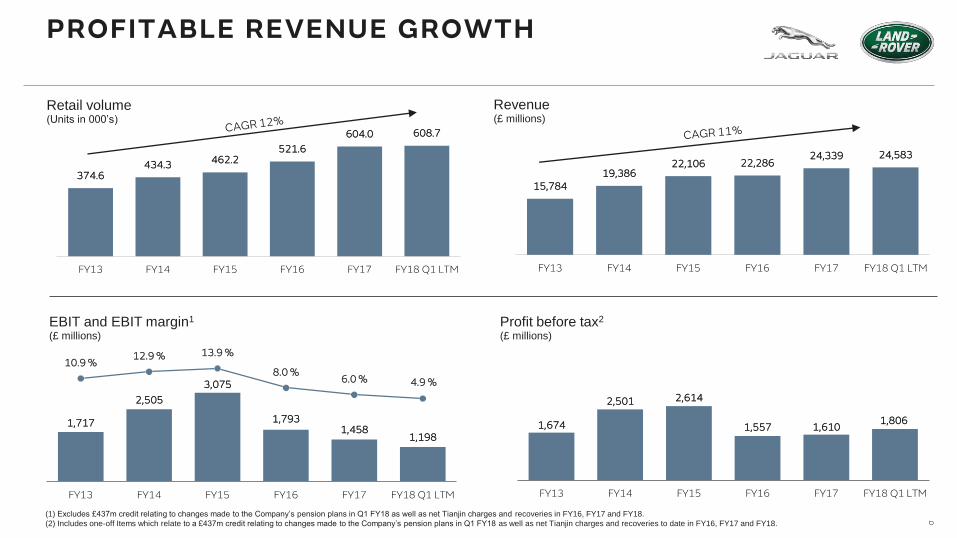
1,674
2,501 2,614
1,557 1,6101,806
FY13 FY14 FY15 FY16 FY17 FY18 Q1 LTM
1,717
2,505
3,075
1,793 1,458
1,198
10.9 %12.9 % 13.9 %
8.0 %6.0 % 4.9 %
FY13 FY14 FY15 FY16 FY17 FY18 Q1 LTM
374.6434.3 462.2
521.6
604.0 608.7
FY13 FY14 FY15 FY16 FY17 FY18 Q1 LTM
Retail volume(Units in 000’s)
(1) Excludes £437m credit relating to changes made to the Company’s pension plans in Q1 FY18 as well as net Tianjin charges and recoveries in FY16, FY17 and FY18.
(2) Includes one-off Items which relate to a £437m credit relating to changes made to the Company’s pension plans in Q1 FY18 as well as net Tianjin charges and recoveries to date in FY16, FY17 and FY18.
EBIT and EBIT margin1
(£ millions)
PROFITABLE REVENUE GROWTH
15,78419,386
22,106 22,28624,339 24,583
FY13 FY14 FY15 FY16 FY17 FY18 Q1 LTM
Revenue(£ millions)
Profit before tax2
(£ millions)
7
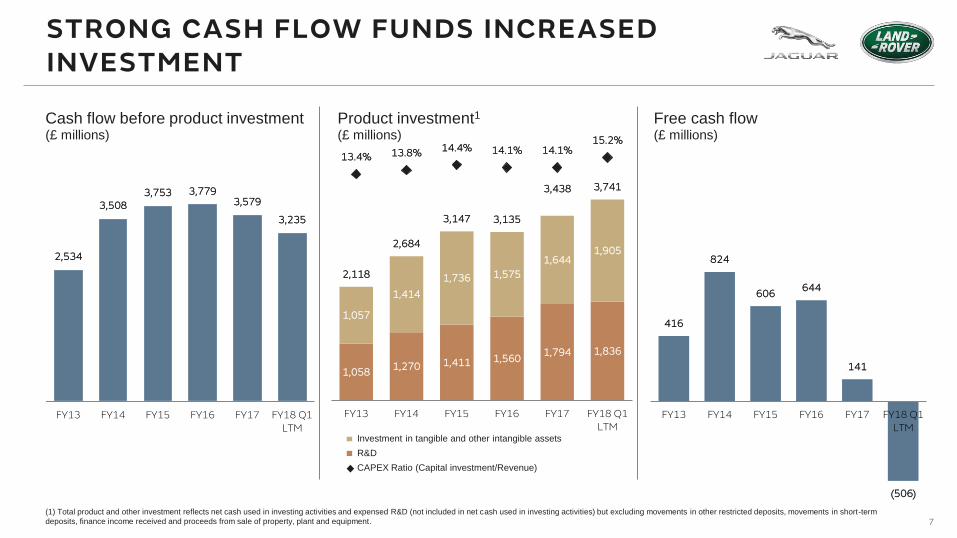
416
824
606 644
141
(506)
FY13 FY14 FY15 FY16 FY17 FY18 Q1LTM
2,534
3,508 3,753 3,779
3,579
3,235
FY13 FY14 FY15 FY16 FY17 FY18 Q1LTM
1,058 1,270 1,411 1,560
1,794 1,836
1,057
1,414
1,736 1,575
1,644 1,905
2,118
2,684
3,147 3,135
3,438 3,741
13.4% 13.8% 14.4% 14.1% 14.1%15.2%
FY13 FY14 FY15 FY16 FY17 FY18 Q1LTM
Cash flow before product investment(£ millions)
Product investment1
(£ millions)
Free cash flow(£ millions)
(1) Total product and other investment reflects net cash used in investing activities and expensed R&D (not included in net cash used in investing activities) but excluding movements in other restricted deposits, movements in short-term
deposits, finance income received and proceeds from sale of property, plant and equipment.
Investment in tangible and other intangible assets
R&D
CAPEX Ratio (Capital investment/Revenue)
STRONG CASH FLOW FUNDS INCREASED INVESTMENT

8
538 384 384 300 400784 570
3,362
139
3,749
4,489
3,885
-
500
1,000
1,500
2,000
2,500
3,000
3,500
4,000
4,500
5,000
Q1FY17
Q1FY18
CY18 CY19 CY20 CY21 CY22 CY23 CY24 CY25 CY26 CY27 TotalDebt
Bonds Other debt: Discounted receivables, finance leases and deferred fees
Total cash
STRONG LIQUIDITY POSITION£4.5B CASH, £1.9B UNDRAWN RCF, EXTENDED MATURITIES
Debt maturity profile£ millions
£1.9b undrawn RCF extended to
2022 with no financial covenant
539 571
GBP / USD FX rate of 1.30059 as of 30-June-2017
4,108
3,501

9
RECENT PERFORMANCE
10
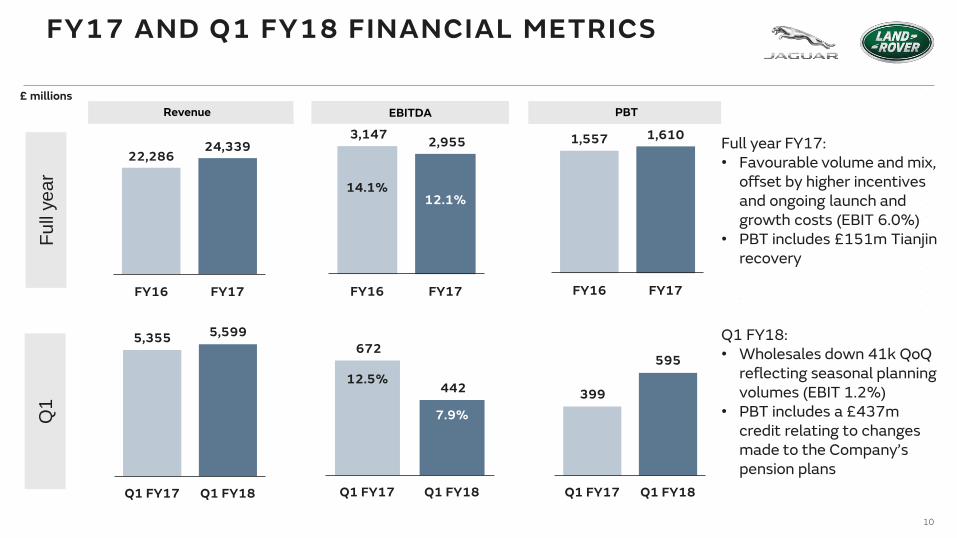
FY17 AND Q1 FY18 FINANCIAL METRICS
£ millions
Q1
Fu
ll ye
ar
Full year FY17:• Favourable volume and mix,
offset by higher incentives and ongoing launch and growth costs (EBIT 6.0%)
• PBT includes £151m Tianjin recovery
Q1 FY18:• Wholesales down 41k QoQ
reflecting seasonal planning volumes (EBIT 1.2%)
• PBT includes a £437m credit relating to changes made to the Company’s pension plans
22,286 24,339
FY16 FY17
3,147 2,955
14.1%12.1%
0.0%
5.0%
10.0%
15.0%
20.0%
25.0%
-
500
1,000
1,500
2,000
2,500
3,000
3,500
FY16 FY17
1,557 1,610
FY16 FY17
Revenue EBITDA PBT900
5,355 5,599
Q1 FY17 Q1 FY18
672
442 12.5%
7.9%
Q1 FY17 Q1 FY18
399
595
Q1 FY17 Q1 FY18

11
RECORD FY17 RETAIL SALES 604,009 UP 16%ALL REGIONS UP EXCEPT OVERSEAS
UK
+16%
125
21%
North America
+24%
124
20%
Europe
+13%
141
23%
China
+32%
125
21%
Overseas
(6)%
89
15%
YoY
Units in ‘000
12
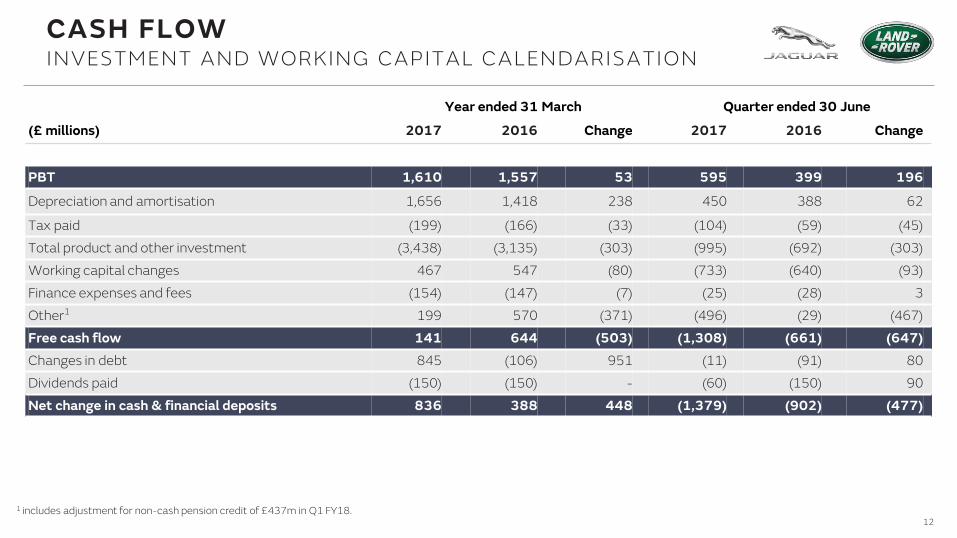
CASH FLOWINVESTMENT AND WORKING CAPITAL CALENDARISATION
Year ended 31 March Quarter ended 30 June
(£ millions) 2017 2016 Change 2017 2016 Change
38 30 38 30
PBT 1,610 1,557 53 595 399 196
Depreciation and amortisation 1,656 1,418 238 450 388 62
Tax paid (199) (166) (33) (104) (59) (45)
Total product and other investment (3,438) (3,135) (303) (995) (692) (303)
Working capital changes 467 547 (80) (733) (640) (93)
Finance expenses and fees (154) (147) (7) (25) (28) 3
Other1 199 570 (371) (496) (29) (467)
Free cash flow 141 644 (503) (1,308) (661) (647)
Changes in debt 845 (106) 951 (11) (91) 80
Dividends paid (150) (150) - (60) (150) 90
Net change in cash & financial deposits 836 388 448 (1,379) (902) (477)
1 includes adjustment for non-cash pension credit of £437m in Q1 FY18.

13
LOOKING AHEAD
14
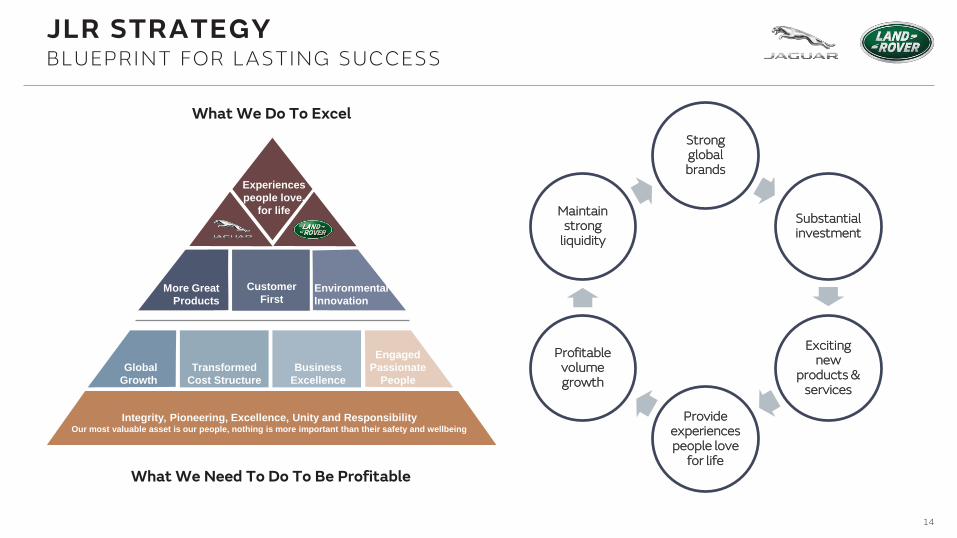
JLR STRATEGYBLUEPRINT FOR LASTING SUCCESS
What We Do To Excel
What We Need To Do To Be Profitable
Experiences
people love,
for life
Customer
FirstEnvironmental
Innovation
More Great
Products
Global
Growth
Transformed
Cost Structure
Business
Excellence
Engaged
Passionate
People
Integrity, Pioneering, Excellence, Unity and ResponsibilityOur most valuable asset is our people, nothing is more important than their safety and wellbeing
Strong global brands
Substantial investment
Exciting new
products & services
Provide experiences people love
for life
Profitable volume growth
Maintain strong
liquidity
15
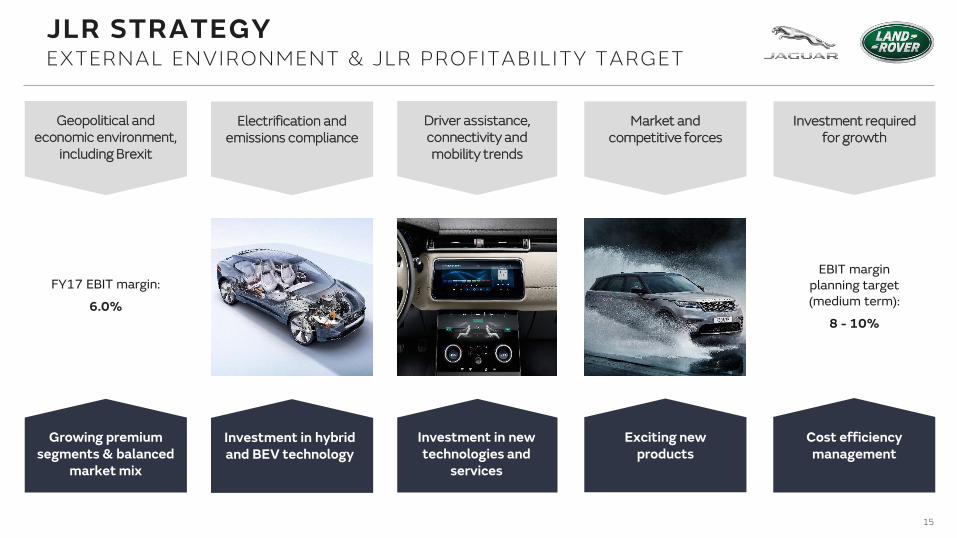
JLR STRATEGYEXTERNAL ENVIRONMENT & JLR PROFITABILITY TARGET
Geopolitical and economic environment,
including Brexit
Electrification and emissions compliance
Market and competitive forces
Driver assistance, connectivity and mobility trends
Investment requiredfor growth
Growing premium segments & balanced
market mix
Investment in hybrid and BEV technology
Exciting new products
Cost efficiency management
Investment in new technologies and
services
FY17 EBIT margin:
6.0%
EBIT marginplanning target (medium term):
8 - 10%

16
EXCITING NEW PRODUCTS TO DRIVE GROWTHAND MORE TO COME. . .
Discovery (US & China May 2017) Range Rover Velar (July 2017)
18MY Range Rover and Range Rover Sport with PHEV variants (this winter)
I-PACE (2018)
First premium SUV BEV
E-PACE (this winter)
XF Sportbrake (September 2017)

17
• InMotion Ventures invests in the future of transport and mobility
• Lyft investment - $25m with opportunities to collaborate
• Investment in technology & infrastructure to support higher levels of connectivity
• Cloudcar - $15m equity investment
• I-PACE Battery Electric Vehicle on sale 2018
• Plug-in hybrids starting in 2018
• JLR vehicles currently include level 2 features
• Investing in driver assistance technology to support increasing degrees of automation
AUTONOMOUS CONNECTED SHAREDELECTRIC
JLR STRATEGIC PRIORITIES -- ACES
18
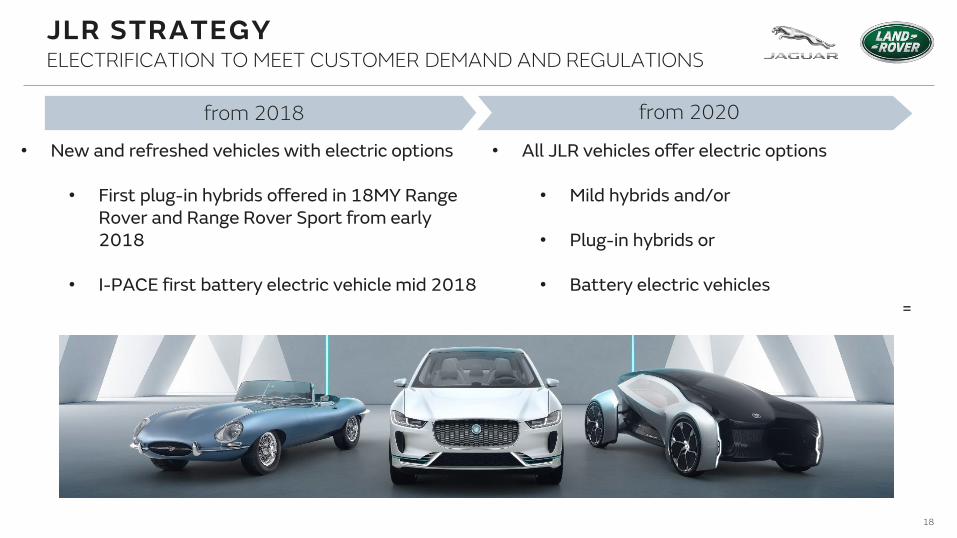
from 2020
JLR STRATEGYELECTRIFICATION TO MEET CUSTOMER DEMAND AND REGULATIONS
from 2018
• New and refreshed vehicles with electric options
• First plug-in hybrids offered in 18MY Range Rover and Range Rover Sport from early 2018
• I-PACE first battery electric vehicle mid 2018
• All JLR vehicles offer electric options
• Mild hybrids and/or
• Plug-in hybrids or
• Battery electric vehicles=
I PACE
19
LOOKING AHEADCONTINUING TO INVEST TO DRIVE PROFITABLE GROWTH
• JLR’s strategy is to achieve sustainable profitable growth by investing proportionally more in new products, technology and manufacturing capacity. Consistent with this, FY18 investment spending is expected to be in the region of £4 – 4.35b, including investment in the new Slovakia plant
• Despite increased geopolitical uncertainty (e.g. Brexit in the UK), economic growth in most major economies is continuing, although competitive conditions and incentive levels in the automotive sector have increased in key markets such as North America
• As previously indicated, JLR expects margin pressures seen in FY17 including higher incentive levels and launch and growth costs to continue in FY18. We also expect seasonality in volume and profit by Quarter to continue
• The launch of the new Discovery (US and China in May), the Range Rover Velar, the Jaguar E-PACE, XF Sportbrake and other exciting new models in FY18 such as the 18MY Range Rover and Range Rover Sport, featuring plug-in hybrid variants, are expected to strengthen our portfolio and attract new customers, driving sustainable profitable growth over the course of the financial year and beyond
• JLR’s planning target remains to achieve an 8-10% EBIT margin in the medium term

20
ADDITIONAL SLIDES

21
Units in ‘000
Volumes include sales from Chery Jaguar Land Rover – Q1 FY18 20,309 units, Q1 FY17 Actuals 13,558
North America
+16%
28
21%
UK
(14)%
23
17%
Europe
0%
34
24%
China
+30%
34
24%
Overseas
(14)%
19
14%
YoY
Q1 FY18 RETAILS 137,463 UP 3.5%
Units in ‘000
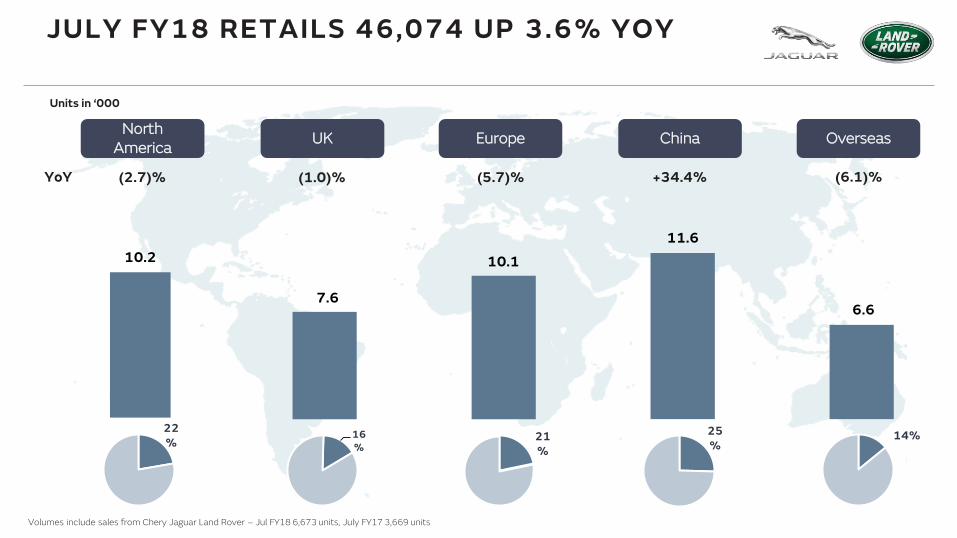
Volumes include sales from Chery Jaguar Land Rover – Jul FY18 6,673 units, July FY17 3,669 units
North America
(2.7)%
10.2
22%
UK
(1.0)%
7.6
16%
Europe
(5.7)%
10.1
21%
China
+34.4%
11.6
25%
Overseas
(6.1)%
6.6
14%
YoY
JULY FY18 RETAILS 46,074 UP 3.6% YOY
23
Units in ‘000
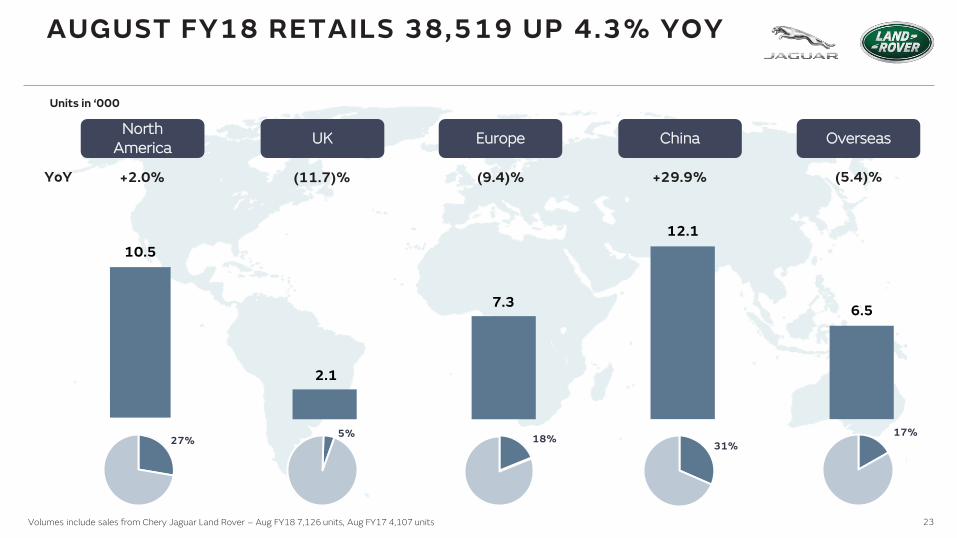
Volumes include sales from Chery Jaguar Land Rover – Aug FY18 7,126 units, Aug FY17 4,107 units
North America
+2.0%
10.5
27%
UK
(11.7)%
2.1
5%
Europe
(9.4)%
7.3
18%
China
+29.9%
12.1
31%
Overseas
(5.4)%
6.5
17%
YoY
AUGUST FY18 RETAILS 38,519 UP 4.3% YOY

24
1One-off items for the full year relate to £151m of Tianjin port recoveries in FY17 and the non-recurrence of Tianjin losses net of recoveries in FY16. One-off Items in Q1 FY18 relate to a £437m credit relating to changes made to the Company’s pension plans and £1m Tianjin recoveries, those in Q1 FY17 reflect Tianjin recoveries (£50m) and a £1m adjustment for higher net realisable value.2 EBIT margin is presented with (unadjusted) and without the pension credit (£437m) and Tianjin recoveries (£1m) in Q1 FY18.
FY17 AND Q1 FY18 FINANCIAL METRICS
Year ended 31 March Quarter ended 30 June
(£ million, unless stated) 2017 2016 Change 2017 2016 Change
Retail volumes ('000 units) (inc CJLR) 604.0 521.6 82.4 137.5 132.8 4.7
Wholesale volumes ('000 units) (exc CJLR) 534.7 509.3 25.4 117.9 120.8 (2.9)
Revenue 24,339 22,286 2,053 5,599 5,355 244
EBITDA 2,955 3,147 (192) 442 672 (230)
EBITDA Margin 12.1% 14.1% (2.0) pts 7.9% 12.5% (4.6) pts
Profit before tax and one-off items 1,459 1,714 (255) 157 348 (191)
One-off items 1 151 (157) 308 438 51 387
Profit before tax 1,610 1,557 53 595 399 196
EBIT margin 2 6.0% 7.1% (1.1) pts 1.2% 6.1% (4.9) pts
EBIT margin (unadjusted) 2 6.0% 7.1% (1.1) pts 9.0% 6.1% 2.9 pts
25
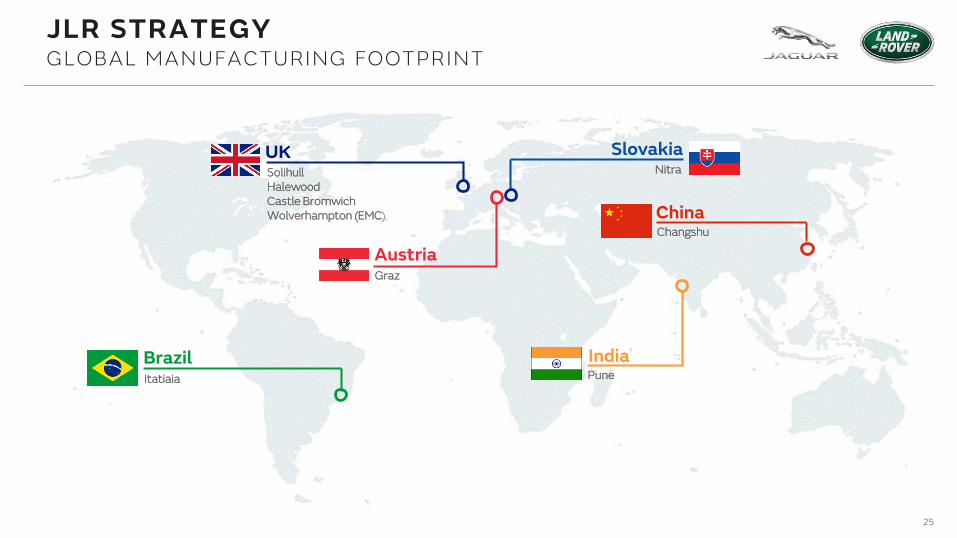
SolihullHalewoodCastle BromwichWolverhampton (EMC)
UK Slovakia
China
Nitra
Changshu
BrazilItatiaia
India
Graz
Austria
JLR STRATEGYGLOBAL MANUFACTURING FOOTPRINT
Pune