jacob holm & sons ag annual report for 2015 - … · the board of directors is responsible for...
TRANSCRIPT

Jacob Holm & Sons AGAnnual Report for 2015

Contents
Page
Auditor’s Report
Independent Auditor’s Report on Consolidated Financial Statements 2
Consolidated Financial Statements
Consolidated Income Statement 1 January - 31 December 4
Consolidated Statement of Comprehensive Income 1 January - 31 December 4
Consolidated Balance Sheet at 31 December 5
Statement of Changes in Equity, Group 1 January - 31 December 7
Consolidated Cash Flow Statement 8
Notes to the Annual Report, Group 9
Auditor’s Report
Independent Auditor’s Report on Parent Company Financial Statements 44
Parent Company Financial Statements
Parent Company Income Statement 1 January - 31 December 45
Parent Company Statement of Comprehensive Income 1 January - 31 December 45
Parent Company Balance Sheet at 31 December 46
Statement of Changes in Equity, Parent Company 1 January - 31 December 48
Parent Company Cash Flow Statement 49
Notes to the Annual Report, Parent Company 50

Report of the auditor to the Board of Directors of Jacob Holm & Sons AG Basel
Report of the auditor on the consolidated financial statementsOn your instructions, we have audited the consolidated financial statements of Jacob Holm & Sons AG, which comprise the balance sheet, income statement, statement of comprehensive income, cash flow statement, statement of changes in equity and notes, for the year ended 31 December 2015.
Board of Directors’ responsibility
The Board of Directors is responsible for the preparation and fair presentation of the consolidated financial statements in accordance with the International Financial Reporting Standards (IFRS). This responsibility includes designing, implementing and maintaining an internal control system relevant to the preparation and fair presentation of consolidated financial statements that are free from material misstatement, whether due to fraud or error. The Board of Directors is further responsible for selecting and applying appropriate accounting policies and making accounting estimates that are reasonable in the circumstances.
Auditor’s responsibility
Our responsibility is to express an opinion on these consolidated financial statements based on our audit. We conducted our audit in accordance with the International Standards on Auditing. Those standards require that we plan and perform the audit to obtain reasonable assurance whether the consolidated financial statements are free from material misstatement.
An audit involves performing procedures to obtain audit evidence about the amounts and disclosures in the consolidated financial statements. The procedures selected depend on the auditor’s judgment, including the assessment of the risks of material misstatement of the consolidated financial statements, whether due to fraud or error. In making those risk assessments, the auditor considers the internal control system relevant to the entity’s preparation and fair presentation of the consolidated financial statements in order to design audit procedures that are appropriate in the circumstances, but not for the purpose of expressing an opinion on the effectiveness of the entity’s internal control system. An audit also includes evaluating the appropriateness of the accounting policies used and the reasonableness of accounting estimates made, as well as evaluating the overall presentation of the consolidated financial statements. We believe that the audit evidence we have obtained is sufficient and appropriate to provide a basis for our audit opinion.
Opinion
In our opinion, the financial statements for the year ended 31 December 2015 comply with International Financial Reporting Standards (IFRS).
PricewaterhouseCoopers AG, St. Jakobs-Strasse 25, Postfach, CH-4002 Basel, Switzerland Telefon: +41 58 792 51 00, Telefax: +41 58 792 5110, www.pwc.ch
PricewaterhouseCoopers AG is a member of the global PricewaterhouseCoopers network of firms, each of which is a separate and independent legal entity.

PricewaterhouseCoopers AG
Thomas Bruderlin Korbinian Petzi
Audit expert Audit expert
Basel, 29 April 2016
Enclosure:
- Consolidated financial statements (balance sheet, income statement, statement of comprehensive income, cash flow statement, statement of changes in equity and notes)
3

Consolidated Income Statement 1 January - 31 December
Note 2015 2014CHF '000 CHF '000
Revenue 4 341'476 217'742
Cost of goods sold 5 -300'832 -194'980
Gross profit 40'644 22'762
Sales and marketing expenses 5 -5'332 -2'908Administrative expenses 5 -21'638 -11 '335
Operating profit 13'674 8'519
Other operating income and expenses
Profit before financial income and10 118 2
expenses and special items 13'792 8'521
Special items, net 6 -873 -7'371Financial income 11 3'957 10'940Financial expenses 12 -5'787 -7'968
Profit before tax 11'089 4'122
Tax on profit for the year 13 2'490 1'980
Net profit for the year 8'599 2'142
Consolidated Statement of Comprehensive Income 1. January - 31 December
2015 2014
Statement of Comprehensive Income 1 January - 31 December
CHF '000 CHF '000
Net profit for the year 8'599 2'142
Items that may be subsequently reclassified to p ro fit o r loss
Exchange adjustment, foreign companies -42 2'994
Comprehensive income 8'557 5'136
4

Consolidated Balance Sheet at 31 December
Assets
Note 2015 2014CHF '000 CHF '000
Goodwill 13'510 13'463Customer lists, know-how, patents, licenses and trademarks 3'941 4'413Software 6'343 152Intangible fixed assets under construction 189 667
Intangible fixed assets 14 23'983 18'695
Land and buildings 39'746 30'757Plant and machinery 108'367 58'636Other fixtures and fittings, tools and equipment 3'167 1'403Property, plant and equipment under construction 2'781 50'810
Property, plant and equipment 15 154'061 141'606
Other receivables 152 144Deferred tax asset 21 2'706 5'865
Financial fixed assets 2'858 6'009
Non-current assets 180'902 166'310
Inventories 16 30'364 30'256
Corporation tax 17 925 7Trade receivables 18 47'228 55'123Bonds at fair value through profit and loss 1'910 9'031Other receivables 18 4'327 9'938Prepayments 556 528
Receivables 54'946 74'627
Cash at bank and in hand 3'841 10'560
Current assets 89'151 115'443
Assets 270'053 281'753
5

Consolidated Balance Sheet at 31 December
Equity and liabilities
Share capital Exchange adjustments Retained earnings
Equity
BondCredit institutions Provisions for deferred tax Provisions for other staff obligations Provisions for other liabilities and charges
Non-current liabilities
Current portion of non-current liabilitiesCredit institutionsTrade payablesPayables, plant and machineryPayables to related companiesCorporation taxOther payables
Current liabilities
Liabilities
Equity and liabilities
Fee to auditors appointed at the annual general meetingContingent liabilities and other financial obligationsFinancial risksRelated partiesDevelopment costsPost balance sheet eventsBusiness Combinations
Note 2015 2014CHF '000 CHF '000
19 250 2502'952 2'994
64'660 56'061
67'862 59'305
20 74'671 79'92624 41'735 38'46321 8'244 11'35822 870 90423 990 989
126'510 131'640
24 10'329 6'40624 22'471 23'631
25'744 37'1584'123 8'579
30 14 18125 1'751 1'978
11 '249 12'875
75'681 90'808
202'191 222'448
270'053 281'753
8282930313233
6

Statement of Changes in Equity, Group 1 January - 31 December
Share capitalExchange
adjustmentsRetainedearnings Total
CHF '000 CHF '000 CHF '000 CHF '000
Equity
Equity at 1 January 2015 250 2'994 56'061 59'305Comprehensive income for the year 0 -42 8'599 8'557Dividends 0 0 0 0
Equity at 31 December 2015 250 2'952 64'660 67'862
Equity at 1 January 2014 Additions from contribution in
100 0 169 269
kindComprehensive income for the
150 0 53'750 53'900
year 0 2'994 2'142 5'136Dividends 0 0 0 0
Equity at 31 December 2014 250 2'994 56'061 59'305
7

Consolidated Cash Flow Statement
Note 2015 2014CHF '000 CHF '000
Net profit for the year 8'599 2'142Adjustments of non-cash items 26 18'062 8'050Change in working capital 27 -556 -2'922
Cash flows from operating activities before financial incomeand expenses and tax 26'105 7'270
Financial income 983 10'940Financial expenses -5'225 -7'968Corporation tax paid -3'304 -68
Cash flows from operating activities 18'559 10'174
Purchase of intangible fixed assets -6'653 -688Purchase of property, plant and equipment -31'551 -43'828Purchase of financial fixed assets -14 -1'351Sale of property, plant and equipment 54 70Purchase of bonds at fair value through profit and loss 0 -9'101Sale of bonds at fair value through profit and loss 6'150 0Acquisition of business combinations 33 498 -63'095
Cash flows from investing activities -31'516 -117'993
Change in accounts with related parties -167 96Raising of non-current loans 13'365 107'676Repayment of non-current loans -6'216 -7'337
Cash flows from financing activities 6'982 100'435
Change in cash and cash equivalents -5'975 -7'384
Cash and cash equivalents at 1 January -13'071 355Cash and cash equivalents via contribution in kind 0 -5'347Exchange adjustment of cash at bank and in hand at 1 January 416 -695
Cash and cash equivalents at 31 December -18'630 -13'071
specified as follows:
Cash at bank and in hand 3'841 10'560Credit institutions (current liabilities) -22'471 -23'631
-18'630 -13'071
8

Notes to the Annual Report, Group
1 Accounting Policies
The Annual Report of Jacob Holm & Sons AG for 2015 is prepared in accordance with International Financial Reporting Standards (IFRS).
The Annual Report for 2015 is presented in CHF ’000.
The applied accounting policies are unchanged compared to the previous year.
New standards, amendments and interpretations not yet adoptedA number of new standards and amendments to standards and interpretations are effective for annual periods beginning after 1 January 2016, and have not been applied in preparing the consolidated financial statement.
IFRS 9, ‘Financial instruments’, addresses the classification, measurement and recognition of financial assets and financial liabilities. Reduces the number of categories of financial assets to two; amortised cost and fair value. In cases where the fair value option is taken for financial liabilities, the part of a fair value change due to an entity’s own credit risk is recorded in other comprehensive income rather than the income statement. Furthermore, hedge accounting is simplified and net positions can be hedged.
IFRS 15, ‘Revenue from contracts with customers’ deals with revenue recognition and establishes principles for reporting useful information to users of financial statements about the nature, amount, timing and uncertainty of revenue and cash flows arising from an entity’s contracts with customers. Revenue is recognised when a customer obtains control of a good or service and thus has the ability to direct the use and obtain the benefits from the good or service. The standard replaces IAS 18 ‘Revenue’ and IAS 11 ‘Construction contracts’ and related interpretations. The standard is effective for annual periods beginning on or after 1 January 2017 and earlier application is permitted. The group is assessing the impact of IFRS 15.
IFRS 16, “Leases”, which amends the rules for the lessee’s accounting treatment of operating leases. In future, operating leases must therefore be recognised in the balance sheet as lease assets and similar lease liabilities. The standard has not yet been adopted by the EU and will become effective for financial years beginning on or after 1 January 2019. The Group expects to implement the standard when it becomes effective. The Group is in the process of examining the effect of the standard, which cannot yet be calculated.
The IASB has approved further new standards and interpretations that are not relevant to Jacob Holm & Sons AG and will have no effect on the Financial Statements.
Consolidated Financial Statements
The Consolidated Financial Statements comprise the Parent Company Jacob Holm & Sons AG and its subsidiaries. Subsidiaries are all entities over which the group has control. The group controls an entity when the group is exposed to, or has rights to, variable returns from its involvement with the entity and has the ability to affect those returns through its power to direct the activities of the entity.
Subsidiaries are fully consolidated from the date on which control is transferred to the group. They are deconsolidated from the date that control ceases.
9

1 Accounting Policies (continued)
Notes to the Annual Report, Group
The Consolidated Financial Statements are prepared on the basis of the Financial Statements of the Parent Company and the group companies by combining items of a uniform nature, and elimination is made of intercompany income and expenses, intercompany accounts as well as profits and losses on transactions between the consolidated companies. The results of foreign group companies are translated into Swiss Franc at average exchange rates. The balance sheets are translated into Swiss Franc at the exchange rates at the balance sheet date. Exchange adjustments in this connection are made over the statement of comprehensive income.
Business combinations
On acquisition of subsidiaries including acquisition of subsidiaries under common control, the acquisition method is applied.
Purchase price of acquired assets, liabilities and contingent liabilities are initially measured at fair value at the time of acquisition. Identifiable intangible fixed assets are recognised if they can be separated and the fair value can be measured reliably. Deferred tax is recognised on re-measurements made. Any remaining positive differences between the cost and the fair value of assets, liabilities and contingent liabilities acquired are recognised in intangible fixed assets in the balance sheet as goodwill. Goodwill is not amortised, but is tested for impairment on an annual basis.
Foreign currencies
Items included in the financial statements of each of the group’s entities are measured using the currency of the primary economic environment in which the entity operates (‘the functional currency’). The consolidated financial statements are presented in Swiss Franc which is the parent company’s functional and presentation currency.
Transactions in foreign currencies are initially recognised at the exchange rates at the dates of transaction. Exchange differences arising due to differences between the transaction date rates and the rates at the dates of payment are recognised in financial income and expenses in the income statement.
Receivables, payables and other monetary items in foreign currencies are translated at the exchange rates at the balance sheet date. Differences between the exchange rates at the balance sheet date and the rates at the time of the establishment of the receivable or payable or recognition in the most recent Financial Statements are recognised in financial income and expenses in the income statement.
Balance sheet items including goodwill for consolidated companies that do not have Swiss France as their functional currency are translated into Swiss Franc at the exchange rates at the balance sheet date, whereas the income statements of these companies are translated at average exchange rates for the month. Exchange adjustments arising on the translation of the opening equity at year- end rates and net profit for the year at year-end rates are recognised directly in equity under a separate reserve for exchange adjustments.
10

1 Accounting Policies (continued)
Income Statement
Revenue and recognition of income
Revenue from sale of goods is measured at fair value of the consideration received net of goods sold excluding VAT and net of provisions for returns, discounts, etc.
Revenue from the sale of goods is recognised when the amount of revenue can be reliably measured, it is probable that future economic benefits will flow to the entity and specific criteria have been met for each of the group’s activities. In general the recognition of revenue is done when the goods are delivered in accordance with the agreed upon contractual terms.
Cost of goods sold
Cost of goods sold comprises costs incurred to achieve revenue for the year. Cost comprises raw materials, consumables, direct labour costs and indirect production costs such as maintenance and depreciation, etc, as well as operation, administration and management of factories and distribution expenses including salaries to distribution staff.
Cost of goods sold also includes research and development costs that do not qualify for capitalisation as well as amortisation of capitalised development costs.
Sales and marketing expenses
Sales and marketing expenses comprise costs in the form of salaries to sales staff, advertising and marketing expenses as well as operation of motor vehicles, depreciation, etc.
Administrative expenses
Administrative expenses comprise expenses for Management, administrative staff, office expenses, depreciation, etc.
Other operating income and expenses
Other operating income and other operating expenses comprise items of a secondary nature to the core activities of the companies, including gains and losses on disposals of intangible fixed assets and property, plant and equipment as well as subsidies received which do not directly relate to the purchase of non-current assets.
Special items
Special items comprise income and expenses outside normal operations which are at the same time non-recurring income and expenses. Special items comprise income and expense arising from events and transactions such as due diligence re. potential acquisitions, integration costs and larger restructuring or organisational changes.
Notes to the Annual Report, Group
11

1 Accounting Policies (continued)
Notes to the Annual Report, Group
Financial income and expenses
Financial income and expenses comprise interest, financial expenses in respect of finance leases, realised and unrealised exchange adjustments, price adjustment of securities and amortisation of financial assets and liabilities.
Financial expenses directly attributable to purchases, construction or production of a qualifying asset are included as part of the expenses relating to the asset. All other financial expenses are recognised in expenses in the financial year in which they were incurred.
A qualifying asset is an asset for which considerable time is required to make it ready for its intended use or for sale.
Tax on profit for the year
Tax for the year consists of current tax for the year and deferred tax for the year. The tax attributable to the profit for the year is recognised in the income statement, whereas the tax attributable to items recognised in other comprehensive income is recognised in other comprehensive income and tax attributable to equity transactions is recognised directly in equity.
Any changes in deferred tax due to changes to tax rates are recognised in the income statement.
12

1 Accounting Policies (continued)
Balance Sheet
Intangible fixed assets
Goodwill represents the excess of the cost of an acquisition over the fair value of identifiable net assets of the acquired enterprise. Goodwill is measured at historical cost less accumulated impairment losses. Goodwill is not amortised. The carrying amount of goodwill is allocated to the Group’s operating segments. The allocation is completed no later than at the end of the reporting period following the acquisition.
Goodwill is tested for impairment annually or on indication of impairment In the event of impairment, the carrying amount is written down to the value in use. Impairment charges on goodwill are not reversed.
Customer lists, know-how, patents and licenses, trademarks and software are measured at cost less accumulated amortisation. Amortisation is made on a straight-line basis over the expected useful life, which are;
Customer lists, know-how, patents and licenses 3-10 years
Trademarks 20 years
Software 3-5 years
Property, plant and equipment
Property, plant and equipment are recognised at cost less accumulated depreciation and less any accumulated impairment losses.
Cost comprises the purchase price and costs which are directly attributable to the acquisition up until the time when the asset is ready for use. In the case of assets of own construction, cost comprises directly attributable costs for labour, materials, components and sub-suppliers. The cost price of new product lines comprise costs related to the commissioning of the production line up until the point in time where the production line is ready for commercial production. Commissioning costs comprise costs such as test runs and repair and maintenance activities.
The initial estimate of the costs of dismantling assets for which there is a legal obligation to dismantle at the end of the useful life of the asset is included as part of the cost price of the asset.
Income from the sale of products during the commissioning period is set off against the cost of the asset.
Government grants received are set off against the cost of assets qualifying for the subsidy.
Depreciation based on cost reduced by any residual value is calculated on a straight-line basis over the expected useful lives of the assets, which are:
Buildings 30-50 years
Notes to the Annual Report, Group
13

1 Accounting Policies (continued)
Plant and machinery 10-15 years
Other fixtures and fittings, tools and equipment 3-10 years
Spare parts included in plant and machinery are depreciated over 5 years.
Gains or losses from the sale of property, plant and equipment are calculated as the difference between the selling price net of selling expenses and the carrying amount at the time of the sale. Gains or losses from current replacement of property, plant and equipment are recognised in other operating income and expenses in the income statement.
Impairment of fixed assets
The carrying amounts of intangible assets and property, plant and equipment are reviewed on an annual basis to determine whether there is any indication of impairment other than that expressed by amortisation and depreciation. If so, an impairment test is carried out to determine whether the recoverable amount is lower than the carrying amount, and the asset is written down to its lower recoverable amount.
The asset is written down to its recoverable amount if this is lower than the carrying amount. The recoverable amount of the asset is calculated as the higher of net selling price and value in use. Where a recoverable amount cannot be determined for the individual asset, the assets are assessed in the smallest group of assets for which a reliable recoverable amount can be determined based on a total assessment.
Impairment losses are reversed to the extent that changes have taken place in the assumptions or estimates leading to the write-down for impairment. Impairment losses are only reversed to the extent that the new carrying amount of the asset does not exceed the carrying amount which the asset would have had, had it not been written down for impairment. Impairment on goodwill is not reversed.
Financial fixed assets
Other receivables
Receivables are non-derivative financial assets with fixed or determinable payments that are not quoted in an active market. They are included in current assets, except for maturities greater than 12 months after the end of the reporting period. These are classified as non-current assets.
Notes to the Annual Report, Group
Bonds at fair value through profit or loss
Bonds at fair value through profit or loss are financial assets held for trading. Bonds are classified in this category if acquired principally for the purpose of selling in the short term.
14

1 Accounting Policies (continued)
Inventories
Inventories are measured at the lower of cost under the FIFO method and net realisable value. The net realisable value of inventories is calculated at the amount expected to be generated by sale in the process of normal operations with deduction of selling expenses and costs of completion. The net realisable value is determined allowing for marketability, obsolescence and development in expected sales sum.
The cost of goods for resale, raw materials and consumables equals landed cost.
The cost of finished goods and work in progress comprises the cost of raw materials, consumables and direct labour as well as directly attributable labour and production costs. These costs also comprise maintenance and depreciation of the machinery, factory buildings and equipment used in the manufacturing process as well as costs of production management.
Receivables
Receivables are measured in the balance sheet at the lower of amortised cost and net realisable value, which corresponds to nominal value less provisions for bad debts. Provisions for bad debts are determined on the basis of an individual assessment of each receivable.
Dividend
Dividend is recognised as a liability at the time of adoption at the Annual General Meeting. Dividend expected to be paid for the year is disclosed as a separate equity item.
Corporation tax and deferred tax
Current tax liabilities and receivables are recognised in the balance sheet as tax calculated on the taxable income for the year adjusted for tax on taxable income for prior years and for taxes paid on account.
Deferred tax is measured according to the balance-sheet liability method in respect of all temporary differences between the carrying amount and the tax base of assets and liabilities.
However, deferred tax is not recognised in respect of temporary differences concerning goodwill not deductible for tax purposes and other items where temporary differences - apart from business acquisitions - have arisen at the time of acquisition without affecting the profit for the year or the taxable income. In cases where the computation of the tax base may be made according to alternative tax rules, deferred tax is measured on the basis of the intended use of the asset and settlement of the liability, respectively.
Deferred tax assets, including the tax base of tax loss carry-forwards, are recognised at the value at which they are expected to be utilised, either by elimination in tax on future earnings or by set-off against deferred tax liabilities within the same legal tax entity and jurisdiction.
Deferred tax is measured on the basis of the tax rules and tax rates in the respective countries that will be effective under the legislation at the balance sheet date when the deferred tax is expected to crystallise as current tax. Any changes in deferred tax due to changes to tax rates are recognised in the income statement unless the deferred tax relates to equity entries.
Notes to the Annual Report, Group
15

1 Accounting Policies (continued)
Staff obligations
Wages and salaries, social security contributions, paid absence and sickness absence, bonuses and non-monetary contributions are recognised in the financial year in which the Group’s employees have performed the related work. Expenses relating to the Group’s long-term staff benefits are accrued so that they follow the performance of work by the employees concerned.
The Group’s pension schemes comprise defined contribution plans.
Moreover, provisions are made for seniority based bonuses earned over the employment period.
Notes to the Annual Report, Group
Provisions
Provisions are recognised when - as a result of an event occurred before or on the balance sheet date - the Company has a legal or constructive obligation and it is probable that economic benefits must be given up to settle the obligation. Provisions comprise mainly dismantling cost related to assets held on leased land.
Provisions are measured at Management’s best estimate of the amount at which the liability is expected to be settled. At the measurement of provisions, discounting is made of the expenses necessary to settle the liability if this has a material effect on the measurement of the liability.
Financial liabilities
Mortgage credit loans and loans from credit institutions are initially recognised at fair value net of transaction expenses incurred.
Any difference between the proceeds (net of transaction costs) and the redemption amount is recognised in profit or loss over the period of the borrowings using the effective interest method
Non-closely related embedded derivatives such as certain prepayment options are separated from the host liability contract and accounted for as stand-alone derivative financial instruments.
Other liabilities comprising trade payables and other liabilities are also measured at amortised cost.
Cash Flow Statement
The cash flow statement shows cash flows for the year broken down by operating, investing and financing activities, changes for the year in cash and cash equivalents as well as cash and cash equivalents at the beginning and end of the year.
Cash flows from operating activities
Cash flows from operating activities are calculated as the net profit for the year adjusted for noncash operating items, changes in working capital, financial income/expenses and corporation tax paid.
16

1 Accounting Policies (continued)
Cash flows from investing activities
Cash flows from investing activities comprise cash flows from acquisitions and disposals of intangible fixed assets, property, plant and equipment as well as financial fixed asset investments.
Cash flows from financing activities
Cash flows from financing activities comprise cash flows from the raising and repayment of noncurrent liabilities as well as payments to and from shareholders.
Cash and cash equivalents
Cash and cash equivalents comprise the item "Cash at bank and in hand" under current assets net of current credits with banks that constitute an integrated part of the Group’s current cash management.
The cash flow statement cannot be immediately derived from the information provided in these financial statements.
Notes to the Annual Report, Group
Segment information
Operating segments are reported in a manner consistent with the internal reporting to the chief operating decision-maker. The chief operating decision-maker has been identified as the Board of Directors. The operating segments have been determined based on the financial reports reviewed by the Board of Directors.
The accounting policies of the reportable segments are the same as the Group’s accounting policies described above.
Net profit is the measurement reported to the Board of Directors for the purposes of resource allocation and assessment of segment performance.
In presenting information on the basis of geographical markets the information is based on the geographical location of the enterprises in each segment.
Accounting policies relevant only for the parent company
Investments in subsidiaries and associates
Investments in subsidiaries and associates are measured at cost in the Parent Company Financial Statements.
Impairment tests are performed on subsidiaries if events or changes in circumstances indicate that their carrying amount may not be recoverable. Where cost exceeds the recoverable amount, the carrying amount is written down to the recoverable amount.
17

2 Significant accounting estimates
Estimates and judgements are continually evaluated and are based on historical experience and other factors, including expectations of future events that Management believes are reasonable under the circumstances.
The Group makes estimates and assumptions concerning the future. The resulting accounting estimates will, by nature, seldom equal the actual outcome. The estimates and assumptions that have a significant risk of resulting in a material adjustment to the carrying amounts of assets within the next financial year are discussed below.
Deferred tax asset
The French plant has improved the product mix as well as production efficiency by upgrading the production lines. Further, the organisation has been changed to reflect the changing demands. On this basis, the Group has evaluated the amount which can be utilised over the next 5 years. The Group has recognised a deferred tax asset of approx. CHF 3m primarily relating to a tax loss carry-forward in France.
Impairment Goodwill
Goodwill is not amortised but is subject to an annual impairment test. In Management's view, the assumptions applied reflect the market conditions existing as of 31 December 2015. The impairment test is a complex process that requires significant Management judgement in determining various assumptions, such as cash-flow projections, discount rates and terminal growth rates. The use of different estimates or assumptions when determining the fair value of such assets may result in different values and could result in impairment charges in future periods. The assumptions for significant goodwill amounts are set out in note 14.
Notes to the Annual Report, Group
3 Segment information
The Jacob Holm Industries segment produces and sells non-woven roll-goods.
The Sontara segment produces and sells non-woven in converted and roll-goods form.
The TWIG segment sells non-woven by-products.
The Headquarter segment consists of the Danish and Swiss holding and management companies Jacob Holm & Sønner Holding A/S, Jacob Holm & Sønner A/S and Jacob Holm & Sons AG.
No operating segments have been aggregated.
18

3 Segment information (continued)
Notes to the Annual Report, Group
2015
J a c o b Holm
In d u s tr ie s S o n ta ra TW IG H e a d q u a rte r E lim in a tio n s G ro u p
In c o m e s ta te m e n t CHF '000 CH F '000 CH F '000 CHF '000 CHF '000 CH F '000
Revenue
In ter-segm ent revenue 833 0 0 5'933 -6'766 0
E xternal revenue 143'561 195'014 2'573 328 0 341'476
EBITDA 6'082 22'094 741 -901 -519 27'497
Depreciation, am ortization and im pairm ent losses 8'132 5'286 14 298 0 13'730
Special items 0 378 0 495 0 873
Financial incom e 497 8 15 7'932 -4'495 3'957
Financial expenses -1'436 -3'400 -16 -5'430 4 '495 -5'787
Incom e tax incom e/expense 2'379 2'273 81 -2'116 -127 2'490
Profit or loss
B a la n ce s h e e t
-5 '344 10'764 645 2'926 -392 8'599
N on-current assets- including investm ent in property, p lan t an d equipm ent 132'845 44'710 43 315'063 -311 '759 180'902A dditions to non-current assets 23'233 10'482 2 1'204 0 34'921
Current assets 33'269 70'796 1'404 8'539 -24 '857 89'151
Total assets 166'114 115'506 1'447 323'602 -336 '616 270'053
N on-current liabilities 60'733 27'237 0 78'703 -40 '163 126'510
Current liabilities 48'178 44'194 592 7'575 -24 '858 75'681
Total Liabilities 108'911 71'431 592 86'278 -65'021 202'191
2014
J a c o b Holm
In d u s tr ie s S o n ta ra TW IG H e a d q u a rte r E lim in a tio n s G ro u p
In c o m e s ta te m e n t CHF '000 CH F '000 CH F '000 CHF '000 CHF '000 CH F '000
Revenue
In ter-segm ent revenue 688 0 0 3'748 -4'436 0
E xternal revenue 150'407 64'938 2'397 0 0 217'742
EBITDA 10'047 7'989 700 -842 587 18'481
Depreciation, am ortization and im pairm ent losses 8'362 1'363 5 143 0 9'873
Special items 0 6'022 74 1'275 0 7'371
Financial incom e 410 0 14 13'404 -2'888 10'940
Financial expenses 1'333 3'382 3 6'138 -2'888 7'968
Incom e tax incom e/expense 160 -54 82 1'648 144 1'980
Profit or loss
B a la n ce s h e e t
507 -2'724 550 3'366 443 2'142
N on-current assets- including investm ent in property, p lan t an d equipm ent 122'989 40'155 57 282'309 -279 '200 166'310A dditions to non-current assets 48'965 2'779 23 401 0 52'168
Current assets 35'252 112'945 1'573 65'468 -99 '795 115'443
Total assets 158'241 153'100 1'630 347'777 -378 '995 281'753
N on-current liabilities 50'547 33'717 0 91'196 -43 '820 131'640
Current liabilities 49'936 87'500 666 9'122 -56 '416 90'808
Total Liabilities 100'483 121'217 666 100'318 -100 '236 222'448
Performance of the operating segments and decisions about resources to be allocated are made on the basis of EBITDA.
19

Notes to the Annual Report, Group
3
4
5
S e g m e n t in f o r m a t io n (continued)
Geographic allocation
2015 CHF '000
2014 CHF '000
RevenueSwitzerland 724 101EU 87'926 69'077USA/Canada 178'598 102'513APAC 57'769 31'353Other 16'459 14'698
Total revenue 341'476 217'742
Non-current assets other than deferred tax assets, by areaSwitzerland 21'511 19'246EU 26'651 28'382USA/Canada 127'024 112'796APAC 17 17Other 22 5
Total non-current assets other than deferred tax assets 175'225 160'446
R e ve n u e
Sale of goods 341'148 217'742Royalties 328 0
341'476 217'742
E xp e n se s c la s s if ie d b y ty p e
Production costs 285'182 185'096Distribution costs 15'650 9'884
Cost of goods sold 300'832 194'980Sales and marketing expenses 5'332 2'908Administrative expenses 21'638 11'335Other income and expenses -118 -2Special items, net 873 7'371
328'557 216'592
Classified by type as follows:Expenses for raw materials and consumables 190'726 125'474Other external expenses 77'281 55'475Staff expenses 46'820 25'770Depreciation and amortisation 13'730 9'873
328'557 216'592
20

2015 2014CHF '000 CHF '000
6 Special items, net
Special items, costs:
Due diligence costs regarding acquisitions of business 0 3'128Integration costs regarding acquired businesses 873 4'012Restructuring projects 0 231
873 7'371
Special items, are all external expenses.
7 Staff expenses
Staff expenses are included in the Group's production costs, distribution costs, sales and marketing and administrative expenses as follows:
Wages and salaries 35'143 19'632Pensions defined contribution plans 2'161 996Other social security expenses 9'516 5'142
46'820 25'770
Notes to the Annual Report, Group
Average number of full-time employees 568 331
Staff expenses are distributed on the individual cost groups as follows:
Cost of goods sold 34'121 19'010Sales and marketing expenses 3'276 1'625Administrative expenses 9'423 5'135
46'820 25'770
21
Notes to the Annual Report, Group
8
9
2015 2014CHF '000 CHF '000
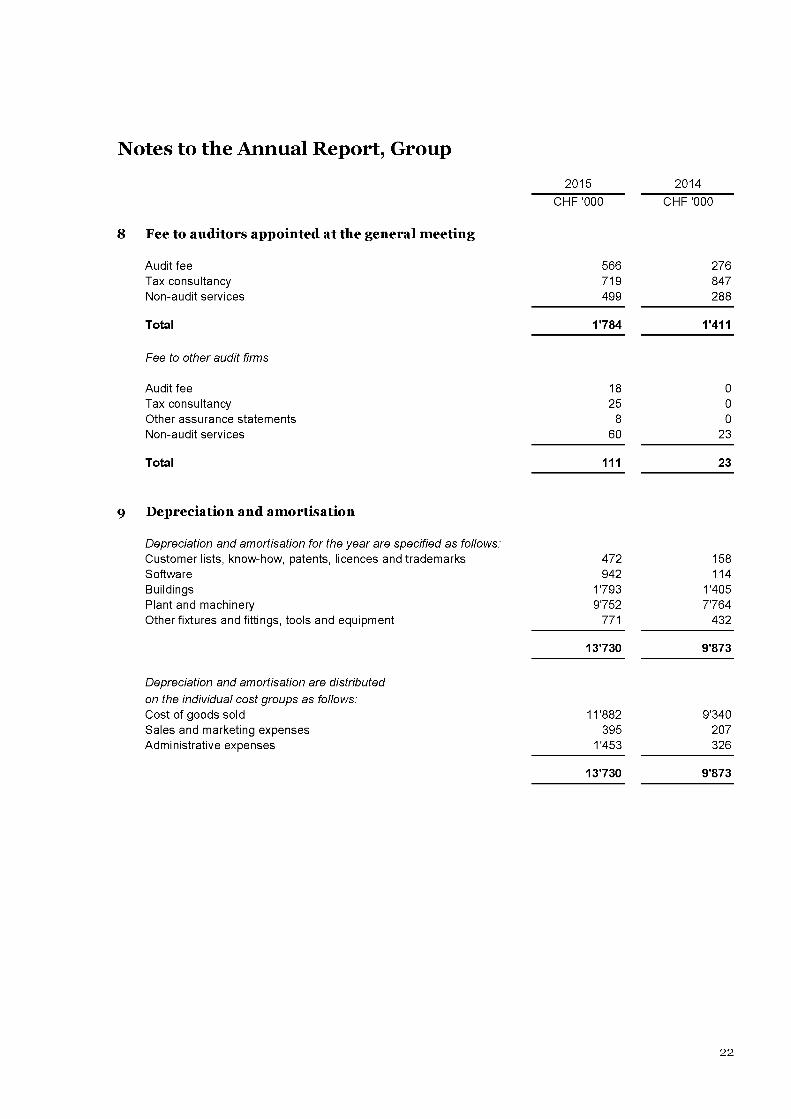
Fee to auditors appointed at the general meeting
Audit fee 566 276Tax consultancy 719 847Non-audit services 499 288
Total 1'784 1'411
Fee to other audit firms
Audit fee 18 0Tax consultancy 25 0Other assurance statements 8 0Non-audit services 60 23
Total
Depreciation and amortisation
111 23
Depreciation and amortisation for the year are specified as follows:Customer lists, know-how, patents, licences and trademarks 472 158Software 942 114Buildings 1'793 1'405Plant and machinery 9'752 7'764Other fixtures and fittings, tools and equipment 771 432
Depreciation and amortisation are distributed on the individual cost groups as follows:
13'730 9'873
Cost of goods sold 11'882 9'340Sales and marketing expenses 395 207Administrative expenses 1'453 326
13'730 9'873
22

Notes to the Annual Report, Group
10
11
12
2015 2014
Other operating income and expenses
CHF '000 CHF '000
Other operating income:Subsidies 13 17Gains on disposals of non-current assets 25 9Management fee 94 79Other 23 5
155 110
Other operating expenses:Loss on disposals of non-current assets -37 -59Other 0 -49
-37 -108
118 2
Financial income
Interest 200 716Exchange adjustments 3'639 10'224Other 118 0
3'957 10'940
Interest and exchange adjustments relate to loans granted and receivables measured at amortised cost.
Financial expenses
Interest 4'544 5'675Exchange adjustments 927 2'293Other 316 0
5'787 7'968
Interest and exchange adjustments relate to loans received and payables measured at amortised cost.
23

Notes to the Annual Report, Group
13
2015 2014CHF '000 CHF '000
Tax on profit for the year
Current tax on profit for the year 2'831 1'880Change in deferred tax 224 111Change in tax previous years -565 -11
2'490 1'980
Tax on profit for the year is specified as follows:
Calculated 11% tax on profit for the year before tax 1'683 453
Tax effect of:
Higher/lower tax rate in foreign companies 103 1'318Tax on non-deductible expenses and non-taxable income -651 106Adjustment of valuation deferred tax 1'920 114Adjustment of tax previous years -565 -11
2'490 1'980
Effective tax rate for the year 22.45% 48.03%
24

Notes to the Annual Report, Group
Customer lists, know- Intangible fixedhow, patents, licenses assets under
Goodwill and trademarks Software constructionCHF '000 CHF '000 CHF '000 CHF '000
14 Intangible fixed assets
2015
Cost at 1 January 13'463 4'583 2'845 667Exchange adjustment at year-end rate Additions from business
0 -1 -50 0
combination 47 0 0 0Additions for the year 0 0 6'549 59Transfer between items 0 0 537 -537Disposals for the year 0 0 0 0
Cost at 31 December 13'510 4'582 9'881 189
Amortisation at 1 January 0 170 2'693 0Exchange adjustment at year-end rate 0 -1 -97 0Amortisation for the year 0 472 942 0
Amortisation at 31 December 0 641 3'538 0
Carrying amount at 31 December 13'510 3'941 6'343 189
Amortised over 10 years 3-5 years
25

Notes to the Annual Report, Group
Customer lists, know- Intangible fixedhow, patents, licenses assets under
Goodwill and trademarks Software constructionCHF '000 CHF '000 CHF '000 CHF '000
14 Intangible fixed assets (continued)
2014
Cost at 1 January 0 0 0 122Exchange adjustment at year-end rate Additions from business
0 0 155 0
combination 13'463 4'571 0 0Additions from contribution in kind 0 12 2'549 0Additions for the year 0 0 141 545
Cost at 31 December 13'463 4'583 2'845 667
Amortisation at 1 January 0 0 0 0Exchange adjustment at year-end rateAdditions from contribution
0 0 154 0
in kind 0 12 2'425 0Amortisation for the year 0 158 114 0
Amortisation at 31 December 0 170 2'693 0
Carrying amount at 31 December 13'463 4'413 152 667
Amortised over 10 years 3-5 years
The Group has performed impairment test of Goodwill per 31 December 2015. Goodwill was recognised in April 2014 as part of the acquisition of the TWIG Group as well as a subsequent acquisition of Sontara Argentina in 2015.
The Group has performed the impairment test on the basis of overall valuation of the TWIG Group. The conclusion was that there was no need for impairment.
The valuation of the TWIG Group was prepared on basis of the approved budget for 2016 and calculated as a value in use with a terminal growth of 0% and a pre-tax WACC of 5,7%.
At year-end Management has assessed that the key assumption used to determinate value in use of the TWIG Group is the available volume of by-products to this Group. The 2016 budget includes a conservative level of volume. As a result of this, cash-flow used to determine the fair value is at a conservative level which is explaining why the WACC includes no risk-premium.
Based on the conservative cash-flow, it is assumed that reasonable possible changes in key assumptions are not expected to cause a change in the need for impairment.
26

Notes to the Annual Report, Group
15
Land and buildings
Plant and machinery
Other fixtures and fittings, tools and
equipment
Property, plant and equip
ment under construction
CHF '000
Property, plant and equipment
CHF '000 CHF '000 CHF '000
2015
Cost at 1 January Exchange adjustment
46'253 132'552 6'731 50'810
at year-end rate Additions from business combinationAdditions from contribution in kind
-2'133 -5'943 -366 -46
Additions for the year 110 4'606 1'832 21'248Transfer between items 11'932 56'521 778 -69'231Disposals for the year -8 -224 -448 0
Cost at 31 December 56'154 187'512 8'527 2'781
Depreciation at 1 January Exchange adjustment
15'496 73'916 5'328 0
at year-end rate Additions from contribution in kindDepreciation and
-875 -4'352 -303 0
impairment losses for the year 1'793 9'752 771 0Disposals for the year -6 -171 -436 0
Depreciation at 31 December 16'408 79'145 5'360 0
Carrying amountat 31 December 39'746 108'367 3'167 2'781
Depreciated over 30-50 years 5-15 years 3-10 years
The carrying amount of buildings at 31 December 2015 includes interest of CHF 1.139k.
The carrying amount of plant and machinery at 31 December 2015 includes interest of CHF 2.664k.
During the year, the Group has capitalised borrowing costs amounting to CHF 2.048k on qualifying assets. The average interest rate applied was 3.87% p.a.
27

Notes to the Annual Report, Group
15
Other fixtures Property, plantand fittings, and equip-
Land and Plant and tools and ment underbuildings machinery equipment constructionCHF '000 CHF '000 CHF '000 CHF '000
Property, plant and equipment(continued)
2014
Cost at 1 January 0 0 845 0Exchange adjustment at year-end rate Additions from business
1'994 3'840 127 835
combination 6'470 16'647 1 0Additions from contribution in kind 37'183 100'617 5'230 8'146Additions for the year 606 11'603 815 51'941Disposals for the year 0 -155 -287 -10'112
Cost at 31 December 46'253 132'552 6'731 50'810
Depreciation at 1 January Exchange adjustment
0 0 642 0
at year-end rate Additions from contribution
450 1'841 108 0
in kind 13'641 64'389 4'385 0Depreciation and impairment losses for the year 1'405 7'764 432 0Disposals for the year 0 -78 -239 0
Depreciation at 31 December 15'496 73'916 5'328 0
Carrying amount at 31 December 30'757 58'636 1'403 50'810
Depreciated over 30-50 years 5-15 years 3-10 years
The carrying amount of buildings at 31 December 2014 includes interest of CHF 587k.
The carrying amount of plant and machinery at 31 December 2014 includes interest of CHF 434k.
During the year, the Group has capitalised borrowing costs amounting to CHF 816k on qualifying assets. The average interest rate applied was 4.78% p.a.
28

Notes to the Annual Report, Group
2015 2014CHF '000 CHF '000
16 Inventories
Raw materials and consumables 9'064 7'419Finished goods 21'300 22'837
30'364 30'256
Raw materials and consumables expensed for the year 190'726 206'095
Inventories expected to be sold after more than 1 year amount to 0 0
Write-down on inventories for the year amounts to 3'679 497
Reversed write-down on inventories for the year amounts to 705 302
Subsequent sales have shown that there was no need for the write-down.
17 Corporation tax
Corporation tax receivable at 1 January Exchange adjustment at year-end rate Tax on operating profit, see note 13 Tax refunded/paid
Corporation tax receivable at 31 December
18 Receivables
Trade receivables Bad debt provision
Trade receivables, net Other receivables
Bad debt provision
Bad debt provision at 1 January Exchange adjustment at year-end rate Additions for the year Disposals for the year:- Applied- Reversed
Bad debt provision at 31 December
7 0-35 0
-586 01'539 7
925 7
47'241 55'382-13 -259
47'228 55'1234'327 9'938
51'555 65'061
259 0-1 06 259
-85 0-166 0
13 259
29

Notes to the Annual Report, Group
19 Share capital
Share capital has developed as follows:
1 JanuaryIncrease via contribution in kind
31 December
2015 2014CHF '000 CHF '000
250 1000 150
250 250
20 Bond
The Group Company Jacob Holm & Sønner Holding A/S has issued a series of bonds in the amount of SEK 650m in 2014. The Bonds were listed on the Oslo Børs on March 10, 2016.
The interest coupon on the par value of the Bonds payable from and including, the issue date is three months STIBOR plus a margin of 5,25 %.
The Bond matures in full on 3 April 2019. The Company may redeem the bond issue in whole or in part at any time. The redemption price is:
From the issue date to April 2016 the present value is par value and remaining interest payments discounted at 50 basis point over the comparable Swedish Government bonds.April 2016 to April 2017 104 % of par valueApril 2018 to final maturity 102 % of par value
The holders cannot call the bond unless the covenants set out in the bond agreement are not complied with. The Bond is subject to three covenants:- Debt/EBITDA ratio- Interest coverage ratio- Minimum liquidity
30

Notes to the Annual Report, Group
2015 2014CHF '000 CHF '000
21 Deferred tax
Deferred tax at 1 January 5'493 0Exchange adjustment at year-end rate -159 465Additions from business combination -20 0Additions from contribution in kind 0 4'917Change in deferred tax, see note 13 224 111
Deferred tax at 31 December 5'538 5'493
Deferred tax relates to:
Inventories -372 -579Other current assets 180 53Other liabilities -380 -119
Current part -572 -645
Intangible assets -1'174 0Property, plant and equipment 8'599 8'978Other liabilities -484 -105Tax loss carry-forward -4'933 -9'959Retaxation relating to utilised losses in foreign subsidiary 4'102 7'224
Non-current part 6'110 6'138
Deferred tax, net 5'538 5'493
which breaks down as follows:
Deferred tax asset -2'706 -5'865Provisions for deferred tax liability 8'244 11'358
5'538 5'493
Unrecognized deferred tax asset 3'604 0
The Group's recognised tax loss is subject to varying conditions and is expected fully utilised for set-off against positive taxable income within a 5 year period.
One of the entities to which the tax loss carry-forward relates to, realised a tax loss for assessment year 2015. Management has prepared detailed forecasts for the coming financial years for the entity in question and has reassessed the expected time frame for utilisation of the tax loss carry-forward. It is Management's assessment that the taxable income will increase in the coming financial years due to increasing earnings.
Management has chosen to derecognise the part of the tax loss carry-forward which relates to the period after 5 years as there is some uncertainty as to the timing of utilizing the tax loss carry-forward.
31

2 2 O th e r s ta f f o b l ig a t io n s
The Group offers part of the employees to participate in pension schemes in the form of defined contribution plans.
The provision for other staff obligations primarily includes seniority based bonuses for employees calculated by an actuary taking into account the expected turnover among employees, wage increases etc. A discount factor of 2,03% has been used against 1,80% in 2014.
As the obligation is uncertain as regards the time of settlement, no breakdown of time of maturity can be made. The entire obligation has therefore been classified as a non-current liability.
Notes to the Annual Report, Group
23
24
2015 2014CHF '000 CHF '000
Balance at 1 January 904 0Exchange adjustment at year-end rate -90 -15Additions from contribution in kind 0 802Disposals for the year -2 -98Discount effect -22 103Additions for the year 80 112
Balance at 31 December 870 904
P ro v is io n s f o r o th e r l ia b i l i t ie s a n d c h a rg e s
The liability relates to an estimated liability regarding dismantling of assets held on leased land.
Balance at 1 January 989 0Exchange adjustment at year-end rate 1 33Additions for the year 0 956
Balance at 31 December 990 989
C re d it in s t i t u t io n s
Payment due later than 5 years 0 0Payment due 1-5 years 41'735 38'463
Non-current credit institutions 41'735 38'463
Payment due within 1 year 32'800 30'037
74'535 68'500
Credit institutions primarily includes term loans granted to the Plant in Asheville, NC with a total of CHF 51m of which CHF 41m is due between 1-5 years. These term loans are USD denominated and with variable interest.
32

Notes to the Annual Report, Group
2015 2014CHF '000 CHF '000
24 Credit institutions (continued)
The covenants comprise measurements on specific financial ratios, including solvency, EBITDA in relation to fixed charges (interest, instalments, income tax, dividend and capital expenditure) and the cover of revolving credit by working capital.
25 Corporation tax
Accrued corporation tax at 1 January 1'978 35Addition from acquisition of subsidiaries 0 141Exchange adjustment at year-end rate -130 -6Tax on operating profit, see note 13 2'245 1'869Adjustment of tax previous years -565 0Tax paid -1'777 -61
Accrued corporation tax at 31 December 1'751 1'978
26 Cash flow statement - adjustments non-cash items
Financial income -3'957 -10'940Financial expensesDepreciation, amortisation and impairment losses, including
5'787 7'968
losses and gains on disposals of intangible fixed assets and property, plant and equipment
13'742 9'923
Tax on profit for the year 2'490 1'980Exchange gain/loss on intercompany accounts 0 -881
18'062 8'050
27 Cash flow statement - change in working capital
Change in inventories -331 -2'457Change in receivables 12'131 -29'487Change in other provisions 56 92Change in payables -12'412 28'930
-556 -2'922
33

Notes to the Annual Report, Group
2015 2014CHF '000 CHF '000
2 8 C o n t in g e n t l ia b i l i t ie s a n d o th e r f in a n c ia l o b l ig a t io n s
Mortgages
As security for credit institution, mortgage deeds registeredto the mortgagor have been issued totalling 87'757 87'813
The mortgage deeds registered to the mortgagor are secured on land and buildings as well as the related plant and machinery at a carrying amount of CHF 122,437k (at 31 December 2014: CHF 59,013k).
As security for credit institution, a mortgage on movable propertyhas been issued totalling 2'054 2'284
The mortgage deed on movable property is secured on intangible fixed assets and property plant and machinery at a carrying amount of CHF 12.922k (at 31 December 2014: CHF 13,005k).
As security for credit institutions, security has moreover been provided in current assets at a carrying amount of CHF 27,839k (at 31 December 2014: CHF 26,589k).
Obligations under operating leases
Obligations under operating leases primarily comprise agreements entered into concerning the lease of operational equipment. The leases run until June 2019 at the latest.
Obligations under operating leases break down as follows according to due date:
Minimum payments 2015 2014CHF '000 CHF '000
0-1 year 121 211-5 years 150 3>5 years 0 0
271 24
Lease expenses recognised amount to CHF 127k (2014: CHF 73k).
34

2 8 C o n t in g e n t l ia b i l i t ie s a n d o th e r f in a n c ia l o b l ig a t io n s (continued)
Obligations under rental agreements
Obligations under rental agreements primarily comprise agreements entered into concerning the renting of warehouse and office space. The rentals run until February 2018 at the latest.
Obligations under rental agreements break down as follows according to due date:
Notes to the Annual Report, Group
Minimum payments 2015 2014CHF '000 CHF '000
0-1 year 2'022 1121-5 years 2'470 449>5 years 0 28
4'492 589
Rental expenses recognised amount to CHF 1.893k (2014: CHF 593k).
Contractual obligations
The Group has entered into agreements on delivery of property, plantand equipment with a remaining obligation of 493 13'818
35

2 9 F in a n c ia l r is k s
Credit risk
Credit risk arises from cash and cash equivalents, bond investments as well as credit exposure to customers and other outstanding receivables.
Credit risk is managed on a group basis. For banks and financial institutions, only independently rated parties with a minimum rating of 'A' are accepted.
If wholesale customers are independently rated, these ratings are used. Otherwise, if there is no independent rating, risk control assesses the credit quality of the customer, taking into account its financial position, past experience and other factors. Individual risk limits are set based on internal or external ratings in accordance with limits set by Management. The compliance with credit limits by wholesale customers is regularly monitored by line management.
Current follow-up is made on outstanding accounts in accordance with the Group's trade receivables procedures. Where uncertainty arises as to a customer's ability or willingness to pay, and it is estimated that the trade receivable is subject to risk, a bad debt provision is made.
Credit quality
Credit insurance has been taken out in respect of a part of the Group's trade receivables as part of a factoring agreement not qualifying for derecognition. The total amount included under the factoring agreement amounts to CHF 13m (2014: CHF 13m) and the associated liability amounts to CHF 10m (2014: CHF 11m).
At the balance sheet date the outstanding amount covered by credit insurance is approx. CHF 9m (2014: CHF 13m).
Generally the Group's trade receivables is concentrated on a smaller number of customers of which several are highly rated large multinational customers which supports the low bad debt provision.
The overdue balance on trade receivables is specified as follows at 31 December 2015:
Notes to the Annual Report, Group
C H F '0 0 00 -1 5 d ays 1 6 -3 0 d ays 3 1 -4 5 d ays > 45 d ays T o ta l
O v e rd u e re ce iva b le s n o t s u b je c t to im p a irm e n t 4 '4 9 7 2 97 194 8 56 5 '84 4O v e rd u e re ce iva b le s s u b je c t to im p a irm e n t 0 0 0 13 13
4 '4 9 7 2 97 194 8 69 5 '85 7B ad d e b t p ro v is io n 0 0 0 -1 3 -13
4 '4 9 7 2 97 194 8 56 5 '84 4
36

2 9 F in a n c ia l r is k s (continued)
The overdue balance on trade receivables is specified as follows at 31 December 2014:
Notes to the Annual Report, Group
C H F '000
0 -1 5 d ays 1 6-30 d ays 3 1 -4 5 d ays > 4 5 d ays T o ta l
O ve rd u e re ce iva b le s
not su b je c t to im p a irm e n t 4 '872 3'201 2 40 2 '18 3 10 '49 6
O ve rd u e re ce iva b le s
su b je c t to im p a irm e n t 0 0 0 93 93
4 '872 3'201 240 2 '27 6 10 '58 9
B ad d e b t p rov is ion 0 0 0 -93 -9 3
4 '872 3'201 240 2 '18 3 10 '49 6
Liquidity risk
The Group ensures sufficient cash resources by entering into framework agreements for current overdraft facilities. Existing agreements with agreed upon repayment terms cannot be terminated by the banks unless there is a breach of the covenants stated in the loan agreements.
In the event of breach of a covenant the Group has the right to remedy without undue delay, respectively the bank is entitled to terminate part or all of the outstanding loan facilities, should the Group not be able to do so.
Two covenants regarding credit institution loans have been in breach during 2015. A solvency ratio has been violated at the end of Q1 and Q2 2015 as well as the EBITDA in relation to fixed charges has been violated at the end of Q2, Q3 and Q4 2015. The bank has waived the breaches which are caused by a delay of a large capex project. In order to avoid similar issues in 2016, the company has been negotiating an amendment to the credit agreement with the credit institution.
Some of the Group's credit facilities are variable due to the fact that some of the Group's credit lines are based on the amount of the Group's trade receivables and inventory.
The analysis of due dates is stated on the basis of category and class broken down on due date. The calculation of interest payments on floating-rate obligations is based on the interest rate on the balance sheet date.
The cash need is expected covered by the current liquidity surplus from operations, bonds at fair value, unutilised credits as well as via refinancing or new non-current loans.
37

2 9 F in a n c ia l r is k s (continued)
2015
Notes to the Annual Report, Group
CHF '000Repayment
< 1 year 1-5 years >5 years Totalnot finally agreed
Carryingamount
Fairvalue
Measured at amortised cost:Bond 4'016 83'054 0 87'070 0 74'671 76'493Credit institutions 34'310 44'332 0 78'642 0 74'535 74'535Payables to relatedcompanies 14 0 0 14 0 14 14Trade payables 25'744 0 0 25'744 0 25'744 25'744Other short-term liabilities 17'032 0 0 17'032 0 17'032 17'032
Financial liabilities 81‘116 127‘386 0 208'5Q2 0 191 ‘996 193‘818
Loans and receivables: Trade receivables 47'241 0 0 47'241 0 47'241 47'228Other receivables 5'252 152 0 5'404 0 5'404 5'404Cash at bank and in hand 3'841 0 0 3'841 0 3'841 3'841
56‘334 152 0 56'486 0 56‘486 56‘473
Net cash outflow -24‘782 -127‘234 0 -152‘016 0 -135‘510 -137‘345
Bonds at fair value through profit and loss 1 ‘910 0 0 1‘910 0 1 ‘910 1‘910
Unutilised credits 8'690 8'690
2014
CHF '000
< 1 year 1-5 years >5 years Total
Repayment not finally agreed
Carryingamount
Fairvalue
Measured at amortised cost: Bond 5'798 98'915 0 104'713 0 82'536 82'536Credit institutions 30'038 38'463 0 68'501 0 68'501 68'501Payables to related companies 181 0 0 181 0 181 181Trade payables 37'159 0 0 37'159 0 37'159 37'159Other short-term liabilities 23'430 0 0 23'430 0 23'430 23'430
Financial liabilities 96‘606 137‘378 0 233‘984 0 211‘807 211‘807
Loans and receivables: Trade receivables 55'382 0 0 55'382 0 55'382 55'123Other receivables 9'938 0 0 9'938 0 9'938 9'938Cash at bank and in hand 10'560 0 0 10'560 0 10'560 10'560
Financial assets 75‘880 0 0 75‘880 0 75‘880 75‘621
Net cash outflow -20‘726 -137‘378 0 -158‘104 0 -135‘927 -136‘186
Bonds at fair value through profit and loss 9‘031 0 0 9‘031 0 9‘031 9‘031
Unutilised credits 6'856 6'856
38

2 9 F in a n c ia l r is k s (continued)
Fair value of bond investments is based on quoted prices (level 1). Fair value of the issued bond is based on an indicative price published by a Broker (level 2). Fair value of floating rate loans from credit institutions is based on an assessment of the current margin on such loan arrangements (level 2). Fair value of cash and cash equivalents and short term receivables and payables is determined to equal the nominal amount.
Notes to the Annual Report, Group
Market risk
The Group's credits and bonds are floating-rate credits and bonds, which exposes the Group to fluctuations in interest rates. It is Group policy that all financing of working capital and investments in non-current assets take place at floating interest rate.
No derivative financial instruments are used to hedge interest rate risk.
Based on interest-bearing debt at the balance sheet date, an increase in the SEK market rate by 1% would decrease the profit for the year before tax of CHF 765k (2014: CHF 825k) and an increase in all other market rates by 1% would decrease the profit for the year before tax of CHF 745k (2014: CHF 685k).
The Group's currencies used for payment are mostly distributed between EUR and USD. No financial instruments are used to hedge positions in foreign currency.
Exposure at 31 December 2015
The below balances represents the net Group exposure for each individual currency. Accordingly, where an entity reports in the stated currency, it has been excluded in the balance shown.
CHF '000
CurrencyPayment/
expiry Receivables Payables
Bond, bank and credit- institutions
Netposition
USD < 1 year 50'534 -19'044 -768 30'722
USD > 1 year 0 -2'988 0 -2'988
EUR < 1 year 5'491 -7'034 747 -796
CHF < 1 year 14'335 -109 9 14'235
SEK < 1 year 0 0 1 1
SEK > 1 year 0 0 -76'493 -76'493
Other < 1 year 483 -33 67 517
70'843 -29'208 -76'437 -34'802
39

2 9 F in a n c ia l r is k s (continued)
Exposure at 31 December 2014
CHF '000
Notes to the Annual Report, Group
CurrencyPayment/
expiry Receivables Payables
Bond, bank and credit- institutions
Netposition
USD < • year 113'462 -102'588 -13'598 -2'724
USD > • year 0 -5'843 -36'756 -42'599
EUR < year 24'727 -23'231 -7'362 -5'866
EUR > year 0 0 -1'707 -1'707
JPY < year 1'187 -487 672 1'372
SEK < year 0 -1'181 1 '233 52
SEK > year 0 0 -82'536 -82'536
Other < year 2'146 -3'599 -80 -1'533
141'522 -136'929 -140'134 -135'541
As the individual group companies primarily operate in their individual functional currencies, the Group's profit is primarily sensitive to changes in exchange rates related to intercompany accounts and receivables/ payables denominated in other currencies than the functional currency.
The two currencies to which profit/loss of the Group is most sensitive is USD and SEK.
A 10% increase in USD compared to the exchange rate at 31 December 2015 towards all other currencies will entail a positive change of profit for the year before tax of CHF 2,773k (2014: negative change of CHF 4,532k) and a similar effect on equity.
A 10% increase in SEK compared to the exchange rate at 31 December 2015 towards all other currencies will entail a negative change of profit for the year before tax of CHF 7,649k (2014: negative change of CHF 8,248k) and a similar effect on equity.
Capital management
The objective of the Group's capital management is to ensure the Group's ability to continue as a going concern in order to yield return on investment to the shareholders and to create and maintain an optimal capital structure in order to reduce the costs of capital and maintain a basis of continued growth in the Group.
The Group's capital management is also partly governed by loan agreements which include requirements to financial ratios. These financial ratios are affected by the size of the capital, that a reduction will reduce the ratios.
Total capital makes up the equity shown in the consolidated balance sheet.
40

3 0 R e la te d p a r t ie s
Notes to the Annual Report, Group
BasisControlling interest
Poul M. Mikkelsen, Rebstockrain 16, CH-6006 Luzern
Ammon Ammon AG, Meierhofstrasse 5, FL-9490 Vaduz
PMM Holding (Luxembourg) AG, 5, rue Guillaume Kroll,L-1882 Luxembourg
Other related parties
PMM Holding AG, Rebstockrain 16, CH-6006 Luzern
Dønnerup A/S, c/o Bech-Bruun Advokatfirma, Langelinie Allé 35 DK-2100 København Ø
Transactions
Controlling shareholder
Ultimate parent company
Parent company
Sister company
Sister company
Besides intercompany transactions that have been eliminated in the Consolidated Financial Statements, related party transactions comprise purchases of management services from the related company PMM Holding (Luxembourg) AG.
Purchases of management services amounted to CHF 742k (2014: CHF 643k) in financial year 2015.
The Group has charged management services in the amount of CHF 94k (2014: CHF 79k) to Dønnerup A/S. Dønnerup A/S has charged rental expenses in the amount of CHF 99k (2014: CHF 62k).
All transactions have been effected on an arm's length basis.
Payables to related companies
Ammon Ammon AGPMM Holding (Luxembourg) AG
140
0181
14 181
3 1 D e v e lo p m e n t co s ts
Development costs for the year recognised in the income statement under production costs amount to CHF 903k in 2015 against CHF 741k in 2014.
3 2 P o s t b a la n c e s h e e t e v e n ts
There have been no material events after the balance sheet date.
41

3 3 B u s in e s s C o m b in a t io n
Notes to the Annual Report, Group
In 2015, the Group performed an acquisition which has been accounted for by the acquisition method. The results of the acquired business has been included in the consolidated financial statements as from the date of acquisition.
Sontara Argentina Srl was acquired from Group Management at cost.
Acquired shares Acquisition date Acq. PriceCHF '000
Sontara Argentina Srl 100% 21.05.2015 925
Fair value on acquisition date Sontara CHF '000
Deferred tax asset InventoryAccounts receivable Other receivables Cash at Bank Accounts payable Other short-term liabilities
18399171117
1'423-996-255
Identifiable net assets Goodwill
87748
Acquisition price Cash acquired
925-1'423
Net cash-flow from acquisition -498
Acquisition price is divided as follows: CashContingent consideration
9250
925
Transaction costs included in special items 0
42

3 3 B u s in e s s C o m b in a t io n (continued)
Sontara ArgentinaDescription of acquired activitiesAs of 21 May 2015, the Sontara Argentina entity was acquired from Group Management through a share purchase and sale agreement. The acquired entity is part of the Sontara segment. The acquisition is in line with Jacob Holms strategy to consolidate all Sontara activities and will strengthen the Groups competitive position in the nonwovens industry. The acquired entity has been fully integrated into the Group. The purchase price of CHF 925k was paid in cash and pertains mainly to net working capital (CHF -426k), cash (CHF 1,423 million) and liabilities (CHF 255k).
At the time of acquiring the Sontara activities in 2014, the Argentina activities could not be part of the acquisitio due to lack of permission from the local authorities. Accordingly, the Argentina activities were acquired directly by Group management with the aim of transferring the ownership to the Jacob Holm Group as soon as all permissions were in place. The shares have been transferred at cost.
Notes to the Annual Report, Group
Revenue and net resu lt from acquired activitiesThe acquired company has, on a stand-alone basis, reported annual net sales revenue of CHF 1,184k and a net result of CHF -193k.
The acquired company has been included in the consolidation with net sales revenue of CHF 843k and a net result of CHF -201k.
43

Report on the Review of Financial statements to the Board of Directors of Jacob Holm & Sons AG Basel
Introduction
We have reviewed the accompanying financial statements (balance sheet, income statement, cash flow statement, statement of changes in equity and notes) of Jacob Holm & Sons AG for the period ended 31 December 2015. The Board of Directors is responsible for the preparation and presentation of this financial statements in accordance with International Financial Reporting Standards. Our responsibility is to express a conclusion on this financial statements based on our review.
Scope of Review
We conducted our review in accordance with International Standard on Review Engagements 2400, “Review of financial statements”. A review of financial information consists of making inquiries, primarily of persons responsible for financial and accounting matters, and applying analytical and other review procedures. A review is substantially less in scope than an audit conducted in accordance with International Standards on Auditing and consequently does not enable us to obtain assurance that we would become aware of all significant matters that might be identified in an audit. Accordingly, we do not express an audit opinion.
Conclusion
Based on our review, nothing has come to our attention that causes us to believe that the accompanying financial statements have not been prepared, in all material respects, in accordance with International Financial Reporting Standards.
PricewaterhouseCoopers AG
Basel, 29 April 2016
Enclosure:
- Financial statements (balance sheet, income statement, cash flow statement, statement of changes in equity and notes)
PricewaterhouseCoopers AG, St. Jakobs-Strasse 2 5 , Postfach, CH-4002 Basel, Switzerland Telefon: +41 58 792 51 00, Telefax: +41 58 792 5110, www.pwc.ch
PricewaterhouseCoopers AG is a member of the global PricewaterhouseCoopers network of firms, each of which is a separate and independent legal entity.

Parent Company Income Statement 1 January - 31 December
Note 2015 CHF '000
2014 CHF '000
Revenue 1 5'753 3'362
Cost of goods sold 2 -135 -23
Gross profit 5'618 3'339
Sales and marketing expenses 2 -184 -141Administrative expenses 2 -6'413 -3'858
Operating profit -979 -660
Other operating income and expenses
Profit before financial income and
0 14
expenses and special items -979 -646
Special items, net 3 -495 -1'275Dividend income 5 4'212 0Financial income 6 631 391Financial expenses 7 -65 -162
Profit before tax 3'304 -1'692
Tax on profit for the year 8 -100 -183
Net profit for the year 3'404 -1'509
Parent company Statement of Comprehensive Income 1 January - 31 December
3'404 -1'509
3'404 -1'509
Net profit for the year
Comprehensive income
45

Parent Company Balance Sheet at 31 December
AssetsNote 2015 2014
CHF '000 CHF '000
Patents and trademarks 2'103 2'240Software 25 23
Intangible fixed assets under construction 189 130
Intangible fixed assets 9 2'317 2'393
Other fixtures and fittings, tools and equipment 593 486
Property, plant and equipment 10 593 486
Investments in subsidiaries 11 122'850 122'850Other receivables 63 46Deferred tax asset 12 285 185
Financial fixed assets 123'198 123'081
Non-current assets 126'108 125'960
Receivables from related companies 109 1'975Corporation tax 14 4Trade receivables 71 0Other receivables 627 1'468
Receivables 821 3'447
Cash at bank and in hand 390 368
Current assets 1 '2 1 1 3'815
Assets 127'319 129'775
46

Parent Company Balance Sheet at 31 December
Equity and liabilitiesNote 2015 2014
CHF '000 CHF '000
Share capital 13 250 250Retained earnings 124'764 121'360
Equity 125'014 121'610
Loan due to related company 0 3'490
Non-current liabilities 0 3'490
Credit institutions 33 340Trade payables 685 1'389Payables to related companies 225 1'545Other payables 1'362 1'401
Current liabilities 2'305 4'675
Liabilities 2'305 8'165
Equity and liabilities 127'319 129'775
Contingent liabilities 16Financial risks 17Related parties 18
47

Statement of Changes in Equity, Parent Company 1 January - 31 December
Share Retainedcapital earnings Total
CHF '000 CHF '000 CHF '000Equity
Equity at 1 January 2015 250 121'360 121'610Comprehensive income for the year 0 3'404 3'404Dividends 0 0 0
Equity at 31 December 2015 250 124'764 125'014
Equity at 1 January 2014 100 169 269Additions from contribution in kind 150 122'700 122'850Comprehensive income for the year 0 -1'509 -1'509Dividends 0 0 0
Equity at 31 December 2014 250 121'360 121'610
48

Parent Company Cash Flow Statement
Net profit for the year Adjustments of non-cash items Change in working capital
Cash flows from operating activities before financial income and expenses and special items
Financial income Financial expenses Corporation tax paid
Cash flows from operating activities
Purchase of intangible fixed assets Purchase of property, plant and equipment Purchase of financial fixed assets Sale of property, plant and equipment Acquisition of business combinations
Cash flows from investing activities
Increase in accounts with group companies Decrease in accounts with group companies Increase in accounts with related companies Decrease in accounts with related companies
Cash flows from financing activities
Change in cash and cash equivalents
Cash and cash equivalents at 1 January
Cash and cash equivalents at 31 December
specified as follows:
Cash at bank and in hand Credit institutions (current liabilities)
Note 2015 2014CHF '000 CHF '000
3'404 -1'50914 -390 -27815 27 947
3'041 -840
631 391-65 -162-10 -42
3'597 -653
-72 -32-257 -425
-17 022 57
0 -2'286
-324 -2 '6 8 6
0 2'916-2'777 0
0 96-167 0
-2'944 3'012
329 -327
28 355
357 28
390 368-33 -340
357 28
49

Notes to the Annual Report, Parent Company
1
2
3
2015 2014CHF '000 CHF '000
R evenue
Royalty fee 328 0Management fee 5'425 3'362
5753 3'362
Expenses c lass ified b y typ e
Production costs 135 23
Cost of goods sold 135 23Sales and marketing expenses 184 141Administrative expenses 6'413 3'858Other income and expenses 0 -14Special items, net 495 1'275
7'227 5'283
Classified by type as follows:Other external expenses 4'039 2'993Staff expenses 2'890 2'147Depreciation and amortisation 298 143
S p ecia l ite m s , n e t
Special items, costs:
7'227 5'283
Integration costs regarding acquired businesses 495 1'044Restructuring projects 0 231
495 1'275
Special items, are all external expenses.
50

Notes to the Annual Report, Parent Company
4
5
6
7
2015 2014CHF '000 CHF '000
S ta ff expenses
Wages and salaries 2'573 1'881Pensions 103 97Other social security expenses 214 169
2'890 2'147
Average number of full-time employees 13 7
Staff expenses are distributed on the individual cost groups as follows:Cost of goods sold 68 0Sales and marketing expenses 107 113Administrative expenses 2'715 2'034
2'890 2'147
D iv id e n d in c o m e
Jacob Holm & Sønner Holding A/S 4'212 0
4'212 0
F in a n c ia l in c o m e
Interest 0 0Exchange adjustments 170 0Interest/commission intercompany accounts 461 391
631 391
F in a n c ia l expenses
Interest/provision intercompany accounts 61 18Interest 4 1Exchange adjustments 0 143
65 162
Interest relates to loans received and payables measured at amortised cost.
51

Notes to the Annual Report, Parent Company
2015 2014CHF '000 CHF '000
T a x on p r o f i t fo r th e y e a r
Current tax on profit for the year 0 0Change in deferred tax -100 -185Adjustment tax previous years 0 2
-10 0 -183
Tax on profit for the year is specified as follows: Calculated 11% tax on profit for the year before tax 363 -186
Tax effect of:Tax on non-deductible expenses and non-taxable income -463Adjustment of valuation deferred tax 0 1Adjustment tax previous years 0 2
-10 0 -183
Effective tax rate for the year -3.03% 10.82%
52

Notes to the Annual Report, Parent Company
Intangible fixedPatents and assets undertrademarks Software constructionCHF '000 CHF '000 CHF '000
9 In ta n g ib le f ix e d assets
2015
Cost at 1 January 2'286 25 130Additions for the year 0 13 59Disposals for the year 0 0 0
Cost at 31 December 2'286 38 189
Amortisation at 1 January 46 2 0Amortisation for the year 137 11 0Disposals for the year 0 0 0
Amortisation at 31 December 183 13 0
Carrying amount at 31December 2'103 25 189
Amortised over 10 -2 0 years 3-5 years
2014
Cost at 1 January 0 0 122Additions from business combination 2'286 0 0Additions for the year 0 25 8Disposals for the year 0 0 0
Cost at 31 December 2'286 25 130
Amortisation at 1 January 0 0 0Amortisation for the year 46 2 0Disposals for the year 0 0 0
Amortisation at 31 December 46 2 0
Carrying amount at 31December 2'240 23 130
Amortised over 10 -20 years 3-5 years
53

Notes to the Annual Report, Parent Company
Other fixtures and fittings, tools and equipment CHF '000
1 0 P ro p e r ty , p la n t a n d e q u ip m e n t
2015
Cost at 1 January 1'102Additions for the year 257Disposals for the year -184
Cost at 31 December 1'175
Depreciation at 1 January 616Depreciation and impairment losses for the year 150Disposals for the year -184
Depreciation at 31 December 582
Carrying amountat 31 December 593
Depreciated over 3-10 years
2014
Cost at 1 January 845Additions for the year 425Disposals for the year -168
Cost at 31 December 1'102
Depreciation at 1 January 642Depreciation and impairment losses for the year 95Disposals for the year -121
Depreciation at 31 December 616
Carrying amountat 31 December 486
Depreciated over 3-10 years
54

Notes to the Annual Report, Parent Company
1 1 In v e s tm e n ts in s u b s id ia ries
S hare
capital C u rre n cy
O w nership
% Equity
'000 C H F '000
Ja co b Holm & S ø n n e r H olding A/S, D e n m ark 1'000 D K K 100% 65'698
65'698
2015 2014CHF '000 CHF '000
Cost at 1 January 122'850 0Addition from contribution in kind 0 122'850
Cost at 31 December 122'850 122'850
1 2 D e fe rre d ta x asset
Deferred tax at 1 January 185 0Change in deferred tax, see note 8 100 185
Deferred tax at 31 December 285 185
Deferred tax relates to:Tax loss carry-forward 285 185
Non-current portion 285 185
1 3 S h are c a p ita l
Share capital has developed as follows:
1 January 250 100Increase via contribution in kind 0 150
31 December 250 250
55

Notes to the Annual Report, Parent Company
2015 2014CHF '000 CHF '000
1 4 C ash f lo w s ta te m e n t - a d ju s tm e n ts o f n o n -c a s h ite m s
Financial income -631 -391Financial expensesDepreciation, amortisation and impairment losses, including losses and gains on disposals of intangible fixed assets and property,
65 162
plant and equipment 276 134Tax on profit for the year -100 -183
-390 -278
15 C ash f lo w s ta te m e n t - ch a n g e in w o r k in g c a p ita l
Change in receivables 771 -1'455Change in payables -744 2'402
27 947
1 6 C o n t in g e n t l ia b i l i t ie s
As security for a bond issued by the Subsidiary, the Company isguaranteeing 76'493 82'536
As security for the Bond issued by the Company, all shares in direct and indirect subsidiaries have been pledged.
As security for credit institution, the Company has provided surety 7'919 6'731with a maximum amount of
Obligations under rental agreements
Obligations under rental agreements primarily comprise agreements entered into concerning the rent of office space. The lease run until 2020 at the latest.
Obligations under rental agreements break down as follows according to due date:
Minimum payments
0-1 year 112 1121-5 years 365 449>5 years 0 28
477 589
Rental expenses recognised amount to CHF 118k (2014: CHF 92k)
56

Notes to the Annual Report, Parent Company
17 F in a n c ia l r is k s
Credit risk
For a description of the credit risk, please see note 29 to the Annual Report of the Group.
Liquidity risk
For a description of the liquidity risk, please see note 29 to the Annual Report of the Group.
The analysis of due dates is stated on the basis of category and class broken down on due date. The calculation of interest payments on floating-rate obligations is based on the interest rate on the balance sheet date.
2015
CHF '000
< 1 year 1 -5 years Total
Repayment not finally agreed
Carryingamount
Fairvalue
Measured at amortised cost:
Credit institutions 33 0 33 0 33 33Payables to group 211 0 211 0 211 211com paniesPayables to related companie 14 0 14 0 14 14Trade payables 685 0 685 0 685 685Other short-term liabilities 1 '362 0 1 '362 0 1 '362 1 '362
Financial liabilities 2’305 0 2’305 0 2’305 2’305
Loans and receivables:
Receivables from group 109 0 109 0 109 109companies Trade receivables 71 71 0 71 71Other receivables 641 63 704 0 704 704Cash at bank and in hand 390 0 390 0 390 390
Financial assets 1’211 63 1’274 0 1’274 1’274
Net cash outflow -1’094 63 -1’031 0 -1’031 -1’031
57

Notes to the Annual Report, Parent Company
17 F in a n c ia l r is k s (continued)
2014
CHF '000
< 1 year 1-5 years Total
Repayment not finally agreed
Carryingamount
Fairvalue
Measured at amortised cost:
Credit institutions 340 0 340 0 340 340Payables to group 1 '364 3'490 4'854 0 4'854 4'854com paniesPayables to related com panie 181 0 181 0 181 181Trade payables 1 '389 0 1 '389 0 1'389 1'389Other short-term liabilities 1 '401 0 1 '401 0 1 '401 1 '401
Financial liabilities 4'675 3'490 8'165 0 8'165 8'165
Loans and receivables:
Receivables from related 1 '975 0 1'975 0 1 '975 1 '975companies Other receivables 1 '472 0 1'472 0 1'472 1'472Cash at bank and in hand 368 0 368 0 368 368
Financial assets 3'815 0 3'815 0 3'815 3'815
Net cash outflow -860 -3'490 -4'350 0 -4'350 -4'350
*Information on fair value hierarchy is not relevant as the debt is subject to variable interest and no transaction expenses have been paid.
Market risk
Interest on accounts with related companies are interest bearing.
The Company's currency used for payment is primarily CHF, USD and EUR. No financial instruments are used to hedge positions in foreign currency.
Exposure at 31 December 2015:
C H F '000
C urrency Paym ent/expiry
R eceivables PayablesBank
and credit- institutions
N etposition
U S D < 1 year 71 -4 9 9 6 6 -3 62
EUR < 1 year 27 -1 3 7 6 4 -46
Other < 1 year 0 -3 3 1 -32
98 -6 6 9 131 -4 4 0
58

Notes to the Annual Report, Parent Company
17 F in a n c ia l r is k s (continued)
Exposure at 31 December 2014:
C H F '000Bank
C urrency Paym ent/ R eceivables Payables and credit- Netexpiry institutions pos ition
U S D < 1 year 16 -5 5 -1 08 -1 47
EU R < 1 year 3 5 6 -1 '3 1 0 150 -8 04
S E K < 1 year 3 8 3 -181 0 202
Other < 1 year 0 0 1 1
755 -1 '5 4 6 43 -7 48
A 10% increase in USD towards all currencies would mean a negative change in net position of CHF 36k (2014: a negative change of CHF 15k) respectively, which would affect the profit for the year before tax and corresponding impact on equity.
A 10% increase in EUR towards all currencies would mean a negative change in net position of CHF 5k (2014: a negative change of CHF 80k), which would affect the profit for the year before tax and corresponding impact on equity.
Capital management
The objective of the Company's capital management is to ensure the Company's ability to continue as a going concern in order to yield return on investment to the shareholders and to create and maintain an optimal capital structure in order to reduce the costs of capital and maintain a basis of continued growth in the Group.
Total capital makes up the equity shown in the balance sheet.
59

Notes to the Annual Report, Parent Company
1 8 R e la te d p a r t ie s
BasisControlling interest
Poul M. Mikkelsen, Rebstockrain 16, CH-6006 Luzern
Ammon Ammon AG, Meierhofstrasse 5, FL-9490 Vaduz
PMM Holding (Luxembourg) AG, 5, rue Guillaume Kroll,L-1882 Luxembourg
Other related parties
PMM Holding AG, Rebstockrain 16, CH-6006 Luzern
Dønnerup A/S, c/o Bech-Bruun Advokatfirma, Langelinie Allé 35 DK-2100 København Ø
Transactions
Controlling shareholder
Ultimate parent company
Parent company
Sister company
Sister company
Besides intercompany transactions that have been eliminated in the Consolidated Financial Statements, related party transactions comprise purchases of management services from the related company PMM Holding (Luxembourg) AG.
Purchases of management services amounted to CHF 742k (2014: CHF 643) in financial year 2015.
Further, the Financial Statements includes a financial income of CHF 461k (2014: CHF 391k) from guarantee fee charges related to the guarantee regarding the Bond issued by Jacob Holm & Sønner Holding A/S. The Company is guaranteeing an amount of up to SEK 650m.
The company has been charged management services in the amount of CHF 0k (2014: CHF 29k) from D0 nnerup A/S. D0 nnerup A/S has charged rental expenses in the amount of CHF 0k (2014: CHF 8k).
All transactions have been effected on an arm's length basis.
Receivables from related companies2015 2014
CHF '000 CHF '000
Jacob Holm & Sønner Holding A/S 109 197Jacob Holm Industries (Americas), Inc. 0 21Sontara AG 0 1'757
109 1'975
60

Notes to the Annual Report, Parent Company
1 8 R e la te d p a r t ie s (continued)
Payables to related companies
Ammon Ammon AG PMM Holding (Luxembourg) AG Jacob Holm & Sønner A/S Jacob Holm Industries (France) SAS Sontara AGSontara Old Hickory, Inc.TWIG Trading GmbHTWIG Trading Switzerland GmbH
2015 2014CHF '000 CHF '000
14 00 1810 3'779
16 1'064106 0
89 00 20 9
225 5'035
61