jackson hole wildlife foundation’s teton county wildlife
TRANSCRIPT

Jackson Hole Wildlife Foundation’s
Teton County Wildlife Vehicle Collision
Database Summary Report 2018-2019
Published November 2019 (covering May 2018 - April 2019)
Prepared by:
Paul Hood, Alyson Courtemanch and Jon Mobeck Jackson Hole Wildlife Foundation – Nature Mapping Jackson Hole
PO Box 8042, Jackson, WY 83002; jhwildlife.org
2
Teton County Wildlife-Vehicle Collision Database Summary Report
2018-2019
2018-2019 Data Update
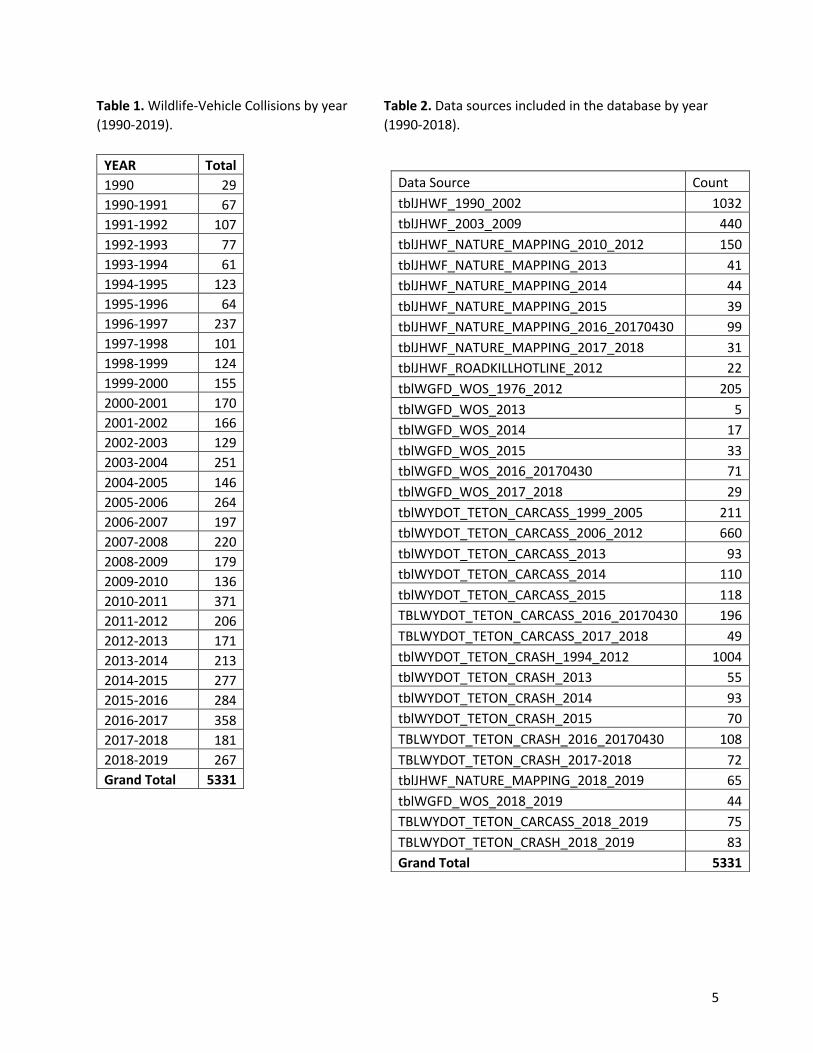
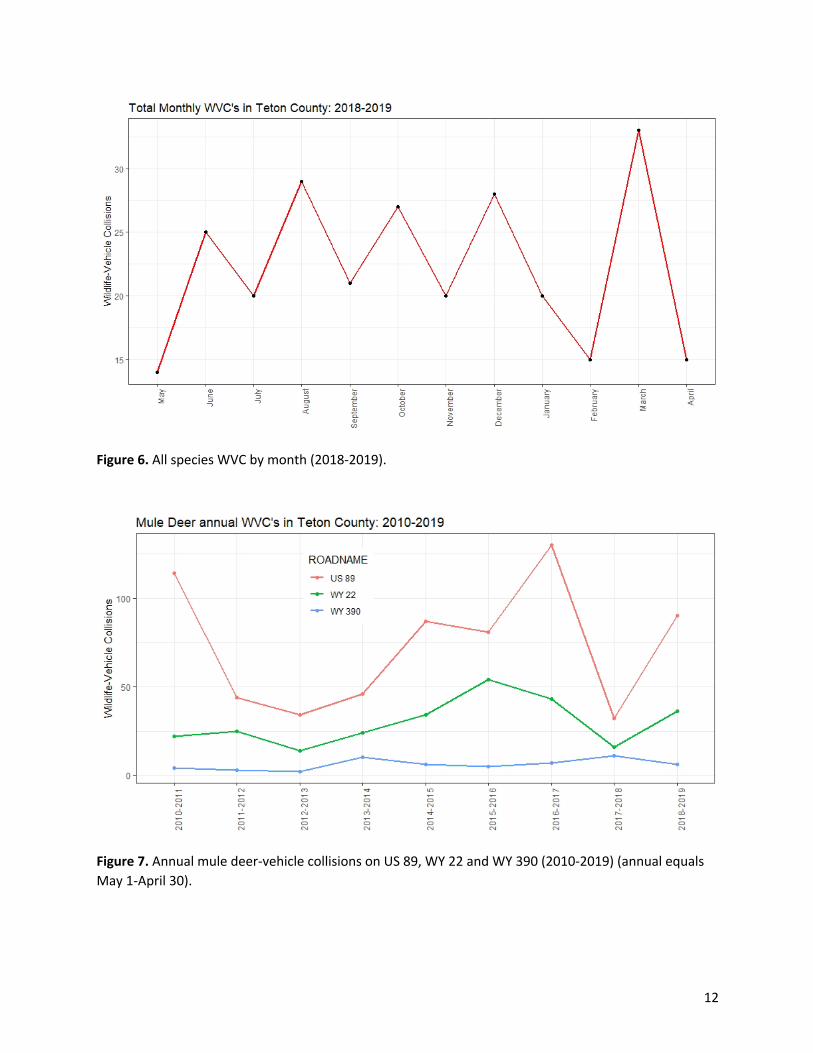
Wildlife-vehicle collisions (WVC) continued on a steady upward trend in 2018-2019 (Figure 1). There was a total of 267 WVC from May 1, 2018 – April 30, 2019 (Table 1). WVC are historically most prevalent during the winter months (December – February; Figure 3), but moose WVC were evenly distributed throughout 2018-2019 (Figure 5), and all species WVC in 2018-2019 were fairly constant throughout the year (Figure 6). Twenty (20) or more WVC occurred on Teton County highways during all months except May (14), February (15) and April (15). In order to delineate an annual duration that captures the entirety of a winter season, an annual unit is defined as May 1 – April 30 (e.g. May 1, 2018 – April 30, 2019 = 2018-2019). This provides a more accurate representation of the seasonal trends associated with WVCs in Teton County, WY. Data for the 2018-2019 update was acquired from the following data sources: Wyoming Department of Transportation - Carcass (n=75), Wyoming Department of Transportation – Crash (n=83), Wyoming Game and Fish Wildlife Observation System (n=44) and Nature Mapping Jackson Hole (n=65) (Table 2). In total, Jackson Hole Wildlife Foundation’s (JHWF) WVC database contains 46 total species with mule deer, elk and moose being the most prominent species recorded (Table 4). Summary
The total number of WVCs increased in 2018-2019 compared to the previous year, bouncing back toward numbers that are consistent with recent trends. Moose-vehicle collisions increased significantly in 2018-2019, as 28 moose WVC were recorded across the highway network (Table 4). That total represents the highest number of moose WVC since 2010-2011. Map 1 illustrates where those moose collisions occurred (most locations are exact while all are pegged to within ¼ mile). Seven moose (7) WVC occurred on WY 22 between the town of Wilson and the Town of Jackson. An additional seven (7) moose WVC occurred on WY 390, which was the highest total recorded there since 2010-2011. Four (4) moose were hit on North Highway 89 between the Town of Jackson and the Grand Teton National Park southern boundary, and another four (4) moose were hit on WY 22 between Coal Creek/Mail Cabin and the Wyoming/Idaho border on the west side of Teton Pass.

3
Methods
The WVC database is updated annually using an automated process. This process stores all wildlife-vehicle collisions in a SQL database where it can be accessed in ArcMap, via an SDE connection, and in Program R, via a remote database connection. The SQL database allows all raw data to be stored in one place. Then, with saved queries, the data is formatted and combined into one large database. This database is then run through an iterative loop in R that eliminates duplicates based on distance (<0.25mi) from other observations entered on the same day of the same species. Additional observations are easily added to the SQL database and queried to eliminate duplicates.
WYDOT maintains spatial datasets for all major travel routes in Wyoming. These spatial datasets use linear-referenced system (LRS) geometry that contain route and measure attributes. Before raw WVC data is queried in a SQL database, a field locating each observation to the nearest LRS WYDOT route is added and populated with a value using the “Locate Feature Along Route” tool in ArcMap. This value is used to when identifying duplicates.
When duplicates are identified in the R script, optimal observations are selected based on the data source. The following table indicates the ranking of the data sources included in the JHWF WVC database (observations with a lower source rank are selected over a higher source rank). If duplicate observations are found in multiple data sources, the record from the source with the highest rank (lowest number) will be retained. The rankings are based on relative spatial accuracy and species sex/age identification.
DATASOURCE Source Rank Jackson Hole Wildlife Foundation Nature Mapping Observations (2010-2018) 1 JHWF Roadkill Hotline (2012) 2 Wyoming Game and Fish Department Wildlife Observation System (2014-2018) 2 Wyoming Department of Transportation Crash Data (1994-2018) 3 Wyoming Department of Transportation Carcass Pick-Up Data (1999-2018) 4 Jackson Hole Wildlife Foundation Roadkill Hotline, Other Data Sources (1990-2009) 5 Wyoming Game and Fish Department Wildlife Observation System (1976-2013) 6
Important Caveats of the Database
• No records included within Grand Teton National Park at the park’s request. The park maintains its own database.
• Mix of data collected in different ways with different accuracies; may want to consider dissolving data to the nearest mile marker, depending on your goal. Some observers are trained biologists while others are not.
• Large effort to remove potential duplicates among different sources. • Date/time usually does not record actual time of death, but rather when the dead animal was
observed (often a day or two later). • Heavily biased by ungulates, especially mule deer. These are the animals that WYDOT picks up
and that cause crashes large enough to call Police. Also easier to observe by citizen scientists.

4
• This database is likely a significant underestimate of WVC occurrences in Teton County, even for ungulates. Many WVC events go unreported or animals are hit and die out of sight from roads.
• Probably biased by larger roads (more observers). • Biased by year; WYDOT has been collecting data since 1990, but other groups started later.
WYDOT has also improved their documentation in recent years. • WVC numbers are influenced by winter conditions, with high numbers occurring during more
severe winters when ungulates are concentrated close to roads.
Suggested Citation:
Jackson Hole Wildlife Foundation, Jackson, WY, Wildlife-Vehicle Collision Database, 2/28/2019
Acknowledgements:
Funding from Teton Conservation District and Meg and Bert Raynes Wildlife Fund. Data acquisition and workflow development: Jackson Hole Wildlife Foundation (Paul Hood), University of Wyoming (Shannon Albeke) and Teton Science Schools (Morgan Graham and Chauncy Smith). Data contributions: Wyoming Department of Transportation, Biota Research and Consulting, Nature Mapping Jackson Hole, Wyoming Game and Fish Department and Jackson Hole Wildlife Foundation.
5
Table 1. Wildlife-Vehicle Collisions by year Table 2. Data sources included in the database by year (1990-2019). (1990-2018).
YEAR Total
1990 29 1990-1991 67 1991-1992 107 1992-1993 77 1993-1994 61 1994-1995 123 1995-1996 64 1996-1997 237 1997-1998 101 1998-1999 124 1999-2000 155 2000-2001 170 2001-2002 166 2002-2003 129 2003-2004 251 2004-2005 146 2005-2006 264 2006-2007 197 2007-2008 220 2008-2009 179 2009-2010 136 2010-2011 371 2011-2012 206 2012-2013 171 2013-2014 213 2014-2015 277 2015-2016 284 2016-2017 358 2017-2018 181 2018-2019 267 Grand Total 5331
Data Source Count tblJHWF_1990_2002 1032 tblJHWF_2003_2009 440 tblJHWF_NATURE_MAPPING_2010_2012 150 tblJHWF_NATURE_MAPPING_2013 41 tblJHWF_NATURE_MAPPING_2014 44 tblJHWF_NATURE_MAPPING_2015 39 tblJHWF_NATURE_MAPPING_2016_20170430 99 tblJHWF_NATURE_MAPPING_2017_2018 31 tblJHWF_ROADKILLHOTLINE_2012 22 tblWGFD_WOS_1976_2012 205 tblWGFD_WOS_2013 5 tblWGFD_WOS_2014 17 tblWGFD_WOS_2015 33 tblWGFD_WOS_2016_20170430 71 tblWGFD_WOS_2017_2018 29 tblWYDOT_TETON_CARCASS_1999_2005 211 tblWYDOT_TETON_CARCASS_2006_2012 660 tblWYDOT_TETON_CARCASS_2013 93 tblWYDOT_TETON_CARCASS_2014 110 tblWYDOT_TETON_CARCASS_2015 118 TBLWYDOT_TETON_CARCASS_2016_20170430 196 TBLWYDOT_TETON_CARCASS_2017_2018 49 tblWYDOT_TETON_CRASH_1994_2012 1004 tblWYDOT_TETON_CRASH_2013 55 tblWYDOT_TETON_CRASH_2014 93 tblWYDOT_TETON_CRASH_2015 70 TBLWYDOT_TETON_CRASH_2016_20170430 108 TBLWYDOT_TETON_CRASH_2017-2018 72 tblJHWF_NATURE_MAPPING_2018_2019 65 tblWGFD_WOS_2018_2019 44 TBLWYDOT_TETON_CARCASS_2018_2019 75 TBLWYDOT_TETON_CRASH_2018_2019 83 Grand Total 5331

6
Table 3. Wildlife-Vehicle Collisions for all years by road name (2010-2019).
Road Name 2010-2011
2011-2012
2012-2013
2013-2014
2014-2015
2015-2016
2016-2017
2017-2018
2018-2019
Grand Total
17SA 1 1 BATCH PLANT RD 2 1 1 4 BOYLES HILL RD 1 1 2 BUFFALO VALLEY RD 1 2 3 CACHE ST 1 1 DELONEY AVE 1 1 E BROADWAY AVE 1 1 FALL CREEK RD 3 1 2 2 2 1 5 2 3 21 FISH CREEK RD 12 1 6 1 20 GAME CREEK RD 1 1 2 HENRY'S RD 2 1 1 4 HIDDEN RANCH LN 1 1 HIGH SCHOOL RD 1 1 JACKSON AVE 1 1 KELLY AVE 1 1 MALLARD RD 1 1 NATIONAL ELK REFUGE 1 1 3 5 PARK LOOP RD 6 2 1 9 PARK RANCH RD SO FORK 1 1 REDMOND ST 1 1 SKI HILL RD 1 2 1 3 7 SNOW KING AVE 1 1 2 SOUTH PARK LOOP 1 1 1 3 SPRING GULCH RD 1 1 1 3 6 2 2 2 18 UPPER CACHE CREEK DR 1 1 US 189 1 1 US 189/US 191 (Hoback JCT to SE County Line in Hoback Canyon) 28 18 14 16 18 18 27 27 10 176

7
US 189/US 191/US 26/US 89 (Hoback Jct to Jackson Town Square) 139 58 38 57 94 94 149 40 106 775 US 191/US 26/US 89 (Jackson Town Square to GTNP S Boundary) 54 38 31 27 37 29 30 21 26 293 US 26/US 287 (GTNP E Boundary Buffalo Valley to County Line) 10 5 7 1 15 17 10 8 5 78 US 26/US 89 (Hoback Jct to SW County Line in Snake River Canyon) 40 22 21 34 34 38 42 27 27 285 VIRGINIAN LN 1 1 WY 22 54 36 41 48 51 65 70 37 57 459 WY 390 18 20 14 21 12 10 16 17 20 148 Grand Total 371 206 171 213 277 284 358 181 267 2328
Table 4. Species count in the Wildlife-Vehicle Collision database.
Species 2010-2011
2011-2012
2012-2013
2013-2014
2014-2015
2015-2016
2016-2017
2017-2018 2018-2019
Grand Total
American Badger 1 1 American Marten 1 1 1 3 American Mink 1 1 American Robin 1 1 2 Barrow’s Goldeneye 1 1 Bighorn Sheep 4 4 Bison 1 1 Black Bear 1 1 1 2 1 6 Black Rosy-Finch 1 1 Black-billed Magpie 1 1 1 3 Boreal Toad 1 1 Brewer’s Blackbird 1 1 Common Gartersnake 2 2 Common Raven 1 1 2

8
Coyote 1 1 1 3 2 2 10 Deer Mouse 1 1 Elk 59 37 36 46 29 25 46 49 34 361 Gray Wolf 1 1 2 Great Horned Owl 1 1 1 4 7 Grizzly Bear 1 1 2 Least Chipmunk 2 2 Long-tailed Weasel 1 1 2 Moose 33 14 18 15 13 12 18 20 28 171 Mountain Bluebird 1 1 2 Mountain Lion 1 1 2 Mule Deer 247 137 99 134 217 223 265 105 179 1606 North American Badger 1 1 North American Porcupine 1 4 5 4 2 4 4 3 27 Northern Goshawk 1 1 Northern Raccoon 4 5 3 4 6 4 1 1 5 33 Pronghorn 1 1 1 3 Red Fox 2 1 1 1 1 2 2 2 12 Red Squirrel 2 1 3 Rough-legged Hawk 1 1 Ruffed Grouse 1 1 Short-tailed Weasel (Ermine) 3 1 4 Snowshoe Hare 1 1 Striped Skunk 1 4 6 2 13 Tiger Salamander 1 1 Wandering Gartersnake 1 1 2 4 Weasel 1 1 Western Tanager 1 1 White-tailed Deer 5 2 2 2 1 4 1 2 19 Wilson’s Warbler 1 1 Yellow Warbler 2 2 Yellow-bellied Marmot 1 1 2 Grand Total 371 206 171 213 277 284 358 181 267 2328

9
Figure 1. Three-year averages and standard error of wildlife-vehicle collisions in Teton County, WY (1990-2019).
Figure 2. Annual wildlife-vehicle collisions by year in Teton County, WY (1990-2019) (annual equals May 1-April 30).

10
Figure 3. Mean and standard error of wildlife-vehicle collisions by month (2010-2019).
Figure 4. Annual wildlife vehicle collisions on South 89, Broadway/Refuge, WY 22 and WY 390 (2009-2019) (year equals May 1-April 30).

11
Figure 5. Moose WVC by month (2018-2019).
Map 1. Moose WVC by location (2018-2019).
µ0 1.5 3 4.5 60.75Miles
2019 Moose WVCs (n = 28)
Note: Two outlying moose WVCs are not reflected in this map.
12
Figure 6. All species WVC by month (2018-2019).
Figure 7. Annual mule deer-vehicle collisions on US 89, WY 22 and WY 390 (2010-2019) (annual equals May 1-April 30).

13
Figure 8. Annual moose-vehicle collisions on US 89, WY 22 and WY 390 (2010-2019) (annual equals May 1-April 30).
Figure 9. Annual elk-vehicle collisions on US 89, WY 22 and WY 390 (2010-2019) (annual equals May 1-April 30).

14