j.-p. behr, p. pernards, b. schendeland j. schwandt and simulation as an aidin designing acomputer...
TRANSCRIPT

Modelling and simulation as an aid in designing a computer
J.-P. Behr, P. Pernards, B. Schendel and J. Schwandt
The behaviour and characteristics of a largesystem, such as a computer system, can be analysedin the design stage by making a model of the system and simulating its operation on a computer.The SAMEN/sAMO program package is an aid to this design approach. One of the specialjeaturesof the package is that the system to be simulated isformally described by means of evaluationnets tE-nets'). This description can be used later in executing the simulation.
134
Introduction: modelling and simulation
In the design of computer systems the problems en-countered are similar to those found in the design of atelephone network, a traffic-control system, or apublic-utility building such as a post office, to name afew examples. All these involve a 'system', that is tosay a collection of parts that can each be considered asan independent entity that could function in its ownright, but must also cooperate with the other parts inthe system, use data from them and perhaps wait forthem.
This division into independent parts may be madeat different levels. In the example of the national tele-phone network, a division can be made into districts,or into local exchanges within a district or even, at alevel of extreme refinement, into selectors, steppingswitches and relays within an exchange. All thesecases involve traffic flow. The traffic may consist ofcars, goods, people, etc., but it mayalso consist oftelephone calls, programs, numbers, or, in a very de-tailed case, electrical pulses.
In all these cases there is a flow of traffic that maybe of a random nature, and there is traffic handling,that is to say there are a number of handling stationsthat although essential to the process, can be regardedas obstacles to the flow of traffic. For example, in thesupermarket the situation is determined by thenumber of customers, the number of cash registersoperating, the time it takes for the assistant to attendto each customer and the lengths of the queues.
A very important characteristic of these systems isthat they are 'time discrete', i.e. their activity can be
Dipl.-Ing. J.-P. Behr, Dr Ing. P. Pernards and Dipl-Ing., Dipl.-Wirtsch.-Ing. J. Schwandt are with Philips GmbH Forschungs-laboratorium Hamburg, Hamburg, West Germany; Ing. grad.B. Schendel, formerly with these laboratories, is now with ValvaRöhren- und Halbleiterwerke der Philips GmbH, Hamburg.
Philips tech. Rev. 39,134-149, 1980, No.?
considered as a series of 'events', a series of well-defined instants at which changes occur, and not acontinuous process (such as a chemical process, wherematerials are formed continually and other materialsare used up, while at the same time the quantitieschange continuously). In the example of a post-officecounter, the customer arrives at a particular time, theclerk appears at another definite time and only thencan the transaction start. This transaction may takesome time; at some later time the transaction ends andthe letter or parcel is ready to go on its way.Traffic problems of this kind are generally not very
amenable to mathematical treatment and analysis;insight into traffic situations can only be obtained bymaking a model of the system and using it to simulatethe actual behaviour. The model contains all the sys-tem parameters that are considered to be significantfor its behaviour. In this way its is then possible toderive from the model information such as queuelengths, waiting times and 'throughput' rates.
Models at different levels of detail will sometimesbe required. In town planning, for example, the postoffice may be regarded as a 'black box' where thereare incoming and outgoing streams of people and acertain waiting time, whereas in the design of the postoffice itself it must be divided into doorways, stairsand corridors, counter positions and telephone boxes,etc.
Applications to computer systems
A computer system also has traffic problems of thiskind. Clearly, there is an interaction between the com-puter hardware and the software or programs ithandles. The software can be divided into user pro-grams, and system programs, Le. the programs that

. Philips tech. Rev. 39, No. 5 SAMEN/SAMO . 135
,---------1I II II I
L- ~L-----~~ II ILEi~ _j
Fig. 1.Factory inventory-control system. This diagram gives an impression of the complexity thatmay be present in even a relatively small system. It consists of a computer centre CC, with a P400computer, and three stations: one in the purchasing department PD, also with a P400, one inthe store administration SA with a P300, and a display unit Dis in the store. 1 keyboard. 2 printer.3 cathode-ray-tube display. 4 cassette-memory unit. 5 disc-memory unit. CP central processor.MMmain memory. The asynchronous and synchronous line adapters ASYLA and SYLA and thebuilt-in modulator-demodulator BIM are necessary for information traffic over longer distances.The peripheral adapter PA organizes traffic over short distances.
IP400--- - -.-- - - - - --CC II II II II II II II IIIIIL _
III
--_j
IP400-- --
IIIIIIIIII
are in the system permanently for processing the userprograms. The hardware can be divided into the cen-tral processor, or possibly a number of processors,the various kinds of stores or memories, the variousterminals and the channels linking them all together.
Fig. 1 shows a factory inventory-control system asan example of the complexity that may be found ineven a relatively small system. It is a system with ter-minals and consists of a P400 central computer withthree tributary stations, one of which is another P400computer, one a P300 computer and the other a dis-play station. Each of these stations has the appro-priate peripherals, such as control desks, tape anddisc memories, printers, etc. The system also has
r--------------:--,IP300 SAII CJO II II II II II II I
_____________ J
special equipment for transmitting the signals overlonger distances, such as synchronous and asynchron-ous line adapters. The behaviour of such a systemcould very well be the subject of a simulation study.The traffic inside the system may consist of completejobs, or, in more detail, of individual data, charactersor numbers, or even individual binary digits (bits),which are processed at various processing stationsduring various processing times. In extreme detail thesystem may be seen as a combination of standard elec-tronie circuits and the traffic as the electrical pulsesflowing in the circuits.The study of computer systems by making a model
and simulating their behaviour is very important both
---~----------------------------------------
136 J.-P. BEHR el al. PhiJips tech. Rev. 39, No. 5
in the design phase of the system, so that design faultscan be traced and corrected at an early stage, and inthe marketing phase, so that customer's wishes withregard to the configuration of his installation can beexamined for feasibility and the customer can be ad-vised accordingly. In the following sections we shalltry to give the reader some idea of the programs thathave so far been developed at the Philips Hamburglaboratories under the names SAMO (Simulation AndMOdelling) and SAMEN (Simulation And Modellingwith Evaluation Nets). The examples given have beenworked out in cooperation with Philips GmbH DataSystems, Werk für Daten- und Informationstechnik,Siegen (Federal Republic of Germany).
Models and their description
There are two ways of making models of computersystems. Firstly, a new model could be made for eachnew case. This would probably have the advantage ofgiving fast programs, but it would entail a great dealof programming work. For this reason we have cho-sen a different approach in which the model is initiallykept as general and simple as possible, but the optionsare kept open for greater detailing where necessary.At the same time the structure of the model shouldcorrespond as closely as possible to the structure ofthe system to be studied. As noted earlier, the systemcan be regarded as a collaboration between three sec-tors: the user programs, the system programs and thehardware. This leads to the design of three separatemodels: an 'application-software model' (ASM), a'system-software model' (SSM) and a 'system-hard-ware model' (SHM), which are required to cooperateduring the simulation phase. The application-softwaremodel serves as the origin of all the activities duringthe simulation phase. It consists of a list of jobs oractivities that are representative of the problems theuser will solve with his installation. An extensive andsystematic analysis has been made of some majorapplication areas and a library has been built up ofjobs that are typical in these areas. The list isdescribed in a notation independent of any systemrealization. A choice from this library can be madefor each specific case, to serve as application-softwaremodel for the simulation.
The system-software model consists of a list of themachine instructions to be simulated together with adiagram representing the structure of the operatingsystem.
The system-hardware model has to describe theequipment, possibly including the operator in chargeof the computer system. The model should preferablyhave the same structure as the actual system and is
therefore built up as a number of black boxes andtheir connections. Depending on the amount of detailit may be possible to subdivide the black boxes fur-ther, giving the greatest versatility for the design ofthe model.The system-hardware model and the structure of
the operating system can be described very well by theevaluation nets discussed below. However, since inthe actual system all the processes of the operatingsystem are run on the system hardware, the evalua-tion-net concept had to be extended by the 'ME-tran-sition scheme', which will be explained later.
The simulation procedure
Itmay be evident that a model 'description' impliesthat a recipe can be produced from this description inthe shape of a computer program for simulating thebehaviour of the system on an existing computer. Inevent-controlled simulation the events in the simula-tion model are handled in the same order as theyoccur in the system. The collection of events is split upin a list of 'current events', events that all take placeat the actual instant of model time, and a list of'future events' that take place at a later time. Anevent, such as a signal change at the input of a blackbox, may result in an immediate change at the output- this event is then added to the list of current events- or it may result in some change taking place after acertain delay - which is then introduced as a futureevent and added to the list of future events.This process of tracing the results of one event is
carried out for everyone of the events that occur inthe list of current events. When this list has beenworked through completely, the lists of future eventsfor all the black boxes must be searched to find theevent next in time and all other events that occur atthe same time. They must then be arranged as a newlist of current events to be worked through. The treat-ment of a certain event may therefore introduce othercurrent events as well as future events. For this wholeprocess the application-software model should insome way generate the input events. The execution ofthis process on a computer, i.e. searching, rearrang-ing, adininistering times and events and the computertime it takes, has nothing to do with the real-timeduration of the process being simulated.
The SAMEN/SAMO program package
Methods of system description have been devel-oped 'at Philips Hamburg and used for the simulationof systems, resulting in the SAMEN/SAMO programpackage. To keep the system. description clear and dis-

Philips tech. Rev. 39, Nr. 5 SAMEN/SAMO 137
tinct and yet as versatile as possible, the system isdivided .into subsystems with their interconnections ..The subsystems can be treated as individual blackboxes or further subdivided as required. At the moregeneral SAMO level of the SAMEN/SAMO program pack-age the description of the subsystems follows a con-vention called BOMOL (BOx-MOdel descriptionLanguage), whereas the connections are described inCOMOL notation (COnnection-MOdel descriptionLanguage). Both are best illustrated by an example.
Fig. 2. Model structure and its con-nection description. a) Model struc-ture built up from live 'black boxes'types 22, 25, 31, and 54. b) Theconnection description in COMOL.(General form: er (output terminaldenotation} = (input terminal de-notation}.) The letters er, eb derivedfrom 'real' or 'Boolean' precedingthe connection indicate the type ofsignal at the connection.
cr 31.1.2 = 22.1.2
cr 31.2.2 = 22.1.1 + 25.1.2
cr 31.3.2 = 25(1 + 2)1
shows six variations of such designations, whichshould be self-explanatory in conjunction with fig. 2a.With these conventions it is obviously easy to
ensure that information appearing at an output ter-minal during the simulation is passed on to the appro-priate input terminal.It is not nearly so easy to describe the characteristics
of the BOMOL conventions for the description ofblack boxes, because of the freedom with which theuser can define the functions of a black box. His def-
a
basic form
-multlple connection, expressed by the plus sign
multiple connection; equal numbers are taken out-side the brackets
er 22.1.1 = 31(1 + + 4)2 + 25.2.2 complex multiple connection; two plus signsmean 'from ... to'
er 31(1 -2- 3)1 = 32(2 -3- 4)1} repeti~ion ~f similar ~onne.ctions, ex~ressed b~er 31(1 - - 4) = 54(1 - - 4)1 the minus sign; two minus signs mean from ... to b
Fig. 2a shows a diagram of a network of elevenblack boxes, belonging to four different types, in-dicated by type numbers 22, 25, 31 and 54. Differentboxes of the same type are given rank numbers, e.g.54.1 to 54.4, thus allowing for an arbitrary number ofcopies of a type that has already been described.The basic form of the COMOL notation for a con-
nection reads as follows:
er (output terminal denotation) = (input terminaldenotation) .
The letters er indicate that this connection will becarrying signals with arbitrary values, called in mostprogramming languages real variables, as distinctfrom cb for connections carrying Boolean (Le. logic)variables. The sequences ( ) must be replacedby the actual designations for the type of box, therank number of the box, inputs and outputs. Fig. 2b
initions can include the use of state diagrams, flowcharts and evaluation nets, or just verbal descriptions.The method of evaluation nets will be dealt with morefully in the next section; here we shall discuss the sit-uation given in fig. 3. A black box, which should beknown by a type number, is shown in fig. 3a, with twoinputs and one output. The timing diagram and theverbal description define the process that takes placeinside the box. The BOMOL descriptionis based onthe use of ALGOL as a programming language; thestructure of these programs as well as a number ofconventions to be used, e.g. for the identifiers, arelaid down as the rules of BOMOL. Thus the labellingof the inputs as ai[1] and ai[2] and of the output as aois part of the BOMOL conventions, which say thatBOMOL symbols with a standard significanee must
(1) K. Lagemann, Das Simulationsprogrammpaket "SAMO",Angew. Informatik 16, 488-492, 1974.
'begin''own"integer' h;'own"boolean' 5;
ami1: 'if' ai[1] -:f 0 'then"begin' h: = ai[1]; 'gota' amv; 'end';at[1]: = atmod + ('if' 5 'then' 20 'else' 15); 'gota' amv;
ami2: 'if' ai[2] = 0 'then' 5:= 'not' 5; 'gota' amv;amt1: ao := 'if' h = 25 'then' 29 'else' 19; at [2] := atmod + 25; 'gota' amv;amt2: ao := 0; 'gota' amv;
'end'; c
138 J.-P. BEHR et al. Philips tech. Rev. 39, No. 5
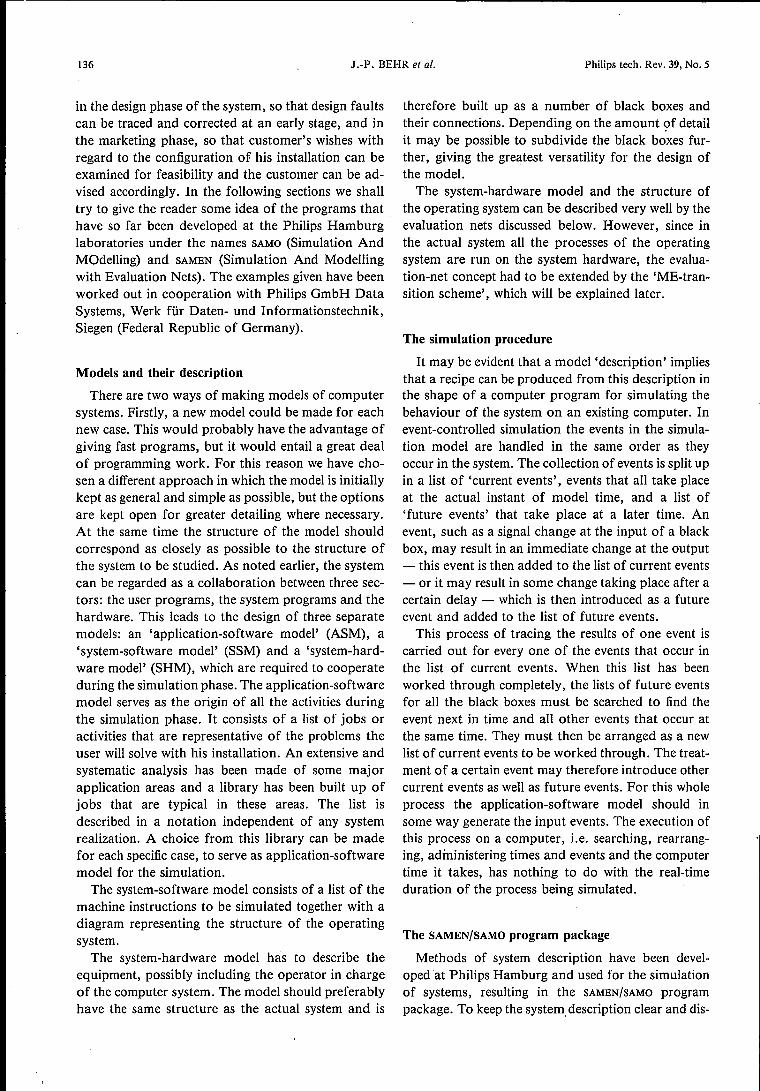
Fig. 3. Various stages in the black-box description in SAMO.
.--=,/ 17 .-------r',- 25atltl -'-l-J--!--------'---t.---------, ,
t _19 t "-__ ----'-1-29: 'I 1 .00
sunUaoaif2]
: ad,=20 ad2=25: lad,=15: ad2=25 :• 'l I I
I I
" , I 1 I r===l5
+ + + + + taif2] _,rlL......L_....JrlL....-..L.....Ir==lL....--'-_....Jc:=iL....--'-_L.r==l_-'-----'rl--L. __ a
a) Timing diagram and verbal description. The black box is characterized by the following rules:- 0-1-0 signal sequences are transmitted to input ai[2]; the 1-0 transitions effect an instantaneouschange in the Boolean parameter s.- Each trailing edge of the pulse sequence transmitted to the input ai[J] generates a pulse oflength ad2= 25 time units after a delay ad, at the output 00.- The delay aä, totals 20 or 15 time units, depending on whether the state variable s has thevalue 1 or 0 when the delay starts.- The input amplitude at ai[l] can have either of the values 17 or 25 selected at random. Thecorresponding output amplitude becomes 19 or 29 respectively.
ami1 ami2 amt1 amt2
+amy
amy
amy amy amy b
b) The flow chart.
c) Description in BOMOL (BOx MOdel description Language). Characteristics of BOMOL are:- The programming language is ALGOL.- All changes at the inputs are represented by means of entry-point labels ami; thus signalchanges at input ai[2] are represented by entry-point label ami2: in the case of a trailing edge thevalue of s changes. Similarly for changes at input ai[l] entry-point label amil is used: after a lead-ing edge (Le. ai[l] T 0) the signal value is stored in an auxiliary variable h. After a trailing edgethe delay time ad, = 20 or ad, = 15 is set to a value depending on the value of s.- Delayed actions inside a black box are represented by entry-point labels amt; thus after a delayad, operations are resumed via entry-point label amtl; the start for delay ad2 =25 is initiatedhere; the next action, resetting the output signal 00 = 0, takes place via entry-point label amt2.- All predetermined identifiers start with the letter a. Arbitrarily chosen identifiers such as hands must be declared at the beginning of the program.- Exits are represented in the program by 'goto amu' .
. start with the letter a. In fig. 3b the model descrip-tion is translated into a flow chart. A BOMOL con-vention for reading this chart is that every eventtaking place at an input ai[l] (e.g. a signal change atai[lD gives access to the flow chart at label amil, and
accordingly for input ai[2] at label ami2. When theformer happens because ai[l] becomes equal to 0 at atime recorded in the variable atmod (model time), afuture event (the start of the output signal) will beproduced after a delay ad, and an 'alarm clock' is set

Philips tech. Rev. 39, No. 5 SAMEN/SAMO 139
to atmod+ad, to record this future event. The flowchart shows that, in accordance with the description,the value of ad, depends on the value of s.
BOMOL allows a set of several of these alarms tobe arranged in a clock array: at[I], at[2], etc. Whenthe moment for treating the future event al[I] hasarrived, the program is entered via label amtl, and.accordingly through label amü for the time recordedas at[2]. After dealing with the event in question, theprogram leaves the treatment of the particular box, totreat further boxes occurring in the list of currentevents for this same instant atmod. The way in whichthis is organized cannot be discussed here: it takesplace in a supervisory area of the SAMO simulation-program package.
From the diagrams in fig. 3b it is now easy to writethe actual program as an ALGOL program. Othervariables the user requires, apart from those with astandard BOMOL significance, such as hand s in ourcase, have-to be declared at the start of the programin the normal way, e.g. 'own integer h' and 'ownBoolean s' (see fig. 3e).
Evaluation nets
In order to offer the user additional support inmodel description, evaluation nets were chosen as aformal description method, and a 'SAMEN level' wasadded to the simulation-program package. The SAMEN
description of the black boxes, based on evaluationnets (E-nets), can replace the BOMOL part of thesimulation program. E-nets, introduced by G. J.Nutt [2], as an extension of Petri nets [3], have provedto be the most satisfactory of all methods for describ-ing time-discrete processes [4,5]. We shall explain theE-nets from the example of a post-office counterposition. The situation is characterized by the factthat a clerk and a customer are both required for thetransaction.
In the pre-serving situation only one of them isavailable. As soon as both are present we have a'transition' to the serving situation, which may lastfor some time. At the end of this situation, we have atransition to the post-serving situation, where theclerk is free to help a new customer and the earliercustomer is free to leave the post office. This secondtransition would involve no handling time.The E-net for this example is shown in fig. 4. The
two transitions are indicated by the vertical bars aland a2. The two requirements that characterize thepre-serving situation, the clerk and the customer, areshown as 'locations' bI and b2; the serving situationis indicated by one location b3, and the free customerby the location b4. The locations show the potential
requirements; when they are fulfilled this is shown byplacing a 'token' in the relevant location. A transitionis said to 'fire' - e.g. the transaction starts - as soonas the input locations have received a token and theoutput location has become empty. After a transitiontime (if necessary), tokens from the input side moveover to the output side, leaving the input locationsempty. In this way a flow of tokens through the E-netrepresents all the transactions in the system.
-®-01 02
Fig. 4. Evaluation-net description of a post-office counter position.al and 02 represent 'transitions': al indicates the start of the trans-action and 02 its end. bl to b4 represent 'locations', Le. potentialrequirements. bl clerk available. b2 customer has entered postoffice. b3 clerk serves customer. b4 customer ready to leave postoffice. When a requirement is fulfilled, the location carries a'token' .
Tokens may carry with them, in the form of 'attri-butes', information required in the process; e.g. thecustomer token might carry as an attribute the hand-ling time for the customer's particular problem. Inthis case the transition al would have to look up thisattribute and adjust the transition time accordingly.Also, attributes might change their value in the courseof the transition.Fig. 5 shows the five basic types into which transi-
tions are usually subdivided. In addition to the 'tran-sition procedure' that determines how the attributesare modified and the 'transition-time procedure' thatdetermines the transition time, the X- and Y-transi-tions also require a 'resolution procedure' to deter-mine the routing of the tokens (indicated by 'r' infig. 5). While working with E-nets it was found thattwo additional types of transition were required [6] :
the TI-transition, for indicating transitions that canbe interrupted and terminated to simulate interruptsand failurès in computer systems (fig. 6), and the
[21 G. J. Nutt, Evaluation nets for computer system performanceanalysis, AFIPS Conf. Proc. 41, 279-286, 1972.
[s] C. A. Petri, Kommunikation mit Automaten, Thesis, Bonn1962.
[4] J.-P. Behr, R. lsernhagen, P. Pernards and L. Stewen,Modellbeschreibung mit Auswertungsnetzen, Angew. Infor-matik 17, 375-382, 1975.
[6] J.-P. Behr, R. Isernhagen, P. Pernards and L. Stewen,Erfahrungen mit Auswertungsnetzen - Implementierung,Alternativen, Angew. Informatik 17, 427-432, 1975.
[6] L. Stewen, Auswertungsnetze als Hilfsmittel zur Modell-bildung - Probleme und deren Lösungen, Lecture Notes inComputer Science 34, 462-474, 1975.

140 J.-P. BEHR et al. Philips tech. Rev. 39, No. 5
T- transition ~ T(a,c}
J - transition(join) ~ JIG,b,c)
~0V---1-0 F(a,c,d}F- transition(fork)
Y- transition(input selection) Ylr.a.b.c )
X - transition(output selection) Xlr.a.c.d )
Fig. 5. Basic transition types in evaluation nets. A transition is saidto 'fire' if' the input locations contain a token (Le. if the inputconditions are fulfilled) and the output locations are empty. The fir-ing may take some specified transition time (delay). As soon as thishas elapsed tokens from the input side move over to the outputside. The J-transition thus requires two tokens in a and b toproduce one in c after firing. For the F-transition, one token in aafter firing produces tokens in c and d. The Y-transition maydescribe a conflict case: when a and b are both full at the instantwhen c becomes empty, priority is controlled by a resolution proce-dure given by r. On the other hand if only a or b contains a tokenwhile c is empty the token is moved without calling the resolutionprocedure. Such a procedure in the X-transition determines therouting of tokens to c or d.
ca
Fig. 6. TJ-transition. The TJ-transition is. a T-transition with aspecial interrupt input location b. It behaveslike a T-transition and'fires' in the normal way if b does not contain a token, i.e. after aspecified delay, the token in a moves on to c. If b receives a tokenwhile the TJ-transition is in the delay phase (interrupt condition) itfires immediately, regardless of the remaining transition time. Atoken arriving at b has no effect if a is empty.
ME-transition to indicate the change from a low-detail to a high-detail level of description (jig. 7).
Fig. 8 shows a simple example of an E-net for acentral processor CP with two peripherals or ter-minals, Tl and T2. Jobs come in from the terminalsinto locations bI and b2. As these locations belong toboth CP'and terminal, they are shown as semicircles.Tokens in this example have two attributes: K(l), thenumber of the terminal of origin, and K(2) the pro-cessing time for the particular job.
Tokens in the E-net are not in fact usually shown;their positions would only allow a rendering of an in-stantaneous situation. Keeping track of these move-ments is the task of the simulation program. It doesthis by numbering tokens as they enter the system andkeeping a record of which token is in which location.If bI and b2 should simultaneously receive a token
while b3 is empty, the resolution rule rl determineswhich of the two may go through first. Transition a2refers to taking over the job into the main memory,which can only be done if the central processor is notengaged (indicated by b5 empty and b4 occupied).Transition a3 refers to processing by the central pro-cessor, with the time required taken from the secondattribute of the token. When the processing has beencompleted and the token arrives in b6, the resolutionrule r4 determines which terminal the results shouldreturn to from the first attribute of the token.
The SAMEN input conventions
E-nets not only have the advantage that they pro-vide the user with a clear insight, in the form of adrawing, into the structure of his problem; they canalso be clearly described in a formal manner. This isessential when producing the simulation program [5].
As an examplejig. 9 shows the transition a4 of fig. 8.This is an X-transition with locations b6, b7 and b8and a resolution rule r4. Since the action is only achoice, there is no transition time involved for bothroutings and no transition procedure is necessary forchanging the attributes. Fig. 9a shows the way this isdescribed formally as defined by Nutt. The part Sgives the structural information, T the time informa-tion and Q the transition procedure. The notationb6[2] indicates that the tokens have two attributes,which are denoted by b6(l) and b6(2) in r4. M(x)means 'value of x'. The notation used here closelyresembles the ALGOL notation. It is therefore easy tochange it into the SAMEN description given in fig. 9b.(Symbols with a standard significanee in SAMEN startwith the letter b.) Here BXPTRA is the name of aprocedure written in ALGOL that handles the X-tran-sitions in accordance with the given parameters. Thisprocedure, like the analogous procedures for all theother basic transitions, is a standard ALGOL pro-gram for SAMEN, and in fact together with the SAMEN-
control routine these procedures constitute the SAMEN
'language' .In the example BXPTRA ( •••••••••• ), QO is the
name of an 'empty procedure' that produces no re- .sults. SAMEN also arranges the tokens, which are num-bered on entry, in an array of locations such that B(i)represents the number of the token residing in loca-

Philips tech. Rev. 39, No. 5 SAMEN/SAMO 141
ti on i at that moment and B(i)(l) its first attribute.Thus, B6(l) denotes the first attribute of the token inlocation 6. In this way all the transitions inside a blackbox are described. As the input locations of one tran-sition are output locations for another, the intercon-nections are automatically established. It is thus pos-sible to establish the E-net description in SAMEN foreach of the black boxes separately: CP, Tl and T2.From this the SAMEN translator can make a completeALGOL program to carry out the simulation.
Interactive model and simulation studies
A very important aspect of the use of computers asan aid in the design of systems is the interface betweenthe user and the computer installation. The provision
®-~@1b5
b4
Fig. 7. ME-transition. This transition is useful in hierarchicallystructured systems i.e. systems described at different levels ofdetail. In the symbol on the left the double-headed arrow refers tolocations b4, b5, at a description level of greater detail, and theactions in question are either taken into account in the transitionfunction of the transition on the left, or the actions are followed indetail at the lower level, as indicated in the equivalent diagram onthe right. An example of such a situation might be found in themodel for an operating system, where every transition correspondsto different, possibly complicated, activities of the hardware.
i-------cp-------iI I
02 03 I
04 I
I
I
I
-__j
Fig. 8. Simplified model or a central processor with two peripheralsor terminals. Only the E-net for the central processor is given.Locations that are common to processor and terminal are shown assemicircles. The locations have the following significance: bI jobfrom terminal 1. b2 job from terminal2. b3 job requesting CP. b4CP is idle. b5 CP is busy. b6 CP has finished job. b7 job from Tl iscomplete. b8 job from T2 is complete. The resolution procedures:,.1 chooses job from TI or T2; r4 routes job to b7 or bB. The jobtokens have two attributes: K(2) to represent processing time, andK(1) to represent the terminal number. The transition time of tran-sition.a3 is therefore taken from K(2) and the resolution procedurer4 will inspect K(1) to determine the routing.
of terminals in the designer's office and dialoguefacilities with the host computer system are a greathelp here. These considerations led to the writing of aset of programs called IMOBS (Interactive MOdelBuilding and Simulation), which is arranged in twoprogram packages.
The package GIPSIE (Graphical Interactive Programfor SImulation with Evaluation nets) can be used tobuild up the diagram of an evaluation net on agraphic-display terminal. Transitions, input and out-put locations and their connections can be displayed atany desired position on the screen. Instructions can bekeyed in to shift parts of the figure or remove them.An example is given in fig. 10, showing how the userof IMOBS can obtain the model of fig. 8 on the screen.If the result is satisfactory, the GIPSIE program canderive the data for the structure of the net from thegraph on the display screen and generate the appro-priate program codes in accordance with the SAMEN
conventions. The second program package, calledDIMPLE (Dialogue IMPLEmentation package) can beused in a dialogue with the computer to enter valuesof the model parameters and prepare the simulation.
Presentation of results
Every user of model-simulation techniques willhave his own ideas about the presentation of theresults. In testing an actual system he will select very
a4 = (x(r4,b6[2J,b7[2J,b8[2]), (0,0), - )'-- .....- ....1 L.......-J ............
STa
ar4: [(M(b6(1))
(M(b6(1))1) ~ M(r4):= 0;2) ~ M(r4) := 1]
'INTEGER"PROCEDURE' R4;R4 : = 'IF' B6(1) = 1 'THEN' 0 'ELSE' 1;
b A4: BXPTRA (6,7,8, 0,0, 00, R4);
Fig. 9. Example of the coding of a transition. a) Formal descriptionof the transition a4 in fig. 8 as initially defined by G. J. Nutt. Sec-tion S defines the transition itself, Tspecifies the transition time andQ the transition procedure. b6[2l indicates that a token in locationb6 has two attributes. In the description ofthe resolution procedurer4, M(b6(l)) denotes the value of the first attribute of the token inlocation b6. b) Coding of the same transition in SAMEN. Here itshould be known that the tokens are numbered on entry and that inSAMEN all the tokens of a black box have the same number of at-tributes (here two) so that they can be organized as a matrix. Thenumber of the token residing in location i is stored under B( I).Thus B6(1) denotes the first attribute of the token at location 6. InSAMEN BXPTRA( ...•. ) is a standard procedure representing the X-transition. Its parameters have the following significance: 6, 7, 8:input and output locations. 0, 0: transition times for both direc-tions, QO: transition procedure (QO happens to be an 'empty'procedure, i.e. one that has no effect). R4: resolution procedure.The symbol := should be read as 'becomes' or 'gets the value'.
[71 J.-P. Behr, GIPSIE, ein Programm zur interaktiven grafischenModellbildung mit Auswertungsnetzen, Angew. Informatik20, 60-65, 1978.

142 J.-P. BEHR el al. Philips tech. Rev. 39, No. 5
Fig. 10. E-net for the example of fig. 8 as produced with GIPSIE. This print of the information onthe screen shows that some of the symbols differ from the original form. To save memory spaceand computer time, locations are not represented by circles but by a kind of arrow. The transitionnumber is shown in a rectangular 'frame' underneath the transition; this frame is open on bothsides (as in the example here for all the transitions) if there is no transition procedure (the proce-dure is 'empty' and denoted by QO); otherwise the frame is closed. A rectangle above the transi-tion shows the transition time if this is a constant; if this rectangle is empty, the transition time isevaluated by a transition-time procedure. A constant value in a resolution location characterizes afixed priority sequence, starting at the given value. The input and output locations contain extrainformation required for the SAMO connection net.
Model Real inputs Boolean Modeltime input time
1 2 3 10 »>+ 01 »>- i 12 »>+ I I 23 I I <+<* 34 I «<* I »+ 45 »>*+ I I 56 I I i 67 I »»>+ I I 78 I I i «* 89 ««* I >*»>+ 9
10 »»>+ I 1011 »>- I I 1112 I I I »+ 1213 I ««<* I I 1314 «<* I I 1415 »>+ I I 1516 I ««<* I 1617 »»»+ I I 1718 I I I 1819 I I I 1920 «««* «<* »>+ «* 2021 »>- I 2122 »>+ I I 2223 I I <+<* 2324 I «<* I »+ 2425 »>*+ I I 2526 I I I 2627 1 »»>+ I I 2728 I I I «* 2829 ««* I >*»>+ 2930 »»>+ I 3031 »>- I I 3132 I I I »+ 3233 I ««<* I I 3334 «<* I I 3435 »>+ I I 3536 I ««<* I 3637 »»»+ I I 37
specific points for meas-urement and a suitablemeasuring instrument foreach point. This facilityshould also be available tothe user of a simulationmodel. In BOMOL he cando this by introducingevery measuring instru-ment required as a black-box model and connectingit to any desired point bymeans of the connectionnetwork in as many waysas he wishes. A library ofmodels of a number ofstandard instruments, e.g.a multibeam oscilloscope(see fig. 11), is alreadyavailable in the form ofBOMOL programs and aBOMOL description canbe made if required forany special instrument. Itis even possible to create
measuring instruments that do not in fact exist butwould be useful for the application, e.g. instrumentsin which measured results are processed immediately.Results of various simulations can also be storedprovisionally in the memory for subsequent com-parison and processing, for example to evaluate themstatistically, to draw histograms or to makegraphs, sothat in the end a diagram can be produced directly asillustrated in fig. 12.
Study of a terminal system
As a final example we shall give a rather more de-tailed discussion of a simplified model of a terminalsystem, consisting -of four terminals and a centralprocessor, as shown in fig. 13. In the example, whichis an extension of the one of fig. 8, both kinds of de-scription (SAMO and SAMEN) will be used. However, weshall first describe the system and how it presents itselfto the user.Let us start to examine the problem at the moment
when a user is thinking about the formulation of a
Fig. 11. Simulation results in the form of a pulse diagram. Whensimulating at a very detailed level, e.g. at a circuit level, a pulse dia-gram is a common method for presenting results. SAMO thereforeincludes a standard black box for presenting input and outputvalues as a pulse pattern.

Philips tech. Rev. 39, No. 5 SAMEN/SAMO 143
new job. During that period the terminal remainsquiet. The time spent thinking in this model is ob-
o tained from a random process called 'ranerl' in theprogram. When the user has finished thinking, he can
'17cP
1 60
100%
Ir" ...........
I' 'J'.....I
II OS.........
",,""",,"
./
""......._ ......._,"
80
40
20
16 32__ n 48
Fig. 12. Simulation results as a plot. The central-processor utiliza-tion liep is plotted against the number of terminals. The solid curverepresents the total utilization, curve U the contribution from theusers and curve OS represents the contribution from the operatingsystem.
MBO1 2 3 4 5 6 7 8
II
T1 II
II -T2 I I I
l-_.
ICP
I II
IT3 I ,---.
I r---+'
II
T4 II
Fig. 13. Block diagram of a system with one central processor, fourterminals Tl to T4 and a measuring instrument (e.g. a multiple-beam oscilloscope MBO) for displaying the signals flowing betweenthem).
start to type in his job at the terminal, provided thecentral processor has finished any previous job startedat this same terminal. If not, the user has to wait untilthe central processor indicates that the previous jobhas been finished. A list of waiting times or perhapstheir distribution could be one of the results from thesimulation. In this model a fixed period of time istaken for typing. At the end of this period a request issent to the processor and the input data, which wastemporarily stored at the terminal, is sent een bloc' tothe processor, provided the buffer set aside for buf-fering input data is free to accept the information. Aswell as feeding the problem into the buffer, additionalinformation has to be read from the disc memory. Inthis model a fixed time period is allowed for this taskas well. When the central processor has finished theprevious calculation,' the processor transfers the newproblem information from the buffer into the mainworking memory and the processing of the new jobcan start. Once again it should be noted that the sim-ulation of. the behaviour of an installation has nothingto do with the actual execution of computations,because this is not necessary to obtain the results men-tioned above. Simulation only covers the admin-istration, registration and recording of traffic flowinginside the system. The signals treated during the sim-ulation are all of the kind: 'user is thinking', 'typingstarts', 'typing ends' and so on. Durations are eithertaken as constant or taken from statistical informa-tion derived from actual practice.
In this example the application-software model(ASM) and the system-software model (SSM) arereduced to the minimum, and at first glance it seemsthat only the hardware model remains. The ASM is tosome extent represented in the random process for de-termining a thinking time. The SSM is less clearlydistinguished; it would affect the job-processing time,which is now generated statistically. It could be saidto be present in this random process ('rapois' in theblock diagram) inside the terminal.Diagram I illustrates the traffic as it is during the
first part of the simulation run. This event list gives animpression of the kind of situations that may be ex-pected in actual practice.
The model description at the SAMO level
The model is described in two types of black box,box 1 for the processor and box 2 for the terminals.Box 2 is thus present in four copies. Box 2 has oneinput ai for signals coming from the processor, andone output ao for signals going to the processor. Thecentral-processor box has four inputs, ai[l] to ai[4],connected to the outputs of the terminals, and four

144 J.-P. BEHR el al. Philips tech. Rev. 39, No. 5
CPNTo4
2427293252555860627881100106108120123124129131143144146147162164166167172190192195210211213216231243245247250258260273278283285288293303305318320323327331338345348351366385387390391405415417420435438448450453457468474476479494503505508523536538540541554556559579582592594599
T1 T2 T3 T4 Disc Buf Mem Proc MTo4
2427293252555860627881100106108120123124129131143144146147162164166167172190192195210211213216231243245247250258260273278283285288293303305318320323327331338346348351366385387390391405415417420435438448450453457468474476479494503505508523536538540541554556559579582592594599
Diagram I. Event list of part of the simulation of the behaviour ofthe terminal system of fig. 13. The model time MT is shown at theleft and right. The left-hand half of the diagram shows the periodsthe user spends at the terminals I to 4 in thinking about a problem(black line in the left-hand position), the periods when he is typingthe problem in (black line in the right-hand position) and theperiods when he has to wait before he can start to type (blue line).The right-hand half of the diagram shows the periods in which thecentral processor is reading from the disc memory Disc, the periodswhen the buffer Buf is full and the periods when the main memoryMem is being loaded. The column Proc indicates the activity of thecentral processor; the numbers I to 4 show which terminal the cen-tral processor is working for. The red arrows show how the eventstrigger other events. The thin green lines are only intended to showthe 'history' of a job more easily.
The simulation shows that users soon have to wait for typing inbecause previous jobs at that terminal have not been finished.Reading from the disc memory first starts as soon as a terminal in-dicates that a new job has been typed in, but later it can only startwhen the buffer is empty again. It might have been more logical toshow the buffer as 'full' from the moment when reading from discstarts, in the same way as it is recorded as 'empty' when loading themain memory has ended. This choice has been based on the factthat the SAMO flow charts and results only relate to 'events' and therecording is not continuous. (Note that equal times do not corre-spond to equal line lengths.) At model time 417 it happens for thefirst time that when the buffer becomes free, terminal Tl and ter-minal T4 both have a job ready, and the priority rule comes intoforce. This happens again on several other occasions and the treat-ment of terminal T4 is therefore postponed until model time 556.
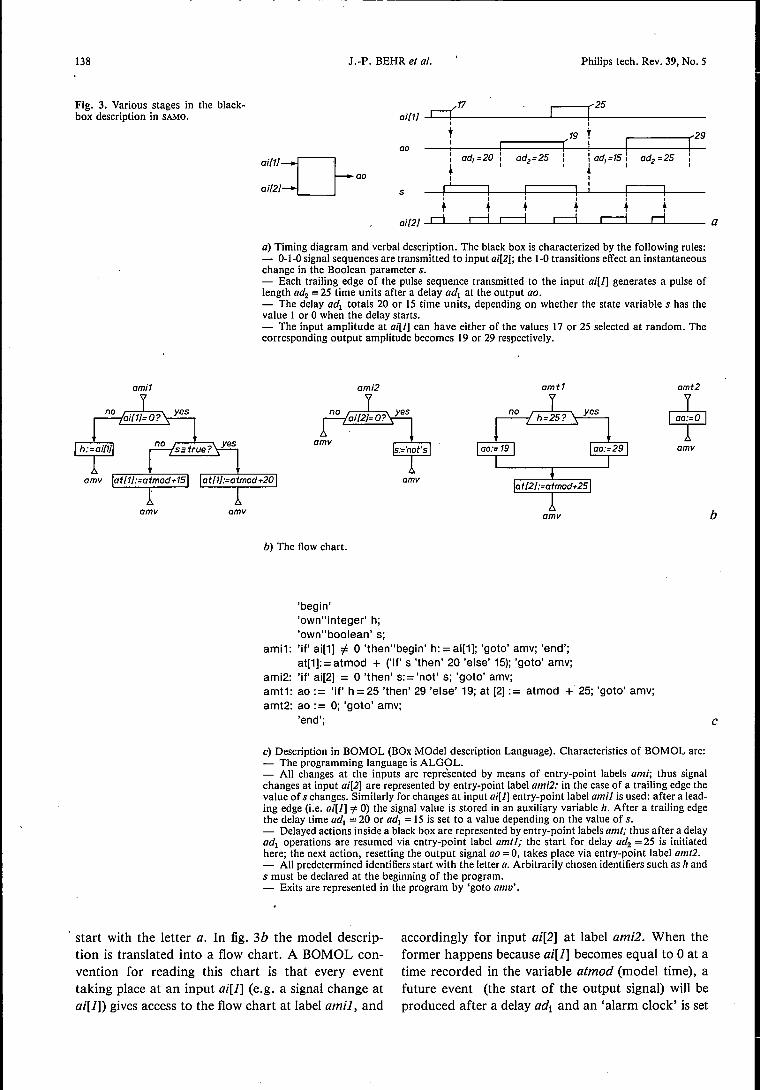
outputs, aa[I] to aa[4], connected to the inputs of theterminals. As already explained, the programs arewritten as ALGOL programs with the BOMOL con-ventions. The program structure is given in the flowcharts fig. 14 and fig. 15. Every signal change at aninput causes the program to enter at label 'ami'. Theterminal box employs two 'alarm clocks' (see p. 138),one set to mark the end of the thinking period and re-corded as al[I], the other to mark the end of the typ-ing period and recorded as al[2]. A fixed period of 20units of time is allowed for the typing. When theseevents occur, the program is entered at amt I or amtzas appropriate. The method of starting the program,e.g. by calling up the procedure 'think' is not shown(in the actual program these actions are taken in theinitialization phase by entering through the labels'amnr', 'amse' , and 'amop'). The processor box isslightly more complicated; three alarm clocks are re-quired here. The end of reading from the disc memoryis given by al[l]; a fixed duration of 3 units is allowedfor this operation. The end of loading the main mem-ory is marked by al[2]; a fixed period of 2 units is usedhere. The end of processing for the job is given byal[3]; the duration is determined at the terminal wherethe job was initiated by means of the random process'rapois', and handed over to the processor as thevalue of the output signal from the terminal. Thissignal therefore has a double function: it signals theevent 'typing finished' and carries the informationabout 'processing time'. The processor inputs 1 to 4are strobed for signals in such a way that the lower
Philips tech. Rev. 39, No. 5 SAMEN/SAMO 145
terminal numbers have a higher priority than theothers. More detail will be found in fig. 16, whichgives the full BOMOL descriptions, known as 'MacroBQ1' and 'Macro BQ2'.
In fig. q the introduetion of the instrument 'mul-tiple-beam oscilloscope', whose standard descriptionis available in the SAMEN/SAMO program library, wasincluded to demonstrate that it can be done and toobtain a simplified version of the diagram I from the
ami1 2 3 4
r----yY,=1.2.3.4-lI II yes ai/yyl.O? na II II II innrb:=yy iI delayb:=ai/yyl II II at/1/:=atmad.3 II II IL__ ___j
amv
amt1
amv
amt2
full:=O
empty:=1
at 3 :=atmod. delay
ami
amt3
amv amt1
ibuffer empty or coincident inputsfrom terminals?
isearCh for terminal requiring handling/ai[11 highest. ai/4/lawest priority)
-{ request from terminal yy ?
-{buffer conditionally reservedfor terminal yy
-[ input number set equal to terminal number
-[ processing time derived from terminal
-[ start of reading from disc
-{ end of reading from disc
-{'signal accepted'message to terminal
-{ buffer full
-{ processor idle?
-{ start of loading into main memory
-[ processor active
-{terminal numberprocessing time
-{ end of loading
-{ buffer not full
-{ buffer empty
-{stort of processing/start of execution of job)
i test for new input signals
-{ end ~f processing
-[ processor idle
-[ response to terminal
-{ buffer full?
-{ loading into main memory starts
Fig. 14. Flow charts for the most important part of the central pro-cessor (box BQ]).
other results of the simulation run. In the COMOLdescription of the connection network, which isshown in fig. 17, this instrument has been left out.
The model description at the SAMEN level
The description of the complete example in termsof evaluation nets takes on the shape of the diagramsshown in fig. 18, which were generated by means ofthe program package GIPSIE. The processor black boxis only slightly different from the one given in fig. 8.Four transitions can be distinguished: first, themessage from the terminal indicating that a new job isarriving and the read-out of additional informationfrom the disc memory with a fixed transition time of3 units. Second, loading the job into the main mem-ory under the control of the processor: here the fixed
aml1-[ message from processor
-{previous job coming from this terminalstil! under processing ?
'-='-T-':.::J -{no meaning for the processor
-[previous job has been finished
-{ terminal user ready to type in ?
-{ start of typing at the terminal
amv
amt1 iterminal user has finished thinkingabout the next job. ready to type In
-{ measurement of waiting time
-{generation of value of processing timeby Polsson distribution
-{terminal user ready to type in
-{previous job from this terminal already finished?
amv
amt2-{ typing finished. signal sent to processor
-{ catculation of waiting time
-{output set to value ra. indicating job time forprocessor
-[ terminal user thinks about the next job
-{still thinking
-{ typing cannot start yet
amv
-{procedure ·think· sets thealarm clock at/1/
Fig. IS. Flow charts for the most important part of the terminal(box BQ2).

100. $MACRO BQl j200. 'BEGIN'300. 'COMMENT'~OO.500.bOD.700.HOD. 'BEGIN'900. 'OWN' 'INTEGER' INNR, INNRB, IDLE, EMPTY I FULL I DELAY, DELAYBj
1000. 'INTEGER' XX,YYjliDO.1200. 'SWITCH' AHSTART: :AHNR I AMSE, AHDP, AHT1, AMT2, AMT3, AHI, AMI, AHI, AHI j1300.'GOTO' AHSTARTUAJX/);I~OO.1500.AMNR: ATl::3j AIZ::4j AOZ:=4j 'GOTO' AHYj1bOO.AMSE: IDLE::EHPTY::1 j FULL:=Oj AFEHL::Oj 'GOTO' AMY;1700.I~OO.AHI:1900.2000.2100.2200.2300.2~00.2500.2bOO.2700.2~00.2900.3000.3100.3200. AHTI:3300.3~00.3500.3bOO.31.00.3~00.3900.~000 •~ lOO.~200.~300.~~OO. AMT2:~500.4bOO.~700.~~Oo.~900.AMT3:5000.5100.5200.5300.5~00 •5500. 'END' BOX 1 j5bOO.5700. $MEND j
100. $MACRO BQ.::?j200.$OC 23;300.$DC 29;400.$DC 1 j500.'B£GIN'bOD.' COMHENT' TERHINAL TO BE CONNECTEDTO PROCESSORBQI,700. ATUI/J : PRE-THINKING AT THE TERMINAL,HOD. All12l) : TYPING,900. AlllIl) : 1 = RESPONSE FROMPROCESSOR;
lOOO.'OWN' 'REAL' OXX,OYY,RO,Rlj1100. 'OWN' 'INTEGER' LAI,WAITDIj1200. 'OWN' 'BDOLEAN' POLSSWIj1300. 'SOOLEAN' FEHLERjl~OO.'INTEGER' Tj1500.ieoo, 'PROCEDURE' THINKj1700.'BEGIN'lUDO. RANERL ll/50,',OXX,T,FEHLERJj1900. ATl/l/J::ATMOD+Tj2000. 'END' THINK j2100.2200. 'SWITCH' AHSTART : =AHNR, AMSE, AHOP, AHT1, AMT2, AMI 1 j2300. 'GOTa' AMSTARll/AJX/J;2~00 •2500.AMNR: ATl::.::?; AIZ::1 j AOl::' j 'GOTO' AMYj2bOO.2700. AMSE:2HOO.2900.3000.3100.3200.3300.3.00. AMTI:3500.3bOO.3700.3HOO.3900.qOOO.q lOO..200. AMI I:q300.qqOO.q500.qbOO.q700.qHOO.q900.5000.5100.5200.5300.5qOO.5500. AMT2:5bOO.5700.SHOO.5900.bOOD.bIOO.b200.b300.b40U. 'ENO' HOX 2jb~UU. $Mr:NU j
146
a
b
PROCESSORCONNECTEDTO q TERMINALS VIA AIUI ••• q/),AlllI/J WITH HIGHEST, All/q/J WITH LOWEST PRIORITY,ATUI/J: BUFFERING ON FLOPPY DISK,AH/2/J: COMPILING, LINKING, LOADING,ATl/3/J: PROCESSING;
'IF' EMPTY:l 'OR' EHPTY=-ATMOD'THEN' 'BEGIN''t-'UR' YY:=1,2,3,4 'DO''U" AH/yyn,O'THEN' 'BEGIN'EMPTY:=-ATHOO;INNRB:=H; OELAYB:=All/H/);ATl/t/ J: =ATHOD+3 j
'COMHENT' BEGIN OF READING FROM DISK;'GOTO' AMY;'END' THEN i'ENU' THEN;'GOTO' AMY;
'COMMENT' END OF READING FROM DISKjAOUINNRB/): =1;FULL:':, ;'H"' IDLE:l'THEN' 'BEGIN'ATl/2n: :ATHOD+2 j'COMMENT' BEGIN OF LOADINGjIDLt;::OjIHNN:=INNRB; DELAY: =DELAYB;'END' THEN;'GOTO' AMYj
'COMHENT' END OF LOADING, BEGIN OF PROCESSING;FULL::Oj EMPTY:=l;ATU3/J: =ATMOD+DELAY;'GOTO' AM~j
'COMMENT' END OF PROCESSINGjIDL!::::1 jAOl/INNR/J::OjIn"~FULL:l 'THEN' 'GOTO' AHT1j'GOTa' AMY;
PAMSE lABN);OXX:=720+ABNj POISSWI::'TRUE'jIAI::Oj'COMMENT' START OF PRE-THINKING;THINKj'GOTa' AMYj
'COMMENT' PRE-THINKING FINISHEDjWAlTOl : :ATMODjRAPOlS (30, POISSWI ,OYY ,OXX, Ra, FEHLER J;RI::1 j'COMHENT' START OF TYPINGj:~~;o;Al~~;',THEN' ATl/2/J ::ATHOD+20;
'COMMENT' RESPONSEFROM PROCESSOR;'IF' All/l/):l"THEN' 'BEGIN'AOl/l/)::O; IAI:=lj'END' THEN'ELSE' 'BEGIN'IAI::Oj'IF' RI:1'COMMENT' START OF TYPINGj'THEN' ATl/2/): :ATMOD+20j'END' ELSE;'GOTO' AMY;
'COfIHENT' TYPING FINISHED, SEtlDING OF SIGNAL TO PROCESSOR;WAlT l WAITDI, ABN);AOllI/J:=RO; STATISTICS;'COMMENT' START OF PRE-THINKINGjTHINKjRI: =0;IAI::2j'GOTO' AHY;
J.-P. BEHR et al. Philips tech. Rev. 39, No. 5
<J Fig. 16. BOMOL program obtained from the flow-chart descrip-tion of figs 14 and IS. a) The central processor ('MACRO BQI ').b) A terminal ('MACRO BQ2').
100. $MACROHQI;200.300.CR 1.1.1=2.1.1;LWO.CR 1.2,1:2.1.2j500.CR 1.3.1=2.1.3;bOO.CR 1.'1.1:2.1.'1;700.CR 2.1.1=1.1.1;HOO.CR 2.1.2=1.2.1;900.CR 2.1.3=1.3.1;
1000.CR 2.1.q=1. •• I;liDO.1200.$MENO;
100. $MACROHQ2;200.300.c~ 1.1l1--q) = 2(1--'1)1;QOO.CR 211--Q)1 = 1.1l1--II);500.bOD. $MENDj
Fig. 17. Description in COMOL of the connection network of thesystem shown in fig. 13. The measuring instrument has beenomitted. Top: Full description. Bottom: Equivalent abbreviatednotation.
transition time is 2 units. Third, the actual processingof the job by the central processor; the transition timehere is a variable quantity, and carried as an attributewith the token. Fourth, the branching of signals fromthe processor to the terminal; no transition time isinvolved here, and the destination is carried with thetoken as an attribute.
There are two different kinds of transition for theterminal: the first represents the generation of a newjob; the duration of this step is taken from a suitablerandom process ('ranerl'). The second, numbered 3 inthe diagram, represents the typing actions for in-troducing the job into the central processor; the tran-sition time for this is fixed and equal to 20 units. Thetransition numbered 2 in the diagram has no signif-icance but is required because location 2 cannot beinput and output of the same transition at the sametime. Fig. 19 shows the SAMEN description in programform.
A comparison of the E-net description and theSAMO description, where we find that the thinkingperiod does not start before the typing has finished,might suggest that things are different here. However,it should be borne in mind that when a transition, e.g.transition 3, fires, the token in location 3 moves on to5 after the transition time has elapsed and this transi-tion time starts counting at the moment when inputtokens are present and output locations have becomeempty. So it is also true that in this E-net descriptionthe thinking period cannot start before the typing hasfinished.
Philips tech. Rev. 39, No. 5 SAMEN/SAMO 147
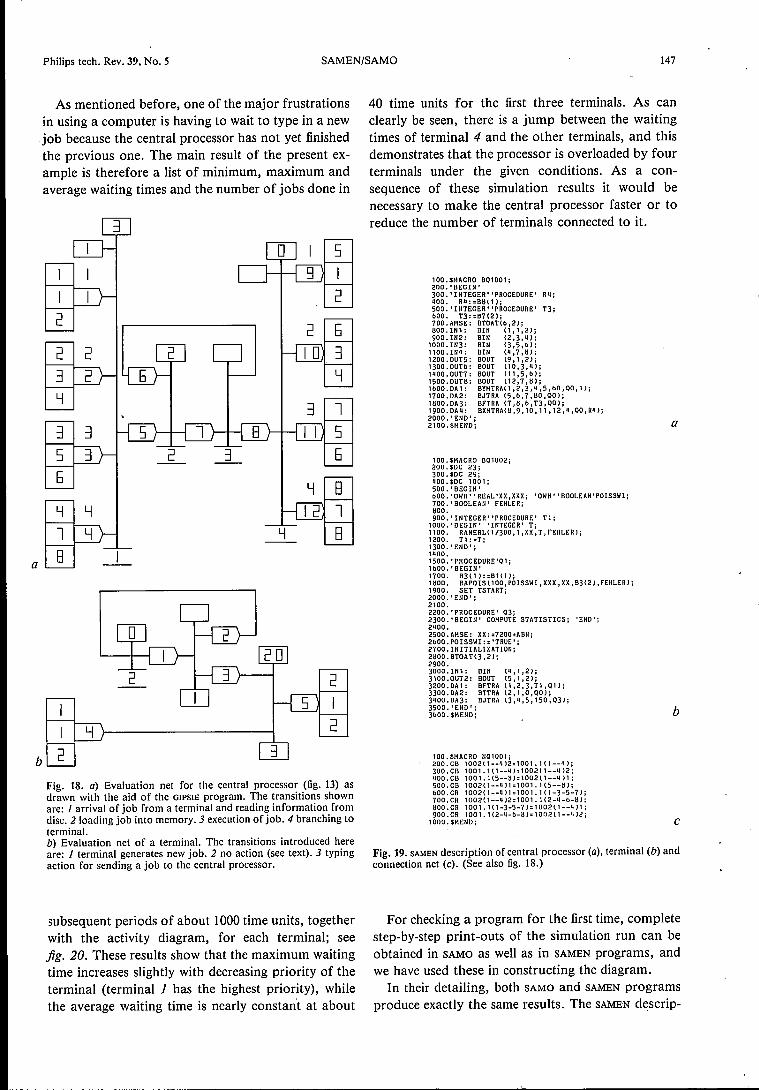
As mentioned before, one of the major frustrationsin using a computer is having to wait to type in a new.job because the central processor has not yet finishedthe previous one. The main result of the present ex-ample is therefore a list of minimum, maximum andaverage waiting times and the number of jobs done in
a
b
Fig. 18. a) Evaluation net for the central processor (fig. 13) asdrawn with the aid of the GIPSIE program. The transitions shownare: 1 arrival of job from a terminal and reading information fromdisc. 2 loading job into memory. 3 execution of job. 4 branching toterminal.b) Evaluation net of a terminal. The transitions introduced hereare: 1 terminal generates new job. 2 no action (see text). 3 typingaction for sending a job to the central processor.
subsequent periods of about 1000 time units, togetherwith the activity diagram, for each terminal; seejig. 20. These results show that the maximum waitingtime increases slightly with decreasing priority of theterminal (terminal 1 has the highest priority), whilethe average waiting time is nearly constant at about
40 time units for the first three terminals. As canclearly be seen, there is a jump between the waitingtimes of terminal 4 and the other terminals, and thisdemonstrates that the processor is overloaded by fourterminals under the given conditions. As a con-sequence of these simulation results it would benecessary to make the central processor faster or toreduce the number of terminals connected to it.
100.$HACRO BQ100l;200. I BEGIN I
300.'INTEGER"PROCEDURE' Rq;LIDO. HLI: =BI:H l)j500. 'INTEGER' 'PROCEDURE' T3;bOO. T3:=B7(2);700.AHSE: BTOAHb,2);HOO • 1 N 1 : BI ti (1 I 1 12, i900.IN2: BIN (2,3,1.1);1000.IN3: BIN (3,5,b) i1100.11'111: BIN (iI,7,H)j1200.0UT5: BOUT 19,1,2);1300.0UTb: BOUT lI0,3,q);llWO.OUT7: BOUT (1',5,b);150D.OUH: BOUT lI2,1,8);lbOO.DA 1: BYMTRAll ,2,3,'1,5 ,bO,OO,1)j1700.DA2: BJTRA lS,b,7,HO,QO);1800.DA3: BfTRA l7,8,b,T3,QO);1900. DALI: BXMTRA{Ij ,9 r 10 1'1,12,11 ,QO, RLI)j2000.'END' ;2100.$HEND; a
100.$HACRO BQ1002;200.$DC 23;300. $DC 29;LlOO.$DC 1001 i500. 'BEGIN'bOO.'OWN"REAL'XX,XXXj 'OWN"BOOLEAN'POISSWlj700.'BOOLEAN' FEHLERj800.900.'INTEGER"PROCEDURE' r i ,
1000.'8EGIN' 'INTEGER' Ti1100. RANERLll/300,1 ,xx, T, FEHLER);1200. T1:=Tj1300.'ENO' ;lqOO.1500,'PROCEDURE'Qlj1bOO. 'BEGIN'1100. B3(1):=B1l1);1800. RAPOIS II 00, POISSWI, XXX, XX, B3(2) ,FEHLER);1900. SET TSTART;~~gg:'END';2200.'PROCEDURE' Q3;2300.'BEGIN' COMPUTE STATISTICSj 'END';2QOO.2500. AHSE: XX: =1200+ABN;2bOO. POISSWI: = 'TRUE';2700. INITIALIZATIOtl;2800. BTOATl3, 2);2900.3000.IN1: BIN (Q,l,2)j3100.0UT2: BOUT l5,1,2);3200.DA1: BFTRA ll,2.3,Tl,Q1);3300.DA2: BTTRA l2,1,0,QO);3QOO.DA3: BJTRA (J,Q,5,150,Q3);3500. 'END';3bOO. $HEND; b
100.$HACRO NQ100l;200.CB 1002l1--I~)2=1001.1(1--II);300.CB 1001.1l1--')=1002l1--Q)2;'OO.CB 1001.1l5--~)=1002l1--Q)I;500.CB 100211--.)1=1001.ll5--8);bOO.CR 100211--,)1=1001.lll-3-5-7)700.CR 100211--')2=1001.1l2-Q-b-H)800. CR 1001. 1l1-3-5-1)= 1002l1--'I)1900.CR 1001.1l2-'-b-8)=1002l1--")~
1000.$HEND; c
Fig. 19. SAMEN description of central processor (a), terminal (b) andconnection net (c). (See also fig. 18.)
For checking a program for the first time, completestep-by-step print-outs of the simulation run can beobtained in SAMO as well as in SAMEN programs, andwe have used these in constructing the diagram.
In their detailing, both SAMO and SAMEN programsproduce exactly the same results. The SAMEN descrip-
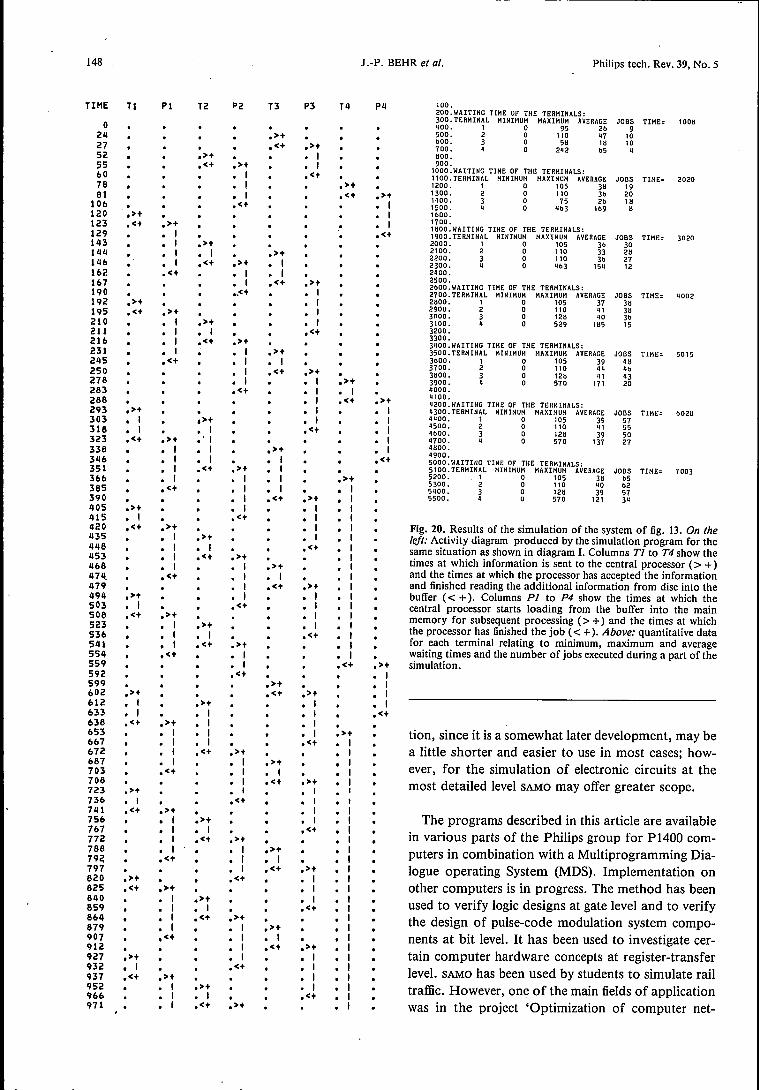
148 J.-P. BEHR et al. Philips tech. Rev. 39, No. 5
TIME Tl PI T2 P2 13 P3 T4 P4 100.200.WAITING TIME OF THE TERMINALS:300. TERMINAL MINIMUM MAXIMUM AVERAGE JOBS TIME= 100H0 · ~OO. 1 0 95 2b 924 .>+ 500. 2 0 110 ~7 10bOO. 3 0 5H lH 1027 · .<+ .>+ 700. ~ 0 2~2 es ~52 .>+ · I HOO.
55 .<+ .>+ · I 900.1000. WAITING TIME OF THE TERMINALS:60 · I .<+ · 1100.TERMINAL HINIMUM MAXIMUM AVERAGE JOBS TIME= 202076 · I .>+ · 1200. 1 0 105 3H 19
61 1 .<+ .>+ 1300. 2 0 110 se 20· 1~00 • 3 0 75 ze lH106 · .<+ · I 1500. ~ 0 ~b3 lb9 H120 .>+ · · I ieoo ,123 .<+ .>+ · I 1700.
.' lHOO. WAITING TIME OF THE TERMINALS:129 · I .<+ 1900. TERMINAL MINIMUM MAXIMUM AVERAGE JOBS TIME= 3020143 · I .>+ 2000. 1 0 105 se 30144 I I .>+ 2100. 2 0 110 33 2H· · 2200. 3 0 110 3b 27146 · I .<+ .>+ · I 2300. ~ 0 ~b3 15' 12162 .<+ · I · I 2.00.167 I .<+ .>+ 2500.· 2bOO. WAITING TIME OF THE TERMINALS:190 · ~<+ · I 2700. TERMINAL MINIMUM MAXIMUM AVERAGE JOBS TIME= .002192 .>+ · I 2HOO. 1 0 105 37 3H195 .<+ .>+ I 2900. 2 0 110 '1 3H· 3000. 3 0 12H .0 se210 · 1 .>+ · I 3100. • 0 529 lH5 15211 · 1 · 1 .<+ 3200.
3300.216 · 1 .<+ .>+ · 3.00. WAITING TIME OF THE TERMINALS:231 · 1 · 1 .>+ 3500. TERMINAL MINIMUM MAXIMUM AVERAGE JOBS TIME= 5015245 .<+ · I · I 3bOO. 1 0 105 39 ~H3700. 2 0 110 •• 'b250 · I .<+ .>+ 3HOO. 3 0 12H '1 '3276 · 1 · 1 .>+ 3900. • 0 570 171 20263 .<+ · I · I '000.'100.266 · · I .<+ .>+ '200. WAITING TIME OF THE TERMINALS:293 .>+ · I · I '300. TERMINAL MINIMUM MAXIMUM AVERAGE JOBS TIME= b02H303 · I ,>+ · I · I •• 00. 1 0 105 39 57
316 1 1 .<+ I '500. 2 0 110 '1 55· · · 'bOO. 3 0 12H 39 50323 .<+ .>+ I I '700. ~ 0 570 137 27336 1 1 .>+ · I 'HOO.· · '900.346 · I · I · · I .<+ 5000.WAITING TIME OF THE TERMINALS:351 · I .<+ .>+ · I · 5100. TERMINAL MINIMUM MAXIMUM AVERAGE JOBS TIME= 7003366 I I I .>+ 5200. 1 0 105 3H es· · · 5300. 2 0 110 '0 ea365 .<+ · I · I · 5~00. 3 0 12H 39 57390 · I .<+ .>+ 5500. ~ 0 570 121 3'405 .>+ · I · I415 · 1 .<+ · I420 .<+ .>+ · I Fig. 20. Results of the simulation of the system of fig. 13. On the435 · 1 .>+ · I left: Activity diagram produced by the simulation program for the446 · I · I .<+ same situation as shown in diagram I. Columns Tl to T4 show the453 · I .<+ .>+times at which information is sent to the central processor (> + )466 · I · I .>+
474. .<+ · I · I · and the times at which the processor has accepted the information479 · · 1 .<+ .>+ and finished reading the additional information from disc into the494 .>+ · I · I buffer « +). Columns Pl to P4 show the times at which the503 · I · .<+ · I central processor starts loading from the buffer into the main506 .<+ .>+ · I memory for subsequent processing (> +) and the times at which523 · I .>+ · I the processor has finished the job (< + ). Above: quantitative data536 · 1 · 1 .<+541 · I .<+ .>+ for each terminal relating to minimum, maximum and average554 .<+ · I · waiting times and the number of jobs executed during a part of the559 · I .< .>+ simulation.592 .<+ · I599 · .>+ · I602 .>+ .<+ .>+ · I612 · 1 .>+ · I · I633 · 1 · · 1 · 1 .<+636 .<+ .>+ · I · I ·653 · I · I · I .>+ tion, since it is a somewhat later development, may be667 · I · I .<+
a little shorter and easier to use in most cases; how-672 · 1 .<+ .>t ·667 · I · I .>+ ever, for the simulation of electronic circuits at the703 .<+ · I · I706 · I •<+ .>+ most detailed level SAMO may offer greater scope .723 .>+ I I736 · I · .<+ · I741 .<+ .>+ · I
The programs described in this article are available756 · I .>t · I767 · I · I .<+
in various parts of the Philips group for P1400 com-772 · 1 .<+ .>+ ·766 · I · I .>+ puters in combination with a Multiprogramming Dia-79~ .<t · I · I797 · I .<+ .>+ logue operating System (MDS). Implementation on620 .>+ .<+ · I
other computers is in progress. The method has been625 .<+ .>+ · I640 · I .>+ · I used to verify logic designs at gate level and to verify659 I · I · .<+661! · I .<+ .>+ · the design of pulse-code modulation system compo-679 · 1 · 1 .>+907 .<+ · I · I · nents at bit level. It has been used to investigate eer-912 · · 1 .<+ .>+
tain computer hardware concepts at register-transfer927 .'>+ · I · I932 · 1 .<+ · I level. SAMO has been used by students to simulate rail937 .<+ .>+ · I952 · I .>+ · I traffic. However, one of the main fields of application966 · I · I · .<t971 · 1 .<+ .>+ was in the project 'Optimization of computer net-

Philips tech. Rev. 39, No. 5 SAMEN/SAMO 149
works _with terminals' [8-12], a joint venture withPhilips GmbH Data Systems, Werk für Daten- undInformationstechnik, Siegen; an example is presentedin fig. 13. Current usage includes the analysis ofsystem concepts for computer-controlled telecom-munication switching systems.
lal J. Schwandt, An approach to use evaluation nets for theperformance evaluation of transaction-oriented businesscomputer systems, in: K. M. Chandy and M. Reiser (eds),Computer performance, pp. 429-441, North-Holland, Am-sterdam 1977.
[9] H. Seidel and P. v. Studnitz, A methodology for deterministicmodel building and simulation of computer systems, Simula-tion '77, Proc. Conf. Montreux 1977, pp. 55-60.
[la] H. Seidel and P. v. Studnitz, Modellbildüng und SimulationkommerzielIer Anwendungen, Angew. Informatik 21, 108-117, 1979.
[u] R. Winter, An evaluation net model for the performanceevaluation of a computer network, in: H. Beilner and E.Gelenbe (eds), Measuring, modelling, and evaluating com-puter systems, pp. 95-113, North-Holland, Amsterdam 1977.
[12] J. Schwandt, Interaktiver rechnerunterstützter Systement-wurf, VDI-Z 121, 559-564, 1979.
Summary. Methods of description for time-discrete systems havebeen developed at Philips Forschungslaboratorium Hamburg andused for the simulation of such systems, resulting in the SAMEN/SAMO package. To keep the system description clear and distinct andyet as versatile as possible, it is divided into subsystems with theirinterconnections. The subsystems can be treated as individual'black boxes' or further subdivided as required. At the more gen-eral SAMO level of the SAMEN/SAMO program package the descriptionof the subsystems follows a convention BOMOL (Box-Model De-scription Language), whereas the connections are described inCOMOL notation (Connection-Model Description Language). Toprovide additional support in model description evaluation nets('E-nets') were chosen as a formal description method, and a'SAMEN level' was added to the simulation-program package. TheSAMEN description of the black boxes, based on evaluation nets, canreplace the BOMOL part of the simulation program. E-nets notonly have the advantage that they provide the user with a clear in-sight, in the form of a drawing, into the structure ofhis problem, theycan also be clearly described in a formal manner. This is essentialwhen producing the simulation program. For communication withthe computer there is a set of programs called IMOBS (InteractiveModel Building and Simulation), consisting of a program packageG1PSlE (Graphical Interactive Program for Simulation with Evalua-tion Nets) that can be used to build up an evaluation net on agraphic-display terminal, and a program package DIMPLE (DialogueImplementation Package) that can be used in a dialogue with thecomputer to enter values of the model parameters and prepare thesimulation.

150 Philips tech. Rev. 39, No. 5
Scientific publicationsThese publications are contributed by staff of laboratories and plants which form part ofor cooperate with enterprises of the Philips group of companies, particularly by staff ofthe following research laboratories:
Philips Research Laboratories, Eindhoven, The Netherlands E,Philips Research Laboratories, Redhill, Surrey, England RLaboratoires d'Electronique et de Physique Appliquée, 3 avenue Descartes,
94450 Lirneil-Brévannes, France LPhilips GmbH Forschungslaboratorium Aachen, Weiêhausstraûe, 51Aachen,
Germany APhilips GmbH Forschungslaboratorium Hamburg, Vogt-Kölln-Straûe 30,
2000 Hamburg 54, Germany. HPhilips Research Laboratory Brussels, 2 avenue Van Becelaere, 1170 Brussels
(Boitsfort), Belgium BPhilips Laboratories, N.A.P.C., 345 Scarborough Road, Briarcliff Manor,
N.Y. 10510,U.S.A. N
H. Baudry & F. Franconville (ClI-Honeywell Bull,St-Ouen, France): Encres sérigraphiables pour hautedéfinition. Rhéologie et impression.Acta Electronica 21,283-295, 1978(No. 4). L
J. van den Boomgaard: Eutectic-like and periteetic-likereactions in ternary systems at a constant pressure,Part Ill. Ternary systems containing more than threesolid phases.Philips J. Res. 34, 211-237,1979 (No. 5/6). E
J. van den Boomgaard & R. A. J. Born: A sin-tered magnetoelectric composite material BaTiOa-Ni(Co, Mn)F~04'J. Mat. Sci. 13, 1538-1548, 1978(No. 7). E
C. H. J. van den Brekel: Mass transport and mor-phology in chemical vapour deposition processes.Thesis, Nijmegen 1978. E
H. H. Brongersma, N. Hazewindus, J. M. van Nieuw-land, A. M. M. Otten & A. J. Smets: 'NODUS' - asensitive new instrument for analysing the compositionof surfaces.Rev. sci. Instr. 49, 707-714,1978 (No. 6). E
A. Browne: A reading aid for the partially sighted.Electronics & Power 24,592-595, 1978 (Aug.). R
P. J. Cameron (Merton College, Oxford), J.-M.Goethals & J. J. Seidel (Eindhoven University ofTechnology): The Krein condition, spherical designs,Norton algebras and permutation groups.Proc. Kon. Ned. Akad. Wetensch. A 81, 196-206, 1978(No.2). B
W. A. Cense & W. Albers: On the in-situ growth ofaligned composites by means of disproportionation ofamorphous metal systems.J. non-cryst. Solids 28,391-401, 197? (No. 3). E
T. A. C. M. Ciaasen & W. F. G. Mecklenbräuker: Ageneralized scheme for an all-digital time-division mul-tiplex to frequency-division multiplex translator.IEEE Trans. CAS-2S, 252-259, 1978(No. 5). E
H. J. van Daal, K. H. J. Buschow & P. B. van Aken:On the thermoelectricity in uranium intermetallics.Thermoelectricity in metallic conductors, ed. F. J.Blatt & P. A. Schroeder, pp. 107-115; Plenum Press,New York 1978. E
N. H. Dekkers & H. de Lang: A calculation of brightfield single-atom images in STEM with half planedetectors.Optik 51, 83-92, 1978 (No. I). E
Ph. Delsarte & Ph. Piret: Automorphism groups ofconvolutional codes.SIAM J. appl. Math. 34, 616-629,1978 (No. 4). B
O. P. van Driel: On various causes of improper solu-tions in maximum likelihood factor analysis.Psychometrika 43, 225-243, 1978 (No. 2). E
A. van der Drift (Philips Centre for Technology, Eind-hoven), G. W. Griffiths (Newmarket Transistors Ltd,Newmarket, Suffolk, U.K.) & R. Petit (Portenseigne,Louviers, France): Mounting technologies for hybridintegrated circuits and their mechanization.Acta Electronica 21, 297-318, 1978 (No. 4). (Partly inEnglish, partly in French.)
J. M. Durand: Influence of the growth parameters inGaAs vapour phase epitaxy.Philips J. Res. 34, 177-210, 1979 (No. 5/6). L
A. van Eenbergen & E. Bruninx: Losses of elementsduring sample decomposition in an acid-digestion bomb.Anal: chim. Acta 98,405-406,1978 (No. 2). E
U. Enz: A particle model based on stringlike solitons.J. math. Phys. 19,1304-1306,1978 (No. 6). E
J. van Esdonk: Verbindingstechnieken voor ultra-hoog-vacuümsystemen.Lastechniek 44, 53-60, 1978(No. 4). E
E. Fischmann: Alterations in the manuscript of Rönt-gen's publication 'Ueber eine neue Art von Strahlen'(1895).Brit. J. Radiol. 51, 475-476,1978 (No. 606). E

Philips techno Rev. 39, No. S SCIENTIFIC PUBLICATIONS ISI
W. P. J. Fontein, J. M. M. Verbakei & J. H. N. vanVucht: A trial-structure generating program for thedetermination of crystal structures.Philips J. Res. 34, 238-251,1979 (No. 5/6). E
C. T. Foxon & B. A. Joyce: Surface processes control-ling the growth of Gaxlnl-xAs and GaXlnl-XP alloyfilms by MBE.J. Crystal Growth 44,75-83,1978 (No. I). R
W. Funk: Thick film technology.Acta Electronica 21,251-255, 1978(No. 4). H
J. Georges & F. Heymans: On compound statements ina conversational language.BIT 18, 230-233, 1978 (No. 2). B
J. T. H. Goossen & J. G. Kloosterboer: Determinationof phosphates in natural and waste waters after photo-chemical decomposition and acid hydrolysis of organicphosphorus compounds.Anal. Chem. 50, 707-711,1978 (No. 6). E
H.-J. Hagemann: Loss mechanisms and domainstabilisation in doped BaTiOa.J. Physics C 11,3333-3344,1978 (No. 15). A
J. C. M. Henning & J. H. den Boef: Magnetostrictionmeasurement by means of strain modulated ferro-magnetic resonance (SMFMR).Appl. Phys. 16, 353-357,1978 (No. 4). E
E. P. Honig & B. R. de Koning: Transient and alter-nating electric currents in thin organic films.J. Physics C 11, 3259-3271,1978 (No. 15). E
H. Ihrig: The positive temperature coefficient resistivityof BaTiOa ceramics as a function of the amount oftitanium-rich second phase.Phys. Stat. sol. (a) 47, 437-444, 1978(No. 2). A
G. Jacob, M. Boulou, M. Furtado & D. Bois: Galliumnitride emitting devices. Preparation and properties.J. electronic Mat. 7,499-514, 1978(No. 4). L
F. de Jager & C. B. Dekker: Tamed frequency modula-tion, a novel method to achieve spectrum economy indigital transmission.IEEE Trans. COM-26, 534-542, 1978(No. 5). E
D. J. Kroon: Instrumental methods for automatic airmonitoring stations.Air pollution control, Part Ill, ed. W. Strauss, pp.317-386; Wiley, NewYork 1978. E
A. R. Miedema: Surface segregation in alloys of tran-sition metals.Z. MetalIk. 69, 455-461, 1978(No. 7). E
M. Monneraye: Les encres sérigraphiables en micro-électronique hybride: les matériaux et leur comporte-ment.Acta Electronica 21,263-281, 1978(No. 4). L
M. Monnier: Une nouvelle technique de montage etd'interconnexion de composants: circuiterie doubleface sur film,polyimide.Acta Electronica 21, 333-341, 1978(No. 4). L
J. H. C. van Mourik (Philips Centre for Technology,Eindhoven): Screen printable inks in hybrid micro-electronics, availability and physical properties.Acta Electronica 21, 257-262, 1978 (No. 4).
B. J. Mulder: Protective glassy layers passivating cop-per at 500°C.J. Electrochem. Soc. 125, 823-824,1978 (No. 5). E
R. Orlowski & E. Krätzig: Holographic method for thedeterrnination- of photo-induced electron and holetransport in electro-optic crystals.Solid State Comm. 27, 1351-1354, 1978(No. 12). H
F. Perrault (T.R.T., Le Plessis-Robinson, France),B. Kramer, R. Dessert & G. Le Floch: Applications destechnologies couches minces et couches épaisses dans ledomaine des hautes fréquences.Acta Electronica 21,343-354, 1978 (No. 4). L
E. Roza: A practical design approach to decision feed-back receivers with conventional filters.IEEE Trans. COM-26, 679-689, 1978(No. 5). E
H. Schauer, E. Arnold & P. C. Mürau: Interface statesand memory decay in MNOS capacitors.IEEE Trans. ED-25, 1037-1041, 1978(No. 8). N
C. Schiller, A. Gheorghiu* & M. L. Theye* (* Univer-sité Pierre et Marie Curie, Paris): Etude de la composi-tion de couches minces de GaAs amorphe par analysenon dispersive de rayons X.J. Microsc. Spectrosc. électron. 3, 255-263, 1978(No.3). L
H. Sewell: Control of pattern dimensions in electronlithography.J. Vac. Sci. Technol. 15, 927-930,1978 (No. 3). R
B. Singer & A. L. Dalisa: An x-y addressable electro-phoretic display.Proc. S.LD. 18,255-266, 1977 (No. 3/4). N
A. L. N. Stevels: Effect of non-stoichiometry on theluminescence of Eu2+-doped aluminates with thep-alumina-type crystal structure.J. Luminescence 17,121-133,1978 (No. I). E
N. C. de Troye: Integration durch Integration.Éund M 95, 287-292, 1978(No. 6/7). E
V. Tulaja (Fernuniversität, Hagen), B. Schiek &J. Köhler: An interdigitated 3-dB coupler with threestrips.IEEE Trans. MTT-26, 643-645, 1978(No. 9). H
R. Veilex: Introduetion (to issue on Hybrid micro-electronics).Acta Electronica 21,247-249, 1978 (No. 4). (In Englishand in French.)
H. W. Werner: Introduetion to secondary ion massspeetrometry (SIMS).Electron and ion spectroscopy of solids, ed. L. Fier-mans, J. Vennik & W. Dekeyser, pp. 324-441; PlenumPress, New York 1978. E
G. F. Weston: Pumps for ultra-high vacuum.Vacuum 28,209-233, 1978(No. 5). R
152 SCIENTIFIC PUBLICATIONS Philips tech. Rev. 39, No. 5
Contents ofPhilips Telecommunication Review 37, No. 3, 1979:
G. Toes: TSAPT for automatic public telegraphy (pp. 97-110).D. van der Lugt & J. van Zweeden: Private automatic text and telex exchange DSX-40 (pp. 111-124).W. F. Njio & B. van Raay: The 8TR400 family of supergroup translating equipment (pp. 125-135).W: F. Njio & A. Klaassen: Compact 8TR417 master frequency generating equipment (pp. 136-143).W. G. Bax & J. Wagenmakers: 140 Mb/s coaxial transmission system 8TR609 (pp. 144-160).H. W. de Haan & P. Zwaai: 34 Mb/s line system 8TR607 (pp. 161-169).G. David & B. Pando: An on-board digital transmission system (pp. 170-176).T. G. Giles: A universal frequency synthesizer IC (pp. 177~181).F. van Enk: Microprocessor control of mobile radio systems (pp. 182-187).M. Pirson: A new vehicular and manpack HF/SSB radio (pp. 188-195).
Contents ofPhilips Telecommunication Review 37, No. 4, 1979:
K. Mouthaan: Telecommunication via glass-fibre cables (pp. 201-214).J. W. Versluis & J. G. J. Peelen: Optical communication fibres. Manufacture and properties (pp. 215-230).F. Krahn, G. Olejak & W. Weidhaas: The manufacture of optical cables (pp. 231-240).F. Krahn, W. Meininghaus & D. Rittich: Measuring and test equipment for optical cable (pp. 241-249).O. R. Bresser: Metal-free optical fibre cables (pp. 251-25~).F. Krahn & H. Thielman: 34 Mb/s optical cable system test in Berlin (pp. 257-269).
Contents ofElectronic Components and Applications 1, No. 4, 1979:
F. A. M. van de Kerkhof: Microcomputer-controlled tuning and control systems for TV (pp. 199-214).A. Lieders: Single-phase rectifier circuits with CR filters, Part 2 - Design procedure (pp. 216-230).J. W. Beunders: Digital control of radio and audio equipment, Part 2 - Voltage converter and memory for presetradio, tuning (pp. 231-238).U. Schillhof: Digitalcontrol of radio and audio equipment, Part 3 - Introduetion to microcomputer-controlledradio tuning system (pp. 239-248).E. D. van Veldhuizen: The 8X300 development and monitoring system (DMS) (pp. 249-257).
Contents of Electronic Components and Applications 2, No. 1, 1979:
U. Schillhof: Digital control of radio and audio equipment, Part 4 - Displays and control of analogue functionswith RTS (pp. 2-15).E. A. Kilian: Digital control of radio and audio equipment, Part 5 - DC-controlled audio switches and filters(pp. 16-26).A new approach to a PCM codec for telephony (pp. 28-30).H. Houkes: TDAI060 - a comprehensive integrated control circuit for SMPS (pp. 31-48).W. Ebbinge: Mains pollution caused by domestic appliances, Part 1 - Definitions and standards (pp. 49-52).P. Blunt: Reliable thyristors and triacs in TO-220 plastic packages (pp. 53-58).Segment field magnets for large electric motors (pp. 59-61).
Contents ofValvo Berichte 20, No. 3, 1979:
Das pyroelektrische Vidikon (pp. 93-112).P. DoIizy, O. De Luca & M. Deloron: Fotoernission von multialkalischen Antimonlegierungen vom Typ(Sb,Na,K,Cs) (pp. 113-146).
Volume 39,1980, No. 5 pages 125·152 Published 3rd December 1980

PH I LI PS TECHNICAL REVIEWVOLUME 39, 1980, No.6/7
On 30th September 1980 Drs J. W. Miltenburgretired from Philips Technical Review. He had beenwith the Review since 1st January 1957, and succeededIr Gradstein as Editor-in-chief in 1970.
A notable character thus leaves the stage. A characterwho thrived on hard work and wasfascinated by all theaspects of producing a journal: not just the contents,but the illustrations, typography and design as well.On these matters, and especially on editing, he had hisown views, often strong ones. This meant that thosewho helped in producing the Review did not alwayshave an easy time. But neither did he spare himselfin his unrelenting struggle to maintain the quality ofthe journal. The proper use of the Dutch language wasparticularly close to his heart.
During Miltenburg's time it became customary to con-clude each volume with a double issue entirely devotedto some special Philips area of expertise. The fivemost recent of these double issues treated inorganicchemical analysis, light, modulation, LSI and pictureprocessing. These special issues required a great deal oforganization and coordination, and Miltenburg alwaysshouldered these responsibilities with energy andenthusiasm.
So now we offer Drs Miltenburg - in 'his' journal -our best wishes for thefuture. We hope that his succes-sor and her colleagues will cherish the Philips TechnicalReview with the same care and affection.
E. F. de Haan