iwtc objective tc intensity analysis viii · 120 130 140 6:00 6:00 8:00 12:00 18:00 5:00 4:00 18:00...
TRANSCRIPT

Derrick Herndon and Chris Velden
University of Wisconsin - Madison
Cooperative Institute for Meteorological Satellite Studies
8th International Workshop on Tropical Cyclones
December 3, 2014
Jeju, South Korea
Objective TC Intensity Analysis
Microwave Sounders AMSU, SSMIS & ATMS
ADT
ARCHER
Super Typhoon Jelewat 2012
DAV-T
JMA TRMM
IWTC
VIII

• > 85 % of the Tropical Cyclone intensity estimates are based
exclusively on satellite imagery
• TC Intensity Estimate Uncertainty = Forecast Uncertainty
• Dvorak method is good but can provide erroneous estimates
in some situations.
• Increasing the number of skillful TC intensity estimates
improves TC current intensity
Forecast process starts
with current intensity
and position
+ =
IWTC
VIII TC Intensity Analysis: Motivation

Intensity Uncertainty: IBTrACS
Figure 3 from Knaff et al 2010
IWTC
VIII TC Intensity Analysis: Motivation
Recon vs Dvorak for 15W (MSW)
30
40
50
60
70
80
90
100
110
120
130
140
6:00 6:00 8:00 12:00 18:00 5:00 4:00 18:00 7:00
9-Sep 10-Sep 10-Sep 11-Sep 12-Sep 18-Sep 19-Sep 19-Sep 20-Sep
B1 B5 B3 B4 B2
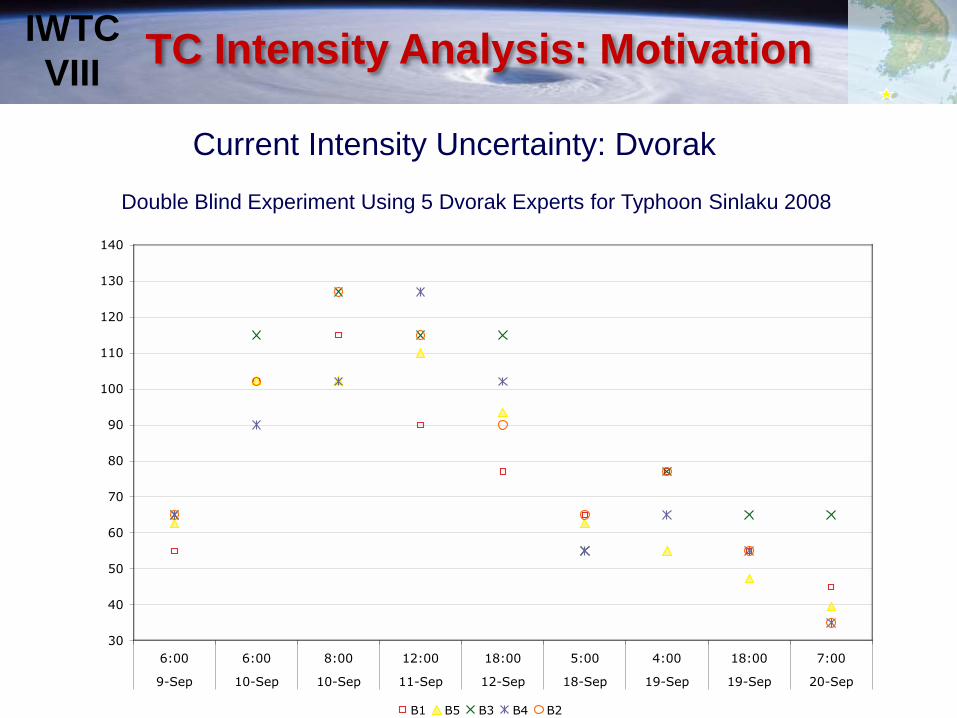
Current Intensity Uncertainty: Dvorak
Double Blind Experiment Using 5 Dvorak Experts for Typhoon Sinlaku 2008
IWTC
VIII TC Intensity Analysis: Motivation

Recon vs Dvorak for 15W (MSW)
30
40
50
60
70
80
90
100
110
120
130
140
6:00 6:00 8:00 12:00 18:00 5:00 4:00 18:00 7:00
9-Sep 10-Sep 10-Sep 11-Sep 12-Sep 18-Sep 19-Sep 19-Sep 20-Sep
Recon B1 B5 B3 B4 B2 Blind Mean
Current Intensity Uncertainty: Dvorak
Double Blind Experiment Using 5 Dvorak Experts for Typhoon Sinlaku 2008
IWTC
VIII TC Intensity Analysis: Motivation
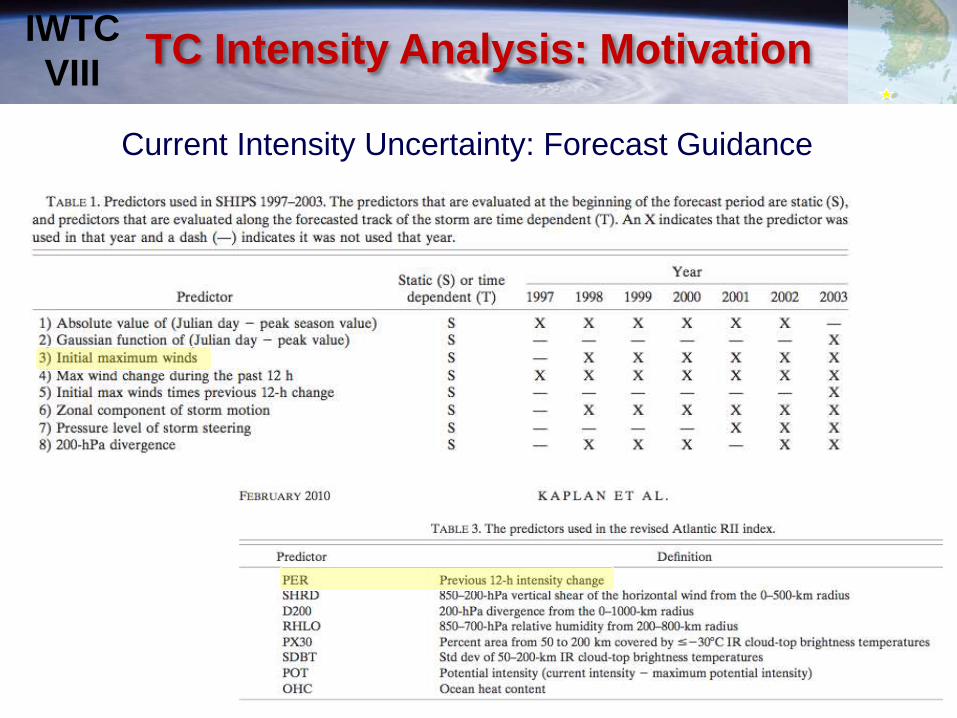
Current Intensity Uncertainty: Forecast Guidance
IWTC
VIII TC Intensity Analysis: Motivation

IWTC
VIII
JMA TRMM
CIMSS ARCHER
Microwave Imagers Microwave Sounders
CIRA AMSU
CIMSS AMSU
JMA AMSU
CIMSS SSMIS
CIMSS ATMS
CIRA MTCSWA
SATCON
Ensemble Methods
CIMSS ADT
JMA CLOUD
Univ AZ DAV-T
Geostationary
Review of Current Methods
TC Intensity Analysis
= New Since IWTC-VII
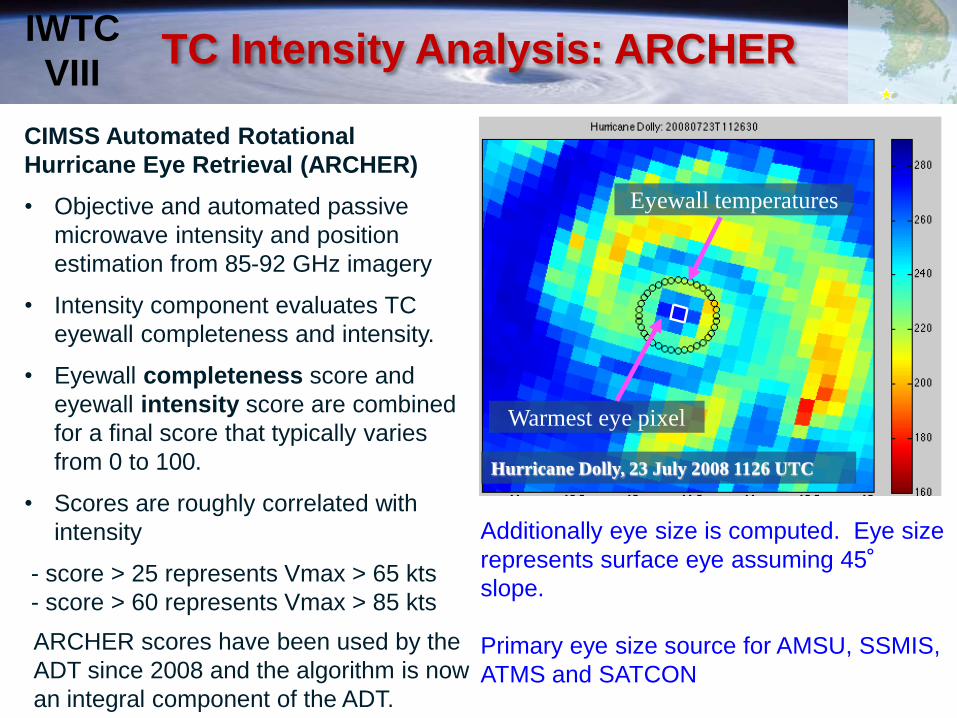
Warmest eye pixel
Eyewall temperatures
Hurricane Dolly, 23 July 2008 1126 UTC
CIMSS Automated Rotational
Hurricane Eye Retrieval (ARCHER)
• Objective and automated passive
microwave intensity and position
estimation from 85-92 GHz imagery
• Intensity component evaluates TC
eyewall completeness and intensity.
• Eyewall completeness score and
eyewall intensity score are combined
for a final score that typically varies
from 0 to 100.
• Scores are roughly correlated with
intensity
- score > 25 represents Vmax > 65 kts
- score > 60 represents Vmax > 85 kts
ARCHER scores have been used by the
ADT since 2008 and the algorithm is now
an integral component of the ADT.
Additionally eye size is computed. Eye size
represents surface eye assuming 45°
slope.
Primary eye size source for AMSU, SSMIS,
ATMS and SATCON
IWTC
VIII TC Intensity Analysis: ARCHER
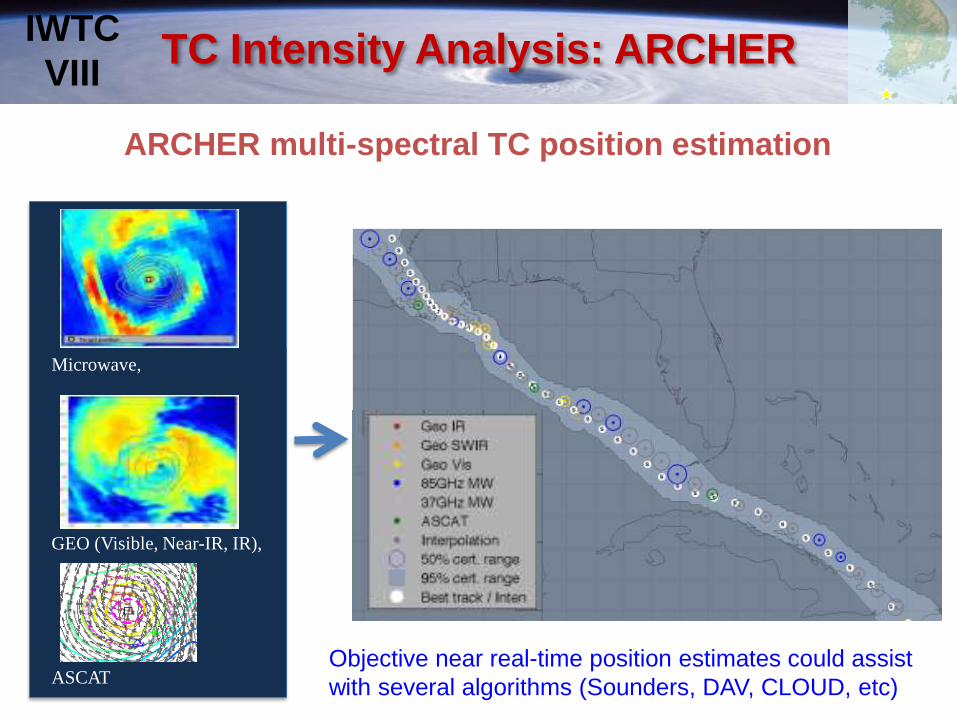
Microwave,
GEO (Visible, Near-IR, IR),
ASCAT
ARCHER multi-spectral TC position estimation
Objective near real-time position estimates could assist
with several algorithms (Sounders, DAV, CLOUD, etc)
IWTC
VIII TC Intensity Analysis: ARCHER

• Based on Dvorak EIR Technique
• Utilizes “Scene Type” logic tree
• Employs many of the rules and
intensity constraints
• Passive Microwave input since
2008
Spiral Centering
» First guess interpolated from official TC forecast
» Fits 5° log spiral to grid points within search radius around first guess position
» Calculates Tb gradients along spiral; determines position and rotation where minimum exists
Ring Fitting
» Spiral Centering position serves as first guess
» Fits series of rings with different radii at grid points within search region
» Searches for single ring that fits maximum Tb gradients
IWTC
VIII TC Intensity Analysis: CIMSS ADT

Utilization of Passive Microwave (PMW) Intensity Score
– “Organization/Eye Score” If ARCHER scores exceed empirically-
determined thresholds, ADT intensity estimates are adjusted.
– PMW code is now incorporated into latest version
ARCHER Score > 25
ADT T# raised to 4.3
Implementation of Updated TC Wind/Pressure Relationship The ADT estimates TC maximum sustained surface winds. To get the
accompanying minimum SLP, a wind>pressure relationship is used based
on recent research (Courtney et al. 2011).
IWTC
VIII TC Intensity Analysis: ADT

NORTH ATLANTIC – 2010 TC Season
– Independent comparisons between ADT and SAB intensity estimates
– ADT and SAB estimates w/in +/- 30 minutes
– Closest NHC Best Track intensity (co-located w/ aircraft
reconnaissance in situ measurement w/in 2 hours)
106 total matches (homogeneous)
bias aae stdv
SAB:CI# -0.22 0.48 0.57
SAB:Win -1.40 7.77 10.23
SAB:MSL 5.01 8.20 9.78
ADT:CI# -0.02 0.58 0.73
ADT:Win 2.59 8.22 10.47
ADT:MSL 2.22 8.94 11.35
Note: SAB analysts do have access to, or
awareness of, the recon reports. While this
influence is difficult to quantify, it offers a
stringent comparison test for the ADT.
IWTC
VIII TC Intensity Analysis: ADT

University of Arizona Deviation Angle Variance – Technique
Objective IR-based method that measures level of axisymmetry
- Imagery re-sampled to 10 km resolution
- Best Track used for position estimate (new innovation)
- DA calculated at each pixel at a radius from the TC center
- Distribution of DA values is related to intensity
Ideal Case
Real Case
IWTC
VIII TC Intensity Analysis: DAV-T
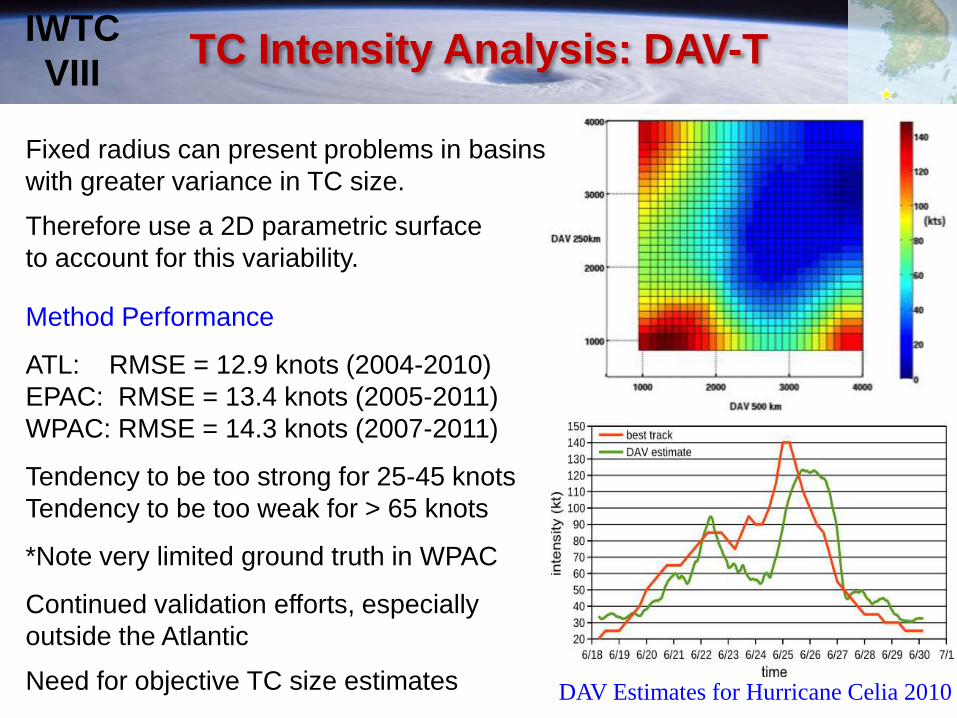
Fixed radius can present problems in basins
with greater variance in TC size.
Therefore use a 2D parametric surface
to account for this variability.
Method Performance
ATL: RMSE = 12.9 knots (2004-2010)
EPAC: RMSE = 13.4 knots (2005-2011)
WPAC: RMSE = 14.3 knots (2007-2011)
Tendency to be too strong for 25-45 knots
Tendency to be too weak for > 65 knots
*Note very limited ground truth in WPAC
Continued validation efforts, especially
outside the Atlantic
Need for objective TC size estimates
IWTC
VIII TC Intensity Analysis: DAV-T
DAV Estimates for Hurricane Celia 2010

JMA Cloud Grid Information Objective Dvorak Analysis (CLOUD)
Semi-objective IR-based method that provides a continuum of estimates
starting with Early Dvorak Analysis through the Dvorak Technique
Cloud patterns are picked by the analyst
- Early Stage, Curved Band, Eye, Embedded Center, Shear
Manual center location is then
performed
CLOUD then computes a CI#
Estimates are performed hourly and
then a 3 hour average is used for
the CI
JMA CLOUD results compared to aircraft
data during ITOP 2010 (Kishimoto 2014)
IWTC
VIII TC Intensity Analysis: CLOUD

Shanghai Institute TC Intensity Method used at CMA
Use MTSAT digital IR data to extract features within 135 km related to
TC intensity.
Features computed are:
- Number of convective cores
- Distance of these cores to TC center
- Core blackbody temperature
Currently being used to aid in
post-analysis
Performance compared to CMA BT
Vmax = 0.912V6h + 0.009Num + 0.037Lon –
0.035Lat + 0.41DISmin + 0.019TBBdiff + 5.467
IWTC
VIII TC Intensity Analysis: Shanghai
Institute TC Intensity Method
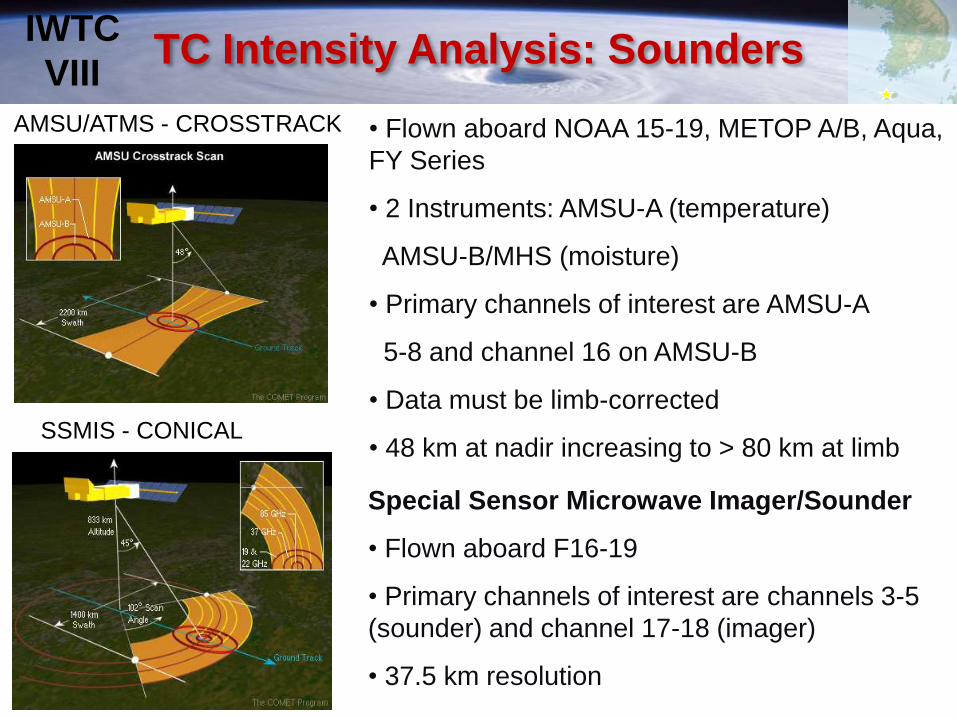
• Flown aboard NOAA 15-19, METOP A/B, Aqua,
FY Series
• 2 Instruments: AMSU-A (temperature)
AMSU-B/MHS (moisture)
• Primary channels of interest are AMSU-A
5-8 and channel 16 on AMSU-B
• Data must be limb-corrected
• 48 km at nadir increasing to > 80 km at limb
Special Sensor Microwave Imager/Sounder
• Flown aboard F16-19
• Primary channels of interest are channels 3-5
(sounder) and channel 17-18 (imager)
• 37.5 km resolution
AMSU/ATMS - CROSSTRACK
SSMIS - CONICAL
IWTC
VIII TC Intensity Analysis: Sounders

Temperature
Sounder
Resolution (km)
Moisture Sounder
/Imager Resolution
(km)
Swath Width
(km)
# of
Sats
Scan
Type
AMSU 48 (nadir) 79 x
149 (limb)
16 (nadir) 27 x 52
(limb) 2340 7
Cross-
track
SSMI
S 37.5 12 1700 4 Conical
ATMS 32 (nadir) 70 x
137 (limb)
16 (nadir) 30 x 68
(limb) 2500 1
Cross-
track
IWTC
VIII TC Intensity Analysis: Sounders

Channel 8
Channel 7
Channel 6
Channel 9
CIMSS AMSU Vertical Cross Section of
Tb Anomaly for Typhoon Lekima
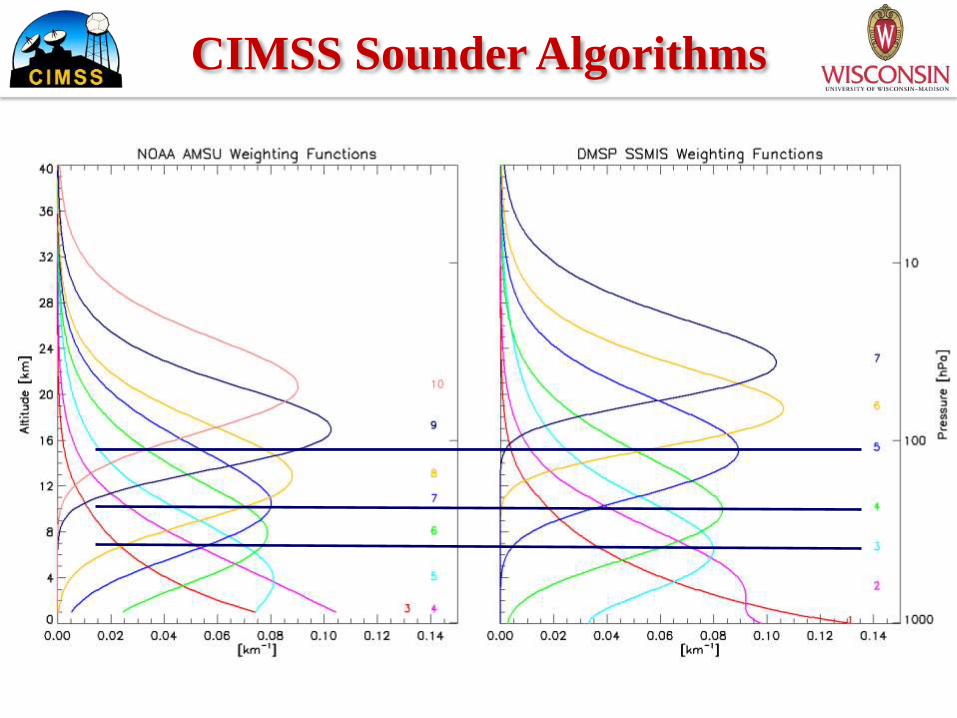
AMSU-A Weighting Functions
for channels 3-10
IWTC
VIII TC Intensity Analysis: Sounders

Compute environmental temperature
Locate warmest pixel
Calculate Tb anomaly
AMSU Channel 6 vs Delta_P
-20
-10
0
10
20
30
40
50
60
70
80
90
100
110
-2 -1 0 1 2 3 4 5 6 7
Chaneel 6 Tb Anomaly (K)
TC
Pre
sure
An
om
aly
(m
b)
AMSU Channel 7 Tb vs Delta_P
-10
0
10
20
30
40
50
60
70
80
90
100
110
-1 0 1 2 3 4 5 6 7 8
Channel 7 Tb Anomaly (K)
TC
Pre
ssu
re A
no
ma
ly (
mb
)
AMSU Channel 8 vs Delta_P
0
10
20
30
40
50
60
70
80
90
100
110
120
-1 0 1 2 3 4 5 6 7 8
Channel 8 Tb Anomaly (K)
TC
Pre
ssu
re A
no
ma
ly (
mb
)
Filter sample to remove all cases where TC eye
is smaller than instrument resolution.
Get relationship between Tb anomaly and
MSLP anomaly
CIMSS Microwave Sounder Intensity Estimation: MSLP
IWTC
VIII TC Intensity Analysis: Sounders

Compute environmental temperature
Locate warmest pixel
Calculate Tb anomaly
CIMSS Microwave Sounder Intensity Estimation: MSLP
IWTC
VIII TC Intensity Analysis: Sounders
Correct Tbs for Hydrometeor
scattering
- For AMSU use a channel
differencing approach using
channels 2 and 15
Match anomalies to aircraft-measured
MSLP anomaly
Remove all cases where TC is small compared
To AMSU FOV

Under-sampling of TC warm core
due to FOV location offset from true TC position
Near Limb Footprint
Under-sampling of TC warm core
due to small TC eye
Apply bias correction
accounting for eyewall slope
Microwave Sounder MSLP Bias Corrections
IWTC
VIII TC Intensity Analysis: Sounders
AMSU Channel 6 vs Delta_P
-20
-10
0
10
20
30
40
50
60
70
80
90
100
110
-2 -1 0 1 2 3 4 5 6 7
Chaneel 6 Tb Anomaly (K)
TC
Pre
sure
An
om
aly
(m
b)
AMSU Channel 7 Tb vs Delta_P
-10
0
10
20
30
40
50
60
70
80
90
100
110
-1 0 1 2 3 4 5 6 7 8
Channel 7 Tb Anomaly (K)
TC
Pre
ssu
re A
no
ma
ly (
mb
)
AMSU Channel 8 vs Delta_P
0
10
20
30
40
50
60
70
80
90
100
110
120
-1 0 1 2 3 4 5 6 7 8
Channel 8 Tb Anomaly (K)
TC
Pre
ssu
re A
no
ma
ly (
mb
)

Compare to Instrument
Footprint
Get TC Eye Size
Adjust MSLP
if needed
Primary source is microwave estimate of eye size
from ARCHER
If ARCHER is not available then use IR estimate of
eye size from ADT
If neither is available use ATCF/Warning agency
estimate
IWTC
VIII TC Intensity Analysis: Sounders

CIMSS Microwave Sounder Intensity Estimation: Vmax
Primary term = Instrument-measured MSLP anomaly from MSLP algorithm
Secondary Term = Inner core Tb gradient
Same MSLP for these 2 warm
cores but different Vmax
Third term = Some measure of convective organization/magnitude.
- This relates to the efficiency of mixing
momentum to the surface.
- Derived from 89-91 GHz imagery
- For AMSU use AMSU-B. For
SSMIS/ATMS use ARCHER Again, same MSLP for these
2 storms but different Vmax
Finally: Correct Vmax for storm motion latitude & TC size
IWTC
VIII TC Intensity Analysis: Sounders

CIRA AMSU
Statistical-based temperature retrieval at 23 vertical levels
Tbs are corrected to account for CLW and Ice Scattering Attenuation
6 Parameters Used in Multiple Regression to Estimate MSLP and Vmax
- Maximum Tb anomaly, scan resolution
- Derived pressure drop from 0-600 km
- Tangential wind at z= 5 km,
- RMW at z = 3 km
- CLW
Temperature anomly for Typhoon Usagi
September 20 , 2013 1300 UTC
IWTC
VIII TC Intensity Analysis: Sounders

Estimates of R34, R50 and R64 are also produced
Estimates of MSLP, Vmax and structure parameters provided to NHC
and JTWC via ATCF
Performance
Algorithm performs best for storms
< 65 knots
Too weak bias when TC eye is small
Vmax MAE = 10.8 knots
Vmax RMSE = 14.0 knots
CIRA AMSU Estimates for Typhoon Usagi
September 20 , 2013 1300 UTC
CIRA AMSU
IWTC
VIII TC Intensity Analysis: Sounders

JMA AMSU (2013)
Tb Anomalies derived from AMSU Channels 6-8
Anomalies matched to 22 TCs in 2008 and
tested against 57 TCs in 2009-2011
Algorithm uses maximum anomaly from
AMSU channels 6-8
Bias correction is applied to estimates to
Account for position offset of AMSU FOV
Relative to true TC position based on BT
Scattering of Ice Water (Grody 2001) is used
to correct Tb for attenuation due to
hydrometeors
Validation versus JMA Dvorak Yielded Bias of 0.3 hPa and MAE of 10.1 hPa
IWTC
VIII TC Intensity Analysis: Sounders
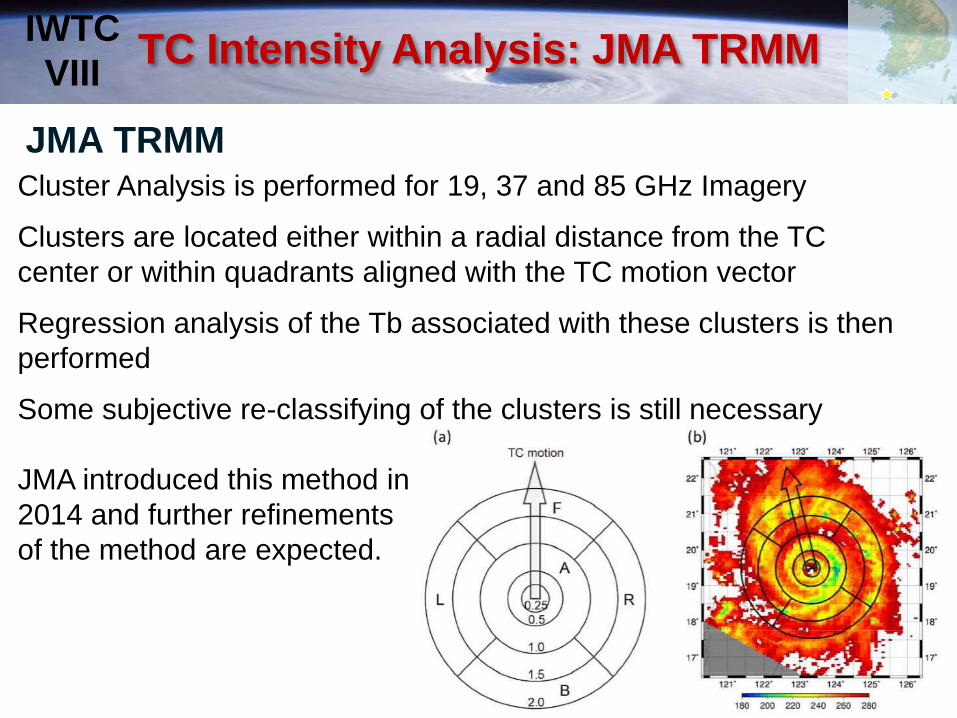
JMA TRMM Cluster Analysis is performed for 19, 37 and 85 GHz Imagery
Clusters are located either within a radial distance from the TC
center or within quadrants aligned with the TC motion vector
Regression analysis of the Tb associated with these clusters is then
performed
Some subjective re-classifying of the clusters is still necessary
JMA introduced this method in
2014 and further refinements
of the method are expected.
IWTC
VIII TC Intensity Analysis: JMA TRMM

The CSU Fundamental Climate Data Record (FCDR) project provides inter-calibrated SSM/I & SSMIS sensors. (Sapiano et al. 2012; Berg et al. 2012). TMI-AMSR-E data sets provided by NASA. WindSat digital data provided by NRL-DC WindSat team
TMI
AMSR-E/2
WINDSAT
# of TC overpasses
3000
6400
7200
13000
9600
10300
6400
4300
2400
19600
8500
?
~100,000
IWTC
VIII TC Intensity Analysis: Imagers

GOES Visible SSM/I 85 GHz
Microwave imager data provides structural characteristics not always found in typical Vis/IR imagery.
Segmented 85 GHz
Image feature extraction
Machine Learning Application
Leave-One(TC)-Out Cross Validation
Training and Testing
Utilize new NRL TC microwave imager data set with
consistent 89 GHz, 37 GHz Tbs, remapping & recentering
Feature selection to reduce redundant and irrelevant features
IWTC
VIII TC Intensity Analysis: Imagers
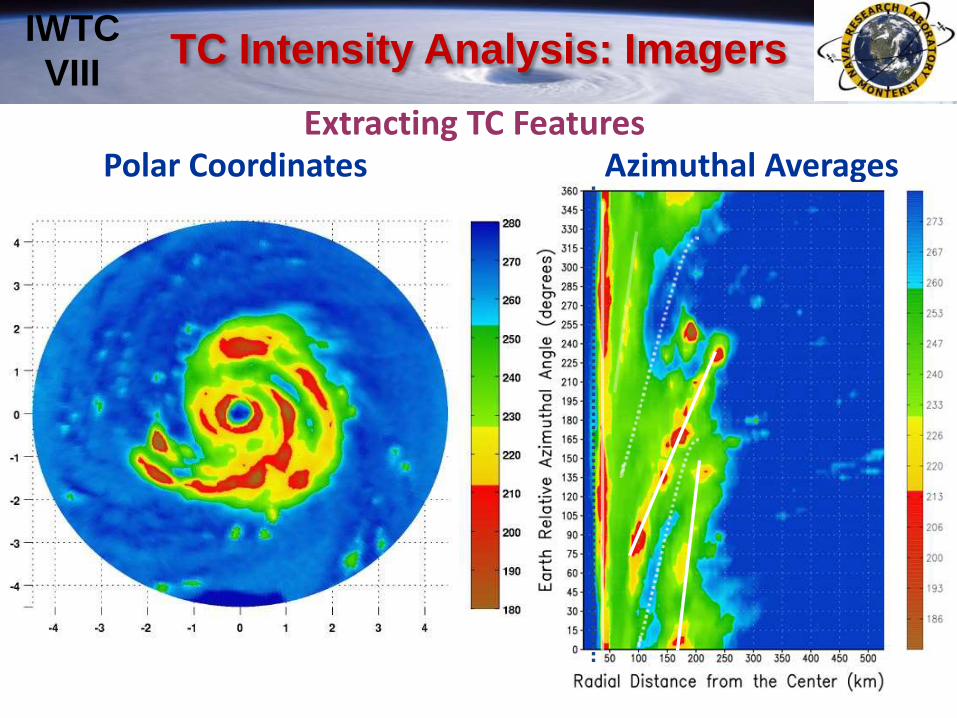
Extracting TC Features Polar Coordinates Azimuthal Averages
IWTC
VIII TC Intensity Analysis: Imagers

TC Feature Extraction: Gradient Axisymmetric
The deviation angle of the gradient vector (calculated at every pixel in a 2 deg radius – left panel) from a radial extending from the center pixel is determined. The variance of the deviation angle of the gradient vector is calculated as the axisymmetric measure. (Courtesy of Liz Ritchie, U. of Arizona)
Stronger storms have more organized rainbands and eyewall features and produce lower deviation variance values (implying higher axisymmetry).
Weaker storms have disorganized rainbands and the variance values are higher (lower axisymmetry).
Best Track: 40 kts Low gradient axisymmetry
Best Track: 90 kts High gradient axisymmetry
Significant convection: Intensity estimate too high without axisymmetry measure.
Minimal convection: Intensity estimate too low without axisymmetry measure.
Θ
IWTC
VIII TC Intensity Analysis: Imagers
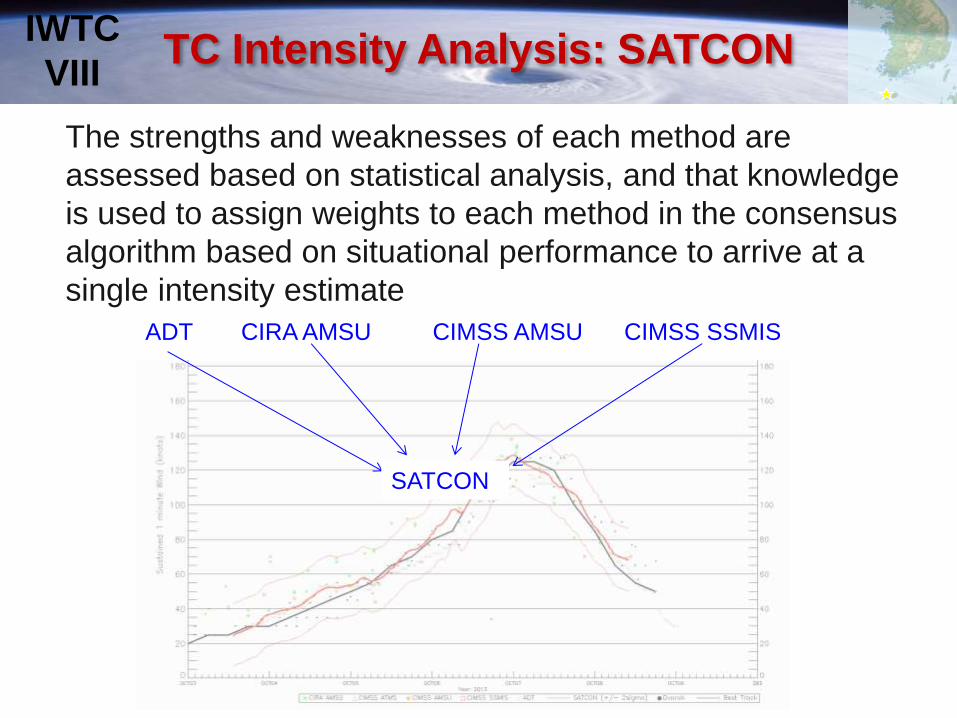
The strengths and weaknesses of each method are
assessed based on statistical analysis, and that knowledge
is used to assign weights to each method in the consensus
algorithm based on situational performance to arrive at a
single intensity estimate
ADT CIRA AMSU CIMSS AMSU CIMSS SSMIS
SATCON
IWTC
VIII TC Intensity Analysis: SATCON
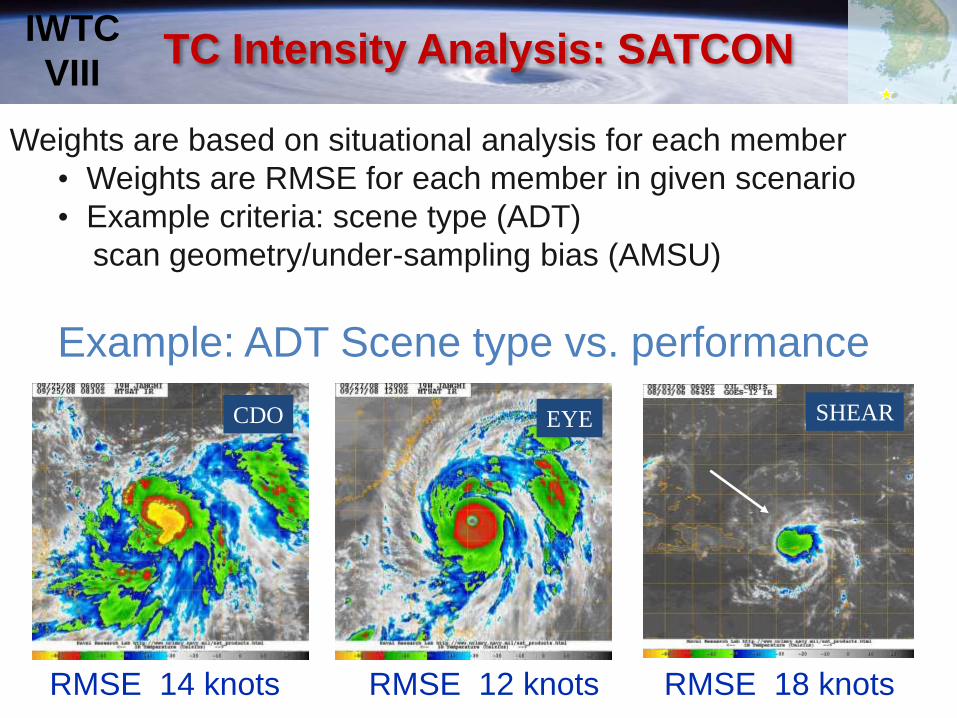
Example: ADT Scene type vs. performance
Weights are based on situational analysis for each member
• Weights are RMSE for each member in given scenario
• Example criteria: scene type (ADT)
scan geometry/under-sampling bias (AMSU)
RMSE 14 knots RMSE 12 knots RMSE 18 knots
CDO EYE SHEAR
IWTC
VIII TC Intensity Analysis: SATCON

CIRA RMSE 12 knots
CIMSS RMSE 10 knots
CIRA RMSE 15 knots
CIMSS RMSE 12 knots
CIRA RMSE 18 knots
CIMSS RMSE 15 knots
A B C
AMSU weights are dependent on:
• TC position relative to AMSU warm core position
• TC eye size (AMSU resolution is 50 km at nadir)
IWTC
VIII TC Intensity Analysis: SATCON
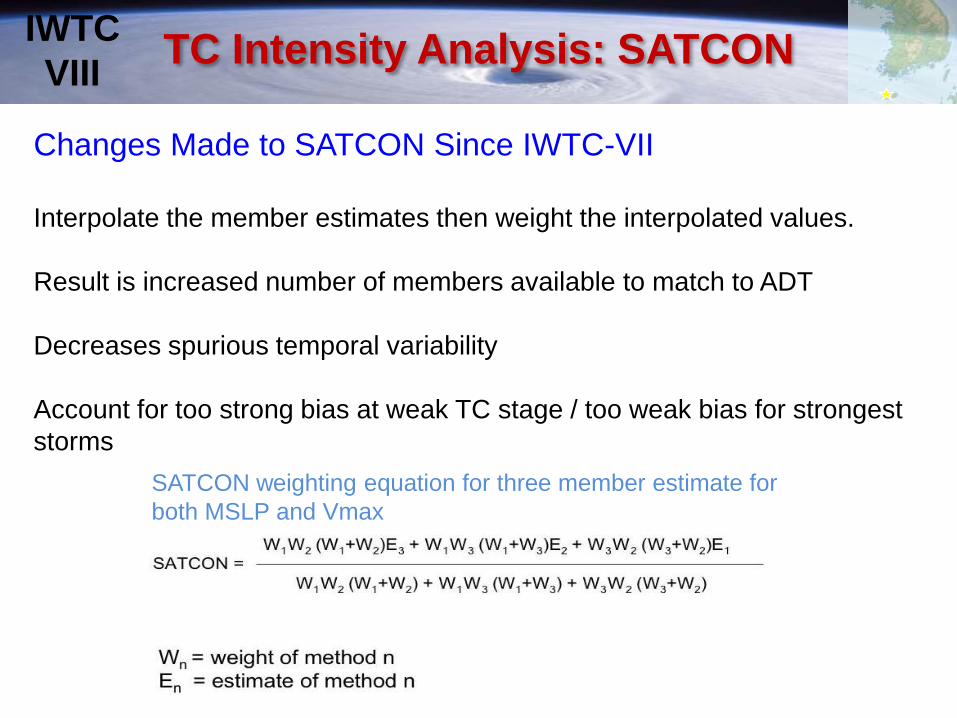
SATCON weighting equation for three member estimate for
both MSLP and Vmax
Interpolate the member estimates then weight the interpolated values.
Result is increased number of members available to match to ADT
Decreases spurious temporal variability
Account for too strong bias at weak TC stage / too weak bias for strongest
storms
IWTC
VIII TC Intensity Analysis: SATCON
Changes Made to SATCON Since IWTC-VII
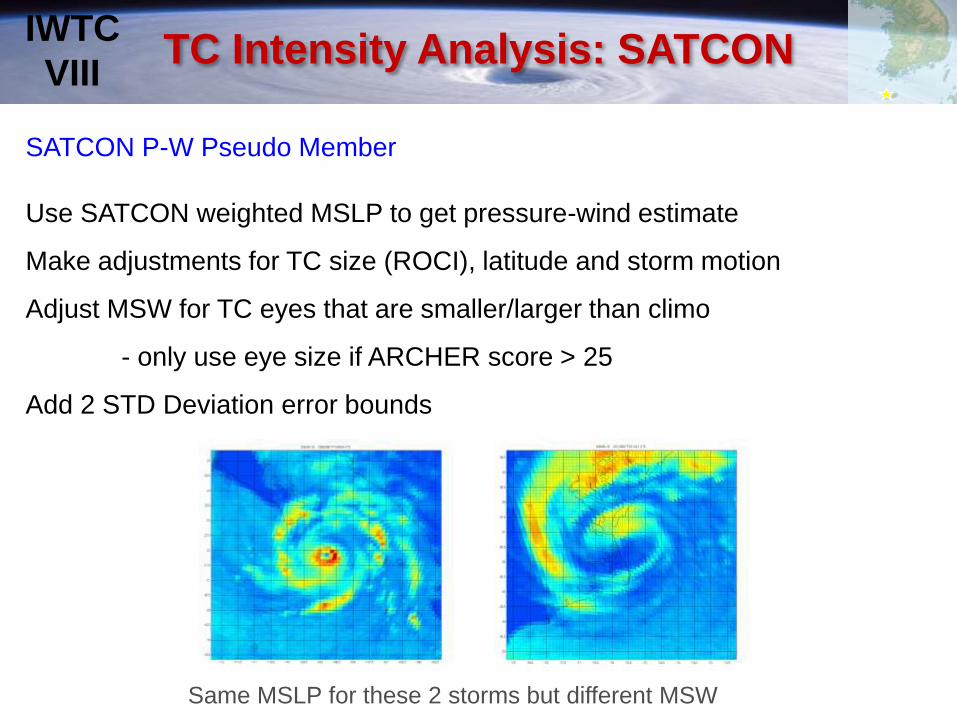
Use SATCON weighted MSLP to get pressure-wind estimate
Make adjustments for TC size (ROCI), latitude and storm motion
Adjust MSW for TC eyes that are smaller/larger than climo
- only use eye size if ARCHER score > 25
Add 2 STD Deviation error bounds
Same MSLP for these 2 storms but different MSW
IWTC
VIII TC Intensity Analysis: SATCON
SATCON P-W Pseudo Member

ERC
IWTC
VIII TC Intensity Analysis: SATCON
CIMSS SATCON for Hurricane Earl 2010

ERC
IWTC
VIII TC Intensity Analysis: SATCON
CIMSS SATCON for Super Typhoon Haiyan 2013
IWTC
VIII TC Intensity Analysis: SATCON
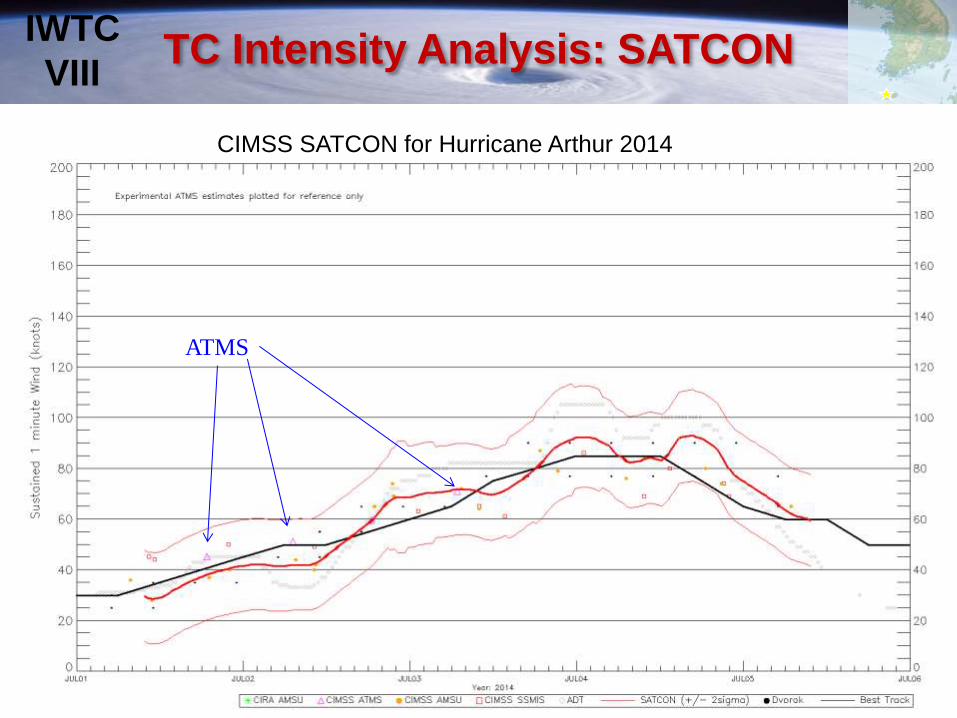
CIMSS SATCON for Hurricane Arthur 2014
ATMS
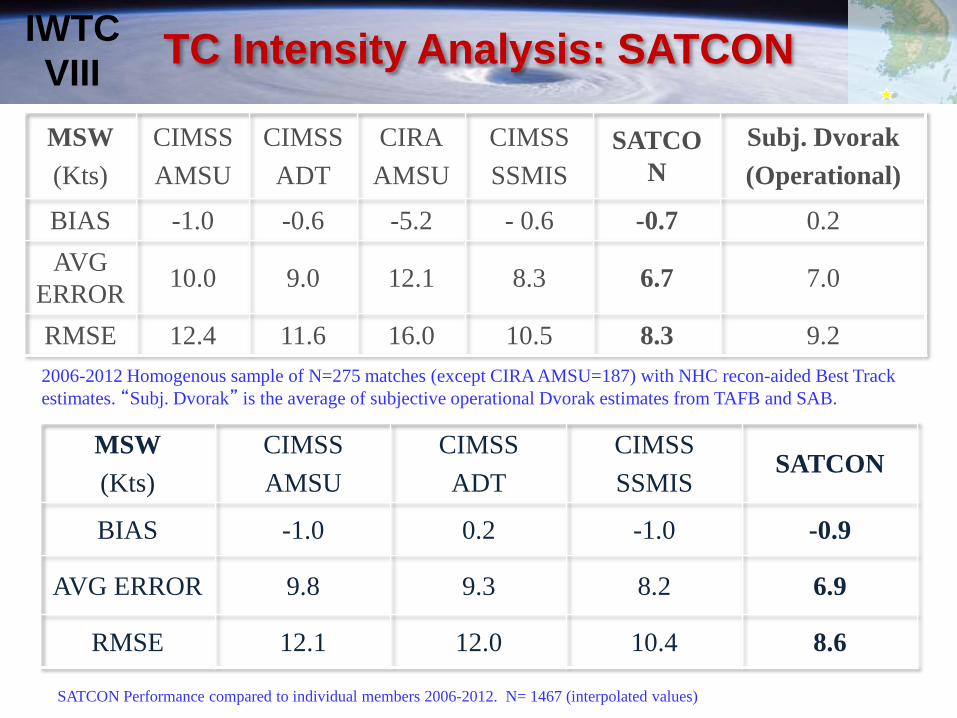
MSW
(Kts)
CIMSS
AMSU
CIMSS
ADT
CIRA
AMSU
CIMSS
SSMIS
SATCO
N
Subj. Dvorak
(Operational)
BIAS -1.0 -0.6 -5.2 - 0.6 -0.7 0.2
AVG
ERROR 10.0 9.0 12.1 8.3 6.7 7.0
RMSE 12.4 11.6 16.0 10.5 8.3 9.2
2006-2012 Homogenous sample of N=275 matches (except CIRA AMSU=187) with NHC recon-aided Best Track
estimates. “Subj. Dvorak” is the average of subjective operational Dvorak estimates from TAFB and SAB.
MSW
(Kts)
CIMSS
AMSU
CIMSS
ADT
CIMSS
SSMIS SATCON
BIAS -1.0 0.2 -1.0 -0.9
AVG ERROR 9.8 9.3 8.2 6.9
RMSE 12.1 12.0 10.4 8.6
SATCON Performance compared to individual members 2006-2012. N= 1467 (interpolated values)
IWTC
VIII TC Intensity Analysis: SATCON
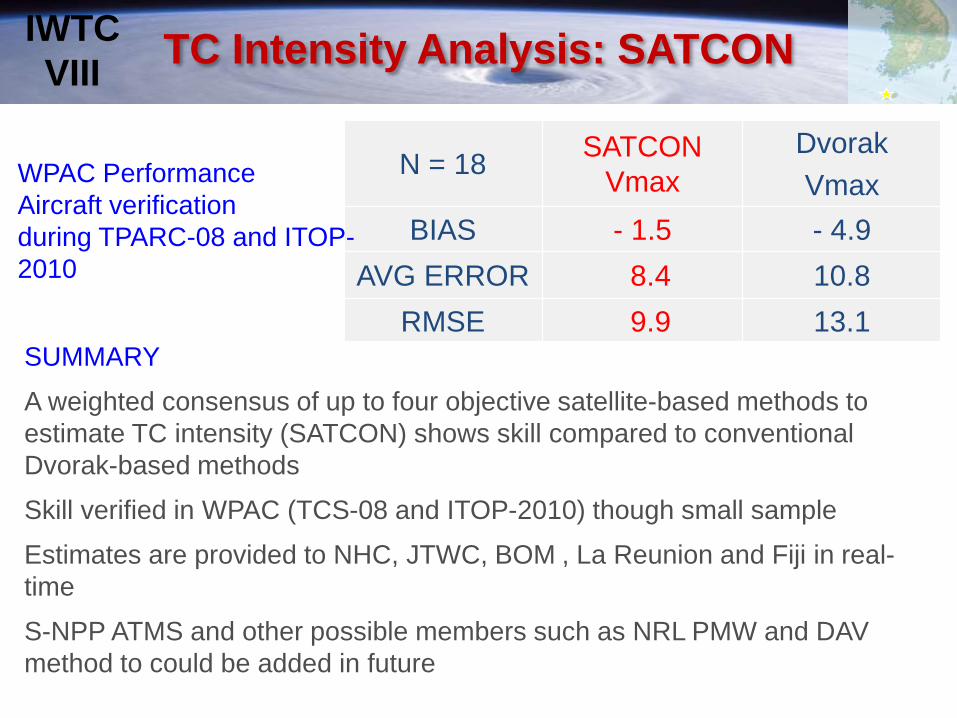
N = 18 SATCON
Vmax
Dvorak
Vmax
BIAS - 1.5 - 4.9
AVG ERROR 8.4 10.8
RMSE 9.9 13.1 SUMMARY
A weighted consensus of up to four objective satellite-based methods to
estimate TC intensity (SATCON) shows skill compared to conventional
Dvorak-based methods
Skill verified in WPAC (TCS-08 and ITOP-2010) though small sample
Estimates are provided to NHC, JTWC, BOM , La Reunion and Fiji in real-
time
S-NPP ATMS and other possible members such as NRL PMW and DAV
method to could be added in future
IWTC
VIII TC Intensity Analysis: SATCON
WPAC Performance
Aircraft verification
during TPARC-08 and ITOP-
2010

CIRA Multi-Platform Tropical Cyclone Surface Wind Analysis
Objectively combines surface wind vectors derived from AMSU,
scatterometers and geostationary feature track winds.
Each source is given a weight based on storm intensity and
proximity to the TC inner core.
25 KT 35 KT 65 KT
IWTC
VIII TC Intensity Analysis: MTCSWA

All wind vectors are adjusted to a 700 hPa level then reduced to sea level
using a factor of 0.9 within 100 km then linearly decreasing to a factor
of 0.75 out to 700 km
The 0.9 factor assumes that convection
is active in the TC inner core
Motion asymmetry is added
Work well for depicting the 2D wind
field and can be used for intensity
analysis for weaker TCs or storms
with a broad inner core
IWTC
VIII TC Intensity Analysis: SATCON

Thanks to
Kim Wood, Joe Courtney, Jeff Hawkins, Tsukasa Fujita, Thierry DuPont,
Xiaoqin Lu and Hui Yu
Panel discussion on Evolving Methods to Estimate TC Intensity from Satellites
Today noon – 1:10
Objective TC Intensity Analysis IWTC
VIII

Adjust AMSU
pressure if
needed
ADT Estimate of Eye Size
Compare to AMSU-A
FOV resolution
Example: ADT provides
information to AMSU
In eye scenes, IR can be used
to estimate eye size
CIMSS AMSU uses eye size
information to correct
resolution under-sampling
CIRA estimates can also
be corrected
CIMSS SATCON Algorithm Cross-algorithm information sharing
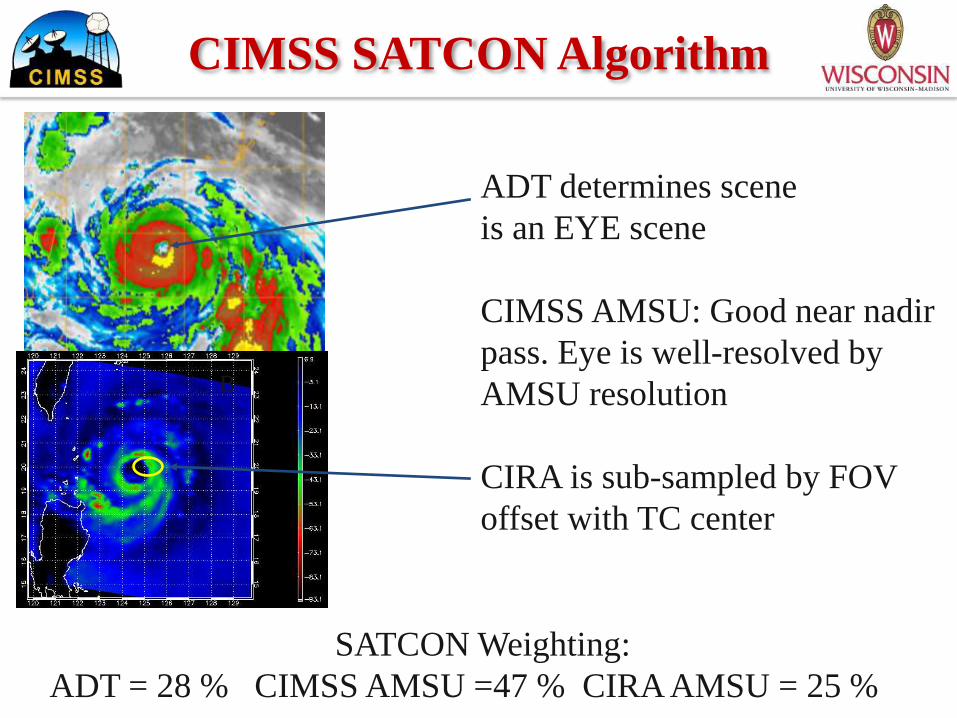
ADT determines scene
is an EYE scene
CIMSS AMSU: Good near nadir
pass. Eye is well-resolved by
AMSU resolution
CIRA is sub-sampled by FOV
offset with TC center
SATCON Weighting:
ADT = 28 % CIMSS AMSU =47 % CIRA AMSU = 25 %
B
CIMSS SATCON Algorithm

ADT determines scene
is a SHEAR scene
CIMSS AMSU indicates no
sub-sampling present
CIRA AMSU: little sub-
sampling due to position offset
from FOV center
SATCON Weighting:
ADT = 18 % CIMSS AMSU =41 % CIRA AMSU = 41 %
Center of TS Chris
CIMSS SATCON Algorithm
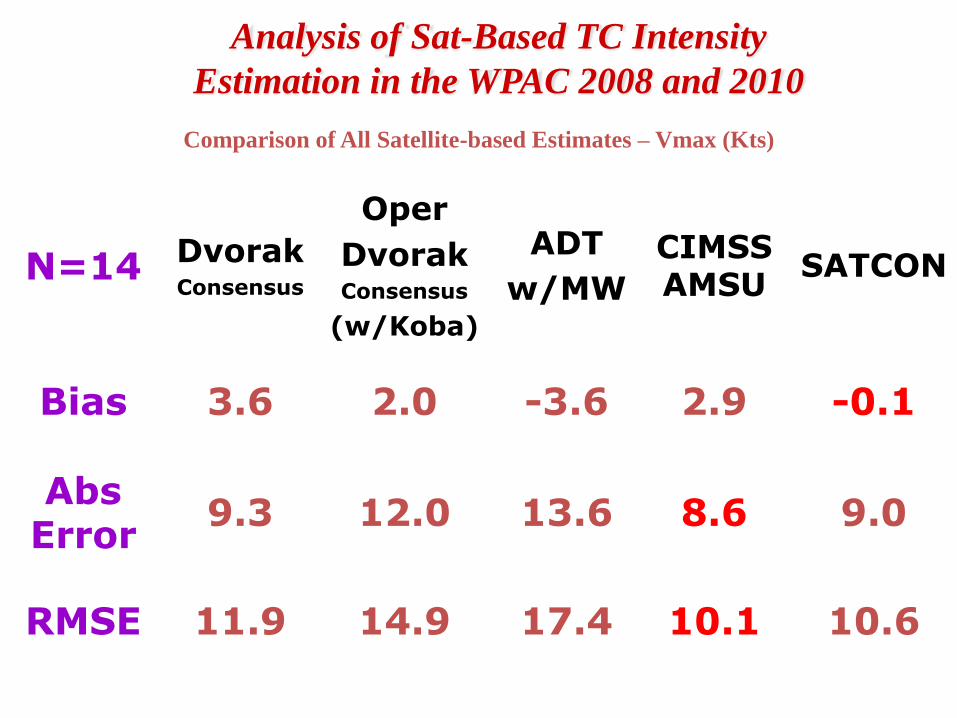
Analysis of Sat-Based TC Intensity
Estimation in the WPAC 2008 and 2010
N=14 Dvorak Consensus
Oper
Dvorak Consensus
(w/Koba)
ADT
w/MW
CIMSSAMSU
SATCON
Bias 3.6 2.0 -3.6 2.9 -0.1
Abs Error
9.3 12.0 13.6 8.6 9.0
RMSE 11.9 14.9 17.4 10.1 10.6
Positive Bias indicates method estimates are too strong
Comparison of All Satellite-based Estimates – Vmax (Kts)

Analysis of Sat-Based TC Intensity Estimation
in the WNP During TCS-08
N=14 ‘Blind’
Dvorak Consensus
Oper
Dvorak Consensus
(w/Koba)
ADT
w/MW
CIMSSAMSU
SATCON
Bias 0.7 0.1 -1.0 -1.9 -1.3
Abs Error
5.2 7.5 10.7 4.9 6.0
RMSE 6.6 8.9 12.8 6.3 7.2
Positive Bias indicates method estimates are too strong. 2mem SATCON RMSE= 4.7
Blind and Oper Dvorak conversion is Knaff/Zehr
Comparison of All Satellite-based Estimates – MSLP (mb)

1999-2010 SATCON Compared to a Simple
Straight Consensus
N = 289 SATCON
MSLP
SIMPLE
MSLP
SATCON
Vmax
SIMPLE
Vmax
BIAS 0.1 - 1.6 -0.5 - 3.0
AVG
ERROR 4.6 5.0 7.1 8.1
RMSE 6.5 7.5 8.9 10.5
Independent sample. Vmax validation in knots vs. BT. MSLP validation in hPa vs.
recon. Negative bias = method was too weak. SIMPLE is simple average of the 3 members
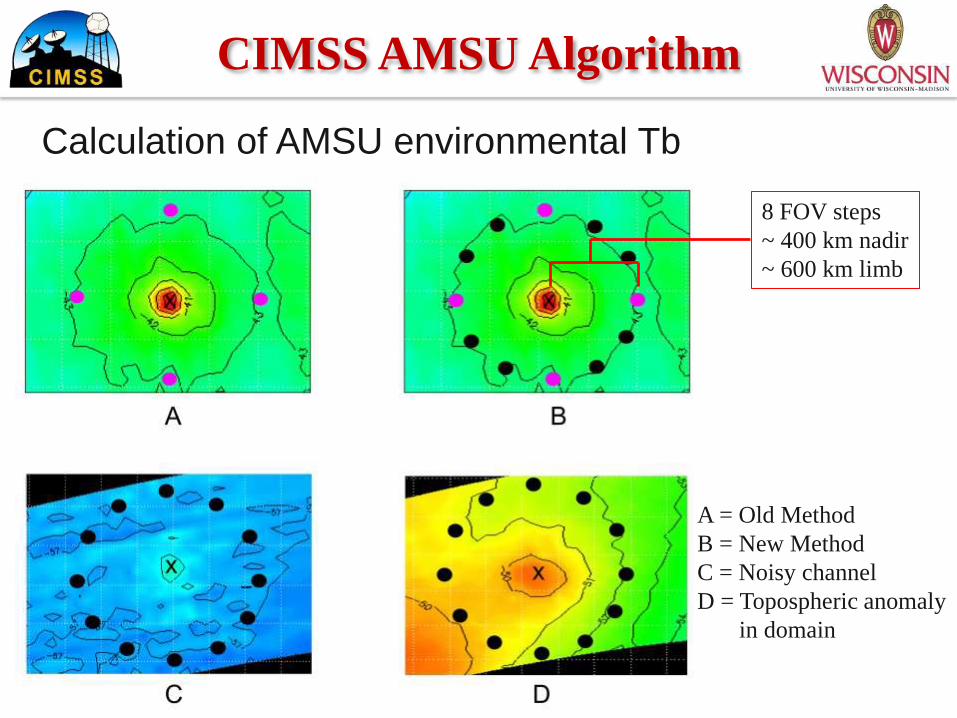
CIMSS AMSU Algorithm
Calculation of AMSU environmental Tb
8 FOV steps
~ 400 km nadir
~ 600 km limb
A = Old Method
B = New Method
C = Noisy channel
D = Topospheric anomaly
in domain
Microwave Sounders

AMSU-A Tb
anomaly > 1.4K ?
Eye Size < AMSU-A
FOV resolution ?
Get TC position and ancillary
data from ATCF
• previous (or forecast) 6-hour
position is used to estimate
storm motion and location
• Eye Size
• Environmental pressure (P_env)
Apply Limb Correction
to AMSU A/B data
Apply hydrometeor scattering
correction to AMSU-A channels 4-8
Locate warmest AMSU-A pixel (Tb_warmest)
within 2 FOV of TC center. Calculate the
environmental temperature (Tb_env) at a
distance of 8 FOV from TC center for
channels 6-8 then estimate Tb anomaly for
each channel (Tb_warmest - Tb_env)
Use each Tb anomaly value to get pressure
anomaly (del_P) contribution for that channel
Get weighted average of each channel-based
del-P to find initial TC del_P
Find average AMSU-B 89 Ghz Tb within
AMSU-A FOV using center-weighted averaging
(convolution of AMSU-B to AMSU-A)
Apply AMSU-B bias
correction to del_P
Apply resolution
bias correction
to del_P
Find AMSU-A Tb inner core gradient at
1 FOV and 2 FOV distant from center
for channel 7
Find largest AMSU-B 89 Ghz
gradient within 150 km of center
Estimate MSW using final del-P, latitude,
AMSU-A inner core gradient and AMSU-B
89Ghz gradient. Add 50% of storm motion
to MSW
Yes
CIMSS AMSU TC
Intensity Algorithm
MSLP = P_env - del_P
Yes
No
No
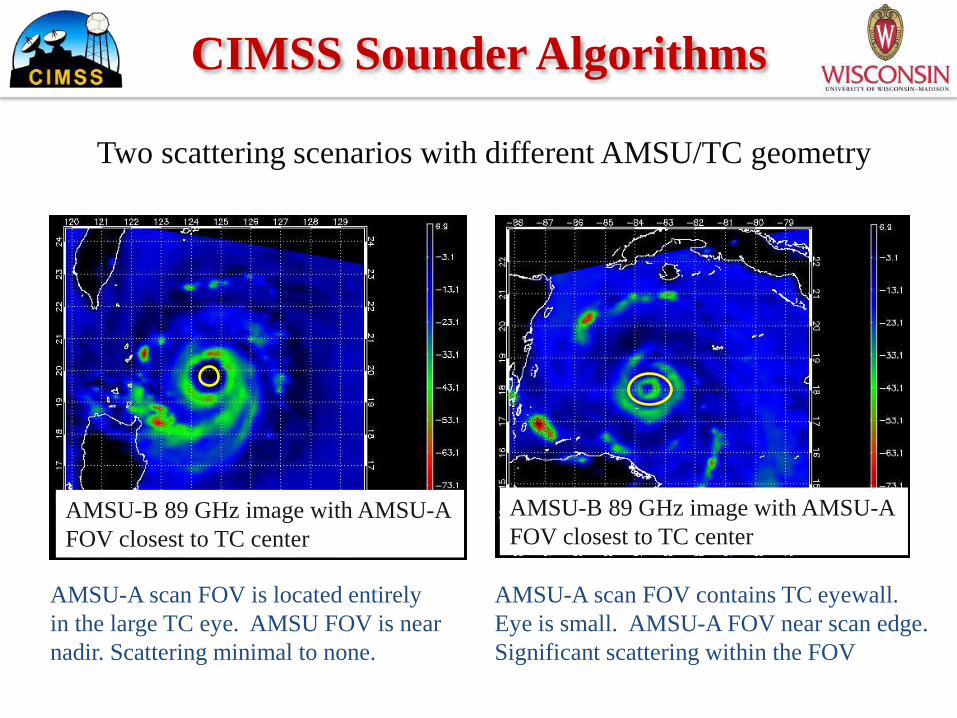
AMSU-A scan FOV is located entirely
in the large TC eye. AMSU FOV is near
nadir. Scattering minimal to none.
AMSU-A scan FOV contains TC eyewall.
Eye is small. AMSU-A FOV near scan edge.
Significant scattering within the FOV
CIMSS Sounder Algorithms
AMSU-B 89 GHz image with AMSU-A
FOV closest to TC center
AMSU-B 89 GHz image with AMSU-A
FOV closest to TC center
Two scattering scenarios with different AMSU/TC geometry

AMSU Channel 8 Tb Versus Recon MSLP
-1
0
1
2
3
4
5
6
7
90092094096098010001020
Channel 8 Tb anomalies versus aircraft-measured MSLP
Sources of Error
• Hydrometeor scattering near core
• Resolution issues related to core size
• Position of storm relative to scan position
Pressure (mb)
Tb A
nom
aly
(K
)
CIMSS AMSU Algorithm

-1
0
1
2
3
4
5
6
7
8
90092094096098010001020
Separate well-resolved cases from the sample
for each channel of interest
Pressure (mb)
Tb A
nom
aly
(K
)
Well-resolved cases
TC eye Size > FOV
CIMSS AMSU Algorithm
All Cases
CIMSS Sounder Algorithms

• Resolution of the instrument varies across the scan
swath due to the cross-track scanning strategy
• ATOVS AAPP Pre-Processor.
• Limb correct data (Goldberg et al 2001)
• Presence of hydrometeors can scatter/depress Tb’s
- Need to correct for attenuation effects
Microwave Sounders
FOV 1 FOV 30
50 km 80km 80 km
AMSU-A Scan Swath
CIMMS AMSU
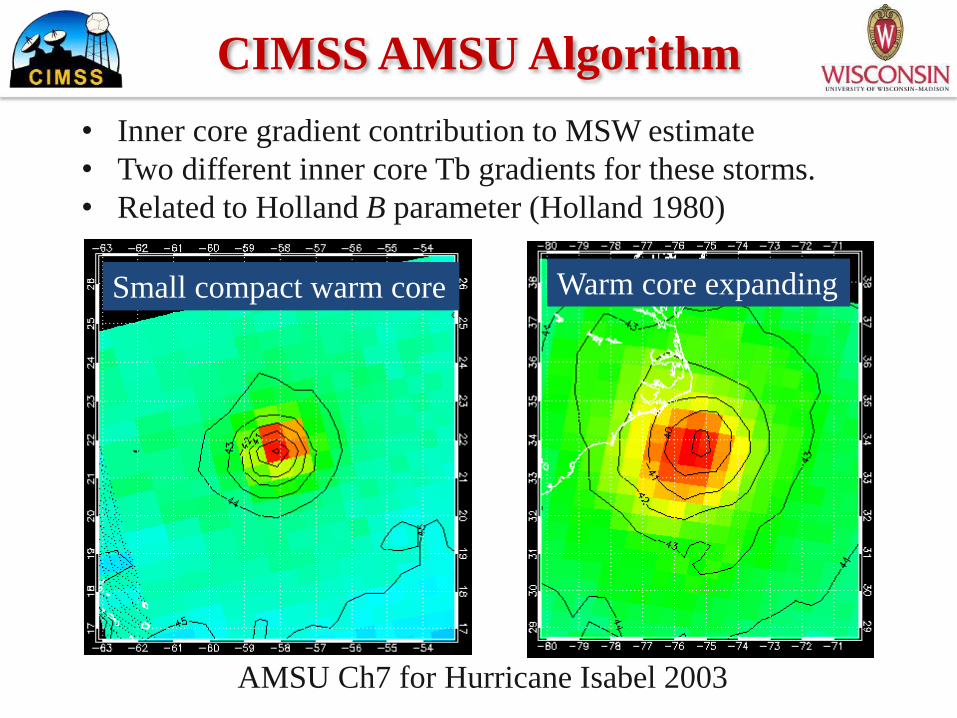
• Inner core gradient contribution to MSW estimate
• Two different inner core Tb gradients for these storms.
• Related to Holland B parameter (Holland 1980)
Small compact warm core Warm core expanding
AMSU Ch7 for Hurricane Isabel 2003
CIMSS AMSU Algorithm
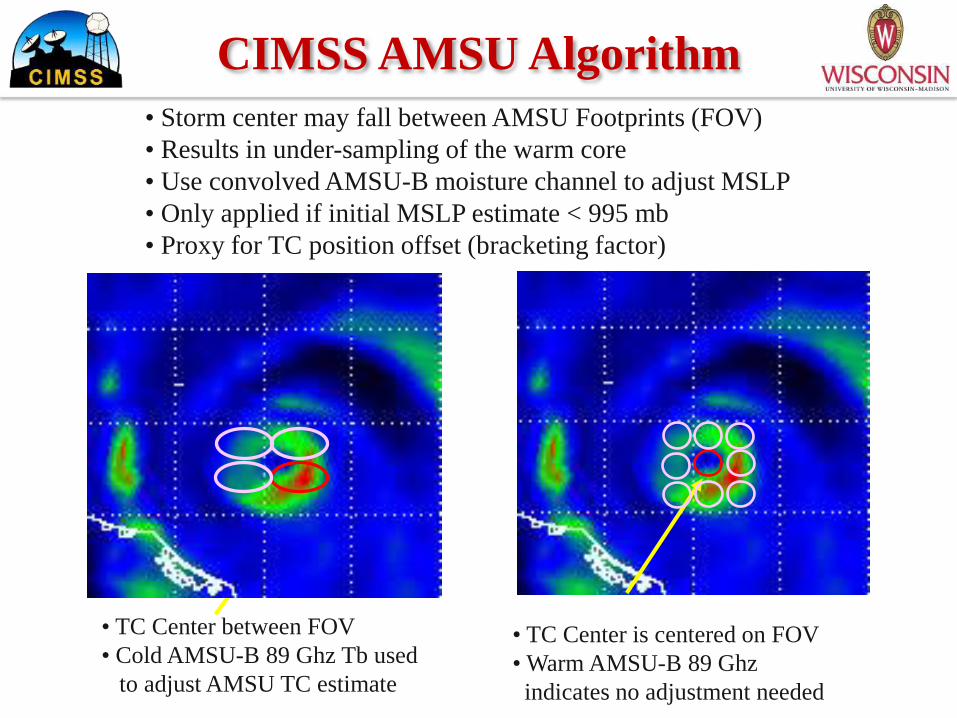
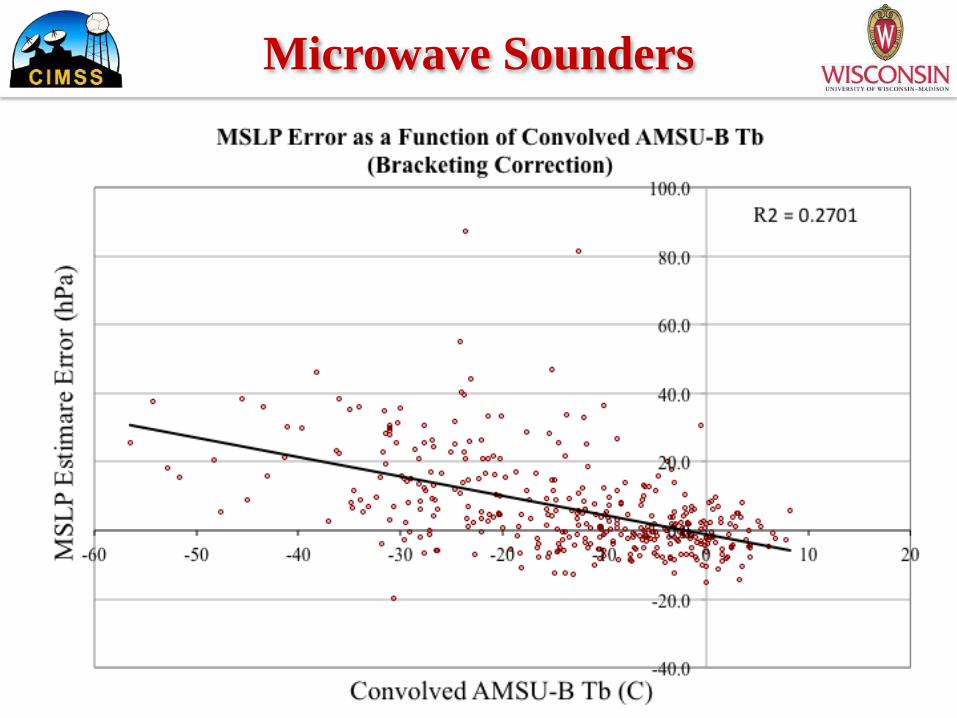
• Storm center may fall between AMSU Footprints (FOV)
• Results in under-sampling of the warm core
• Use convolved AMSU-B moisture channel to adjust MSLP
• Only applied if initial MSLP estimate < 995 mb
• Proxy for TC position offset (bracketing factor)
• TC Center between FOV
• Cold AMSU-B 89 Ghz Tb used
to adjust AMSU TC estimate
• TC Center is centered on FOV
• Warm AMSU-B 89 Ghz
indicates no adjustment needed
CIMSS AMSU Algorithm

AMSU-A in center no correction AMSU-A partially in eyewall,
apply correction
Eye smaller than AMSU-A FOV,
apply correction
Iris 2001. Core is very small and
AMSU-A FOV is in moat.
Signal suggests (incorrectly) that
no correction is required.
Midget TC

• Atmospheric sounding channels are similar to AMSU.
• Slight differences in the height the channels represent
• Much improved resolution at 37 km which is consistent across the
the scan swath due to the conical scanning strategy
• Improved resolution of co-located imager channels allows for
determination of TC structure information (eye size, RMW) at the
time of the sounder TC intensity estimate.
• Flown aboard F16-19
CIMSS SSMIS Algorithm

N = 876 AMSU
MSLP
Dvorak
MSLP
AMSU
MSW
Dvorak
MSW
BIAS - 0.4 - 2.2 - 0.3 - 2.6
AVG
ERROR 5.5 8.8 8.3 7.7
RMSE 7.6 11.7 10.8 10.0
1999-2012. Both dependent and independent data to maximize
sample size. Validation is recon pressure within 3 hours of AMSU
pass for pressure and Best Track coincident with recon for MSW.
Sample includes Atlantic, East Pacific and West Pacific (N=21).
CIMSS AMSU Algorithm
MSW = Maximum Sustained Winds

SDR data provided by FNMOC
Training data from 2006-2012 (ATL/EPAC/WPAC) N=369
- This period characterized by decreased storm activity and weaker storms
Algorithm logic similar to AMSU
Derive Tb anomalies for channels 3-5 and match to aircraft
measured pressure anomaly (P_env – MSLP)
CIMSS SSMIS Algorithm
CH 3 CH 4 CH 5

CIMSS ATMS Algorithm
AMSU SSMIS ATMS
MW Sounder
Inter-comparison.
Also use HAMSR
data from HS3 field
campaign.
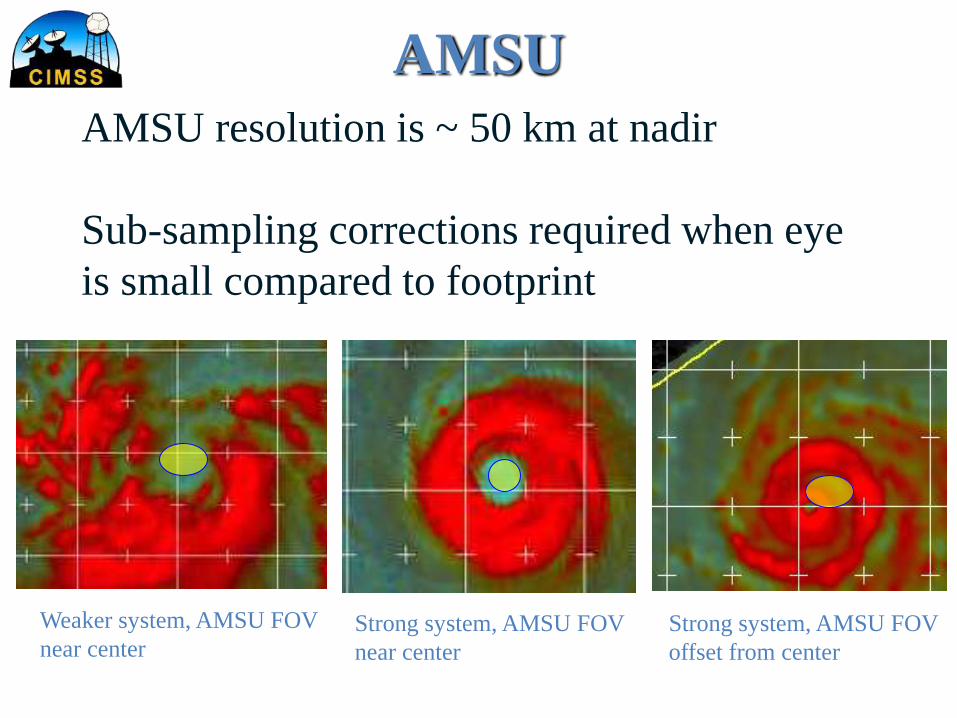
AMSU resolution is ~ 50 km at nadir
Sub-sampling corrections required when eye
is small compared to footprint
Weaker system, AMSU FOV
near center Strong system, AMSU FOV
near center
Strong system, AMSU FOV
offset from center
AMSU
Advanced Dvorak Technique
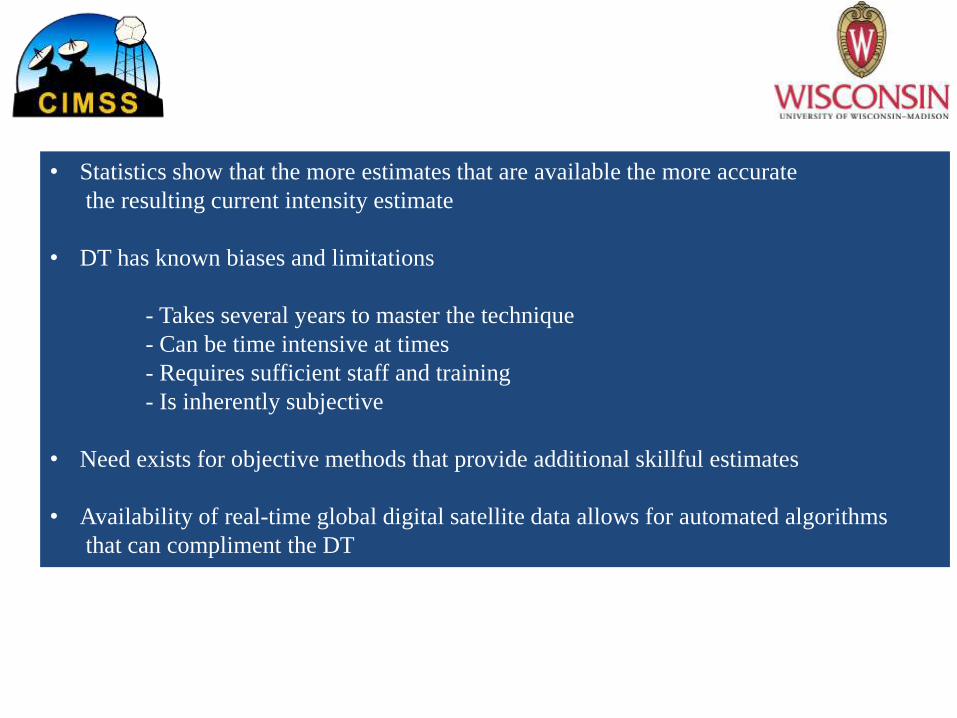
• Statistics show that the more estimates that are available the more accurate
the resulting current intensity estimate
• DT has known biases and limitations
- Takes several years to master the technique
- Can be time intensive at times
- Requires sufficient staff and training
- Is inherently subjective
• Need exists for objective methods that provide additional skillful estimates
• Availability of real-time global digital satellite data allows for automated algorithms
that can compliment the DT
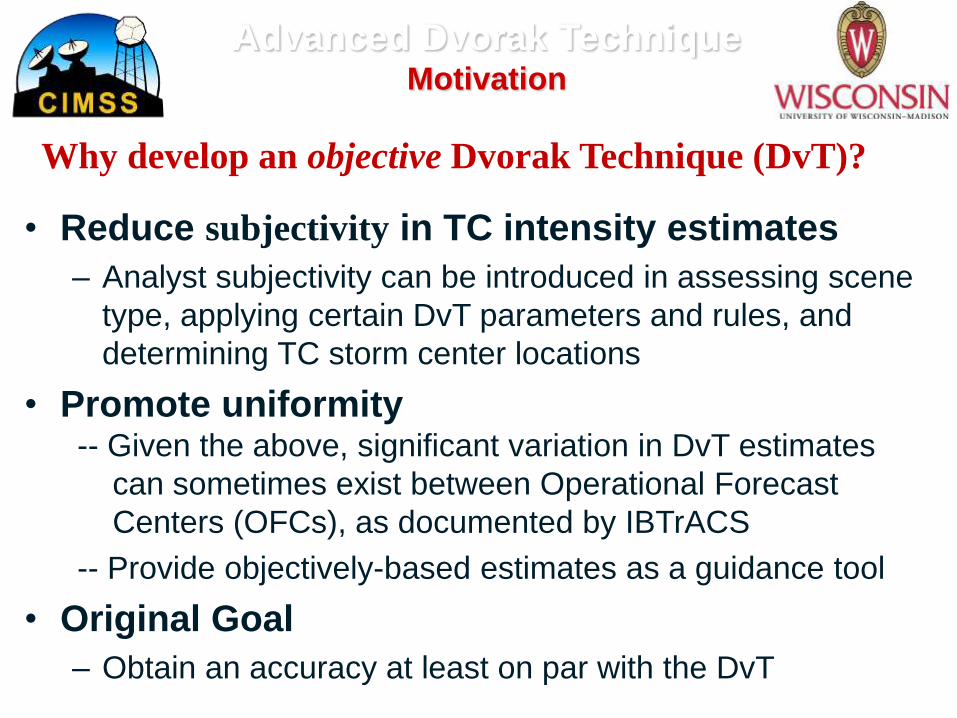
• Reduce subjectivity in TC intensity estimates
– Analyst subjectivity can be introduced in assessing scene
type, applying certain DvT parameters and rules, and
determining TC storm center locations
• Promote uniformity -- Given the above, significant variation in DvT estimates
can sometimes exist between Operational Forecast
Centers (OFCs), as documented by IBTrACS
-- Provide objectively-based estimates as a guidance tool
• Original Goal
– Obtain an accuracy at least on par with the DvT
Why develop an objective Dvorak Technique (DvT)?
Advanced Dvorak Technique Motivation

Advanced Dvorak Technique Description Summary
• Features of the ADT
– Utilizes Longwave IR imagery; enhanced with microwave data
– Based on original manual Dvorak Technique (DvT), but
expands upon the analysis principles
– Completely automated and objective
– Can provide rapid-refresh (5-min)
real-time estimates (DvT is only 6-hourly)
****************************************************
UW - CIMSS
ADVANCED DVORAK TECHNIQUE
ADT-Version 8.1.3
Tropical Cyclone Intensity Algorithm
----- Current Analysis -----
Date : 28 AUG 2005 Time : 154500 UTC
Lat : 26:14:25 N Lon : 88:20:05 W
CI# /Pressure/ Vmax
6.8 / 926.0mb/134.8kt
Final T# Adj T# Raw T#
6.7 6.7 6.7
Latitude bias adjustment to MSLP : -0.6mb
Estimated radius of max. wind based on IR : 33 km
Center Temp : +20.2C Cloud Region Temp : -69.9C
Scene Type : EYE
Positioning Method : RING/SPIRAL COMBINATION
Ocean Basin : ATLANTIC
Dvorak CI > MSLP Conversion Used : ATLANTIC
Tno/CI Rules : Constraint Limits : NO LIMIT
Weakening Flag : ON
Rapid Dissipation Flag : OFF
****************************************************
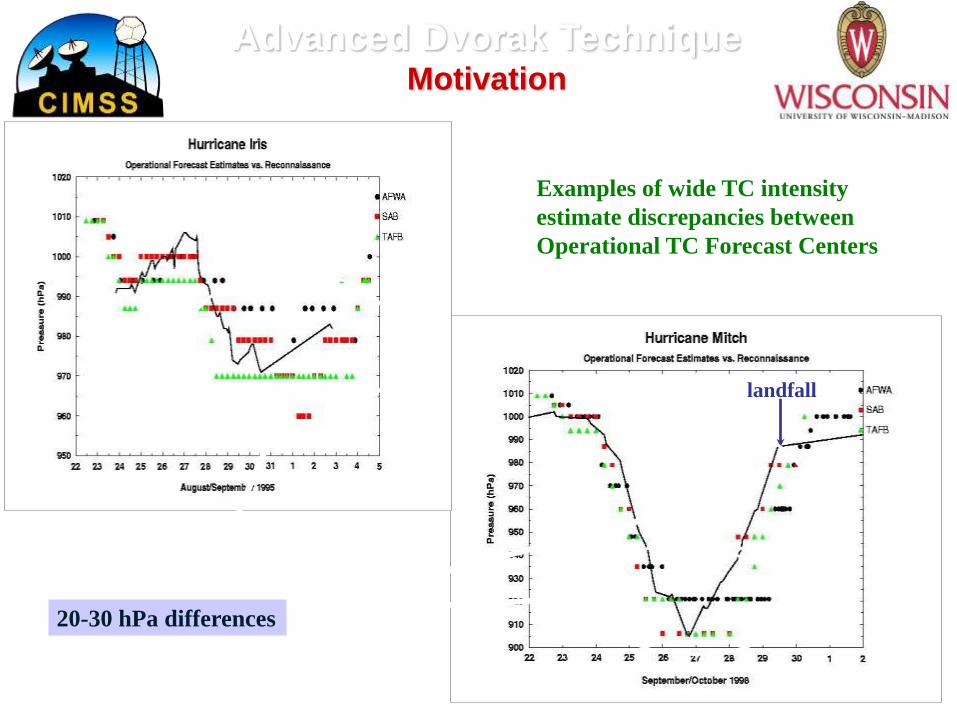
landfall
Examples of wide TC intensity
estimate discrepancies between
Operational TC Forecast Centers
20-30 hPa differences
Advanced Dvorak Technique Motivation

Advanced Dvorak Technique ADT Development Timeline
• The development timeline of the ADT
1980s
Dvorak objective EIR
technique outlined
(Dvorak, 1984)
Late 1980s – 1990’s
DD - Digital Dvorak
technique (Zehr, 1989)
1995 - 2001
ODT - Objective Dvorak
Technique
(Velden et al., 1998)
2001 – 2004
AODT - Advanced
Objective Dvorak
Technique
(Olander et al., 2002)
2004 - present
ADT - Advanced
Dvorak Technique
(Olander and
Velden, 2007)
1990 1985 1995 2000 2005
Advanced Dvorak Technique ADT Development History
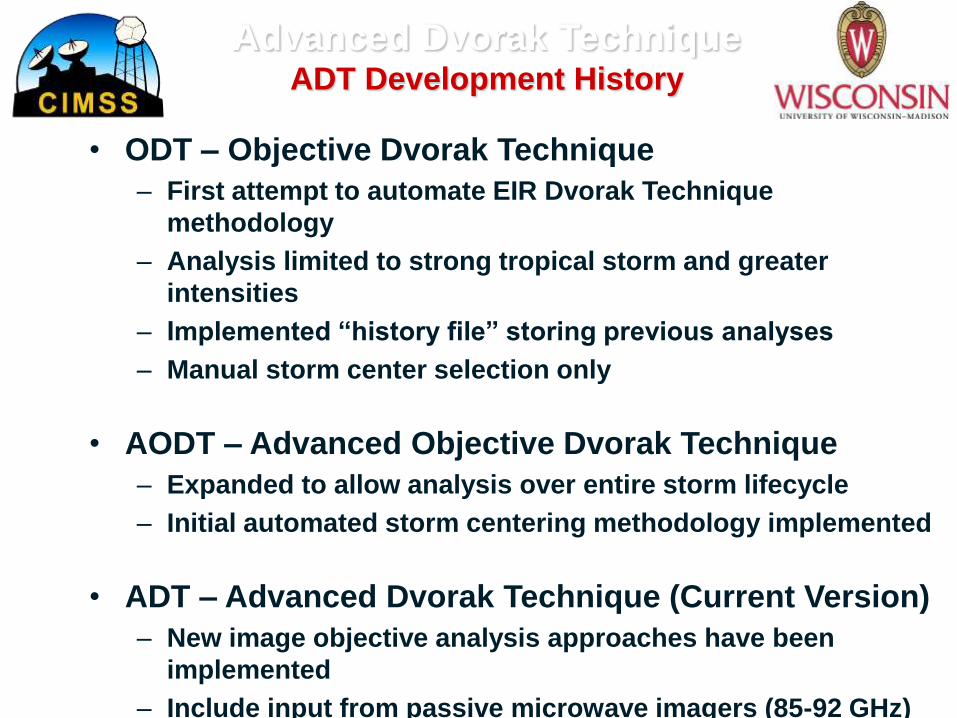
• ODT – Objective Dvorak Technique
– First attempt to automate EIR Dvorak Technique
methodology
– Analysis limited to strong tropical storm and greater
intensities
– Implemented “history file” storing previous analyses
– Manual storm center selection only
• AODT – Advanced Objective Dvorak Technique
– Expanded to allow analysis over entire storm lifecycle
– Initial automated storm centering methodology implemented
• ADT – Advanced Dvorak Technique (Current Version)
– New image objective analysis approaches have been
implemented
– Include input from passive microwave imagers (85-92 GHz)
– Added advanced automated storm centering routine
(ARCHER)
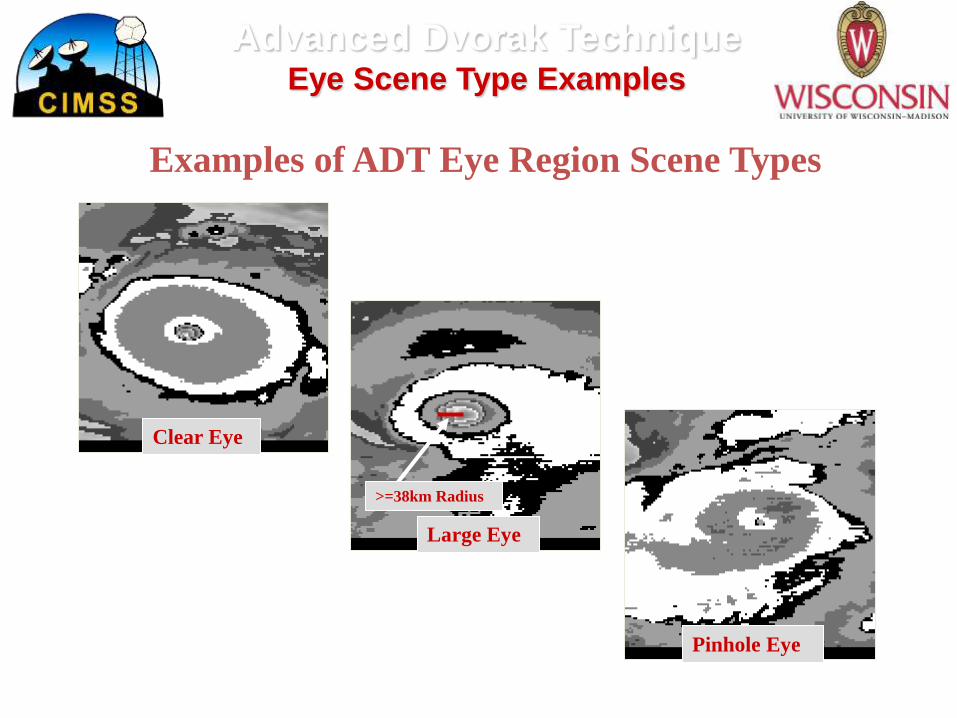
Clear Eye
Large Eye
Pinhole Eye
>=38km Radius
Examples of ADT Eye Region Scene Types
Advanced Dvorak Technique Eye Scene Type Examples

Get User Inputs
Read TOPO File
Output ADT
Analysis Write History File
Intensity Analysis?
Yes
No
Center Positioning?
Automated
Manual
Read Cursor
Location
List/Graph
History File
Read Forecast
SC/RF Analysis
Select Center Fix
Perform Scene Analysis
Calculate Intensity
Estimates
TC Over Land? Yes
No
Manual Scene
Override?
Advanced Dvorak Technique ADT Overview Flowchart

Determine Eye and Cloud
Region Temperatures
Perform Scene Analysis
Perform FFT Analysis on
Eye and Cloud Regions
Calculate Convective Symmetry and
Eye Region Std Deviation Values
Derive Eye and Cloud Region “Scene Scores”
(based on various environmental analysis parameters)
Determine Scene Type
From Scene Scores
CDO Curved Band Shear Eye
Cloud Scenes Eye Scenes
Perform 10° Log
Spiral Analysis
Calculate Distance
to Convection
- Measure CDO Size
- Embedded Center Check
- Pinhole Eye Check
Determine Eye Size
Advanced Dvorak Technique Scene Type Determination Flowchart

Calculate Intensity Estimates
Derive Raw T# Value
(based on analysis of current image)
- Regression Analysis for CDO/Eye Scenes
- Convective Curvature for Curved Band
- Distance to Convection for Shear
History File Utilized?
Yes
No
Apply Dvorak Technique “Rule 8” Constraints
(to limit growth/decay of Raw T# over time)
Adj Raw T#
Calculate Time Averaged Final T# Values
3-hr Unweigthed Average
Determine Current Intensity CI# Value
- Apply Dvorak Technique “Rule 9” Weakening Rule
- Implement East Pacific Rapid Dissipation Rule
Compute MSLP Latitude Bias Adjustment Output Intensity
Estimate Values
Advanced Dvorak Technique Intensity Derivation Flowchart

Spiral Centering • Fits 5° log spiral vector
field to the IR image
• Calculates a grid of
scores that indicates the
alignment between the
spiral field and the IR Tb
gradients (maximum at
the spiral center
Ring Fitting • Calculates a grid of
scores that indicates
the best fit to a range
of possible ring
positions and
diameters (maximum
at the eye center)
Advanced Dvorak Technique Automated Storm Centering

Advanced Dvorak Technique Automated Storm Centering

• Uses the 85GHz brightness
temperature signal to deduce the
vigor and organization of the
developing eyewall/eye, and
calculate an intensity score
• Successful in loosely
differentiating between storms
• Greater than ~72 knots
• Greater than ~90 knots
• If thresholds are exceeded, PMW
scores are converted to either T# of
4.3 or 5.0 in the ADT
• The scheme has been operating in
the ADT since 2008
Warmest eye pixel
Eyewall temperatures
Hurricane Dolly, 23 July 2008 1126 UTC
DMSP SSM/I 85GHz (H) brightness temperature
Advanced Dvorak Technique PMW Intensity Estimate Score

More intense;
Closer to Best Track
More accurate during
rapid intensification
Advanced Dvorak Technique PMW Intensity Estimate Score

Eliminated false intensity
“plateau”; Closer to Best Track
More closely follows rapid
intensification; More
accurate maximum intensity
resulted
Advanced Dvorak Technique PMW Intensity Estimate Score

EAST/CENTRAL PACIFIC – 2010 TC Season – Independent comparisons between ADT and SAB intensity estimates
– ADT and SAB estimates w/in +/- 30 minutes
– Closest NHC Best Track intensity
Advanced Dvorak Technique ADT Validation: Comparisons with SAB DvT
126 total matches (homogeneous)
bias aae stdv
SAB:CI# -0.05 0.33 0.43
SAB:Win 0.48 5.91 8.54
SAB:MSL 0.08 4.59 6.73
ADT:CI# -0.07 0.28 0.36
ADT:Win -0.38 5.94 7.73
ADT:MSL 0.88 3.81 5.36
Note: NHC is using the ADT increasingly,
especially in the EPAC. While difficult to
quantify, their BT may reflect ADT influences.
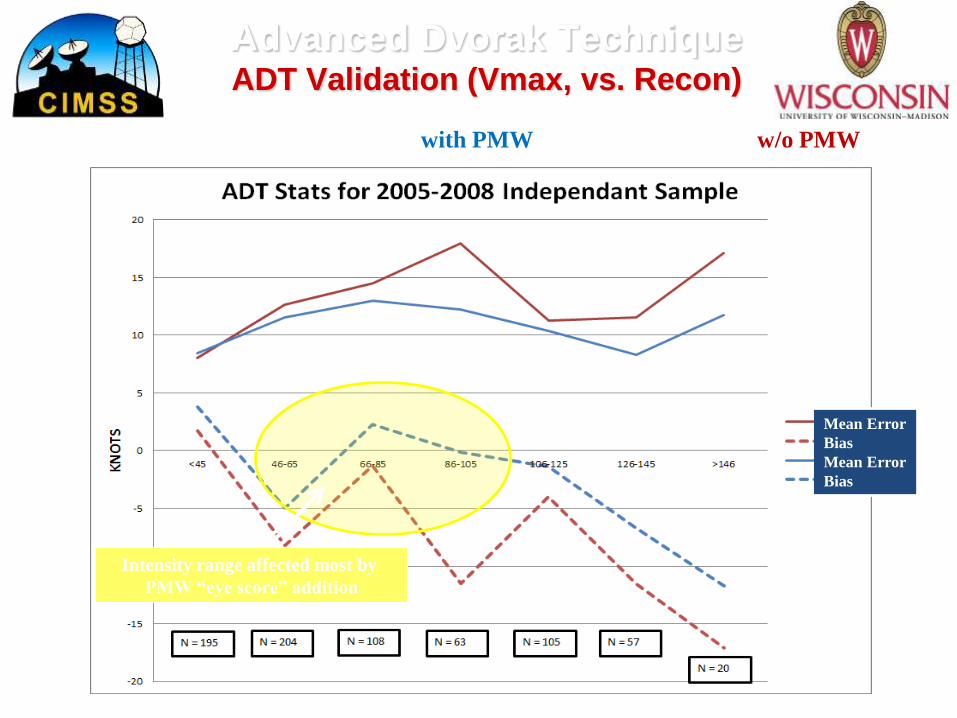
Intensity range affected most by
PMW “eye score” addition
Advanced Dvorak Technique ADT Validation (Vmax, vs. Recon)
• Comparison of latest ADT version with PMW and previous version w/o PMW
Mean Error
Bias
Mean Error
Bias
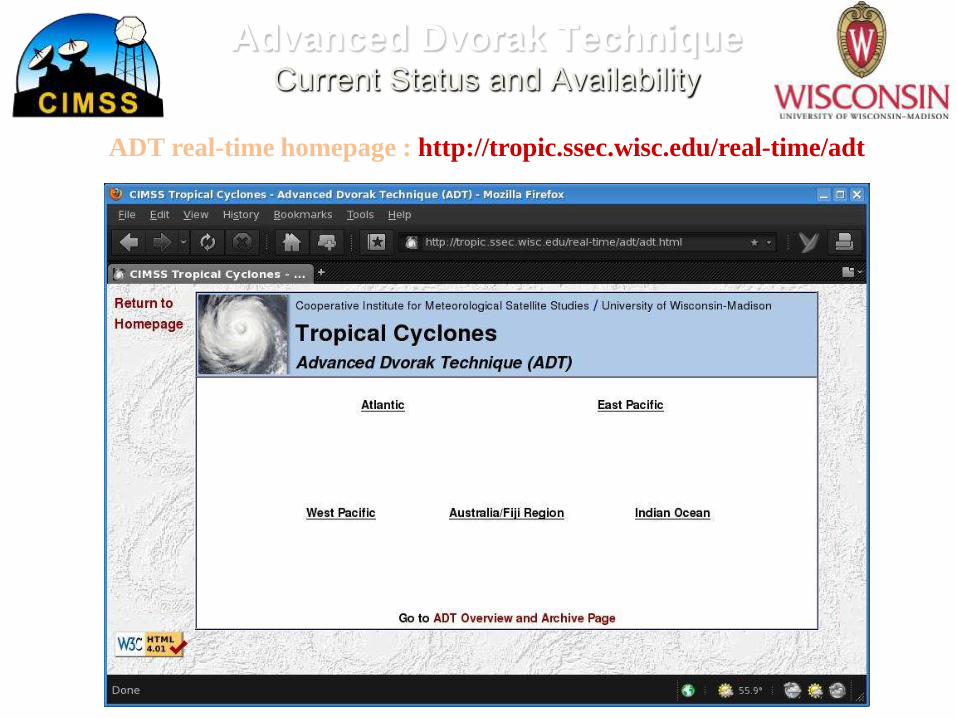
Advanced Dvorak Technique Current Status and Availability
ADT real-time homepage : http://tropic.ssec.wisc.edu/real-time/adt

Advanced Dvorak Technique Current Status and Availability
****************************************************
UW - CIMSS
ADVANCED DVORAK TECHNIQUE
ADT-Version 8.1.3
Tropical Cyclone Intensity Algorithm
----- Current Analysis -----
Date : 28 AUG 2005 Time : 154500 UTC
Lat : 26:14:25 N Lon : 88:20:05 W
CI# /Pressure/ Vmax
6.8 / 926.0mb/134.8kt
Final T# Adj T# Raw T#
6.7 6.7 6.7
Latitude bias adjustment to MSLP : -0.6mb
Estimated radius of max. wind based on IR : 33 km
Center Temp : +20.2C Cloud Region Temp : -69.9C
Scene Type : EYE
Positioning Method : RING/SPIRAL COMBINATION
Ocean Basin : ATLANTIC
Dvorak CI > MSLP Conversion Used : ATLANTIC
Tno/CI Rules : Constraint Limits : NO LIMIT
Weakening Flag : ON
Rapid Dissipation Flag : OFF
****************************************************
ADT
Current Intensity
“Bulletin”

Advanced Dvorak Technique Current Status and Availability
===== ADT-Version 8.1.3 =====
--------Intensity------- -Tno Values-- ---Tno/CI Rules--- -Temperature-
Time Final/MSLPLat/Vmax Fnl Adj Ini Cnstrnt Wkng Rpd Cntr Mean Scene EstRMW MW Storm Location Fix
Date (UTC) CI MSLP /BiasAdj/(kts) Tno Raw Raw Limit Flag Wkng Region Cloud Type (km) Score Lat Lon Mthd Comments
2005AUG23 211500 2.0 1009.0/ +0.0 / 30.0 2.0 2.0 2.0 NO LIMIT OFF OFF -4.76 -35.41 CRVBND N/A N/A 23.25 75.44 FCST
2005AUG23 214500 2.1 1008.2/ +0.0 / 31.0 2.1 2.2 2.6 0.2T/hour OFF OFF 5.84 -34.85 CRVBND N/A N/A 23.28 75.49 FCST
2005AUG23 221500 2.1 1008.2/ +0.0 / 31.0 2.1 2.2 2.5 0.2T/hour OFF OFF 5.84 -33.57 CRVBND N/A N/A 23.30 75.54 FCST
2005AUG23 224500 2.1 1008.2/ +0.0 / 31.0 2.1 2.3 2.3 NO LIMIT OFF OFF 3.84 -34.04 CRVBND N/A N/A 23.33 75.58 FCST
2005AUG23 231500 2.2 1007.4/ +0.0 / 32.0 2.2 2.4 2.7 0.2T/hour OFF OFF 0.04 -34.42 CRVBND N/A N/A 23.36 75.63 FCST
2005AUG23 234500 2.2 1007.4/ +0.0 / 32.0 2.2 2.3 2.3 NO LIMIT OFF OFF 6.74 -33.37 CRVBND N/A N/A 23.39 75.68 FCST
2005AUG24 001500 2.2 1007.4/ +0.0 / 32.0 2.2 2.3 2.3 NO LIMIT OFF OFF 13.54 -32.66 CRVBND N/A N/A 23.41 75.72 FCST
2005AUG24 004500 2.2 1007.4/ +0.0 / 32.0 2.2 2.3 2.3 NO LIMIT OFF OFF 14.74 -30.82 CRVBND N/A N/A 23.43 75.77 FCST
<records deleted>
2005AUG27 154500 4.8 973.5/ -0.1 / 84.8 4.6 4.9 4.9 NO LIMIT ON OFF -53.56 -68.93 EMBC N/A N/A 24.49 85.25 SPRL
2005AUG27 161500 4.8 973.5/ -0.1 / 84.8 4.7 5.0 5.0 NO LIMIT ON OFF -53.86 -68.15 EMBC N/A N/A 24.50 85.31 SPRL
2005AUG27 164500 4.8 973.5/ -0.1 / 84.8 4.8 5.1 5.1 NO LIMIT OFF OFF -60.06 -69.29 EMBC N/A N/A 24.51 85.49 SPRL
2005AUG27 171500 4.8 973.5/ -0.1 / 84.8 4.8 5.0 5.0 NO LIMIT OFF OFF -62.66 -69.35 EMBC N/A N/A 24.53 85.67 SPRL
2005AUG27 174500 4.8 973.5/ -0.1 / 84.8 4.8 4.6 4.6 NO LIMIT OFF OFF -68.36 -70.79 UNIFRM N/A N/A 24.64 85.75 SPRL
2005AUG27 181500 4.8 973.4/ -0.2 / 84.8 4.8 4.5 4.5 NO LIMIT OFF OFF -67.06 -69.50 UNIFRM N/A N/A 24.76 86.03 SPRL
2005AUG27 184500 4.8 973.5/ -0.1 / 84.8 4.8 5.1 5.1 NO LIMIT OFF OFF -65.36 -71.15 EMBC N/A N/A 24.68 85.85 SPRL
2005AUG27 191500 4.8 973.5/ -0.1 / 84.8 4.8 4.7 4.7 NO LIMIT OFF OFF -68.76 -73.14 UNIFRM N/A N/A 24.60 85.57 SPRL
2005AUG27 194500 4.8 973.5/ -0.1 / 84.8 4.8 4.7 4.7 NO LIMIT OFF OFF -68.36 -73.25 UNIFRM N/A N/A 24.63 85.61 SPRL
<records deleted>
2005AUG28 104500 6.7 929.0/ -0.4 /132.2 6.7 6.8 6.8 NO LIMIT OFF OFF 19.64 -70.90 EYE 30 IR N/A 25.74 87.56 COMBO
2005AUG28 111500 6.7 929.0/ -0.4 /132.2 6.7 6.7 6.7 NO LIMIT OFF OFF 19.44 -71.08 EYE 31 IR N/A 25.68 87.64 COMBO
2005AUG28 114500 6.8 926.1/ -0.4 /134.8 6.8 6.8 6.8 NO LIMIT OFF OFF 19.74 -71.74 EYE 30 IR N/A 25.73 87.72 COMBO
2005AUG28 121500 6.8 926.1/ -0.4 /134.8 6.7 6.7 6.7 NO LIMIT ON OFF 18.54 -71.46 EYE 31 IR N/A 25.76 87.78 COMBO
2005AUG28 124500 6.8 926.1/ -0.5 /134.8 6.7 6.7 6.7 NO LIMIT ON OFF 18.54 -71.12 EYE 32 IR N/A 25.88 87.81 COMBO
2005AUG28 131500 6.8 926.1/ -0.5 /134.8 6.7 6.8 6.8 NO LIMIT ON OFF 19.64 -72.01 EYE 32 IR N/A 25.90 87.97 COMBO
2005AUG28 134500 6.8 926.1/ -0.5 /134.8 6.7 6.8 6.8 NO LIMIT ON OFF 20.24 -71.25 EYE 32 IR N/A 25.93 88.02 COMBO
2005AUG28 141500 6.8 926.1/ -0.5 /134.8 6.7 6.7 6.7 NO LIMIT ON OFF 19.94 -70.71 EYE 31 IR N/A 25.97 88.08 COMBO
2005AUG28 144500 6.8 926.0/ -0.6 /134.8 6.7 6.8 6.8 NO LIMIT ON OFF 19.34 -70.99 EYE 31 IR N/A 26.11 88.15 COMBO
2005AUG28 151500 6.8 926.0/ -0.6 /134.8 6.7 6.6 6.6 NO LIMIT ON OFF 20.64 -69.05 EYE 32 IR N/A 26.26 88.22 COMBO
<records deleted)
2005AUG29 084500 6.3 938.8/ -1.4 /122.2 5.8 6.2 6.2 NO LIMIT ON OFF 13.04 -66.90 EYE 28 IR N/A 28.81 89.54 COMBO
2005AUG29 091500 6.3 938.8/ -1.4 /122.2 5.9 6.2 6.2 NO LIMIT ON OFF 15.34 -66.15 EYE 28 IR N/A 28.92 89.54 COMBO
2005AUG29 094500 6.3 938.8/ -1.4 /122.2 5.9 6.2 6.2 NO LIMIT ON OFF 12.54 -66.08 EYE 28 IR N/A 29.03 89.54 COMBO
2005AUG29 101500 6.3 938.7/ -1.5 /122.2 6.0 6.0 6.0 NO LIMIT ON OFF 13.84 -63.94 EYE 29 IR N/A 29.14 89.54 COMBO
2005AUG29 104500 6.3 938.7/ -1.5 /122.2 6.0 5.8 5.8 NO LIMIT ON OFF 14.44 -61.50 EYE 30 IR N/A 29.25 89.54 COMBO
2005AUG29 111500 0.0 0.0/ +0.0 / 0.0 0.0 0.0 0.0 N/A N/A 99.50 99.50 LAND N/A N/A 29.37 89.54 COMBO
2005AUG29 114500 6.3 938.6/ -1.6 /122.2 6.0 5.6 5.6 NO LIMIT ON OFF 12.54 -59.59 EYE 30 IR N/A 29.49 89.43 COMBO
2005AUG29 121500 6.3 938.6/ -1.6 /122.2 5.8 5.5 5.5 NO LIMIT ON OFF 14.34 -58.01 EYE 31 IR N/A 29.67 89.54 COMBO
2005AUG29 124500 6.3 938.5/ -1.7 /122.2 5.7 5.5 5.5 NO LIMIT ON OFF 11.84 -59.13 EYE 29 IR N/A 29.74 89.55 COMBO
2005AUG29 131500 6.3 938.5/ -1.7 /122.2 5.6 5.6 5.6 NO LIMIT ON OFF 11.94 -60.14 EYE 30 IR N/A 29.81 89.55 COMBO
2005AUG29 134500 0.0 0.0/ +0.0 / 0.0 0.0 0.0 0.0 N/A N/A 99.50 99.50 LAND N/A N/A 30.00 89.56 COMBO
2005AUG29 141500 6.3 938.5/ -1.7 /122.2 5.5 5.7 5.7 NO LIMIT ON FLG -1.56 -61.88 EYE 27 IR N/A 30.00 89.45 COMBO
2005AUG29 144500 0.0 0.0/ +0.0 / 0.0 0.0 0.0 0.0 N/A N/A 99.50 99.50 LAND N/A N/A 30.32 89.56 COMBO
Utilizing history file /home/tlo/odt/ADTV8.1.3WV/history/2005KATRINA.ODT
Successfully completed listing
ADT
History
File
Listing
--------Intensity------- -Tno Values-- ---Tno/CI Rules--- -Temperature-
Time Final/MSLPLat/Vmax Fnl Adj Ini Cnstrnt Wkng Rpd Cntr Mean Scene EstRMW MW Storm Location Fix
Date (UTC) CI MSLP /BiasAdj/(kts) Tno Raw Raw Limit Flag Wkng Region Cloud Type (km) Score Lat Lon Mthd
2005AUG28 104500 6.7 929.0/ -0.4 /132.2 6.7 6.8 6.8 NO LIMIT OFF OFF 19.64 -70.90 EYE 30 IR N/A 25.74 87.56 COMBO

Advanced Dvorak Technique Current Status and Availability
ADT Time Series Intensity Plot

Advanced Dvorak Technique PMW Analysis : Textual/Graphical Products
• Graphics allow for visual analysis of eye
score evaluation process.
ADT PMW Analysis
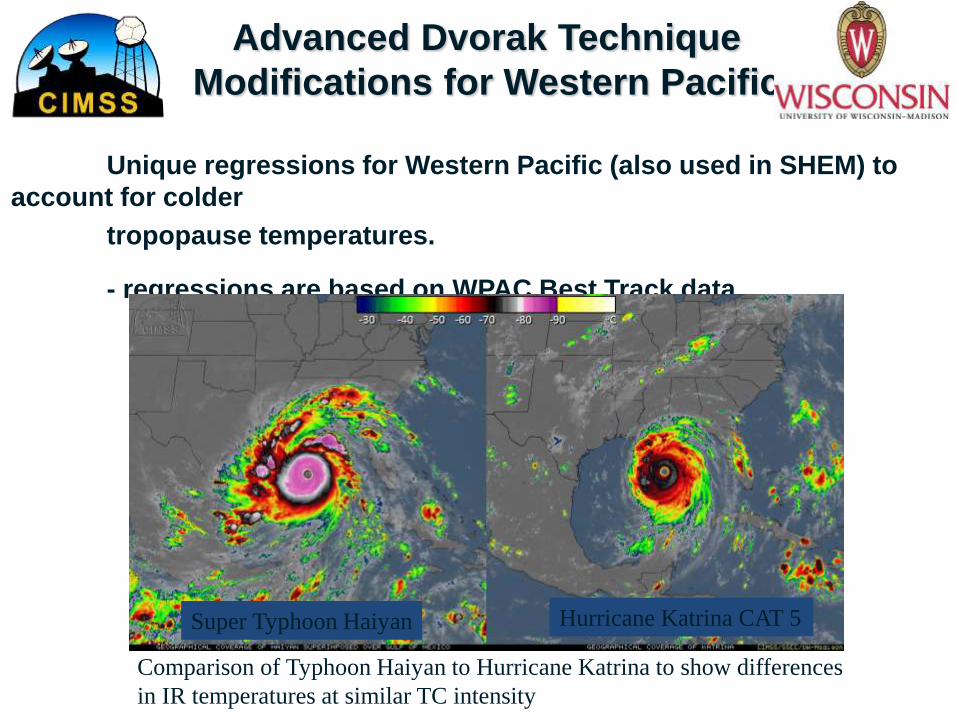
Unique regressions for Western Pacific (also used in SHEM) to
account for colder
tropopause temperatures.
- regressions are based on WPAC Best Track data
Advanced Dvorak Technique
Modifications for Western Pacific
Super Typhoon Haiyan Hurricane Katrina CAT 5
Comparison of Typhoon Haiyan to Hurricane Katrina to show differences
in IR temperatures at similar TC intensity

Courtney-Knaff-Zehr wind -> pressure relationship used to adjust
Vmax
to MSLP in order to account for TC size, motion, P_env and
latitude
- R34 is used as a proxy for tangential wind at 500 km
- ROCI may be a better size parameter
Advanced Dvorak Technique
Modifications for Western Pacific
Monsoon Depression TC Genesis
ADT old MSLP = 1000 hPa
New Using CKZ = 988 hPa
Nearby observations support MSLP < 990 hPa

TC structure information is critical for several applications
including:
- Storm surge forecasts
- 2D wind fields
- Model initialization
- Input to microwave intensity
algorithms
Advanced Dvorak Technique
Eye Size and RMW Estimation
TC eye size and Radius of Maximum
Winds (RMW) can be estimated from IR
imagery.
Estimates are most accurate when IR
eye is well-defined
ADT includes IR eye size in history file
Find distance from center to -45 C in
four directions and get average. This is
IR eye radius R_eye
RMW = 2.8068 + (0.8361*R_eye)
Average radius of -45 C
temperature
• Expand ADT to operate during/after Extratropical Transition
– Study with Manion and Evans (UW-Milwaukee) underway
• Improve Curved Band and Shear scene intensity estimates
– Main area(s) still needing improved analysis capabilities (especially during
tropical cyclone formation stage).
– Employ a regression-based methodology (as with Eye and CDO scene types);
Initial results show improvement over current “Dvorak-based” methods
• Employ latest ARCHER routine
– Update currently used auto-centering routines with latest routine
• Implement ADT into McIDAS-V
– Currently rewriting base ADT code from C to JAVA and implementing GUI
• Continue IR/WV differencing study (Olander and Velden, W&F, 2009)
– Initial algorithm developed but follow-up analysis not yet completed
– Shows some predictive elements with rapid deepening cases
– Could be used to improve ADT regression-based current intensity estimate
correlations for pre-Eye scene types (CDO and Embedded Center)
Advanced Dvorak Technique Planned ADT Additions
• ADT intensity estimates are routinely accessed and utilized in real-time
by several OFCs from the CIMSS web site:
http://tropic.ssec.wisc.edu/real-time/adt/adt.html
• Version 8.2.1 planned release in late Spring 2014
– Includes PMW image ingest and Eye Score determination algorithms
– Able to ingest/utilize HURSAT data
– McIDAS-V version of ADT-V8.2.1 will be available Spring/Summer 2014
• Efforts underway at NESDIS/SAB to integrate latest version into
operations, and to provide real-time estimates via ATCF
– Integrating Version 8.2.1 in very near future
• Official Hurricane Intensity Estimation algorithm for GOES-R program
– HIE/ADT also being tested/utilized in GOES-R Proving Ground since 2012
Advanced Dvorak Technique ADT Status and Availability

Example: Objective estimates of eye size from CIMSS ‘ARCHER’ method (using
MW imagery)
MW imagery (MI) often depicts eyes when
IR/ADT cannot
ARCHER method (Wimmers and Velden, 2010)
uses objective analysis of MI and accounts for
eyewall slope
ARCHER eye = 33 km
Information can be input to AMSU
method
CIMSS SATCON Algorithm Cross-algorithm information sharing