iw - vito - belgian federal science policy office · integrating climate, resource and waste...
TRANSCRIPT

Intermediary report - January 2003
INTEGRATED CLIMATE, RESOURCE USE AND WASTE POLICIES THROUGH PRODUCT POLICIES
CP-13
IW - Vito

The appendixes to this report are available at : http://www.belspo.be (FEDRA) Published in 2003 by the Belgian Public Planning Service Science Policy Rue de la Science 8 - Wetenschapsstraat B-1000 Brussels Belgium Tel : 32/2/238.34.11 – Fax 32/2/230.59.12 http://www.belspo.be (FEDRA) Contact person : Mrs Aurore Delis ([email protected]) Tel : 02/238.37.61 Neither the Belgian Federal Science Policy Office nor any person acting on behalf of the Belgian Federal Science Policy Office is responsible for the use which might be made of the following information. The authors of each contribution are responsible for the content of their contribution and the translation. No part of this publication may be reproduced, stored in a retrieval system, or transmitted in any form or by any means, electronic, mechanical, photocopying, recording, or otherwise, without indicating the reference.
This research project is realised within the framework of the Scientific support plan for a
sustainable development policy (SPSD II)
Part I “Sustainable production and consumption patterns”

INTEGRATING CLIMATE, RESOURCE AND WASTE POLICIES THROUGH PRODUCT POLICIES
Activity report : Scientific report
CP13_en.doc/Sophie Mouravieff 20/10/03 Institut Wallon / VITO 1/21
INTEGRATING CLIMATE, RESOURCE AND WASTE POLICIES THROUGH PRODUCT POLICIES
Activity Report : Scientific report
Françoise Nemry, Karine Thollier (Institut Wallon) Pieter Claeys, Bart Jansen, Jan Theunis (Vito)
January 2003
Carried out for the
Office for Scientific,Technical and Cultural affairs (OSTC)
INSTITUT WALLON DE DEVELOPPEMENT ECONOMIQUE ET SOCIAL ET D’AMENAGEMENT DU TERRITOIRE ASBL Boulevard Frère Orban 4, 5000 NAMUR
VLAAMSE INSTELLING VOOR TECHNOLOGISCH ONDERZOEK - VITO Boeretang 2000, 2400 MOL

INTEGRATING CLIMATE, RESOURCE AND WASTE POLICIES THROUGH PRODUCT POLICIES
Activity report : Scientific report
CP13_en.doc/Sophie Mouravieff 20/10/03 Institut Wallon / VITO 2/21
1 Goal of the study ......................................................................................................................................................... 3
2 State of progress and context .................................................................................................................................. 4
3 Methodology and results of the first phase of the study .................................................................................. 4
3.1 Methodology......................................................................................................................................................... 4 3.1.1 Definition of environmental impacts........................................................................................................5 3.1.2 Definition of products.................................................................................................................................6 3.1.3 Life cycle inventory system boundaries...................................................................................................7 3.1.4 Definition of environmental indicators ....................................................................................................7
3.2 Results.................................................................................................................................................................... 8 3.2.1 Resource intensive product categories .....................................................................................................8 3.2.2 High impact products................................................................................................................................11
3.3 Priorities for integrated climate, material resources and waste policies................................................17 3.3.1 Life cycle emissions versus national emissions....................................................................................18
3.4 Existing policies and measures .......................................................................................................................19
4 Second phase: detailed analysis for specific product groups ........................................................................20
4.1 Preliminary research for case study on transport .......................................................................................20
5 Future prospects and planning .............................................................................................................................21
1
INTEGRATING CLIMATE, RESOURCE AND WASTE POLICIES THROUGH PRODUCT POLICIES
Activity report : Scientific report
CP13_en.doc/Sophie Mouravieff 20/10/03 Institut Wallon / VITO 3/21
1. Goal of the study
Climate change, resources use and waste management are major challenges for policy makers and society in general. They are as well among the matters of priority in the “Sixth European Action Program for the Environment” (see COM(2001)31final). These three environmental issues will constitute the core issues of this research.
Up to now, sector-related environmental policies reveal to be insufficient to achieve the necessary objectives for sustainable development. An increasing focus on consumption patterns, including content and volume, is necessary to complement the present climate, resource and waste strategies that tackle production modes in particular.
The project “Reduction of GHG emissions and material flows”, carried out by Institut Wallon, Vito and IDD in the framework of the Action Plan for Sustainable Development (phase I) of the “Global Change and Sustainable Development” programme of the OSTC, was a first research effort to give insight in the impacts of consumption patterns on life cycle GHG emissions, while simultaneously taking into account possible improvements within the upstream production system and the waste treatment system. It focused on three selected product categories (residential housing, beverage packaging and livestock products).
In an effort to extend the findings of this research, the ongoing project aims at giving general insights into the possibilities to reinforce and integrate existing climate, resource use and waste policies through product-oriented policies. It aims at evaluating product-related measures that may help to reduce life cycle GHG emissions, material uses and waste releases, taking into account the eco-efficiency improvement potential within the whole product system. The Integrated Product Policy (IPP), currently discussed at European level, will provide a general framework for this project.
The ongoing project is undertaken in order to generalise the previous analysis in three complementary parts:
1. A general analysis of consumption patterns and their impacts. The results of this task will enable us to determine priorities for integrated climate, waste and resources use product policies. The aim is to identify the current situation, to know which are the most relevant product groups for policies aiming at sustainable consumption patterns, and to inventory what kind of data collecting efforts are essential to improve the assessment of consumption patterns and product-oriented policies.
2. An in-depth analysis of four product groups: The analysis of two product categories previously studied, will be broadened to larger categories (all household packaging, all residential buildings) and to materials use and waste. A similar analysis will be carried out for two additional product categories (paper in offices in connection with computing technologies, and cars). These analyses aim at estimating the life cycle GHG emissions, material use and waste caused by the Belgian demand of the concerned products and at identifying potential options for impacts mitigation. Costs and benefits of these options will be estimated and their technical, legal and sociological limits will be evaluated. This will result in a theoretical potential for reduction of the three impacts studied.
3. An evaluation of some instruments/measures. This evaluation aims at identifying appropriate sets of product-related measures that can be efficiently combined to achieve the estimated theoretical improvement potential for the product categories that are studied in detail. The expected results of these sets of measures (reduction of greenhouse gas emissions, waste production and resource use) will be assessed.
In the time schedule, the project had to focuse on the first task .

INTEGRATING CLIMATE, RESOURCE AND WASTE POLICIES THROUGH PRODUCT POLICIES
Activity report : Scientific report
CP13_en.doc/Sophie Mouravieff 20/10/03 Institut Wallon / VITO 4/21
2 State of progress and context
This first task that was finalised last December 2002 was undertaken jointly with the study "Indentifying key products for the federal environmental product policy" which was commissioned by the Federal Services for the Environment (FSE) to Institut Wallon, Vito and IGEAT. In that framewrok IW and Vito had to undertake an analysis aiming primarily to "determine which categories of products are a priority for product policy development on the level of the Belgian federal government."i, based on the two following criteria.
1. the identification of products with the highest environmental impacts as generated over their entire life cycle.
2. the existing policies and measures
Though the FSE project implied additional analysis (more broad environmental issues to be analyses, more broad product catgeories), the objectives of that study were very close to the first phase of the ongoing project. The approaches that the IW and Vito had proposed was also similar.
Logically the first phase of the ongoing OSTC project and the FSE project were conducted in a same research effort and were followed simultaneously by the user committee for the OSTC project and by the steering committee that was established by the FSE.
All the results of this combined researches and the methodology have been described in detail in the report that has been produced at the end of the FSE project (see www.iwallon.be).
Besides research on the first phase, Vito has also produced analysis concerning the detailed analysis of the transport product category. Work was alaso made on the the analysis of policies and measures, which was initially scheduled in 2003.
In the following, we give a summary of that research. This is mainly based on the executive summary of the report. At the end of the present document we discuss particularly the results related to resources (energy and materials), greenhouse gases and waste.
3 Methodology and results of the first phase of the study
3.1 Methodology
This study has been based on a life cycle approach as recommended in product policies that aim the integration of all major environmental issues and all product life cycle stages.
It is also oriented towards the precise concept of product category as defined in Law on product standards (MB, 1998) by "a group of products that are intended for the same use (thus perform an identical function)".
In order to fully meet these preconditions, clear scope definitions have been developed in the beginning of the study. They concerned the environmental impacts to be considered, the definition of products to be studied and the definition of the product system boundaries to be considered for a life cycle inventory of environmental input and outputs.
i Call for proposals: AFW/MPCD/2001/21868

INTEGRATING CLIMATE, RESOURCE AND WASTE POLICIES THROUGH PRODUCT POLICIES
Activity report : Scientific report
CP13_en.doc/Sophie Mouravieff 20/10/03 Institut Wallon / VITO 5/21
3.1.1 Definition of environmental impacts
The first boundary to be set is the environmental impacts envisaged. We determined the environmental impacts to consider based on priorities existing at different levels. Actually, these are not the same depending on the policy level. Four levels of environmental policies were reviewed : the multilateral level, the European Union level, the Belgian Federal level, and the Belgian Regional levels. Combining these priorities, we derived those that were targeted in our study (see following table). Clear priorities are expressed concerning different environmental impacts resulting from release of specific substances. In their turn they result in environmental damages such as loss of biodiversity (aquatic and non aquatic) and damages to health which are also listed as priorities at different levels.
While we identified environmental impacts to be addressed in the study, their quantification is however difficult. Indeed, it would imply to evaluate the impact pathway of environmental fluxes first in terms of concentrations in the different media (air, water, soils) and then in terms of environmental damages (in terms of damages to human health and to loss of biodiversity). Some studies have analysed and quantified some of the interactions between different environmental impacts (for instance in the “eco-indicator points” and the “ExternE” methods.
However it was not possible to make this complete evaluation within the scope of this study. Instead we have limited the analysis to the quantification of the different environmental fluxes concerned by the different environmental problems considered. For instance, we have quantified greenhouse gas emissions as expressed in terms of CO2 equivalent.
Hence, in the study, and especially in the result discussion, we used the term "environmental impacts" for the quantified and partially characterised environmental fluxes (inputs and outputs)."
Environmental impact Substances concerned Level at which envisaged(*)
Use of raw materials All materials E, F,R
Use of water water E, F, R
Energy use All fuels – electricity expressed in equivalent primary energy I, E, F, R
Greenhouse effect CO2, CH4, N2O, SF6, PFCs, HFCs I, E, F, R
Acidification SO2, SO3, NOx, NH3 I, F, R
Emission of photochemical pollutants VOCs, CO, NOx I, E, F, R
Release of heavy metals Lead, Cadmium, Mercury, Arsenic, Chrome, Nickel, Copper, Selenium, Zinc I, E, F, R
Release of persistent organic pollutants (POPs)
Several molecules, including dioxins, furans, PCB, PAH, pesticides I, E, F, R
Ozone layer depletion CFCs, HCFCs, CCl4, 1,1,1-trichloroethane, CH3Br); bromochloromethane (CH2BrCl)
I, E, F, R
Chemical demand in oxygen Organic substances I, E, F, Rl
Heavy metals pollution to water
Lead, Cadmium, Mercury, Arsenic, Chrome, Nickel, Copper, Selenium, Zinc I, E, F, R

INTEGRATING CLIMATE, RESOURCE AND WASTE POLICIES THROUGH PRODUCT POLICIES
Activity report : Scientific report
CP13_en.doc/Sophie Mouravieff 20/10/03 Institut Wallon / VITO 6/21
Eutrophication potential Phosphates, nitrates I, E, F, R
POPs pollution to water Several molecules, including dioxins, furans, PCB, PAH, pesticides
I, E, F, R
(*) E : Europe, I : international, F : federal, R : regional
Waste has also been considered in the analysis as being the cause of impacts on biodiversity and health.
For several reasons, it appeared that releases of toxic substances couldn't be quantified. Firstly, the identification, classification and evaluation of the toxic substances is still in its infancy. As a result it is generally hard to predict which toxic substances could potentially be released during the manufacturing, use or disposal of products. Secondly, it would be very difficult to quantify such substances, because so far there is no such available set of data. Therefore, the only toxic substances that will be taken into account are heavy metals and persistent organic chemicals.
3.1.2 Definition of products
The reference definition of product that had to be used was based on the Belgian federal law on product standards, as : “all physical movable goods and services that are brought on the market for private and/or public consumers”:
However this definition had to be more clearly specified especially because it posed two main problems for an operational analysis. Firstly, such a definition includes all that is man-made, traded on the Belgian market, ranging from a bolt, a battery, a sawn tree log, a paper napkin… to a process machine, a car, an airplane, an office building… Given the available time and budget for this study, we needed a more pragmatic definition and selection of products. Secondly, fulfilling the objectives of the study required to use an "integrated life cycle approach” taking into account all intermediate material and product inputs and outputs during all life cycle stages of products. A methodological inconsistency would then have occurred if this definition had been used, because impacts would have been double-counted
We therefore decided to focus on products consumed in Belgium during one year. An initial task in this study was to develop a logically structured list of products. This was done based on the definition of Product Categories as defined in the 1998 Belgian law on Product Standards : a product category is "a group of products that are intended for the same use (thus perform an identical function).
The product list thus consisted of “final products”, defined as “products that require no additional transformation prior to their use by end consumers, either industrial or household”. This list was organised on 5 hierarchical levels : function classes, function groups (groups of product categories with related but mutually different functions), product categories (groups of final products that are intended for the same use; at this level the functional unit is defined), and final products. We also defined consumable and spare parts as intermediate products or materials that are used during the lifespan of a product.
For practical reasons, buildings (industrial or household) were not considered as final products, but rather the building components they consist of. Packaging was not allocated to the final products they actually pack, but was treated as 2 separate function groups: “industrial packaging” and “household packaging”. Some types of intermediate products such as glues, paints… were listed separately under the category “crosscutting products “. According to the definitions here above, they are not final products but since several existing policies apply to these specifically, it seemed useful

INTEGRATING CLIMATE, RESOURCE AND WASTE POLICIES THROUGH PRODUCT POLICIES
Activity report : Scientific report
CP13_en.doc/Sophie Mouravieff 20/10/03 Institut Wallon / VITO 7/21
to study these as separate units. However, to avoid the error of double counting, their environmental impacts were allocated to the main final product systems they related to.
3.1.3 Life cycle inventory system boundaries
For this study, an “integrated life cycle approach” was chosen, consistently with the principles of the Federal Plan on product & environment and the European Green Paper on Integrated Product Policy (IPP). Existing ISO standards set the framework for the methodology e.g. ISO 14040 on LCA – life cycle assessment. This is a “bottom-up” approach, first looking at the impacts of products individually, then transposing them to the level of annual Belgian consumption.
This approach however leads to problems of data availability. Indeed, environmental data were sometimes missing either for some products, or for some life cycle stage of products, or for some environmental impacts. For this reason mainly, and also because the time was limited to perform extended searches and in-depth analysis of other databases / sources, some pragmatic choices had to be made regarding the limited scope of product systems considered.
Regarding life cycle stages and specific processes, we took into account : the mining of resources and the manufacturing of all the materials that entered the final product composition (including the production of secondary materials), these two stages form the production phase ; the use stage of the product ; the disposal stage of the product (waste treatment processes such as landfilling and incineration). We did not take into account : the material forming stage (e.g. blow moulding); the product assembly stage ( because data were not found for this stage) ; the distribution stage of products to end users.
Concerning process fluxes (process inputs and outputs), we took into account : the input of primary and secondary materials ; the input of energy ; the output of emissions to air and to water ; the output of overburden (during raw material extraction stage) and waste (during all life cycle stages). We did not take into account infrastructure and equipment ; auxiliary process materials.
3.1.4 Definition of environmental indicators
We defined indicators relevant for each environmental impact of products and also a frame to identify of the product categories with the highest impact based on these indicators.
To enable a comparison of product categories, we defined time independent indicators XLC reflecting the overall environmental fluxes incurred by all products consumed in Belgium in a year, disregarding the moment when these fluxes will actually occur. These indicators were used to rank product categories according to their environmental impacts. This ranking has been made in two steps :
1. in the first step the resource intensive product categories were identified; they were defined as the product categories having the highest life cycle resource requirement at a national level.
2. in the second step, the most resource intensive products were ranked according to both the input and output flows. From this ranking, we aimed to identify the "highest impact products".
The question of time horizon was also considered when developing the indicators. This question is more linked to the fact that policy makers may wish to have an idea of the potential effects of a product policy on products targeted over a realistic timeframe for a policy implementation (e.g. 10

INTEGRATING CLIMATE, RESOURCE AND WASTE POLICIES THROUGH PRODUCT POLICIES
Activity report : Scientific report
CP13_en.doc/Sophie Mouravieff 20/10/03 Institut Wallon / VITO 8/21
years). These effects depend on the lifespan of products. For this reason we also defined time dependent indicators Xav reflecting the cumulative environmental flux that will have resulted from all products bought in Belgium over a given timeframe. These indicators were used to compare the key product categories taking into account the potential long-term impact of product policies.
3.2 Results
3.2.1 Resource intensive product categories
As explained above, we used the XLC indicators to determine the most resource-intensive products. To do so, we used a set of indicators which was the best compromise between an exhaustive description of inputs and a not too extensive search for data, which would have been very time consuming. We chose to define the following indicators :
- The material intensity indicator M aimed to reflect the total amount of material used for the manufacturing and use (for instance, the amount of steel, plastic, glass,...used to assemble a car and provide spare parts - tyres, batteries,... - over its life span) of products consumed in Belgium in a year. It can be expressed by material categories. Material intensity is linked to the production phase and, for products using consumables, to the use phase . We also defined material intensity indicators for all material classes (metal, minerals, synthetic organics, natural organics).
- The energy intensity indicator ELC takes into account the energy necessary to process all the materials required to assemble and to use products consumed in Belgium (hence excluding energy used to assemble consumables and energy used or recovered during the disposal phase). Indicators Ep and Eu were also calculated to reflect the individual energy requirement related to the production and the use phases respectively.
- The water intensity H represents the water consumption during the use phase of the products consumed in Belgium during the life cycle of the product
These definitions resulted in a set of 9 indicators :Mmineral, Mmetal, Msynthorg, Mnatorg, M, ELC, Ep, Eu, H.
In order to quantify these indicators, we used data from a wide range of sources. The uncertainty of these data varies from 10% to almost 45% for some of them.
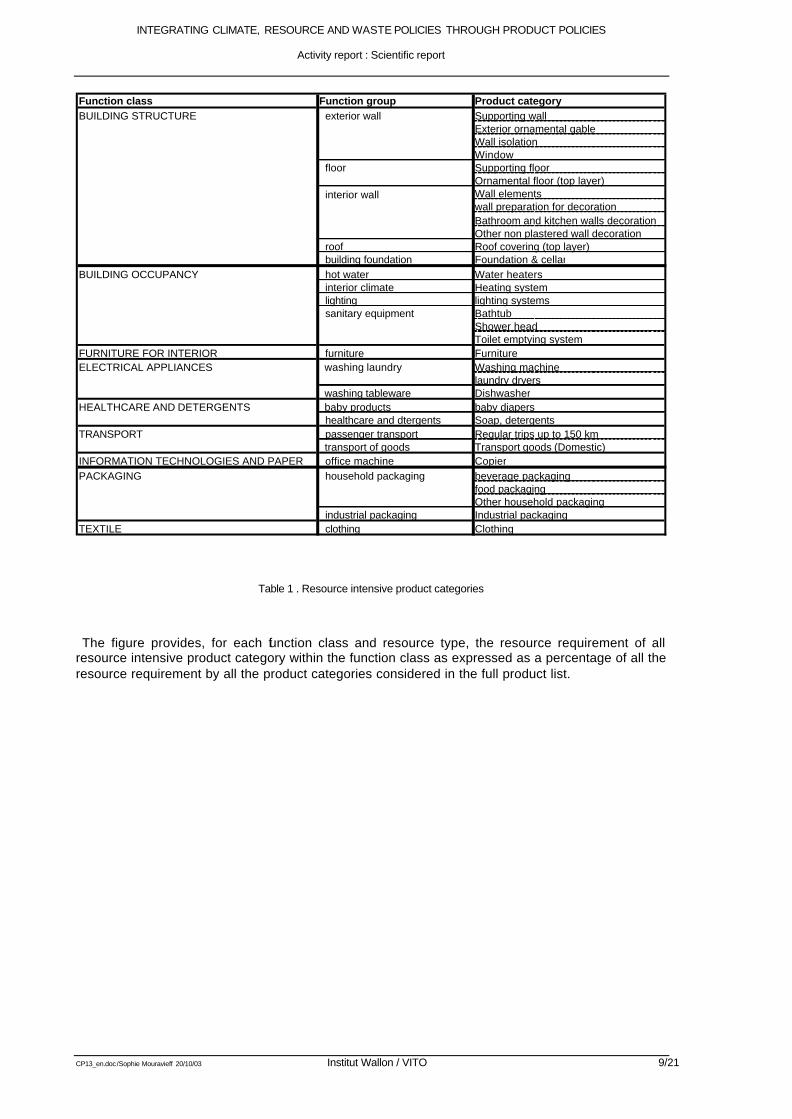
We then defined product categories having a high intensity in resource use as the product categories that represented at least 2% of the total resource use over all the product categories, for at least one of the indicators. This resulted in the selection of 30 product categories covering 108 products. The results are summarised in the following figure at the aggregation level of function classes.
The list of product categories is given in the following table.
INTEGRATING CLIMATE, RESOURCE AND WASTE POLICIES THROUGH PRODUCT POLICIES
Activity report : Scientific report
CP13_en.doc/Sophie Mouravieff 20/10/03 Institut Wallon / VITO 9/21
Function class Function group Product categorySupporting wallExterior ornamental gableWall isolationWindowSupporting floorOrnamental floor (top layer)Wall elementswall preparation for decorationBathroom and kitchen walls decorationOther non plastered wall decoration
roof Roof covering (top layer) building foundation Foundation & cellar hot water Water heaters interior climate Heating system lighting lighting systems
BathtubShower headToilet emptying system
FURNITURE FOR INTERIOR furniture FurnitureWashing machinelaundry dryers
washing tableware Dishwasher baby products baby diapers healthcare and dtergents Soap, detergents passenger transport Regular trips up to 150 km transport of goods Transport goods (Domestic)
INFORMATION TECHNOLOGIES AND PAPER office machine Copierbeverage packagingfood packagingOther household packaging
industrial packaging Industrial packagingTEXTILE clothing Clothing
exterior wall
floor
TRANSPORT
PACKAGING household packaging
interior wall
BUILDING OCCUPANCY
ELECTRICAL APPLIANCES
HEALTHCARE AND DETERGENTS
washing laundry
sanitary equipment
BUILDING STRUCTURE
Table 1 . Resource intensive product categories
The figure provides, for each function class and resource type, the resource requirement of all resource intensive product category within the function class as expressed as a percentage of all the resource requirement by all the product categories considered in the full product list.

INTEGRATING CLIMATE, RESOURCE AND WASTE POLICIES THROUGH PRODUCT POLICIES
Activity report : Scientific report
CP13_en.doc/Sophie Mouravieff 20/10/03 Institut Wallon / VITO 10/21
0%
10%
20%
30%
40%
50%
60%
70%
80%
90%
100%
Metal
Mineral
Synth
etic or
ganic
Natural
organ
icM Ep Eu
E LC H
reso
urc
e re
qu
irem
ent
(% t
ota
l pro
du
cts) Textile & Footwear
Packaging
Information technologies &paper
Transport
Healthcare & detergent
Electric appliances
Furniture for interior
Building occupancy
Building structure
This graph shows that the 32 product categories resulting from the selection represent a total of at least 87% of the total for each indicator. The general conclusions at this stage are that :
• The function class "building structure" represents more than 70% of the total material requirement (and 93% of the total mineral material requirement). Building structure represents also 32% of the energy requirement due to the material manufacturing.
• Building occupancy represents the highest energy consumption during the use phase (49%) and also the highest demand for water (93%).
• Transport is an important consumer of metals and synthetic organic (42% and 11%). Its weight is important in energy demand (both from the production and the use phases). For the total, it represents a large user for ELC (31%).
• Packaging contributes to 9% of the total material demand, with especially large consumption of metals 16%), synthetic organics (30%) and natural organic (31%).
• Then electrical appliances represent non-negligible consumers of energy and water (7% for water use and 5% of energy).
• Information technologies and paper represent an important consumption of natural organic (paper for copiers and printers), with 28% of the total.
• Resource intensive products among the function classes "Textiles & footwear", "interior furniture" and "healthcare & detergent" represent a smaller resource requirement.

INTEGRATING CLIMATE, RESOURCE AND WASTE POLICIES THROUGH PRODUCT POLICIES
Activity report : Scientific report
CP13_en.doc/Sophie Mouravieff 20/10/03 Institut Wallon / VITO 11/21
3.2.2 High impact products
3.2.2.1 Ranking resource intensive product categories
We could quantify the life cycle indicators XLC for several environmental impacts (energy, raw materials, greenhouse gases, acidifying and photochemical substances emissions to air, oxygen depleting substances to water and waste). These indicators could be used in order to rank resource intensive products according to each of these environmental impacts.
We also made a sensitivity analysis in order to evaluate the uncertainty of these results as stemming from the uncertainty on the basic data used (consumption, composition, emission factors). From this analysis we conclude that the uncertainty is quite large, as we can expect confidence intervals ranging from more than half to twice the estimates. Therefore, the results should be interpreted as orders of magnitude and not as absolute levels of impacts.
The results of this ranking are presented in Figure 1 and Figure 2 for the energy and raw material requirement, and are also available in the chapter 8 of the report for other impacts. Despite the uncertainty, we can draw some first conclusions :
For raw materials, the main product categories are building elements, transport and packaging (industrial). For building materials, most of the raw material consumed consist in non metallic minerals, while for transport, it consists in metals.
In general, the production phase is the most intensive in raw material use. For transport, raw materials are also consumed during the use phase (especially related to tyres and lubricants). The use of copiers also leads to raw material consumption due to paper consumption.
For energy we can notice that the most important product categories require energy mostly during their use phase.
Two product categories are clearly at the top : transport and heating systems. For the former, the use phase is obviously linked to fuel consumption. However tyres and lubricants represent an additional energy consumption during the use phase of cars.
Three other product categories represent an important part of the energy consumption : lighting systems, water heaters and industrial packaging. With less confidence we also notice significant consumption by copiers (energy and paper during the use phase), electrical appliances and some building elements.
In general the impact on energy during the disposal phase is completely negligible. The main reason is that the recycling of materials has been allocated to the production phase through the assumption regarding the rate of recycled materials as used to manufacture the product. As a result, any positive impact from recycling is completely allocated to the production phase.
The other reason is linked to the waste incineration that, when accompanied with energy recovery, would result in energy credit. However the credits, where applicable, are always very small. This is explained by three facts : On the average, the electricity production efficiency in Belgian incinerators is no more than 15%. In addition, only 50% of waste incineration is accompanied with energy recovery. Then, for one given product, only one fraction of the material involved in the product manufacturing will be incinerated at the end.
INTEGRATING CLIMATE, RESOURCE AND WASTE POLICIES THROUGH PRODUCT POLICIES
Activity report : Scientific report
CP13_en.doc/Sophie Mouravieff 20/10/03 Institut Wallon / VITO 12/21
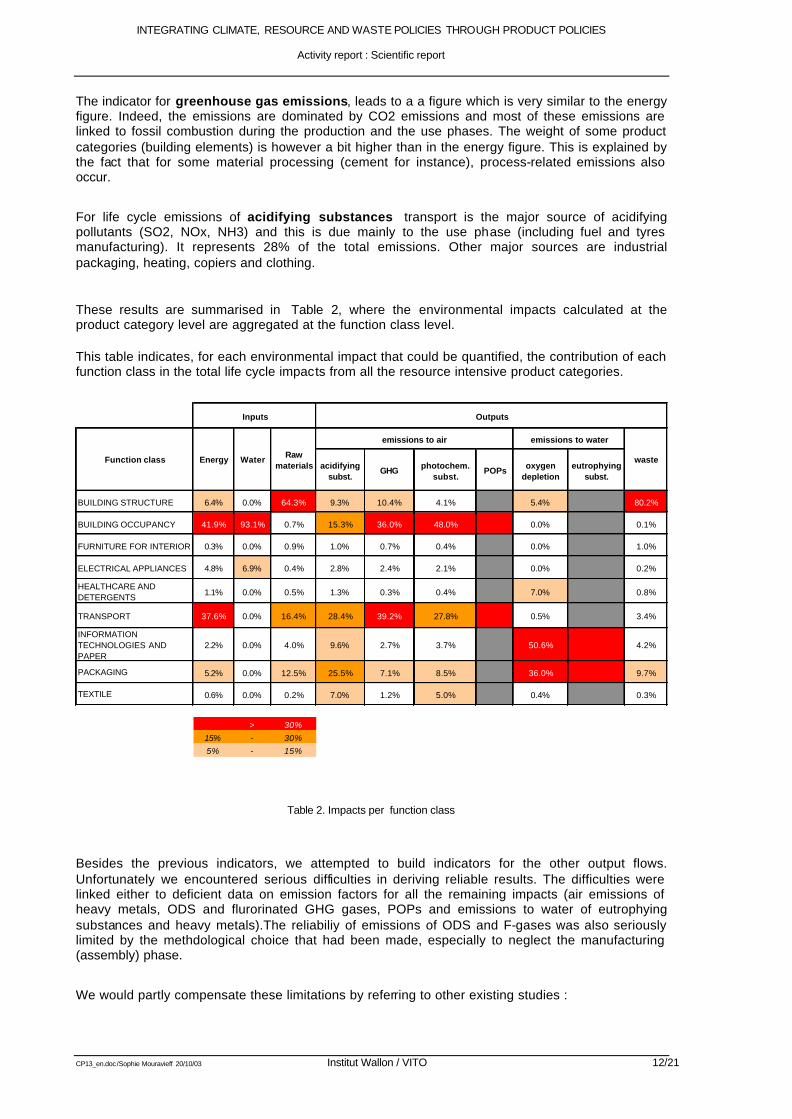
The indicator for greenhouse gas emissions, leads to a a figure which is very similar to the energy figure. Indeed, the emissions are dominated by CO2 emissions and most of these emissions are linked to fossil combustion during the production and the use phases. The weight of some product categories (building elements) is however a bit higher than in the energy figure. This is explained by the fact that for some material processing (cement for instance), process-related emissions also occur.
For life cycle emissions of acidifying substances transport is the major source of acidifying pollutants (SO2, NOx, NH3) and this is due mainly to the use phase (including fuel and tyres manufacturing). It represents 28% of the total emissions. Other major sources are industrial packaging, heating, copiers and clothing.
These results are summarised in Table 2, where the environmental impacts calculated at the product category level are aggregated at the function class level.
This table indicates, for each environmental impact that could be quantified, the contribution of each function class in the total life cycle impacts from all the resource intensive product categories.
acidifying subst.
GHG photochem. subst.
POPs oxygen depletion
eutrophying subst.
6.4% 0.0% 64.3% 9.3% 10.4% 4.1% 5.4% 80.2%
41.9% 93.1% 0.7% 15.3% 36.0% 48.0% 0.0% 0.1%
0.3% 0.0% 0.9% 1.0% 0.7% 0.4% 0.0% 1.0%
4.8% 6.9% 0.4% 2.8% 2.4% 2.1% 0.0% 0.2%
1.1% 0.0% 0.5% 1.3% 0.3% 0.4% 7.0% 0.8%
37.6% 0.0% 16.4% 28.4% 39.2% 27.8% 0.5% 3.4%
2.2% 0.0% 4.0% 9.6% 2.7% 3.7% 50.6% 4.2%
5.2% 0.0% 12.5% 25.5% 7.1% 8.5% 36.0% 9.7%
0.6% 0.0% 0.2% 7.0% 1.2% 5.0% 0.4% 0.3%
> 30%
15% - 30%
5% - 15%
Outputs
Energy Water wasteRaw materials
emissions to air emissions to water
Inputs
PACKAGING
TEXTILE
ELECTRICAL APPLIANCES
HEALTHCARE AND DETERGENTS
TRANSPORT
INFORMATION TECHNOLOGIES AND PAPER
Function class
FURNITURE FOR INTERIOR
BUILDING OCCUPANCY
BUILDING STRUCTURE
Table 2. Impacts per function class
Besides the previous indicators, we attempted to build indicators for the other output flows. Unfortunately we encountered serious difficulties in deriving reliable results. The difficulties were linked either to deficient data on emission factors for all the remaining impacts (air emissions of heavy metals, ODS and flurorinated GHG gases, POPs and emissions to water of eutrophying substances and heavy metals).The reliabiliy of emissions of ODS and F-gases was also seriously limited by the methdological choice that had been made, especially to neglect the manufacturing (assembly) phase.
We would partly compensate these limitations by referring to other existing studies :

INTEGRATING CLIMATE, RESOURCE AND WASTE POLICIES THROUGH PRODUCT POLICIES
Activity report : Scientific report
CP13_en.doc/Sophie Mouravieff 20/10/03 Institut Wallon / VITO 13/21
- For POPs emissions, regional inventories indicate that the most important sources are heating and transport.
- For eutrophying substances emissions to water regional inventories indicate that paper and packaging are two major sources.
3.2.2.2 Identifying specific impacts in less resource intensive product categories
It was necessary to analyse product categories categorised as non resource intensive in order to detect products with potentially significant impacts with respect to some specific environmental fluxes.
Based on complementary informations (either quantitative or qualitative) on some specific product categories and environmental impacts we concluded that additional product categories could be considered as high impact :
− Products consumed widely, using ODS or fluorinated greenhouse gases during one of their life cycle stage and for which the leakage is significant (refrigerators, air-conditioning systems (mobile and stationary)). All three product categories would also be considered with respect to their energy use during the use phase.
− Computers and their electronic peripherals are using materials with unknown impact on resource depletion and environmental impact of waste: these products would be considered together with electrical appliances.
3.2.2.3 Conclusions on high impact products
Based on the quantified impacts and product category ranking on one hand and on other quantitative and/or qualitative existing information, on the other hand we conclude that the most important product categories are among the following function classes :
• Building structure and building occupancy
• Transport
• Packaging
• Electrical and electronic appliances
The results are summarised in the following table.

INTEGRATING CLIMATE, RESOURCE AND WASTE POLICIES THROUGH PRODUCT POLICIES
Activity report : Scientific report
CP13_en.doc/Sophie Mouravieff 20/10/03 Institut Wallon / VITO 14/21
most important flux other significant flux
Building structure raw materials, wasteenergy, greenhouse gases,
acidificationF-gases (insulation material
Building occupancy energy, waterGHG, POP, photochemicals, POPs,
raw materialsF-gases and energy (air
conditioning)
Transport energy, acidification, GHG, photochemicals, POPs
raw materials -
Packaging emissions to waterwaste, energy, greenhouse gases,
acidifying substances-
Electrical & electronic appliances
- raw materialsenergy, water, waste, ODS &
F-gases
not quantified, or only partially, but potentially
important
quantified fluxes

INTEGRATING CLIMATE, RESOURCE AND WASTE POLICIES THROUGH PRODUCT POLICIES
Activity report : Scientific report
CP13_en.doc/Sophie Mouravieff 20/10/03 Institut Wallon / VITO 15/21
0 50 100 150 200 250 300 350
Personal transportation
Heating system
Lighting systems
Water heaters
Industrial packaging
Copier
Laundry dryers
Dishwasher
Foundation & cellar
Wall elements
Washing machine
Beverage packaging
Food packaging
Other household packaging
Soap, detergents
Supporting wall
Ornamental floor (top layer)
Clothing
Roof covering (top layer)
Bathroom and kitchen walls decoration
Baby diapers
Exterior ornamental gable
Supporting floor
Window
Furniture
Wall isolation
Bathtub
Wall preparation for decoration
Transport goods (Domestic)
Other non plastered wall decoration
Indicator for energy : ELC (PJ)
production phase use phase disposal phase
Figure 1 . Results for energy for the resource intensive product categories

INTEGRATING CLIMATE, RESOURCE AND WASTE POLICIES THROUGH PRODUCT POLICIES
Activity report : Scientific report
CP13_en.doc/Sophie Mouravieff 20/10/03 Institut Wallon / VITO 16/21
0 500 1,000 1,500 2,000 2,500 3,000 3,500 4,000 4,500
Foundation & cellar
Personal transportation
Wall elements
Industrial packaging
Exterior ornamental gable
Supporting wall
Supporting floor
Roof covering (top layer)
Copier
Wall preparation for decoration
Transport goods (Domestic)
Furniture
Food packaging
Other household packaging
Window
Baby diapers
Beverage packaging
Other non plastered wall decoration
Ornamental floor (top layer)
Water heaters
Heating system
Clothing
Washing machine
Dishwasher
Wall isolation
Bathtub
Laundry dryers
Lighting systems
Shower head
Bathroom and kitchen walls decoration
Indicator of raw material use : RLC (ktonnes)
production phase use phase disposal phase
Figure 2 . Results for raw materials for the resource intensive product categories
INTEGRATING CLIMATE, RESOURCE AND WASTE POLICIES THROUGH PRODUCT POLICIES
Error! Style not defined.
CP13_en.doc/Sophie Mouravieff 20/10/03 Institut Wallon asbl 17/21
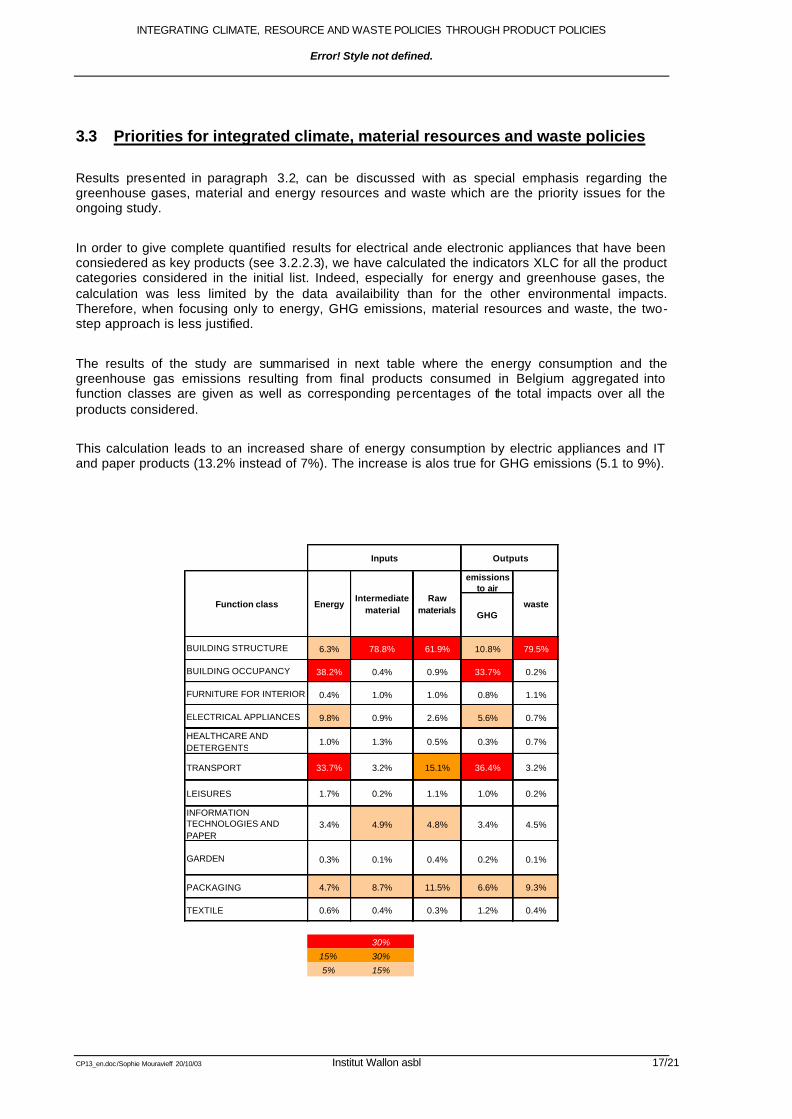
3.3 Priorities for integrated climate, material resources and waste policies
Results presented in paragraph 3.2, can be discussed with as special emphasis regarding the greenhouse gases, material and energy resources and waste which are the priority issues for the ongoing study.
In order to give complete quantified results for electrical ande electronic appliances that have been consiedered as key products (see 3.2.2.3), we have calculated the indicators XLC for all the product categories considered in the initial list. Indeed, especially for energy and greenhouse gases, the calculation was less limited by the data availaibility than for the other environmental impacts. Therefore, when focusing only to energy, GHG emissions, material resources and waste, the two-step approach is less justified.
The results of the study are summarised in next table where the energy consumption and the greenhouse gas emissions resulting from final products consumed in Belgium aggregated into function classes are given as well as corresponding percentages of the total impacts over all the products considered.
This calculation leads to an increased share of energy consumption by electric appliances and IT and paper products (13.2% instead of 7%). The increase is alos true for GHG emissions (5.1 to 9%).
emissions to air
GHG
6.3% 78.8% 61.9% 10.8% 79.5%
38.2% 0.4% 0.9% 33.7% 0.2%
0.4% 1.0% 1.0% 0.8% 1.1%
9.8% 0.9% 2.6% 5.6% 0.7%
1.0% 1.3% 0.5% 0.3% 0.7%
33.7% 3.2% 15.1% 36.4% 3.2%
1.7% 0.2% 1.1% 1.0% 0.2%
3.4% 4.9% 4.8% 3.4% 4.5%
0.3% 0.1% 0.4% 0.2% 0.1%
4.7% 8.7% 11.5% 6.6% 9.3%
0.6% 0.4% 0.3% 1.2% 0.4%
30%
15% 30%
5% 15%
OutputsInputs
Energy wasteRaw
materialsIntermediate
material
PACKAGING
TEXTILE
ELECTRICAL APPLIANCES
HEALTHCARE AND DETERGENTS
TRANSPORT
INFORMATION TECHNOLOGIES AND PAPER
LEISURES
GARDEN
Function class
FURNITURE FOR INTERIOR
BUILDING OCCUPANCY
BUILDING STRUCTURE

INTEGRATING CLIMATE, RESOURCE AND WASTE POLICIES THROUGH PRODUCT POLICIES
Error! Style not defined.
CP13_en.doc/Sophie Mouravieff 20/10/03 Institut Wallon / VITO 18/21
3.3.1 Life cycle emissions versus national emissions
Compared to the national primary energy consumption as reported in the Belgian energy balances from the Ministry of Economic Affaires , the estimated life cycle energy consumption from final products consumed in Belgium represent 38%. The same ratio is calculated for greenhouse gas emissions (see Table 3).
Two types of reasons explain the gap between the two sets of fi gures :
- the first type of reason is linked to the different accounting approaches. In the first approach (national energy balance and GHG national inventory), the energy consumption / GHG emissions accounted relate to the impacts all consuming / emitting activities that occur in Belgium. Hence, energy consumption / GHG emissions resulting from imported goods are not accounted. On the opposite, the life cycle energy consumption / GHG emission resutling from the national production of goods production that are dedicated to exports are not accounted in the second approach.
The difference between both approaches is reflected importantly especially for Belgium whose economy is very open.
- The second type of reason relates to the level of exhaustiveness of the final products list considered. For instance while some building materials are exported, the bulk of the materials produced in Belgium is used in the country. However, the final products considered in the study represent one fraction only of these materials. Indeed an important volume of cement, bitumen, steel is used to build infrastructures that were not accounted. Food products were not studied so that their life cycle energy consumption, and their GHG life cycle emissions (CH4) were not considered.
gross energy (PJ) 2402 913 38%
CO2 127
CH4 10.9
N2O 9.1
F-gas 0.8
total 148 54.66 37%
GHG (Mt eq-CO2)
life cycle consumption / emissions from final product consumed in
Belgium
direct consumption / emissions in
Belgium
Table 3 : Comparison of national energy consumption and GHG emissions and life cycle impacts of non-food final products consumed in Belgium
Source : for the direct energy consumption (Ministry of Economic Affairs); for the GHG direct emissions (Belgian Third National Communication for the UNFCCC)

INTEGRATING CLIMATE, RESOURCE AND WASTE POLICIES THROUGH PRODUCT POLICIES
Error! Style not defined.
CP13_en.doc/Sophie Mouravieff 20/10/03 Institut Wallon / VITO 19/21
3.4 Existing policies and measures
Environmental awareness in the last decade has seen a shift away from production facilities and processes (e.g. point source emission limits) to products and their impacts on the environment across their life cycle. IPP can be seen as the response from governments to the challenge of sustainable product development. Environmental Product Policy covers only the environmental part of IPP.
At the international level, no explicit integrated product policy (IPP) or, only considering the environmental aspect; environmental product policy (EPP) exists yet. However, there are some important international policies/treaties that greatly influence the environmental product policy implementation at the EU and national level: “Health & Safety” policies, current “Environmental” policies and treaties, and the international existence and acceptance of instruments such as voluntary environmental performance certification of companies (i.e. ISO 14001, or EMAS in Europe…) and also on certification of products, the so-called eco-labelling programs.
At the European Union (EU) level, no explicit environmental product policy (EPP) exists yet. An Integrated Product Policy (IPP) has been proposed as a policy initiative by the European Commission’s DG Environment with the aim of harmonising environmental product policies currently being developed at the EU Member State level. IPP has been described as a future policy framework, providing a systematic approach to and overview of various types of instruments (e.g. legal, voluntary, fiscal) designed to influence the design, manufacturing, marketing and use of products. Most prominent among these instruments as proposed by the Green Paper are probably the reduced sales taxes on eco-labelled products, greener public procurement and the “new approach” / “essential requirements” principle. The focus in the current Green Paper is clearly to lever market mechanisms towards more sustainable consumption and production patterns, more than implementing mandatory legislation.
In Belgium, some EPP instruments and initiatives have already been implemented at different political levels, according to the differences in political competence. At the Belgian federal level the main implemented EPP-instruments are: ecotax, the communitary system for the granting of ecolabels and the strategies defined in the Federal Plan for Sustainable Development.
However these instruments are only a first step towards a genuine Product Policy in Belgium and will be intensified and better co-ordinated in the future.
In Belgium, the Federal State adopted in 1998 a new law on Product Standards (MB, 1998) aiming at the Promotion of Sustainable Production and Consumption Patterns to protect Health and Environment. Sustainable Consumption patterns are an explicit target in the Federal Plan for Sustainable Development.
The Federal Plan for Sustainable Development mandates the Service Product Policy from the Federal Services for the Environment to elaborate a Master Plan on Product Policy. This General outline had been submitted for advice by the Minister for the Environment to the Federal Council for Sustainable Development, the Central Council for the Economy, the Council for the Consumption, the Upper Council for Hygiene and also the CIE extended and the Interdepartmental Coucil for Sustainable Development (CIDD).
Last 1st October, the Federal Services for the Environment have issued a Draft Master Plan for the Federal Product Policy. This draft will be submitted for advice by the Minister for the Environment to the same consultation bodies. The presentation of the draft Master Plan to the Minsister Council is scheduled by early 2003 with a view of adoption.

INTEGRATING CLIMATE, RESOURCE AND WASTE POLICIES THROUGH PRODUCT POLICIES
Error! Style not defined.
CP13_en.doc/Sophie Mouravieff 20/10/03 Institut Wallon / VITO 20/21
At the Belgian regional level (Flanders/Walloon Region/Brussels) mainly the enforcement of the extended producer responsibility principle has increased, which aims at making manufacturers and consumers more (economically) involved in the disposal stage and the waste treatment of products. This is the case for i.e. packaging waste, paper waste, batteries, tyres, electrical and electronic products. Also, some initiatives have been introduced in the field of ecodesign (i.e. demonstration projects and the Factor 10 information point in Flanders ii) and environmental product information (i.e. OVAM publication for consumers on environmental aspects related to several product types and workshops for local governments to inform on public environmental procurement).
4 Second phase: detailed analysis for specific product groups
4.1 Preliminary research for case study on transport
From the preliminary research on mobility demand, we have concluded that the major impact of private transport stems from passenger cars (over 80% of the total number of vehicle-kilometers). Furthermore, all available scenarios stress that the predominance of passenger cars will not decrease in the years to come!
In our attempt to tackle the problem of passenger cars, a picture is drawn of the demand for passenger cars. In this market description, a provisional segmentation of the market is used, because the extreme degree of differentiation is one of the central characteristics of the passenger car market. The idea is to estimate the environmental impact (within the scope of this study, we of course limit the research to greenhouse gas emissions, resource use and waste treatment) of an average passenger car in each of these segments, which can then be compared with each other. In order to achieve this, an idea has to be developed on the main characteristics of nowaday’s cars, in the technological as well as in the environmental field. Also the relation between passenger car demand numbers and a few car characteristics (such as fuel type, car age, weight, …) has been under study, so as to gain more knowledge on present market trends. At least one important bottleneck has been identified, because the breakdown of demand figures according to a car’s characteristics will need to be conducted on the basis of a few assumptions, the validity of which is not always very clear.
Also, in order to develop an idea on the material flows regarding these passenger cars, the number of cars that are actually discarded yearly has to be estimated. It might be necessary to develop a more reliable figure for the importance of import and export flows and of second-hand cars. In order to demonstrate the important interrelations that exist between different life cycle stages, the following proposal for an analyzing model has been drawn.
ii www.factor10.be

INTEGRATING CLIMATE, RESOURCE AND WASTE POLICIES THROUGH PRODUCT POLICIES
Error! Style not defined.
CP13_en.doc/Sophie Mouravieff 20/10/03 Institut Wallon / VITO 21/21
passenger kilometres
vehicle kilometres
(vkm)
segment B
segment C
segment D
segment A
resource use
GHG emissions during use
waste treatment
For every segment: 1) Market share,
2) Avg. vkm distribution, 3) Life span distribution.
For every segment:
...
Avg. passenger load
sum = total environmental load
considered here
Avg. material composition
Avg. fuel consumption
GHG emissions during
material production
GHG emissions during
waste treatment
spare parts demand
scarcity
GHG emissions during extraction
weight
For every material / fuel:
scarcity
fuel type
From the preliminary environmental impact assessment, it appears that the most difficult part of the study will be the “inter-phasal” influences: the parameter changes which sort effect on at least two different stages of the car’s life cycle. In order to be able to analyze the proneness of producers to support the evolution towards environmentally friendlier cars, a first attempt has been done to create an approach in which the total life cycle impact assessment can be complemented with an indicator of the costs associated with such measures. Further research, as to which kind of model is appropriate and which barriers need to be overcome for example, will be conducted on this issue.
See annexes for the state of affairs of this study topic.
5 Future prospects and planning
In accordance to the project planning research efforts during the year 2003 will be dedicated to the second step of the project which aims at an in-depth analysis of four product groups: These product groups that were selected before the first steps and its results were available corresponds to product categories being part of the key products that were identified after this first step.
Two of the product categories previously studied, will be broadened to larger categories (all household packaging, all residential buildings) and to materials use and waste. A similar analysis will be carried out for two additional product categories (paper in offices in connection with computing technologies, and cars). These analyses aim at estimating the life cycle GHG emissions, material use and waste caused by the Belgian demand of the concerned products and at identifying potential options for impacts mitigation. Costs and benefits of these options will be estimated and their technical, legal and sociological limits will be evaluated. This will result in a theoretical potential for reduction of the three impacts studied.