iv. determining resource needs - portland, oregon
TRANSCRIPT

Portland Fire and Rescue Service Delivery System Study
TriData, a Division of 51 March 2006 System Planning Corporation
IV. DETERMINING RESOURCE NEEDS
When, where, and how much are the common questions asked by administrators, city or county council, and citizens when it comes to determining the resources for government. Determining the proper level of resources to deploy for a fire department involves asking the same questions as well as balancing the safety concerns of citizens and the financial situation of the local government.
Of the ‘when, where, and how’ questions “where” is the biggest question and has the most impact on other decisions. Some of the areas it can impact include: how many units are needed, how big should they be, and when should the units be deployed. All of these impact overall cost. Poorly placed fire stations, apparatus, and personnel often results in more resources being placed in the community than are needed to provide the desired level of service. The availability of land to build on impacts the cost and the size of a new station, which can also impact the types of apparatus that can be located at that station.
Deciding how many emergency response resources to deploy, and where, is not an exact science. There are no perfect deployment models. The ultimate decision is based on a combination of risk analysis, professional judgment, and the city’s willingness to accept more or less risk. Accepting more risk generally means that fewer resources are deployed, though deploying more resources is no guarantee that loss will be less, especially in the short term.
Obviously, there are many pieces to consider, but there are some good sources to draw on to help make the decisions. In this chapter we review some of the available sources, including the Insurance Services Office (ISO), the National Fire Protection Agency (NFPA), the Commission on Fire Accreditation International (CFAI), the Occupational Safety and Health Administration (OSHA), and comparable departments across the nation. The purpose of this review is to outline standards to be used later in the report for answering the following questions:
• What should the Bureau’s minimum crew size and overall staffing level be? • Are there opportunities for more effective and/or more efficient use of Bureau
resources? • Are Bureau stations located optimally throughout the city considering the various
services offered by the Bureau? • Are there options for mergers and/or expanded cooperation with neighboring
jurisdictions beyond mutual aid agreements? • How does the level of risk in Portland compare to other jurisdictions nationwide? • How do the services provided by the Bureau correspond to those provided by similar
jurisdictions? • Are there opportunities for capital investment that would enhance Bureau services
and/or result in long term cost savings?

Portland Fire and Rescue Chapter IV. Determining Resource Needs Service Delivery System Study
TriData, a Division of 52 March 2006 System Planning Corporation
SOURCES TO AID IN DEVELOPING CRITERIA
A number of sources have been cited to aid in benchmarking Portland.
Insurance Services Office (ISO) – The ISO is a national insurance engineering service organization that assigns a public protection classification (PPC) to jurisdictions based on fire department services. Insurance companies typically establish insurance rates for individual occupancies or groups of occupancies based on the PPC. PPCs are established using the ISO’s Fire Suppression Rating Schedule (FSRS). Once widely used by fire departments to evaluate system performance, the FSRS’s use is somewhat limited in that it only evaluates fire protection (not EMS, which most fire departments now provide to some degree). Also, the FSRS does not consider efficiency (e.g., how many resources are deployed in comparison to the number of actual calls). Though not as widely used now, ISO ratings are still appropriate to consider as part of a more comprehensive system performance review. Combined with other assessments, ISO standards are useful, but not by themselves.
ISO RATING: To analyze a community’s fire protection, the ISO uses a grading system of 1 to 10. A community protection factor of one is the highest possible grade with insurance rates likely to be lowest for the community (ratings increase by 1 for every 10 credits, e.g., Class 1 = 90.00+ credits, Class 2 = 80.00–89.99, Class 3 = 70.00–79.99, etc.). A community with a Class 10 rating means that there essentially is no recognized fire protection system or availability of water for fire suppression. Only a very small number of communities with very effective water distribution systems and mostly career fire departments are able to achieve a rating of one.
Portland Fire and Rescue was last evaluated by the ISO in 1972 and currently holds a Class 2 rating.
In 2000, the nation’s largest home insurance carrier, State Farm, announced it would cease to use the ISO PPC as the basis for its home insurance rates, and would use its own internal data to determine rates. While the exact effects of this are yet to be seen, for economic reasons it is unlikely that State Farm’s rates will be much different than those determined by the ISO method. In addition, most insurance carriers band groups of ratings together for efficiency; thus, there may be no difference in treatment of a Class 1 versus a Class 4. Therefore, depending on the rating system used by individual insurance carriers in Portland, there may be little or no fiscal advantage to property owners by being in a certain PPC.
According to a report issued by the ICMA in 2002:
In its practical application, the rating schedule is a tool used for assessing the insurance rate charged in a specific community on a specific property. Generally, the better the rating schedule classification, the lower the insurance premium charged. Although one cannot say with certainty what the effect of an improved rating schedule classification might be in a specific community, improvements in the classification in communities

Portland Fire and Rescue Chapter IV. Determining Resource Needs Service Delivery System Study
TriData, a Division of 53 March 2006 System Planning Corporation
with between 10 and five tend to result in lower insurance premiums for residential properties. Improvements when the community has ratings better than five can result in lower premiums on commercial and industrial properties but will usually have a negligible effect on premiums for residential properties.19
ISO ratings are somewhat limited in their application because they are related mostly to the performance of the water system and water pressure to deal with a large-scale fire, rather than the every day house fire (40 percent of the rating is based on water availability for fire suppression). As noted in the ISO’s Fire Suppression Rating Schedule, “The Schedule is a fire insurance rating tool, and is not intended to analyze all aspects of a comprehensive public fire protection program. It should not be used for purposes other than insurance rating”20 A community may have an excellent fire department and communications system, but it may have a higher numerical rating if the water distribution system is not constructed to ISO standards. The three components evaluated by ISO in making a final determination of rates are:
• Fire department: number of engines, training, personnel, procedures, etc. (50 percent). Equipment accounts for 26 percent, personnel for 15 percent, and training for the remaining 9 percent.
• Water supply (40 percent). • Emergency dispatching and communications (10 percent).
A review of the Fire Suppression Rating Schedule can be useful to city decision-makers when trying to develop an understanding of the components evaluated by ISO engineers as part of their community survey process and as a tool in developing a comprehensive analysis of their fire department. A brief overview of the rating system is given below.
Fire Department – Fifty percent of the overall grading is based on the number of engine companies and the amount of water a community needs to fight a fire. ISO reviews the distribution of fire companies throughout the area and checks that the fire department tests its pumps regularly and inventories each engine company's nozzles, hoses, breathing apparatus, and other equipment. ISO also reviews the fire company records to determine:
• The types and extent of training provided to fire company personnel, • The number of people who participate in training, • The number of firefighters responding to emergencies, and • The maintenance and testing of the fire department's equipment.
Water Supply – Forty percent of the grading is based on the community's water supply. This part of the survey focuses on whether the community has sufficient water for fire suppression beyond daily maximum consumption. ISO surveys all components of the water
19 International City/County Management Association, Managing Fire and Rescue Services, 777 N. Capitol Street, N.E., Washington, DC, 2002, p. 293. 20 Fire Suppression Rating Schedule, Edition 02-03, ISO Properties, Inc., 2003

Portland Fire and Rescue Chapter IV. Determining Resource Needs Service Delivery System Study
TriData, a Division of 54 March 2006 System Planning Corporation
supply system, including pumps, storage, and filtration. Observations of the tests at representative locations in the community are used to determine the rate of flow the water mains provide. Finally, the distribution of fire hydrants is examined to ensure that no location is more than 1,000 feet from the closest hydrant.
Under the guidelines established by ISO, a community is eligible for Class 8 or better rating if the municipal water supply is capable of delivering at least 250-gallons per minute (gpm) for a period of at least two hours. The 250-gallon per minute flow is in addition to the daily maximum rate of consumption.
Dispatch and Communications – Ten percent of the overall grading is based on how well the fire department receives and dispatches fire alarms. Field representatives evaluate the communications center looking at the number of operators at the center, telephone service (includes the number of telephone lines coming into the center), and the listing of emergency numbers in the telephone book. Field representatives also look at the dispatch circuits and how the center notifies firefighters about the location of the emergency.
National Fire Protection Association (NFPA) – The NFPA is an international, nonprofit organization dedicated to reducing the worldwide burden of fire and other hazards on the quality of life by developing and advocating scientifically based consensus codes and standards, research, training, and education. The NFPA recommendations are standards and guidelines developed by committees of chief officers, volunteer representatives, union officials, and industry representatives. Although the NFPA’s standards are not legally binding, they are often codified into local ordinances, and it is important to consider NFPA standards whether or not they are adopted locally since NFPA standards sometimes become the de facto standard for evaluating different levels of fire and emergency service protection.
Commission on Fire Accreditation International (CFAI) – Another highly influential group, the CFAI consists of representatives from the International Association of Fire Chiefs (IAFC) and the International City/County Management Association (ICMA). The CFAI and the accreditation process were designed to establish industry-wide performance measures for overall organizational performance and the establishment of the standard for a jurisdiction is purely voluntary. While a small fraction of fire departments across the nation (about 100) have gone through the accreditation process and others are working toward that goal, most departments are focusing on the creation of a “Standards of Response Coverage” document (one of four items required for accreditation). The standards of coverage concept has become proven so useful that the CFAI expanded the original 44-page chapter into a 190+ page “how-to” manual.
The CFAI does not make many explicit recommendations on standards for fire/EMS departments to adopt. Rather, it encourages a thorough assessment of risks in the community, public expectations and the resources needed to meet expectations given the risks. The creation

Portland Fire and Rescue Chapter IV. Determining Resource Needs Service Delivery System Study
TriData, a Division of 55 March 2006 System Planning Corporation
of written standards should then be based on that assessment. Part of the methodology for setting standards includes looking at what other, similar communities are doing.
Occupational Safety and Health Administration (OSHA) – OSHA develops regulations to protect workers from occupational injuries and illnesses. While there are many regulations that apply to firefighting operations, one of the most critical is 29 CFR 1910.134, which addresses requirements for respiratory protection in IDLH (immediately dangerous to life and health) atmospheres, including structural firefighting. In such cases, personnel are required to work in teams of two, with two personnel operating inside the IDLH and two personnel standing by outside the IDLH in the event the entry team becomes incapacitated. This regulation is most commonly referred to as the “Two-in/Two-out” rule.
Interjurisdictional Comparisons – To gauge a department’s performance, it is often helpful to compare it with other departments that are similar in size, offer the same range of services, and are similar in scope and complexity. This section discusses how PF&R compares to other fire departments around the nation. Though not totally conclusive, when components of the comparisons are far above or below the average, a logical question to ask is why. There might be good reasons for not being close to the average; for example, some departments have greater risk in their service area and thus need more resources, which require more money. Regardless, comparisons with similar departments provide a good starting point for benchmarking and raising questions related to system performance.
While interjurisdictional comparisons can be subject to misinterpretations of data that cannot be perfectly compared or defined, they are still of value. Benchmarking is useful as an input into the planning process, but is not directly indicative of the quality of the services provided by PF&R. Analytically, benchmarking is simply a point of reference used to improve the understanding of the department as a whole. It is not the intent of this section to make definitive judgments or implications regarding the quality of service (favorable or otherwise) provided by PF&R or departments in the comparison group. The comparisons are, however, quite useful for identifying trends as well as issues to be further explored.
The jurisdictions selected for comparison were chosen because of their general similarity in size, services, and complexity to Portland. The city included those it often uses as benchmarks. The fire departments are not perfectly comparable. This is not a scientific sample, the sample size is relatively small, and some of the data may not be perfectly co-measurable (apple-to-apple comparisons). Sources of comparative data include direct contact with the departments, surveys, U.S. Census 2003 estimates, department web pages and contacts, and past TriData research.
Table 13 shows some of the basic similarities and differences in the departments that were compared. The average population served for the group is 498,634. The population and land area protected vary between 55 and 314 square miles. This is important because it gauges

Portland Fire and Rescue Chapter IV. Determining Resource Needs Service Delivery System Study
TriData, a Division of 56 March 2006 System Planning Corporation
the difference between a larger fire department’s profiles versus a smaller fire department’s profile.
Table 13: Fire Department Overview
Jurisdictions Population
served
Land Area (Square Miles)
protected Provide EMS Transport?
Charlotte, NC 600,000 281 No Cincinnati, OH 330,000 77 Yes Denver, CO 557,478 153 No Kansas City, MO 442,768 314 No Long Beach, CA 475,460 55 Yes Portland, OR 556,202 150 No Sacramento, CA 463,760 144 Yes Seattle, WA 563,400 84 Yes Average 498,634 157
As noted in the table, some of the fire departments provide emergency medical services transport and others (like Portland) do not. This is important to note because it may attribute to differences in staffing, cost per capita, call volume, and other measures.
Comparisons for staffing, cost, span of control, and others are located throughout the report.
RESPONSE TIMES
Response time is one of the most common performance measures used by the fire service because it is understood by citizens, easy to compute, and useful in the evaluation of end results. It is the way most citizens evaluate the level of service provided; though, response time itself really is not a measure of the quality of service, though it does reflect the timeliness of service, which is one attribute desired by citizens.
While demand for services and individual unit workloads dictate how many stations and apparatus are needed in a community (discussed later in this chapter), response times dictate where specific resources should be placed. There is, however, no single set of nationally accepted response time standards.
Measurement Methodology – To determine overall response time, the clock starts when an individual calls 911 (or alternate emergency number) and stops when the first emergency provider arrives at patient’s side or the scene of the incident.
Several caveats should be kept in mind. First, response times are subject to a variety of measurement errors and only measure one aspect of overall system performance. For example,

Portland Fire and Rescue Chapter IV. Determining Resource Needs Service Delivery System Study
TriData, a Division of 57 March 2006 System Planning Corporation
response times are distorted when units report their arrival on scene either early or late. Second, response times are frequently not comparable across fire-rescue systems because of the differing manners in which they are calculated. Not all departments track vertical response times (that is, the time from arrival on scene to patient contact), so their total response times likely would be lower than the total response times of a department that does track them.
Many fire/EMS departments report average response times while others report fractile response times.21 Average response times have been increasingly less used by the emergency service industry because small numbers of very short or long responses—often recorded in error—can distort the results. Also, the public is interested in how fast a system responds in most cases (fractile) rather than usually (average). More and more departments are adopting the 90th percentile for reporting response times (mostly due to NFPA 1710’s use of this measure).
A fractile response time of x at the 90th percentile means that units respond in x minutes, or less, 90 percent of the time. The remainder beyond the compliance fractile (90th percentile in this case) is the operational tolerance for the system, meaning the system is designed with the understanding that 10 percent of the calls will have response times that exceed the target. Although it is possible to design a system that may ensure rapid response close to 100 percent of the time, it is generally not cost-effective.
Response times here are defined to include four components, which are further illustrated in Figure 16.
Call Processing/Dispatch – This time begins when the call taker/dispatcher answers the 911 call and ends when the first unit is dispatched.
Turnout – This is the time elapsed from dispatch to departure from the station (or other location); it comprises activities such as donning protective gear and boarding the apparatus.
Travel – This period begins with departure from the station and ends when the unit advises that they are on the scene. It does not include the time to actually reach the fire or patient after arrival at the street location of the incident.
Vertical – This is the amount of time from arrival at the scene to arrival at the side of the patient or the site of the fire. It may include going up a high-rise (and hence the term vertical response) or traveling within a hospital, golf course, factory, or other expansive site to get to the site of a fire or the side of a patient.
21 Fractile measurement reports the percentage of calls responded to in x minutes.

Portland Fire and Rescue Chapter IV. Determining Resource Needs Service Delivery System Study
TriData, a Division of 58 March 2006 System Planning Corporation
Figure 16: Components of Total Response Time
Response Time (lay public conception)
911 call Units Apparatus First unit Arrival atreceived dispatched en route on scene patient/fireCall Processing – Begins when the emergency call is answered and ends when emergency responders are dispatched to the identified address of the call. Additional activities and information gathering may take place after notification of responders, but this is not included in call processing time.
Turnout – Begins when emergency responders are notified and ends when appropriate emergency apparatus actually leaves the station en route to the location of the emergency.
Travel (Drive) – Begins when the first appropriate emergency apparatus actually leaves the station and ends when the first appropriate apparatus arrives at the scene of the emergency.
Vertical – Begins when the first appropriate apparatus arrives at the scene of the emergency and ends when personnel arrive at the patient’s side or the fire location.
Most departments do not record the vertical response time component. PF&R currently records a “with patient” time for EMS calls. However, during FY05 42 percent (24,919) of all incidents with a PF&R unit arriving on-scene had a “with patient” time recorded. While this is better than most departments, there is room for improvement. Given the number of high-rises, large facilities (i.e. malls, hospitals, schools), and large open areas (parks) in Portland, this component has the potential to be significant. In FY05, vertical response time averaged 1:44 in Portland. (Response times are discussed in more detail in Chapter V.)
Recommendation 13: Continue tracking vertical response times and expand the program to include all call types. While this time is nearly impossible to reduce, it is important to assess its impact on total response time and determine whether other components should be reduced to compensate for the vertical response component to maintain total response time goals. For example, buildings with average vertical response times over two-minutes and over x calls per year may be classified as higher priority locations and resources placed closer in order to reduce total response times.
Importance of Response Times – While the speed of response is not directly indicative of outcome or quality, response times do affect the number of lives saved and the value of property losses averted when an emergency occurs. This means that while arriving in three or four minutes every time does not guarantee everyone will live and there will be less damage, more people can be helped or the fire can be put out before the entire building is consumed when emergency personnel arrive in five minutes rather than 10 or 20.
Fire spreads quickly after ignition and the faster it is found and extinguished, the better the results; similar to someone suffering from life threatening symptoms, the probability of survival increases the quicker the patient is treated.
Despite these general observations, current statistical models cannot realistically assess nor predict the quality of fire services in terms of lives saved and property losses averted. In

Portland Fire and Rescue Chapter IV. Determining Resource Needs Service Delivery System Study
TriData, a Division of 59 March 2006 System Planning Corporation
place of true measures of fire rescue service outcome, response time is often used as a proxy measure.
Figure 17 depicts the fire propagation curve, which shows the effect of time and temperature rise of a free-burning fire on the destruction of property. According to multiple studies, extension of the fire beyond the room of origin begins approximately six to eight minutes after ignition, and flashover of the room of origin occurs within 10 minutes of ignition. (Flashover is the simultaneous ignition of all flammable material in an enclosed area.)22 In some modern rooms with low ceiling and plastics, flashover can occur in two to four minutes, according to studies by the National Institute of Standards and Technology.
Figure 17: Fire Propagation Curve
Source: Fire Protection Handbook, 18th Ed., National Fire Protection Association
Response Time Standards: Fire/Rescue Service – The most widely recognized standard used in response time analysis is outlined in NFPA 1710, Organization and Deployment of Fire Suppression Operations, Emergency Medical Operations and Special Operations to the Public by Career Fire Departments.
NFPA 1710 was established in 2001 and contains two recommendations that caught the attention of fire service managers and city administrators across the nation. The standard recommends 4-person staffing for all engine and truck companies (discussed later), and a 5-minute dispatch-to-arrival time to be met on 90 percent of calls. The time increases to 6 minutes when one minute is added for call processing/dispatch time, as recommended in NFPA 1221, Standard for the Installation, Maintenance, and Use of Emergency Services Communications Systems. The 5-minute period includes one minute for turnout time and four
22 http://en.wikipedia.org/wiki/Flashover

Portland Fire and Rescue Chapter IV. Determining Resource Needs Service Delivery System Study
TriData, a Division of 60 March 2006 System Planning Corporation
minutes for travel. The travel time translates to a driving distance of two miles from the first-due fire station to the incident (driving at an average speed of 30 mph). Detailed data regarding response times for PF&R is discussed in later chapters.
Again, like all NFPA standards, NFPA 1710 may be adopted by a local jurisdiction, but is not mandatory. Unlike many NFPA standards, NFPA 1710 is not based on much of a research foundation, but rather is the majority vote reflecting experience and opinion of a committee, within which there was much disagreement. There is no published information on the expected reductions in losses or injuries as a function of increased staffing and only a little on the effect of increased response times. Nevertheless, despite having been formulated largely on the basis of expert opinions and task sequencing (what must be done and how many it takes to do it) rather than research, NFPA 1710 has become the de facto benchmark for the emergency response community. However, NFPA 1710 has not been embraced by all groups, including the ICMA.
In addition to the NFPA, the CFAI found that departments average 50 seconds for call processing/dispatch time. This is actually a far less stringent goal than 60 seconds 90 percent of the time since an average is closer to the 50th percentile. The CFAI also found a 60-second average for turnout time. The CFAI baselines were developed by analyzing response records from multiple departments over a decade ago. The new CFAI document, Creating and Evaluating Standards of Response Coverage for Fire Departments, now recommends using fractile measurements rather than averages but does not offer recommendations on response time goals.
Response Time Standards: Emergency Medical Services – One method of measuring and evaluating response times is to count the number of patients who survive to the point of being released from a hospital. Although survival is not solely a function of the timeliness of care, time is crucial to a critically injured or seriously ill patient. Guidelines published by Basic Trauma Life Support International (a widely known training institute) suggest that a trauma patient’s odds of survival are directly linked to the amount of time that elapses between the injury and definitive surgical treatment.23
Prevention of death and disability secondary to acute coronary syndromes is also an issue of time. The American Heart Association 2005 guidelines for CPR and Emergency Cardiac Care emphasize the importance of shortening response time to suspected cardiac arrest patients.24
If brain tissues are deprived of oxygen, they will begin to die within four to six minutes. For that reason it is imperative to begin resuscitation measures as soon as possible. A recent
23 Campell JE. (Ed.). 2000. Basic Trauma Life Support for Paramedics and Other Advanced Providers (4th ed). Englewood Cliffs, NJ: Prentice-Hall. pp. 24-26. 24 AHA. 2005. Highlights of the 2005 American Heart Association Guidelines for Cardiopulmonary Resuscitation and Emergency Cardiovascular Care. Currents in Emergency Cardiovascular Care, 16(4), 1-25.
Portland Fire and Rescue Chapter IV. Determining Resource Needs Service Delivery System Study
TriData, a Division of 61 March 2006 System Planning Corporation
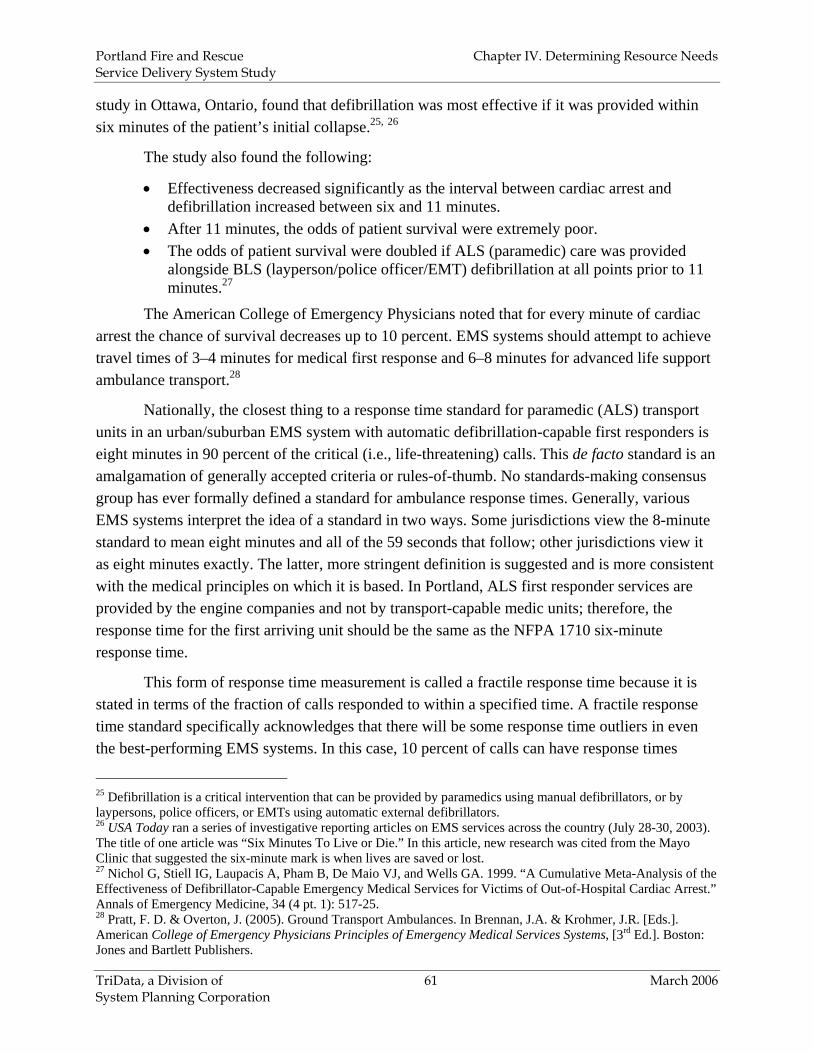
study in Ottawa, Ontario, found that defibrillation was most effective if it was provided within six minutes of the patient’s initial collapse.25, 26
The study also found the following:
• Effectiveness decreased significantly as the interval between cardiac arrest and defibrillation increased between six and 11 minutes.
• After 11 minutes, the odds of patient survival were extremely poor. • The odds of patient survival were doubled if ALS (paramedic) care was provided
alongside BLS (layperson/police officer/EMT) defibrillation at all points prior to 11 minutes.27
The American College of Emergency Physicians noted that for every minute of cardiac arrest the chance of survival decreases up to 10 percent. EMS systems should attempt to achieve travel times of 3–4 minutes for medical first response and 6–8 minutes for advanced life support ambulance transport.28
Nationally, the closest thing to a response time standard for paramedic (ALS) transport units in an urban/suburban EMS system with automatic defibrillation-capable first responders is eight minutes in 90 percent of the critical (i.e., life-threatening) calls. This de facto standard is an amalgamation of generally accepted criteria or rules-of-thumb. No standards-making consensus group has ever formally defined a standard for ambulance response times. Generally, various EMS systems interpret the idea of a standard in two ways. Some jurisdictions view the 8-minute standard to mean eight minutes and all of the 59 seconds that follow; other jurisdictions view it as eight minutes exactly. The latter, more stringent definition is suggested and is more consistent with the medical principles on which it is based. In Portland, ALS first responder services are provided by the engine companies and not by transport-capable medic units; therefore, the response time for the first arriving unit should be the same as the NFPA 1710 six-minute response time.
This form of response time measurement is called a fractile response time because it is stated in terms of the fraction of calls responded to within a specified time. A fractile response time standard specifically acknowledges that there will be some response time outliers in even the best-performing EMS systems. In this case, 10 percent of calls can have response times
25 Defibrillation is a critical intervention that can be provided by paramedics using manual defibrillators, or by laypersons, police officers, or EMTs using automatic external defibrillators. 26 USA Today ran a series of investigative reporting articles on EMS services across the country (July 28-30, 2003). The title of one article was “Six Minutes To Live or Die.” In this article, new research was cited from the Mayo Clinic that suggested the six-minute mark is when lives are saved or lost. 27 Nichol G, Stiell IG, Laupacis A, Pham B, De Maio VJ, and Wells GA. 1999. “A Cumulative Meta-Analysis of the Effectiveness of Defibrillator-Capable Emergency Medical Services for Victims of Out-of-Hospital Cardiac Arrest.” Annals of Emergency Medicine, 34 (4 pt. 1): 517-25. 28 Pratt, F. D. & Overton, J. (2005). Ground Transport Ambulances. In Brennan, J.A. & Krohmer, J.R. [Eds.]. American College of Emergency Physicians Principles of Emergency Medical Services Systems, [3rd Ed.]. Boston: Jones and Bartlett Publishers.

Portland Fire and Rescue Chapter IV. Determining Resource Needs Service Delivery System Study
TriData, a Division of 62 March 2006 System Planning Corporation
greater than eight minutes and the system can still meet the standard. The standard specifically does not use average response time as its measurement because arithmetic averages can be distorted by a small number of outliers.
Factors Impacting Response Time Goals – Decisions about response time goals are not easy to make. Although the standards discussed above provide a framework for setting goals, it is ultimately up to the municipal government policymakers and the fire department to determine appropriate response times and service levels based on the needs of the community they serve. Common factors that should be taken into account include population density, call volume and distribution by type of call, land use, and available resources. Whether or not to apply new technology, such as automatic vehicle locators and traffic preemption devices, is also important as these can improve response times, even without building new stations.
POPULATION DENSITY: Population density is the most basic and common measure used to define whether an area is urban, suburban, or rural. In many ways it determines the other factors listed above. That is, the more people you have in an area, the higher and more concentrated your call volume will be.
The U.S. Census defines urban and rural areas on multiple levels. On a county or city scale, the simplified Census definition of an urban area is an area with at least 1,000 people per square mile. All other areas are rural. However, this definition does not have a middle ground—suburban.
Suburban is a vague and somewhat subjective idea, which makes it the most difficult type of area to define. Suburban areas tend to be mostly residential and are generally on the edges of urban areas. TriData has divided areas into urban, suburban, and rural by population as follows:
• Urban – 2,000+ people/sq. mile or incorporated • Suburban – 1,000–1,999 people /sq. mile or within one mile of a city’s limits • Rural – under 1,000 people /sq. mile
SUPPLEMENTAL PROTECTION SYSTEMS: A fire that smolders or burns undetected or is unreported for a long time may make such sufficient headway as to negate even the fastest response by a fire department. For example, if the fire burns 20 minutes before it is detected, even with a five-minute fire department response time, the damage will have been done. These built-in detection systems and use of simple smoke alarms can reduce time to detect, and make a larger difference than the drive time of emergency vehicles. Even better is built-in suppression systems which not only detect but extinguish or at least old fires in check.
In Portland all new high-rise buildings (5 or more stories or 75 or more feet above the lowest level accessible by fire department) are required to be fit with sprinkler systems.
Some communities have even begun requiring sprinkler systems to be installed in single-family homes. In 1978 San Clemente, CA, implemented the nation’s first comprehensive and

Portland Fire and Rescue Chapter IV. Determining Resource Needs Service Delivery System Study
TriData, a Division of 63 March 2006 System Planning Corporation
mandatory residential sprinkler program. Only a few other communities that we are aware of have such a comprehensive program. They include Prince Georges County, MD; Scottsdale, AZ; and most recently Montgomery County, MD. With residential sprinklers in place, response times to fire calls in suburban and rural areas (where most new housing development is taking place throughout the country) can be longer than for urban areas where the housing stock is older and more likely to be unsprinklered.
TRAFFIC CALMING: Many communities across the nation, including Portland, are installing traffic-calming devices (speed bumps and speed humps) to reduce vehicle speeds, mostly in residential neighborhoods. These devices are popular with neighborhood residents, who often demand them. However, each speed bump adds an estimated 10 to 12 seconds to emergency apparatus response times. The installation of these devices is a value judgment on the part of elected officials, who must weigh the satisfaction and possibly improved traffic safety to neighborhoods with the potential for longer emergency response times and the possible need for additional fire and EMS resources to compensate for the slower travel times. A study on this tradeoff undertaken for the Boulder, CO, City Council in 1997 showed that the likely reduction of traffic fatalities from the slowing of traffic was far less than the likely increase in deaths from slowing the response to delayed response for cardiac arrests and other emergencies.29
In 1998, the Portland, OR, Fire Bureau tested the impacts of 14- and 22-foot speed bumps on emergency apparatus response.30 The tests found that ambulance response times were not impacted much but engines and trucks were slowed by up to nine seconds per bump.31 A compromise to slow traffic but not impact emergency response was to install offset speed bumps with enough room between to allow apparatus to drive around (one in the right lane only followed by one in the left lane only 50 feet ahead).
Map 7 shows the locations of traffic calming devices in Portland as of FY05. They are widespread. The impact of these devices on response times was taken into account in analysis later in this report.
29 Deaths Expected From Delayed Emergency Response Due to Neighborhood Traffic Mitigation, 3 April 1997; submitted by Ronald Bowman to Boulder, CO City Council. 30 These speed bumps are also commonly referred to as speed tables and are flat or slightly rounded on top with a maximum height of three inches in the middle. 31 Source: http://www.trans.ci.portland.or.us/TrafficCalming/reports/split.htm

Portland Fire and Rescue Chapter IV. Determining Resource Needs Service Delivery System Study
TriData, a Division of 64 March 2006 System Planning Corporation
Map 7: Traffic Calming Devices in Portland
TRAFFIC SIGNAL PREEMPTION: On the positive side, traffic light preemption systems change the traffic lights as emergency vehicles approach, stopping civilian vehicles, and allowing emergency vehicles to enter intersections on a green light, thereby reducing the likelihood of a side-impact or head-on collision with another vehicle when having to go through red lights. These systems can be activated by siren or by infrared technology. When activated, the traffic light changes to a temporary green signal for the approaching emergency vehicle. Such a system is an excellent way to improve the safety of citizens and firefighters during emergency responses. In establishing operating procedures for such traffic devices, the department should restrict emergency vehicle operators from entering intersections on red lights because a delayed green light at an intersection with a preemption device can mean that another emergency vehicle is entering the intersection from the cross-road.

Portland Fire and Rescue Chapter IV. Determining Resource Needs Service Delivery System Study
TriData, a Division of 65 March 2006 System Planning Corporation
Portland is in the process of equipping high-congestion intersections with preemption systems.
AUTOMATIC VEHICLE LOCATION (AVL) AND MOBILE DATA COMPUTERS (MDCS): Implementation of an AVL system is beneficial because it allows dispatchers to see the actual location of any unit on a computer-generated map of the city. The AVL data could also be integrated into the CAD system to calculate the truly closest unit to any given emergency and make a dispatch recommendation accordingly, rather than making dispatches on the basis of the fixed station locations. In addition to improving dispatching, AVL improves personnel safety because a unit that is in trouble can be quickly located.
Additionally, an AVL system can be integrated with MDCs installed in each emergency response unit. With the appropriate integration of AVL, navigational, and MDC technologies, the AVL can provide the MDC with a visual map showing the current unit location of the unit and the incident location along with the most efficient route of travel.
MDCs can be used to provide CAD data, city maps, building plans, fire-rescue pre-plans, hospital status, patient information, navigational directions to responding units, etc. to units directly in the field. MDCs can also be used to log status and file incident reports. MDCs can be supported by 800 MHz radio system channels, code-division multiple access (CDMA) cellular technology (the same technology used to access the Internet on cell phones), and other wireless communications technologies.
PF&R units are currently equipped with MDCs that are used to record the en route and on scene times. Units are not equipped with AVL. PF&R evaluated AVL in the past and determined it was not effective due to the grid system, rivers, bridges, freeways, etc.
Recommendation 14: Reconsider the use of AVL in front-line units. As units spend more time on EMS and other types of calls, they are more likely to be in the field when a second call comes in, which increases the utility of AVL. An analysis of overlap of calls would be useful. AVL can help reduce response times, and are a lot lower cost than adding a station. Automatic vehicle location should be evaluated to determine its impact on response times.
Current and Comparable Goals – Often the best place to start when defining response time goals is actual response times in the areas protected, unofficial goals already used by the department, and goals used by neighboring or comparable communities. Citizen satisfaction with the current level of service also can be factored in, though most citizens are not likely to know the quantitative results.
Actual response times in Portland are discussed in the next chapter. PF&R has identified goals for call handling and dispatch in its Standard of Emergency Response Coverage, July 2004. Table 14 summarizes the goals. Call processing and dispatch for PF&R is handled by the Bureau of Emergency Communications (BOEC). PR&F and BOEC jointly agreed to these goals and incorporated them into an intergovernmental agreement.

Portland Fire and Rescue Chapter IV. Determining Resource Needs Service Delivery System Study
TriData, a Division of 66 March 2006 System Planning Corporation
Table 14: PF&R Call Processing and Dispatch Time Goals
Type of Call Goal Compliance Urgent Fire Calls 1:00 90% Priority 2 Fire Calls 1:30 90% Non-priority Fire Calls 2:00 90% High priority EMS Calls 1:30 90% Low priority EMS Calls 2:00 90% Turnout and Travel: All Calls 5:20 90%
Recommended Response Time Goals – As the above discussion shows, setting response time goals is a complex and difficult task. Nevertheless, without these goals making decisions on how many resources are needed, where to put them, and when they are needed would be left up to individual whim and could easily lead to exorbitant, unnecessary expenses. It is therefore critically important to clarify the terminology and the tradeoffs to be made.
With everything discussed above in mind, we recommend the PF&R adopt the response time goals shown in Table 15.
Table 15: Recommended Response Time Goals
Call Type Priority Call
Processing* Turnout Travel Total Compliance
Urgent 1:00 6:00 High 1:30 6:30 Fire Non 2:00
4:00 7:00
High 1:00 6:00 EMS Low 1:30
4:00 7:00
Fire (Truck) All 1:00
1:00
6:00 8:00
90%
* Under authority of the Bureau of Emergency Communications.
Recommendation 15: Adopt the response time goals listed above in Table 15. These are response time goals and would comply with NFPA standards.
STATIONS
Once response time and other goals have been set, the process of determining how many stations are needed and where to place them can begin. However, the setting of realistic goals requires an iterative process. One considers what is being achieved (actual response times today) and what it would take to improve them. The goals might be loosened if the cost to achieve them is too high. Unfortunately a major hole in the state of the act is the lack of knowledge of how much losses would be reduced if response times were improved by 30 seconds or a minute. We

Portland Fire and Rescue Chapter IV. Determining Resource Needs Service Delivery System Study
TriData, a Division of 67 March 2006 System Planning Corporation
know faster is better to reduce losses, but not how much money or injury reduction is to be gained. So the whole process depends on judgment in light to alternatives and their cost. This section looks at criteria for determining the number and location, size, and timing for stations.
Number and Location of Stations – How many stations a department needs to protect an area depends in large part on the size of the built-up area to be protected. The degree of sprinklerization (automatic sprinklers), automatic or mutual aid agreements, risks present, and type of developments to be protected all impact the placing of stations, but the sheer size of the area and speed limits on the street network are the prime factors, along with the desired response time goals. The latter are more a factor of standards and past experience than of risk, but risks to be protected influences placement of some stations.
Response time goals will have the largest impact on the number of stations needed. For example, if apparatus from a given station currently can get anywhere in an area within six minutes at 30 mph, and there were a perfect east-west, north-south street network, the area served by one station would be an 18-square-mile diamond-shaped area three miles in diameter from the center (station location) to any corner. If one wished to serve that same 18-square-mile area with a two-minute response, one would need nine stations instead of one because each station would be able to serve only two square miles.
In addition to goals, the road network plays a sizeable role in the number of stations required. A perfect grid-patterned road network allows for the largest area to be reached in a given time, assuming uniform travel speeds on all road segments. Access to high-speed roadways (interstates, limited-access highways, etc.) increases the reachable area; winding, narrow, steep roads and traffic calming devices decrease the area reachable in a given time.
INSURANCE SERVICES OFFICE: ISO awards points for distribution of apparatus (and by proxy for distribution of stations). ISO reviews the distribution of engine and ladder companies and awards points based partially on the percent of developed area within 1.5 miles of an engine company and 2.5 miles of a ladder. Quints can be used to obtain points toward number of engine companies needed and number of ladder companies needed. A quint can be counted as a full engine company and a half ladder company, or as a full ladder company.
Based on ISO’s formula, if PF&R engines and ladders are equipped to receive full credit for equipment needed based on ISO guidelines, the PF&R would need about one station for every 4.5 square miles, or 33 stations. This assumes perfectly placed stations and equipment so that all areas of the city were within 1.5 miles of a station with minimal overlap among stations. This also assumes a grid-patterned road network. Since the city is not square with a perfect grid-type road network, one or two additional stations might be needed to get full credit.
However, full credit for this section of the ISO rating is only 4 points out of 100, and could be exorbitantly expensive to implement (33 stations vs. 29 at present).

Portland Fire and Rescue Chapter IV. Determining Resource Needs Service Delivery System Study
TriData, a Division of 68 March 2006 System Planning Corporation
RESPONSE TIME ANALYSIS: The analysis of actual response times compared to response time goals and geographic information system (GIS) modeling of response coverage provides the most dynamic and accurate assessment of the need for additional or fewer stations.
To conduct a response time and GIS analysis, some basic information is needed, including but not limited to:
• Current station locations and building ages • Current apparatus deployment • Current zoning and land use and related policies • National response time standards • Current and projected population • Current and projected demand and workload • Actual incident data for the most recent year (and additional years if possible),
including address, type of incident, units responding, and overall response time for each incident.
• GIS layers for the area, including road network, water, station locations, risks, etc.
A response time analysis can help determine areas where an additional station may be needed. The GIS analysis confirms or refutes the need and allows decision-makers to see the impact of alternatives.
While this type of analysis is more location specific than a standard formula such as ISO, it is only as accurate as the data available. That is, if the incident data is incomplete or inaccurate, it is difficult to assess how the department is doing compared to the adopted goals. This type of analysis is also less prescriptive than the ISO standard, and more subjective; however, it can be tailored to a specific department or even specific area served by a department. Therefore, even with the possible data issues, a response time and GIS analysis provides a more realistic assessment of the number and placement of fire stations.
A response time and GIS analysis was completed for PF&R and is discussed in Chapter V, Station and Apparatus Deployment.
INTERJURISDICTIONAL COMPARISON: Another input to determining the number of stations needed is to look at other departments. Two measures of station coverage are the square miles protected per fire station and the number of citizens protected per station. In an urban setting with high population densities, stations will be closer together than in rural and suburban areas and thus will protect fewer square miles but more people. The average area served per station, therefore, is an indirect measure of the level of service, since the area served is related to response times. Less area per station generally results in lower response times, though not always since street layouts impact travel time to a large degree.

Portland Fire and Rescue Chapter IV. Determining Resource Needs Service Delivery System Study
TriData, a Division of 69 March 2006 System Planning Corporation
Portland’s 5.3 square miles per station is slightly above the ISO ideal of 4.5 square miles and very close to the real-world average of the comparison group. The number of square miles per station ranged from 2.4 in Long Beach to a high of 9.2 in Kansas City.
Table 16: Square Miles Per Station
Jurisdictions
Land Area (Square Miles)
protected Fire
Stations
Square Miles/
Station Kansas City, MO 314 34 9.2 Charlotte, NC 281 37 7.6 Sacramento, CA 144 22 6.5 Portland, OR 150 29 5.2 Denver, CO 153 30 5.1 Cincinnati, OH 77 26 3.0 Seattle, WA 84 34 2.5 Long Beach, CA 55 23 2.4 Average 157 29 5.3
The population per station is a proxy for demand, and a rough indicator of productivity. More people per square mile generally implies higher risks (e.g., more high-rises, building closer together). The population per station is based on the resident population protected; it does not include visitors or non-resident workers.
There are approximately 19,179 people protected per station in Portland, 10 percent above average for the comparison group. Though the city’s overall population density is slightly below that of the group. That is, Portland serves more population per station and in that way is more efficient than others—if the quality of service were the same.
Table 17: Population per Station
Jurisdictions Population
served Fire
Stations
Pop/ Square
Mile Pop/
Station Sacramento, CA 463,760 22 3,221 21,080 Long Beach, CA 475,460 23 8,645 20,672 Portland, OR 556,202 29 3,720 19,179 Denver, CO 557,478 30 3,644 18,583 Seattle, WA 563,400 34 6,715 16,571 Charlotte, NC 600,000 37 2,139 16,216 Kansas City, MO 442,768 34 1,412 13,023 Cincinnati, OH 330,000 26 4,275 12,692 Average 498,634 29 4,221 17,252

Portland Fire and Rescue Chapter IV. Determining Resource Needs Service Delivery System Study
TriData, a Division of 70 March 2006 System Planning Corporation
Determining Station Size – Once the decision to add, consolidate, or rebuild a station has been made and the site(s) selected, the process moves on to determining the size of each station—how many units and people should it be designed to house?
While an architect will work with the department to determine the exact size and layout of a new station, there are some basic factors a department should consider from the beginning:
• How many units will need to be housed at the station during its lifetime? (Apparatus bays typically make up the largest portion of a fire station.)
• How many personnel will staff the units? • What facilities will they need (sleeping quarters, parking, fitness facilities, etc.)? • Will additional units and personnel need to be housed at the station in the foreseeable
future? • How many offices do we need? • Do we want a community space for the public? • How big are the available lots in the area the station will go?
Although not done as part of this study, comparisons can be made with other departments and the size of their stations to get an idea of how much space will be needed.
Determining Timing and a Capital Improvement Plan – This section describes methodology for creating a timeline for the relocation, closure, and construction of fire stations. It also presents criteria and models for making decisions about the timing of capital improvements.
METHODOLOGY FOR PRIORITIZING FIRE STATION CAPITAL IMPROVEMENTS: There are several questions that need to be answered before deciding on the priority of a new station, or one which is considered for upgrade.
CURRENT SERVICE LEVELS – How large is the current service deficiency? How fast are calls being handled in that area? How many calls would a new station in that area handle? To what extent would the addition of a station in that area correct the deficiency?
Future Service Levels – If there is no current deficiency, when will there be a service deficiency in the area in the future? Is the deficiency a function of response times, workload, or both?
Cost of Alternative Solutions – What alternatives to building a station exist in the area, e.g., expanding/renovating the current station, redeployment of current resources, contracting out, or co-location of a fire/EMS resource with the other service or adding a new unit

Portland Fire and Rescue Chapter IV. Determining Resource Needs Service Delivery System Study
TriData, a Division of 71 March 2006 System Planning Corporation
to an existing station (which is recommended, as will be seen)?32 What are the costs and benefits of each option?
The flowchart in Figure 18 details the methodology described above.
When prioritizing repairs or renovations, an initial screening should be done to determine the long-term viability of the facility. It is important to know whether the facility will be useful from a system-wide operational standpoint beyond its expected useful lifecycle. If a facility will be unnecessary from a service delivery viewpoint before it would need replacement or major renovation, then it is not worth doing much repair work to it. That is, if the station will need only minor repairs for the next five years but major renovation in six years but the station will not be needed after three years because a new one will be opening up down the road, then it does not make sense to make major repairs or renovations to the building.
32 For example, Station 45 is currently staffed seven months out of the year by PF&R and five months by Gresham Fire Department.

Portland Fire and Rescue Chapter IV. Determining Resource Needs Service Delivery System Study
TriData, a Division of 72 March 2006 System Planning Corporation
Figure 18: Capital Improvements Prioritization Methodology
When willthere be a service
deficiency?
START
How large isthe current service
deficiency?
How fast are calls being handled
in that area?
To what extent would a newstation correct the
problem?
How many callswould a new
station handle?
Are there alternatives to
building a station?
Medium/Large
Below service level targets
A Lot/Some
500-1000 per year
Low Priority
No Priority
Low Priority
Medium Priority
Medium Priority
High Priority
None now Small
None foreseeable
Within 15 years
Are therealternativesto building a
station?
Yes
1000+per year
No
No Yes
Not much
With service target levels
Below 500per year
Within 7 years
The next consideration is how long it will take to provide a suitable replacement if one is needed. If a station needs to be relocated, how long will it be before the replacement station is ready for occupancy? It may be appropriate to only make temporary or relatively minor repairs

Portland Fire and Rescue Chapter IV. Determining Resource Needs Service Delivery System Study
TriData, a Division of 73 March 2006 System Planning Corporation
until the move to the new station is completed. If the delay in opening a new station is going to be lengthy, more of the necessary repairs should be made in the interim.
Feasibility of Consolidating/Closing Stations – A methodology similar to prioritizing the need for a new station can be applied to determining the feasibility of consolidating or closing existing stations. This methodology is depicted in Figure 19.
A few notes on terminology in this methodology: to close a station is to discontinue using the station as a base for operations of fire or EMS apparatus and take the units at that station out of service. Closed stations result in empty buildings that can be converted to other uses, if desired, rather than destroyed. Units taken out of service can be used as reserve apparatus, or to replace older apparatus elsewhere in the area.
To consolidate a station in this case is to discontinue using one or more buildings but to continue operating all units from the stations being consolidated. A consolidation may result in a new building if both stations being consolidated are in need of major repairs, if neither building is large enough to hold the necessary apparatus, or if a new single location would provide better response coverage than either existing location.
APPARATUS
Number and Location of Apparatus – Unless a department considers alternative deployment methods such as system status management—used primarily in EMS—apparatus locations will be determined in conjunction with stations. The number and type of units, on the other hand, is determined by demand and response goals.
BASED ON RISKS: Just as the location of apparatus is tied together with the location of stations, the number of apparatus required based on risk is tied to the staffing of those units. Apparatus and personnel response complements based on risk level are discussed below in the section on staffing.
NATIONAL STANDARDS: Aside from the response complement based on risk levels, the NFPA does not make recommendations on the number of front-line apparatus a department should have. The NFPA does, however, make recommendations on the number of reserve apparatus.
The NFPA also offers a suggested ratio of eight to one in terms of front-line to reserve engine and ladder apparatus. ISO recommends a ratio of reserve to front-line apparatus of either 1:4 or 1:3, depending on the type of apparatus and the frequency with which it is used.

Portland Fire and Rescue Chapter IV. Determining Resource Needs Service Delivery System Study
TriData, a Division of 74 March 2006 System Planning Corporation
Figure 19: Consolidation/Closure Feasibility Methodology
START
How much overlap exists in current
station/unit coverage(based on
response timegoals)?
Are travel timegoals actually
being met?
How many callswould a new
station handle?
50%+
Yes
Should notConsider<50%
Would travel timeand other service
level goals stillbe met?
High
No
Low toModerate
Collectmore data
Do Not Closeor Consolidate*
Would service level goals stillbe met if the
station is closedand the unit(s)removed from
service?
Would unitworkloads continueto be acceptable?
Yes
Yes Yes
* Rarely stations can be consolidated when unit workloads are high. Units with high
workloads cannot be eliminated.
Consolidate unitsat a current or
new station
No
Consolidate unitsat a current or
new station

Portland Fire and Rescue Chapter IV. Determining Resource Needs Service Delivery System Study
TriData, a Division of 75 March 2006 System Planning Corporation
WORKLOADS: Determining how busy units are is important for establishing their availability for the next call and because it provides insight on how much capacity various units have to handle more work, or whether additional units are needed. One needs to consider both the number of calls (demand) and the time spent on calls (workload) (number of calls x average time per call)—the unit’s workload. (Workload here is emergency workload only, not all the training and other tasks undertaken at the station, nor the paperwork for calls.)
Through CAD systems, fire departments are able to keep detailed records about service times; these data are useful in determining the availability of a specific unit or station. Again, the concept of workload is not merely a count of how many calls to which a unit was dispatched. One unit can have fewer responses than another but remains on the scene longer on average (e.g. more working incidents), and so has a greater workload. Evaluating workload is important when looking at the overlaps in coverage to an area that may be required to achieve the response time goals adopted by the city/department and is part of the CFAI self-assessment process. An analysis of workload also can indicate whether a new station should be built or new apparatus purchased—or if current stations should be closed or units moved.
A fire/EMS system must incorporate the necessary redundancies based on whether adjacent stations or units are likely to be available for emergency response. Below are guidelines developed by TriData that outline the redundancy levels needed to meet response time goals according to response levels and are based on our experience with workloads and how they affect availability.
1. Very Low (<500 responses/yr) – Simultaneous calls are infrequent and unit availability usually is assured. Stations/units can be spaced at the maximum distance possible to achieve stated travel time objectives established by the community.
2. Low (500-999 responses/yr) – Few calls will overlap and unit availability usually is assured. Stations/units can be spaced at the maximum distance possible to achieve stated travel time objectives established by the community.
3. Moderate (1,000-1,999 responses/yr) – Some overlap of calls will occur, usually at peak demand periods; however, stations/units are usually available. Stations/units must be located with marginal overlap to achieve stated travel time objectives established by the community.
4. High (2,000-2,999 responses/yr) – Additional overlap of calls will likely occur; however, stations/units will probably be available for emergency response. Stations/units must be located with significant overlap to achieve stated travel time objectives established by the community. This footprint usually achieves the best results in terms of

Portland Fire and Rescue Chapter IV. Determining Resource Needs Service Delivery System Study
TriData, a Division of 76 March 2006 System Planning Corporation
cost efficiency and effectiveness of service delivery. (Overlap can be achieved with additional stations or additional units in existing stations.)
5. Very High (3,000-3,999 responses/yr) – Overlapping calls occur daily, usually during peak demand periods, and working incidents are frequent. The closest station/unit may not be available, thus requiring the response of adjacent stations/units. Stations/units must be located with the significant overlap to achieve stated travel time objectives established by the community. (Overlap can be achieved with additional stations or additional units in existing stations.)
6. Extremely High (>4,000 responses/yr) – Overlapping calls may occur hourly, regardless of the time of day. The closest station/unit is likely to be unavailable thus requiring the response of adjacent stations/units. Frequent transfers or move-ups are required for the delivery system to meet demand. Stations/units must be located with redundancy (back-up units) to achieve stated travel time objectives established by the community. This footprint is usually found in very densely populated urban areas and is especially evident in EMS services located in urban areas with very high demand for service. (Overlap can be achieved with additional stations or additional units in existing stations.)
The 3,000–3,200 response level (very high category above) is the point at which units are often considered “busy” and their availability needs to be evaluated. This is a rough rule of thumb, not a fixed standard. At this point, response times often will begin getting longer from frequent call overlap (calls to the same first-due area arriving back-to-back).33 As units become busier, the chances for overlap or simultaneous alarms increase, and second-due units begin to answer more calls. This causes a domino effect where unit B is dispatched to a call in unit A’s area because unit A is already engaged, causing unit B to be unavailable for the next call in its own area. Unit C must then respond to unit B or unit A’s area, and so forth.
Again, the 3,000-response threshold is just a rule of thumb. How much time a unit is unavailable due to being involved with another incident is better assessment of the impact of workloads on availability and response times. This is the second factor in workload, known as unit hour utilization (UHU).
UNIT HOUR UTILIZATION: UHU is a calculation that estimates the amount of time a unit is occupied on emergency calls as a percentage of the total amount of hours a unit is staffed and
33 A “first-due” ‘area is a certain geographic area of the overall fire department response jurisdiction that is assigned to a particular fire station and the units that are assigned to them. Generally, it is best to dispatch the closest unit or company to any particular type of incident. Companies may be assigned to incidents outside of their first-due area, such as a second-due area, as the need arises because of the normal first-due unit being out-of-service or other circumstances. Corpus Christi currently uses automatic vehicle locators to dispatch the closest units.

Portland Fire and Rescue Chapter IV. Determining Resource Needs Service Delivery System Study
TriData, a Division of 77 March 2006 System Planning Corporation
available for response (a unit staffed full-time is available 8,760 hours per year). In other words, UHU measures the percentage of on-duty time consumed by emergency service field activities. A high UHU means lower availability for calls. Poor availability negatively impacts response times.
The specific formula used to calculate the UHU for each unit is:
(number of calls) x (average call duration in hours) UHU= 8,760 hours per year
UHU measures the percent of a unit’s time in service that is spent running calls. There is other time that is not accounted for, however, which includes time for training, maintenance, and other preparedness-related functions. Public education efforts also are not included in the UHU calculation. In other words, when units are not engaged in emergency response, it does not mean they are not working.
UHU is used more in relation to EMS units than fire suppression units; although, evaluation of UHUs is useful to different extents in both cases.
While there is consensus within the industry on the importance of utilization rates and how to measure them, the interpretation of how indicative utilization rates are of overall system efficiency is debatable. Most believe that a UHU between 35 and 45 percent for EMS is good for economic efficiency. (This is more common with private ambulance providers.) If a UHU is greater than 45 percent, units often are not available and response times suffer. If a UHU is below 35 percent, units may not be well utilized, but response times may be high too often. Many communities choose to aim for a UHU in the 15 to 25 percent range to improve or maintain good response times. If a unit has a UHU of 40 percent, it will not be available for the next call 40 percent of the time. This is, of course, an average over the course of the day.
There are no guidelines on UHU levels for fire units; however, many larger departments recently evaluated by TriData experience engine and truck UHUs between five and 15 percent. If a unit is out of its station on a call more than 10 percent of the time, then it is unlikely to meet response time goals of 90 percent of calls in four minute travel times, since a second further away station will have to respond. Thus UHU of 5.15 percent is consistent with a goal of being there about 90 percent of the time.
In order to develop an effective resource deployment plan, units must be available to respond to incidents most of the time. No amount of resource placement planning will improve systemwide response times if the responding units are not available.
REPLACEMENT SCORING SYSTEM: Some fire departments (primarily on the East Coast) use a scoring system developed by the American Public Works Association Fleet Service

Portland Fire and Rescue Chapter IV. Determining Resource Needs Service Delivery System Study
TriData, a Division of 78 March 2006 System Planning Corporation
Committee for assessing fire apparatus for replacement, or a scoring system similar to it.34 Examples of its use may be found in Chesapeake, Hampton, Newport News, Virginia Beach, and York County, Virginia. The scoring system considers the variables of age, mileage, maintenance costs, and operating conditions. A replacement score is calculated for each vehicle based on the sum of its scores for age, usage, and condition. Data for the calculations usually are obtained from computerized vehicle maintenance records and work orders.
The age of the vehicle is scored by assigning one point for each month beyond the date on which it was purchased. The usage score assigns one point for each 1,000 miles traveled or 3.5 points for each 100 hours of use, whichever is higher. The condition of the vehicle is scored on a scale of zero, two, or four for each aspect, in accordance with criteria for each of the categories, including the body, interior, installed functional apparatus, maintenance/repair cost, and mission. The sum of the scores for each category is then multiplied by a factor of 12 to obtain the overall vehicle score. If the overall score exceeds the point limit established for the respective vehicle category, the vehicle is recommended for replacement or disposal. The categories and associated maximum scores are listed in Table 18. Other factors such as vehicle downtime can be included in such a system.
The critical component in any service-life-assessment system is the absolute requirement that a vehicle must be able to safely and reliably perform in a manner consistent with the vehicle’s designated purpose, regardless of mileage or hours of use.
Table 18: Maximum Vehicle Points Before Disposal/Replacement is Recommended (APWA System)
Vehicle Category Maximum Vehicle
Points Sedans, station wagons, and jeeps 162 Heavy duty trucks and towed equipment 192 Special purpose equipment such as boats and trailers 192 Light-duty trucks 196 Medium- to heavy-duty trucks (including ambulances) 220 Fire apparatus 225
Specifications – Finally, once the number and type of apparatus and replacement programs are determined, the department must develop specifications for each piece of apparatus.
APPLICABLE STANDARDS FOR FIRE APPARATUS: There are several federal regulations, fire service consensus standards, and fire insurance standards that have influenced the design of modern fire apparatus. The federal standards include requirements mandated by the National Traffic and Motor Vehicle Safety Act and the Clean Air Act. The fire service consensus 34 American Public Works Association (2003). Fleet Service Committee. http://www.apwa.net

Portland Fire and Rescue Chapter IV. Determining Resource Needs Service Delivery System Study
TriData, a Division of 79 March 2006 System Planning Corporation
standards consist of NFPA Standards 1201, 1500, and 1901. The fire insurance standard is that developed by the ISO, while the CFAI also has references to fire apparatus design and procurement in their assessment manual.
National Traffic and Motor Vehicle Safety Act of 1966: This Act mandated that all manufacturers adhere to specific safety standards when designing and constructing motor vehicles. The Clean Air Act has emission control standards that affect engine performance, which led to incorporation of electronic controls on diesel engines.
National Fire Protection Association Standard 1201, Developing Fire Protection Services for the Public (1994): This standard includes sections on procurement and maintenance of fire apparatus. They require (a) inventory control of all fire apparatus and equipment owned and operated by a fire department; (b) implementation of forecasting methods to project apparatus service-life expectancies and replacement needs; (c) development of written fire apparatus bid specifications in accordance with NFPA standards; (d) implementation of routine inspection and preventive maintenance programs; and (e) implementation of service testing for fire pumpers and aerial devices.
National Fire Protection Association Standard 1500, Fire Department Occupational Safety and Health Program (1992): Chapter 4, Vehicles and Equipment, addresses (a) fire apparatus design requirements; (b) training and certification of fire apparatus operators: (c) safe driving and operating practices for fire apparatus; (d) safety practices for firefighters riding fire apparatus; and (e) regular inspection and preventive maintenance and repair of fire apparatus.
National Fire Protection Association Standard 1901, Automotive Fire Apparatus (1996): This standard outlines design requirements for (a) pumper fire apparatus; (b) initial attack fire apparatus; (c) mobile water supply fire apparatus; (d) aerial fire apparatus; (e) special service fire apparatus; (f) chassis and vehicle components; (g) low voltage electrical systems and warning devices; (h) driving and crew areas; (i) body, compartments, and equipment mounting; (j) fire pump and associated equipment; (k) water transfer pump and associated equipment; (l) water tanks; (m) aerial devices; (n) foam proportioning systems; (o) compressed air foam systems; (p) line voltage electrical system; (q) command and communications; (r) air systems; and (s) winches.
Insurance Services Office: ISO rates the capabilities of local fire departments to respond to and suppress fires. The ISO Fire Suppression Rating Schedule (FSRS) rates the fire defenses according to fire flow capabilities, fire department resources, and water supply. Fire departments are classified on a scale of 1 (highest) to 10 (lowest), based on the sum of ratings received for each criterion. Insurance underwriters often base fire insurance rates on the ISO class of the local jurisdiction. The ISO ratings vary from area to area in the county.
Requirements for fire apparatus are addressed in the ISO fire department resources criterion. Based on the results of Basic Fire Flow calculations, one computes the minimum

Portland Fire and Rescue Chapter IV. Determining Resource Needs Service Delivery System Study
TriData, a Division of 80 March 2006 System Planning Corporation
number of engine companies and pump capacities needed to meet estimated fire suppression requirements. Depending on the total number of buildings that are at least three stories or 35 feet in height, the need for ladder or service companies is also determined.
Commission on Fire Accreditation International (CFAI): Assessment Manual, Chapter VI, Physical Resources, Criterion 6B, apparatus and resources says that “Rating for this criterion is based on the performance indicators of (a) apparatus location in accordance with established standards of coverage for the community; (b) appropriateness of apparatus types for services provided; (c) existence of an apparatus replacement schedule; and (d) existence of a program for writing apparatus replacement specifications so that fire apparatus are designed and purchased to be adequate to meet the agency’s goal and objectives.”
PERFORMANCE SPECIFICATIONS: Performance specification is the process of stating the requirements for apparatus procurement in terms of what the vehicles do rather than the way to get there. Most, if not all, apparatus manufacturers today indicate that if the purchaser specifies performance requirements rather than requirements for specific components, the manufacturer can engineer the apparatus to conform. For example, if the department were to specify a 1,250 gpm pumper and its road performance requirements, the manufacturer would figure out the appropriate engine, transmission, and the driveline combination to accomplish the goal. The manufacturer would ensure that the horsepower and torque provided would be sufficient to meet the needs of the apparatus. This in turn would save the department money and time by eliminating unnecessary over-sizing of the engine and related equipment for the apparatus.
In using performance-based specifications, consideration must be given to how the configuration will perform as it ages, after routine wear of the apparatus. In other words, one needs to state how long the vehicle is expected to last and still provide the desired performance.
Perhaps the most desirable specification combines a performance specifications format with a general design format (e.g., four doors, bench seat). Including minimum performance standards in the specification for various components and systems is a good way to ensure proper performance.35, 36, 37
Complement Based on Risk – The number of firefighters needed per engine or truck (ladder) company is a subject of hot debate in the fire world. The NFPA has much influence in this area as well. The fundamental issues in determining unit staffing include:
• The ability to start operations with the first arriving unit;
35 Senter, Edward L. (1998, July). Evaluating Fire Apparatus Design Changes in the Norfolk Department of Fire and Paramedical Services. Emmitsburg, MD: National Fire Academy, Executive Fire Officer Program. 36 Norfolk Fire and Paramedical Services. (1993). Vehicle study. Norfolk, VA. 37 Capital Safety Systems. (1991). Calvert County, Maryland Emergency Apparatus Assessment & Analysis, Calvert County, MD

Portland Fire and Rescue Chapter IV. Determining Resource Needs Service Delivery System Study
TriData, a Division of 81 March 2006 System Planning Corporation
• The ability to rapidly amass critical staffing for incidents of various sizes and types of hazards;
• Firefighter safety, and; • Productivity of a unit and the system of units.
Like several metro fire departments nationwide, Portland considers minimum staffing for its fire apparatus to be four personnel. This minimum staffing level is at the level specified in NFPA standards. NFPA Standard 1500, Fire Department Occupational Safety and Health Program says that “…a minimum acceptable fire company staffing level should be four members responding or arriving with each engine and each ladder company responding to any type of fire.” NFPA 1710 also suggests that fire suppression units be staffed with a minimum of four personnel.
While the staffing of the unit affects its efficiency, a more important criterion is how fast the total team can be assembled for a given incident regardless of the number of vehicles on which they ride. The National Fire Protection Handbook, 19th Edition, Typical Initial Attack Response Capability Assuming Interior Attack and Operations Response Capability (Table 7.2.1), makes staffing recommendations based on the number of firefighters arriving on the scene of a fire depending upon the type of occupancy (low-, medium-, and high-hazard occupancy). The NFPA staffing recommendations by the type of hazard areas follows:
HIGH-HAZARD OCCUPANCIES (schools, hospitals, nursing homes, explosive plants, refineries, high-rise buildings, and other high-risk or large fire potential occupancies):
At least four pumpers, two ladder trucks (or combination apparatus with equivalent capabilities), two chief officers, and other specialized apparatus as may be needed to cope with the combustible involved; not fewer than 24 firefighters and two chief officers. Plus, there should be consideration of a safety officer and a rapid intervention team.
MEDIUM-HAZARD OCCUPANCIES (apartments, offices, mercantile and industrial occupancies not normally requiring extensive rescue or firefighting forces):
At least three pumpers, one ladder truck (or combination apparatus with equivalent capabilities), one chief officer, and other specialized apparatus as may be needed or available; not fewer than 16 firefighters and one chief officer, plus a safety officer and a rapid intervention team.
LOW-HAZARD OCCUPANCIES (one-, two-, or three-family dwellings and scattered small businesses and industrial occupancies):
At least two pumpers, one ladder truck (or combination apparatus with equivalent capabilities), one chief officer, and other specialized apparatus as may be needed or available; not fewer than 12 firefighters and one chief officer, plus a safety officer and a rapid intervention team.

Portland Fire and Rescue Chapter IV. Determining Resource Needs Service Delivery System Study
TriData, a Division of 82 March 2006 System Planning Corporation
The recommendations and guidelines outlined in the NFPA Handbook should be considered, but are not necessarily the final word as the NFPA guidelines do not address how fire departments will also be able to comply with the OSHA mandated “Two-in/Two-out” rule (discussed below). Also, the NFPA guidelines do not address OSHA’s requirement that a rapid intervention team/crew (RIT/RIC) be on-scene at a working fire. Depending on local staffing levels, the number of firefighters responding on various units may need to be increased by two or three from the levels outlined in NFPA’s guidelines if they are to meet OSHA regulations which are, in fact, legal requirements.
Table 19 shows the PF&R’s response complement to a structure fire based on risk versus the NFPA guidelines outlined above.
Table 19: PF&R Structure Fire Response Complement vs. NFPA Guidelines
Type of Occupancy
PF&R Response Complement
NFPA Guidelines
Corpus Christi, TX
Salt Lake City, UT
Cincinnati, OH
High-Hazard (High-rises in Portland)
7 Engines 2 Trucks 1 Squad 2 Bat. Chiefs
4 Engines 2 Trucks
3 Engines (3 or 4) 1 Truck (3 or 4) 1 Medic (2) 1 Rescue (4) 1 Light/Air (1)* 1 District Chief (1)
4 Engines (4) 2 Trucks (4) 1 Utility(1) 1 Bat. Chief
3 Engines (4) 2 Trucks (4) 1 Rescue (2) 2 District Chiefs 1 Squad (2)
40 FFs 2 Chief Officers
24 FFs 2 Chief Officers1 Safety Officer1 RIT Team
23–27 FFs 1 Chief Officer
25 FFs 1 Chief Officer
22 FFs 2 Chief Officers
Total 42 26–29 24-28 26 24
Medium-Hazard
4 Engines 2 Trucks 2 Chiefs
3 Engines 1 Ladder Truck
3 Engines (3 or 4) 1 Ladder (3 or 4) 1 Medic (2) 1 District Chief
3 Engines (4) 1 Truck (4) 1 Utility 1 Bat. Chief
2 Engines (4) 2 Trucks (4) 1 Rescue (2) 2 District Chiefs
24 FFs s 2 Chief Officers
16 FFs 1 Chief Officer 1 Safety Office 1 RIT Team
14-18 FFs 1 Chief Officer
17 FFs 1 Chief Officer
18 Firefighters 2 Chief Officers
Total 26 17–20 15-19 18 20
Low-Hazard 4 Engines 1 Truck 2 Chiefs
2 Engines 1 Truck
3 Engines (3 or 4) 1 Ladder (3 or 4) 1 Medic (2) 1 District Chief
2 Engines (4) 1 Truck (4)
2 Engines (4) 2 Trucks (4) 1 Rescue (2) 2 District Chiefs
20 FFs 2 Chief Officers
12 FFs 1 Chief Officer 1 Safety Officer 1 RIT Team
14–18 FFs 1 Chief Officer
12 FFs 18 FFs 2 Chief Officers
Total 22 13–16 15–19 12 20
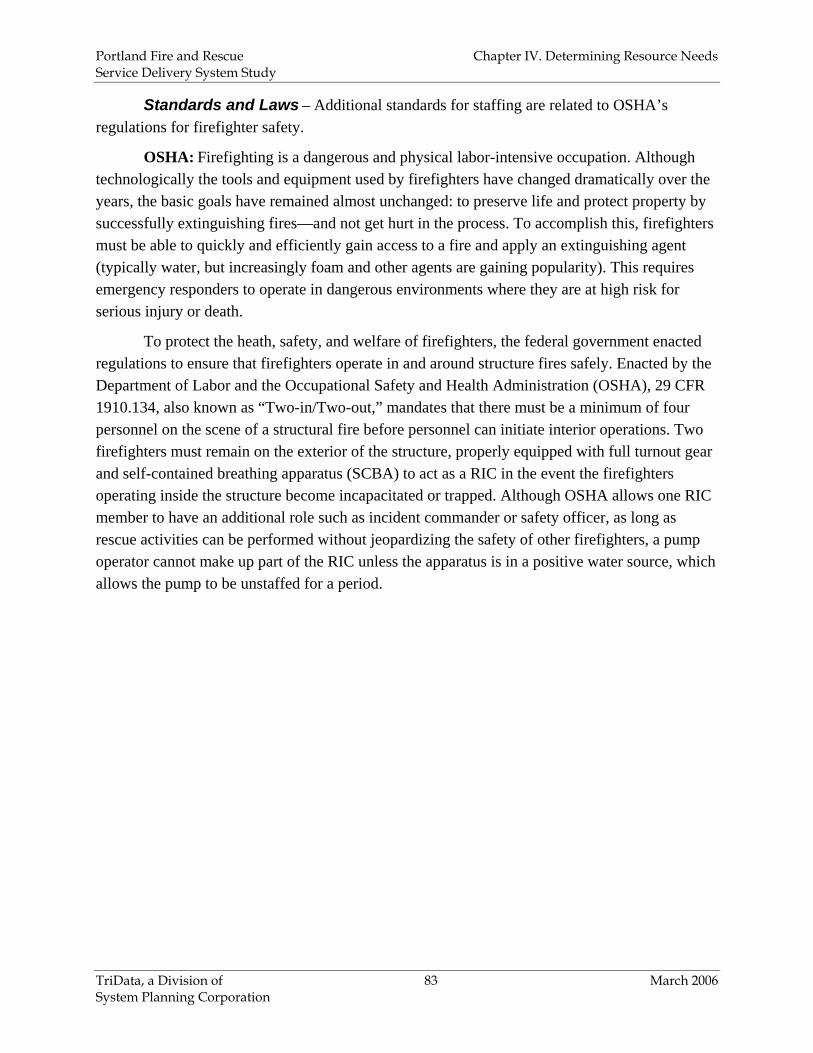
Portland Fire and Rescue Chapter IV. Determining Resource Needs Service Delivery System Study
TriData, a Division of 83 March 2006 System Planning Corporation
Standards and Laws – Additional standards for staffing are related to OSHA’s regulations for firefighter safety.
OSHA: Firefighting is a dangerous and physical labor-intensive occupation. Although technologically the tools and equipment used by firefighters have changed dramatically over the years, the basic goals have remained almost unchanged: to preserve life and protect property by successfully extinguishing fires—and not get hurt in the process. To accomplish this, firefighters must be able to quickly and efficiently gain access to a fire and apply an extinguishing agent (typically water, but increasingly foam and other agents are gaining popularity). This requires emergency responders to operate in dangerous environments where they are at high risk for serious injury or death.
To protect the heath, safety, and welfare of firefighters, the federal government enacted regulations to ensure that firefighters operate in and around structure fires safely. Enacted by the Department of Labor and the Occupational Safety and Health Administration (OSHA), 29 CFR 1910.134, also known as “Two-in/Two-out,” mandates that there must be a minimum of four personnel on the scene of a structural fire before personnel can initiate interior operations. Two firefighters must remain on the exterior of the structure, properly equipped with full turnout gear and self-contained breathing apparatus (SCBA) to act as a RIC in the event the firefighters operating inside the structure become incapacitated or trapped. Although OSHA allows one RIC member to have an additional role such as incident commander or safety officer, as long as rescue activities can be performed without jeopardizing the safety of other firefighters, a pump operator cannot make up part of the RIC unless the apparatus is in a positive water source, which allows the pump to be unstaffed for a period.