itu a|z • vol 17 no 2 • july 2020 • 73-82 the
TRANSCRIPT

The investigation of carbon dioxide (CO2) and particulate matter (PM) quantities in higher education buildings
AbstractIndoor air quality is one of the fundamental requirements that must be ensured
for users of the buildings to be healthy and productive. As a result of poor indoor air quality, health problems could also arise in users. In educational buildings students spend most of their time in enclosed classrooms. Therefore, it is very im-portant that the indoor air quality meets the health and comfort conditions of the students. In this study, the indoor air quality (IAQ) conditions (CO2 and Partic-ulate Matter/PM) of two higher education buildings in Edirne, Faculty of Archi-tecture and Faculty of Engineering in Trakya University, were investigated. IAQ data were determined by measuring with the devices (Testo 480 for CO2 and TSI Dusttrack 8532 for PM) during the use of the classrooms in the winter months. The results of the measurement were analyzed, then the results were compared with the values given in the standards. The values obtained by CO2 and PM mea-surements are often found to be exceed the limit values determined by WHO and ASHRAE-62. In some cases, it has been observed that the CO2 value has increased up to 2500 ppm in the classrooms. For PM measurements, values were obtained in the range of 71-151 μg/m3 and where standard deviations varied between 6-34.
KeywordsCarbon dioxide, Educational buildings, Indoor air quality (IAQ), Particulate matter (PM).
Filiz UMAROĞULLARI1, Dinçer AYDIN2
1 [email protected] • Department of Architecture, Faculty of Architecture, Trakya University, Edirne, Turkey2 [email protected] • Department of Architecture, Faculty of Architecture, Trakya University, Edirne, Turkey
Received: February 2019 • Final Acceptance: January 2020
doi:
10.5
505/
itujfa
.202
0.09
475
ITU A|Z • Vol 17 No 2 • July 2020 • 73-82
ITU A|Z • Vol 17 No 2 • July 2020 • F. Umaroğulları, D. Aydın
74
1. IntroductionThe indoor comfort requirements
and indoor air quality are very im-portant for all buildings. However, this situation becomes more important for educational buildings due to consider children’s health. In order to be healthy and productive, proper comfort and indoor air quality conditions must be provided for students, who spend most of their time in closed classrooms. Most students spend 30% of their time in school and 70% in classrooms (Ka-limeri et al., 2016). The indoor comfort requirements are important factors on the cognitive processing speed and learning ability (Lee et al., 2012; Vilce-kova et al., 2017). The comfort require-ments include many subjects such as thermal comfort, indoor air quality, acoustics, and lighting. This study par-ticularly focuses on indoor air quality in educational buildings.
In indoor air quality, it is primarily essential that the oxygen adequacy is ensured and CO2 (carbon dioxide) and other pollutants (dust, carbon monox-ide, etc.) should not exceed the allowed upper limits. Pollutants could be clas-sified in different categories according to their source, phase, and effect. Pol-lutants might originate mainly from the external environment; some also might be originated from, the materi-als, hardware, furniture, cigarette, ac-tivity, chemical products used within the interior space and/or the building itself (Tham, 2016; Bari and Kindzier-ski, 2018). One of the most important environmental pollutants is CO2. The maximum admissible level of CO2 con-centration is 350 ppm (parts per mil-lion) in outdoor, 1000 ppm in indoor environments (Apte et al., 2000; Ab-dul-Wahab et al., 2015).
The amount of CO2 emission chang-es in accordance with the number of people and the activity in the environ-ment. Especially in crowded spaces the use of oxygen will be much high-er, and therefore the amount of CO2 in the environment will increase, and the indoor air quality will be adversely affected. Concurrently, physiological changes could also be observed in peo-ple (Hess-Kosa, 2011; Can et al., 2015; Lee et al., 2015; Madureira et al., 2015). The growing amount of pollutants in
the environment affects the users neg-atively and causes some health prob-lems. Therefore, the air in the environ-ment must be kept as clean as possible. The necessary level of oxygen in clean ideal air is 21%. This level should not fall below 19%, in a situation where the oxygen level drops below 15% health problems that cause permanent damage would occur (Peacock, 1998; WCBBC, 2008).
One of the other factors affecting the indoor air quality is the Particu-late Matter (PM). PMs, known also as aerosol, are small particles and/or droplets such as solid and liquid ac-ids that are suspended in air, organic chemicals, metals, earth, dust, soot or smoke (Amato et al., 2014; Moham-med et al., 2015; Yang et al., 2015). PM is measured in different sizes as PM10 (PM smaller than 10 μm in diameter) and PM2.5 (PM smaller than 2.5 μm in diameter). PM10 sources consist of smoke and dust from industrial plants, agricultural emissions and roads. On the other hand, PM2.5 is associated with volatile organic compounds (VOC), heavy metals, and traffic and for-est fires. In terms of its health effects, PM2.5 is more hazardous than PM10. As the particle diameter becomes smaller its adverse effect on health is increased (Mohammed et al., 2015; Datta et al., 2017; Bari and Kindzierski, 2018).
As well as living in a healthy envi-ronment, it is significant for children to receive education in a healthy environ-ment in order to get an efficient educa-tion. Thus, this study aims to evaluate indoor air quality, which is one of the parameters of indoor environmental quality for buildings, in educational buildings. In this context, two higher educational buildings belong to Trakya University (Faculty of Architecture and Faculty of Engineering) in Edirne are investigated as a case study in this re-search. To determine and analyze the indoor air quality of classrooms in the selected buildings, the amounts of CO2 and PM were measured. The measure-ments were carried out simultaneous-ly during winter months when class-rooms are used. The selection of the classrooms was made due to consider-ing different characteristics. The results obtained were examined comparative-

The investigation of carbon dioxide (CO2) and particulate matter (PM) quantities in higher education buildings
75
ly for the two buildings and also eval-uated based on the limit values in the literature.
2. Literature review
Recent studies on physical comfort in the literature emphasize the impor-tance of indoor air quality. The studies examine the different aspects of indoor air quality from the effects of indoor air quality on user health to its relationship with pollutant sources. Furthermore, it is seen that the related studies in the literature are conducted for buildings of different scales and functions and in this regard, educational buildings are among the priority buildings.
In indoor spaces of schools, students are exposed to many air pollutants. The effects of indoor environmental quality on the health and success of students were investigated by Turunen et al. (2014). In the scope of the research, survey and indoor air quality measure-ments were carried out in schools of Finland. According to the assessments in the research, it is asserted that nat-ural ventilation in schools is not suffi-cient on its own, and the physical con-ditions of the schools, materials that have been used, maintenance condi-tions also affect the indoor air quality. According to the data obtained by the survey, it has been found that students had health issues and in cases where the class presence is more than 15 peo-ple these health issues were increased (Turunen et al., 2014). Hreha (2007), in his doctorate thesis, investigated the effects of indoor air quality on the exam performance of the students. It is determined that, in a small space, because of the higher CO2 exposure, students have not been able to perform well compared to students who had been tested in a larger space. This study demonstrates that in larger spaces, the level of CO2 is significantly lower.
In the study that investigates the ef-fects of traffic load on PM mass con-centrations of indoor air in educational buildings, it was indicated that the high traffic intensity significantly increases the PM10 and PM2.5 mass concentra-tions (Lee et al., 2015; Shakya et al., 2017; Zhang et al., 2017).
According to the ASHRAE 62 (2007) “Ventilation for Acceptable Indoor Air
Quality” standard, a healthy indoor air quality is defined as, the air in which known pollutants are not to be at the level of harmful concentrations, which themselves determined by the qualified authorities, and that at least 80% of the people in this air should not be feeling any dissatisfaction with the quality of the air. ASHRAE 62-2001 standard recommends that the upper limit for clear outdoor air concentration should be around 300-400 ppm, while the in-door air concentration should be at most 700 ppm, the generally agreed margin is 1000 ppm (WHO, 1983). ASHRAE 62 and EPA (Environmental Protection Agency) state the average daily limit value of PM10 to be 150 μg/m3 (ASHRAE, 2007; TSI, 2011).
One of the important parameters for determining indoor air quality is the air quality of the environment of the building. To increase the indoor air quality, a sufficient amount of fresh air should be introduced to the indoor space. In old buildings, this require-ment was met due to the infiltration and the outside air was able to enter by natural ventilation. In the last 100 years, by the introduction of mechan-ical ventilation and curtain wall sys-tems, buildings become resembling a thermos. Furthermore, without the proper mechanical ventilation systems, this could even cause people’s deaths due to a lack of oxygen. In cases where there is a lot of outdoor pollution, nat-ural ventilation to improve the indoor air quality acts in the reverse direction, resulting in even worse air quality. For effective ventilation, the oxygen con-centration of the outdoor air must be high and the pollutant concentration must be low.
The efforts to reduce the energy losses in buildings resulted in a rise in the levels of building airtightness and a reduction in the transmission rates between the indoor-outdoor air, thus, degrading the indoor air quality. Inad-equate thermal resistance on sections of the building envelope results in low internal surface temperatures, causing unhealthy conditions such as chills, moulds on the interior surfaces (Saraf-is et al., 2010). Accompanying these is-sues, the term “Sick Building” emerges. Since 1983, the indoor environmental
ITU A|Z • Vol 17 No 2 • July 2020 • F. Umaroğulları, D. Aydın
76
issues experienced by the users were defined by the World Health Organiza-tion (WHO) as sick building syndrome (SBS) (WHO, 1983).
In the 21st century ‘green buildings’ become the main focus. Although en-ergy and resource conservation is of primary concern, healthy buildings have gained importance. And green buildings have begun to be synony-mous with healthy buildings. In con-nection with green buildings, product emission tests and green product cer-tificates come into prominence and, by 2009; standards were introduced on the indoor air quality for high-perfor-mance buildings. “The indoor air qual-ity” occupies an important place inside the green building certificate systems. For example, in the American LEED certification, The Indoor Air Quali-ty Management Plan is considered to achieve a minimum score of 6 points in a 21-point evaluation (Hess-Kosa, 2011).
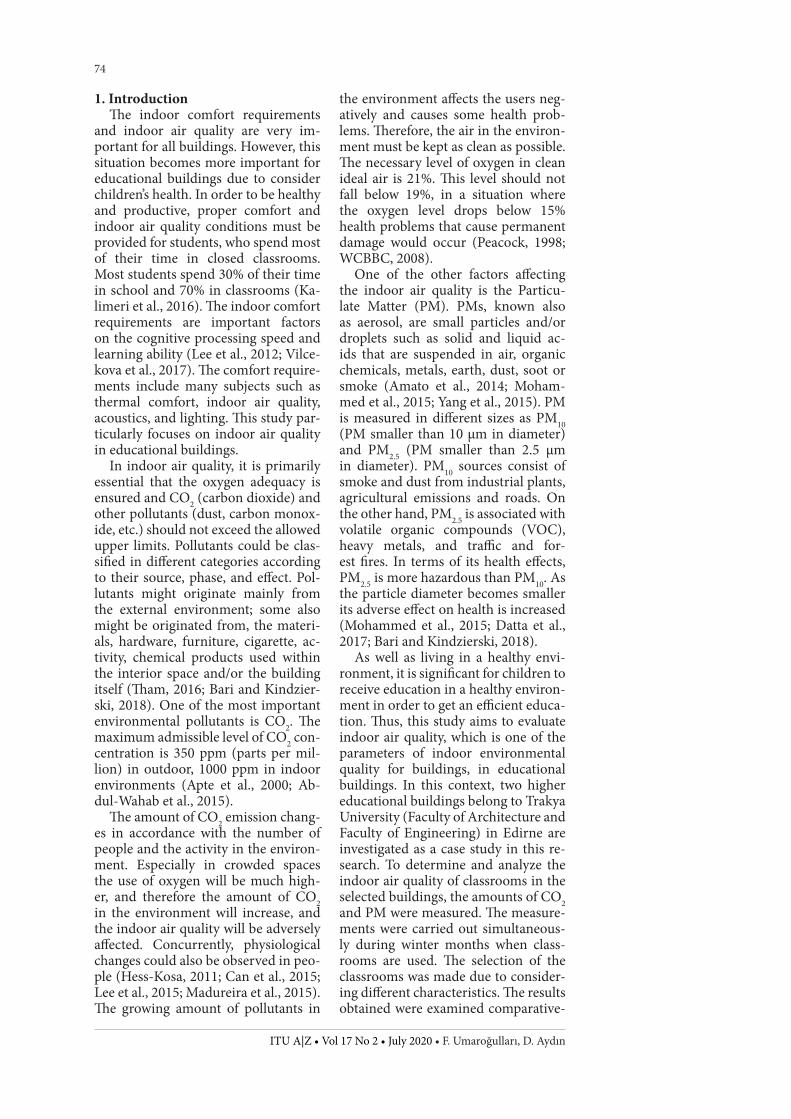
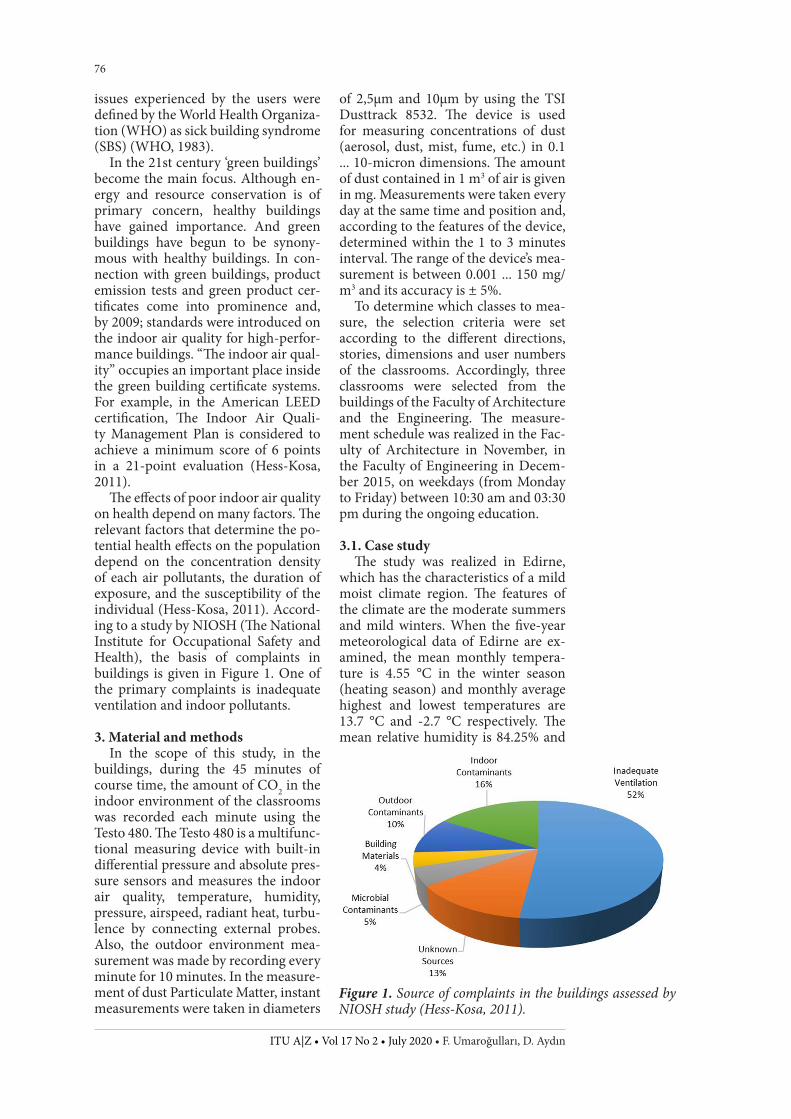
The effects of poor indoor air quality on health depend on many factors. The relevant factors that determine the po-tential health effects on the population depend on the concentration density of each air pollutants, the duration of exposure, and the susceptibility of the individual (Hess-Kosa, 2011). Accord-ing to a study by NIOSH (The National Institute for Occupational Safety and Health), the basis of complaints in buildings is given in Figure 1. One of the primary complaints is inadequate ventilation and indoor pollutants.
3. Material and methods
In the scope of this study, in the buildings, during the 45 minutes of course time, the amount of CO2 in the indoor environment of the classrooms was recorded each minute using the Testo 480. The Testo 480 is a multifunc-tional measuring device with built-in differential pressure and absolute pres-sure sensors and measures the indoor air quality, temperature, humidity, pressure, airspeed, radiant heat, turbu-lence by connecting external probes. Also, the outdoor environment mea-surement was made by recording every minute for 10 minutes. In the measure-ment of dust Particulate Matter, instant measurements were taken in diameters
of 2,5μm and 10μm by using the TSI Dusttrack 8532. The device is used for measuring concentrations of dust (aerosol, dust, mist, fume, etc.) in 0.1 ... 10-micron dimensions. The amount of dust contained in 1 m3 of air is given in mg. Measurements were taken every day at the same time and position and, according to the features of the device, determined within the 1 to 3 minutes interval. The range of the device’s mea-surement is between 0.001 ... 150 mg/m3 and its accuracy is ± 5%.
To determine which classes to mea-sure, the selection criteria were set according to the different directions, stories, dimensions and user numbers of the classrooms. Accordingly, three classrooms were selected from the buildings of the Faculty of Architecture and the Engineering. The measure-ment schedule was realized in the Fac-ulty of Architecture in November, in the Faculty of Engineering in Decem-ber 2015, on weekdays (from Monday to Friday) between 10:30 am and 03:30 pm during the ongoing education.
3.1. Case study
The study was realized in Edirne, which has the characteristics of a mild moist climate region. The features of the climate are the moderate summers and mild winters. When the five-year meteorological data of Edirne are ex-amined, the mean monthly tempera-ture is 4.55 °C in the winter season (heating season) and monthly average highest and lowest temperatures are 13.7 °C and -2.7 °C respectively. The mean relative humidity is 84.25% and
Figure 1. Source of complaints in the buildings assessed by NIOSH study (Hess-Kosa, 2011).

The investigation of carbon dioxide (CO2) and particulate matter (PM) quantities in higher education buildings
77
the highest and lowest values of month-ly average are 91.6% and 72.1%. While the highest wind speed is 2.4 m/s, the lowest wind speed is 1.6 m/s and the mean wind speed is also 2.03 m/s in Edirne (TSMS, 2015). Furthermore, it is seen that PM values (PM10) in the atmosphere of Edirne changes between 32.57 and 116.71 µg/m3 (Güler and İşçi, 2016).
The construction elements (roof, window, wall, floor, etc.) and their properties which form the building envelope were determined by acquir-
ing drawings and documents about the settlement, location, plan, and sec-tions of the educational buildings. The locations of the buildings within the city are shown in Figure 2. The Faculty of Architecture building is located in the city center and was constructed in 1871 as masonry while the Faculty of Engineering is located at the intersec-tion of City Bus Terminal and the belt highway outside the city center and was built on reinforced concrete (RC) frame system.
During the wintertime, a central gas heating system is used in both build-ings. Through the summer conditions, no air conditioning system is used. The buildings are ventilated naturally. The characteristics of the classrooms in which the measurements were done are given in Table 1. Figure 3 and Fig-ure 4 show the indoor environment of the classrooms.
4. Results and discussion
The results of the surveyed class-rooms of the two higher education buildings are given in the graphs and tables below. The measurements were done initially in the Faculty of Archi-tecture then in the Faculty of Engineer-ing. The numbers of measurements in the faculties are different from one another. However, to be able to eval-uate both of the faculties together, 10 measurements for each classroom were provided within the scope of this study.
The relation between the number of users, the indoor air temperature, the amount of CO2 and the relative humid-ity in the classrooms of the Faculty of Engineering and the Faculty of Archi-tecture are shown in Figure 5. Class-rooms of the Faculty of Engineering provide thermal comfort conditions in D102 and D206 when evaluated in terms of temperature and relative hu-midity. In the L304, these values were obtained at minimum comfort lim-it values (Figure 5). Although both the D206 and L304 classrooms have a north-facing facade, the L304 class-room has two facades (north and west), which makes this classroom more disadvantageous. The results for the measurement of CO2 in the class-rooms D102 and D206 of the Faculty of Engineering are often above the 1000
Table 1. The characteristics of the classrooms in the buildings.
Figure 2. The location of the Faculty of Architecture and the Faculty of Engineering inside the city center.
Figure 3. The classrooms in the Faculty of Architecture.

ITU A|Z • Vol 17 No 2 • July 2020 • F. Umaroğulları, D. Aydın
78
ppm limit. The classrooms’ volume is very close to each other in the Faculty of Engineering. Therefore, the great-est impact on the amount of CO2 dif-ference is due to the number of users. Thus, in L304, all of the measurements taken exceed the 1000 ppm limit and the average is in the range of 2000-2500 ppm (Figure 5) because of the high oc-cupancy ratio.
The temperature and relative humid-ity values at the Faculty of Architec-ture show that all three classes (A104, A201 and D204) provide almost the same comfort conditions (Figure 5). When the classrooms in the Faculty of Architecture are compared, it is seen that the highest CO2 concentration is in the A104 although the A201 has the highest occupancy ratio (Figure 5). It can be said that the spatial dimension of A201 leads to this situation (Table 1). Due to the increased volume, it was found that the CO2 concentration did not increase at the same rate within the increase in the number of users. The CO2 measurements in the Faculty of Architecture also determined that the 1000 ppm limit was exceeded. How-ever, the maximum exceeding values were recorded in A104. The average measurements range between 1000-1500 ppm (Table 2).
In both buildings, changes in the measurements are generally linked to the number of users. When the num-ber of users increases, the amount of CO2 is also seen to increase apart from A201. However, in all circumstances, the amounts of CO2 in the classrooms of the Faculty of Engineering are higher comparing to the Faculty of Architec-ture. Although the Faculty of Architec-ture classrooms, which have the fea-tures of masonry building system, are close in areas to the classrooms of the Faculty of Engineering, they are quite different in volume due to their floor heights (Table 1). When the measure-ments for the classrooms with similar volumes but different areas were exam-ined in two buildings, it is seen that the average number of users in Architec-ture D204 is 20 while in Engineering L304, it is 50. While the average CO2 measurement for Architecture D204 is 980 ppm and for Engineering L304 it is 2500 ppm. This clearly shows the effect of the number of users in indoor air
quality. Nevertheless, measurements that have been taken with fewer users, seems to also over exceed the CO2 lim-it. This situation can be linked to the classroom not being ventilated for a long time and to the long duration of its usage (Figure 5).
In Table 2 the CO2 measurements, taken in the outdoor environment to-gether with the Faculty of Engineering and the Faculty of Architecture class-rooms, are given with maximum, min-imum, mean values and their standard division. In Table 2, when comparing the average amount of CO2 for the Faculty of Engineering and the Archi-tecture classrooms, there is no signifi-cant difference between the Faculty of Architecture classrooms with different areas, volumes and number of users. In the Faculty of Engineering classrooms which have similar areas and volumes but have a very different number of users, especially in L304 the average
Figure 5. The number of users in the faculty of engineering and the faculty of architecture classrooms, changes in CO2 in relation to indoor air temperature and relative humidity.
Figure 4. The classrooms in the Faculty of Engineering.
The investigation of carbon dioxide (CO2) and particulate matter (PM) quantities in higher education buildings
79
amount of CO2 was recorded as the highest. This condition is the result of the high occupancy ratio in that class-room. However, in the other class-rooms, the average number of users during the measurement is an average of 10 persons in D102 and 20 persons in D206, and the average CO2 values are very close to each other.
When similar studies in the liter-ature were to be examined; in a study conducted in 116 schools in Korea, the average CO2 value in the classrooms was measured as 827 ppm (Yang et al., 2015). After the analysis of the data ob-tained by the Faculty of Architecture and the Faculty of Engineering, the evaluation results depending on CO2 can be summarized as below:
Although some measures are ex-ceeding the limit value of 1000 ppm in
all classrooms in the Faculty of Archi-tecture, there are also values below the limit value. The number of users and the fact that the windows were open during measurements are seen as fac-tors in changing this value (Huang, 2017). Besides, as expected, the CO2 values in the outdoor environment are lower than the indoor environment.
In the Faculty of Engineering, all classrooms exceeded the limit value of 1000 ppm in terms of CO2 values. Es-pecially in a certain classroom (L304), data exceeded above the limit values of all measurements. This may be due to the physical characteristics of the class-room (low ceiling height), the high occupancy ratio and the fact that the classroom was not adequately ventilat-ed.
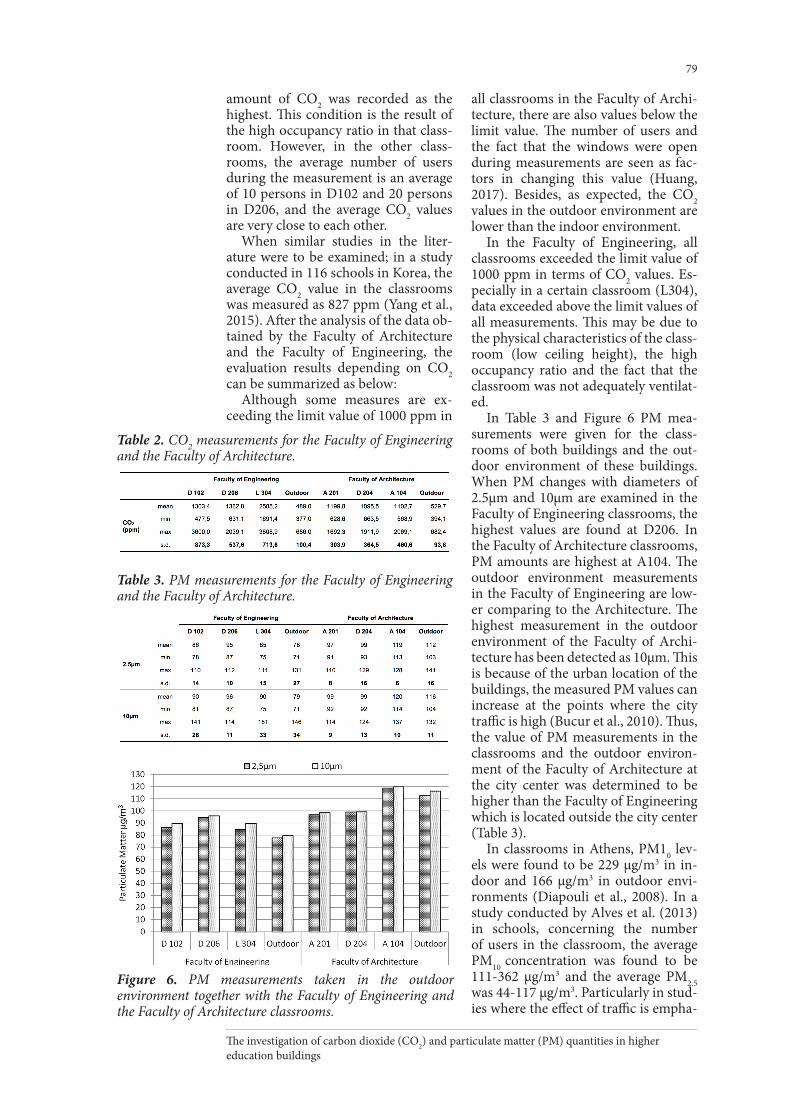
In Table 3 and Figure 6 PM mea-surements were given for the class-rooms of both buildings and the out-door environment of these buildings. When PM changes with diameters of 2.5μm and 10μm are examined in the Faculty of Engineering classrooms, the highest values are found at D206. In the Faculty of Architecture classrooms, PM amounts are highest at A104. The outdoor environment measurements in the Faculty of Engineering are low-er comparing to the Architecture. The highest measurement in the outdoor environment of the Faculty of Archi-tecture has been detected as 10μm. This is because of the urban location of the buildings, the measured PM values can increase at the points where the city traffic is high (Bucur et al., 2010). Thus, the value of PM measurements in the classrooms and the outdoor environ-ment of the Faculty of Architecture at the city center was determined to be higher than the Faculty of Engineering which is located outside the city center (Table 3).
In classrooms in Athens, PM10 lev-els were found to be 229 μg/m3 in in-door and 166 μg/m3 in outdoor envi-ronments (Diapouli et al., 2008). In a study conducted by Alves et al. (2013) in schools, concerning the number of users in the classroom, the average PM10 concentration was found to be 111-362 μg/m3 and the average PM2.5 was 44-117 μg/m3. Particularly in stud-ies where the effect of traffic is empha-
Figure 6. PM measurements taken in the outdoor environment together with the Faculty of Engineering and the Faculty of Architecture classrooms.
Table 2. CO2 measurements for the Faculty of Engineering and the Faculty of Architecture.
Table 3. PM measurements for the Faculty of Engineering and the Faculty of Architecture.

ITU A|Z • Vol 17 No 2 • July 2020 • F. Umaroğulları, D. Aydın
80
sized; Ekmekçioğlu and Keskin (2007) found the level of PM2.5 to be 13.3 – 95.2 and PM10 to be 27.9 and 289 μg/m3 in schools, while Lee and Chang (2000) found that the PM10 concentration ex-ceeded the average level of 180 μg/m3, which is the 24-hour average value set forth by the local legislation in Kong.
As a result of PM measurements in this study, PM of different diameters appeared to show similar changes for both buildings. PM2.5 values for the Faculty of Engineering vary between 85 and 95 μg/m3, while for the Facul-ty of Architecture vary between 97 and 119 μg/m3 (Table 3). PM2.5 values for the Faculty of Engineering are similar to other studies in the literature. How-ever, the values obtained at the Faculty of Architecture are above the results in other educational building studies. It can be said that this situation is caused by the use of tools and equipment which are necessary for the education of architecture. However, for PM10, both buildings had lower values than the data in the literature.
5. Conclusion
In this study, the aim was to investi-gate the indoor air quality in naturally ventilated classrooms (three samples each) at two higher education build-ings (Faculty of Architecture and Fac-ulty of Engineering) which were taken as a case study. For this purpose, CO2 and PM measurements of the indoor spaces were carried out in winter, during the usage of the classrooms. When the results found in this study were compared with similar studies in the literature, despite some differences when considering the various variables such as location, structural and spatial characteristics, the number of users, etc. similar results were obtained de-pending on average values.
In terms of indoor air quality, al-though CO2 measurements have some-times exceeded the limits at the Fac-ulty of Architecture, it was found well above the limit values at the Faculty of Engineering. This situation was caused by the physical characteristics of the classrooms in the Faculty of Engineer-ing (low ceiling height), the excessive number of users and the fact that the classrooms are used for longer periods
due to the evening education and are not ventilated adequately. Especially in the Faculty of Engineering, ventila-tion must be controlled to ensure the indoor air quality and to enable the education to be carried out more effi-ciently. Classrooms should be ventilat-ed in the morning before the usage of the space and also afterward, if neces-sary, mechanical ventilation should be utilized.
People who spend most of their time indoors spend about a third of their days in educational buildings. These and similar studies on indoor air quality, which are known to have a sig-nificant impact on students’ efficiency and productivity, provide important inputs both for the improvement of existing buildings and for the planning of new buildings. This study aimed to emphasize the importance of indoor air quality issues, but future studies can be conducted to determine the effects of indoor air quality on learning by applying learning tests to students si-multaneously with the measurements in buildings.
Acknowledgment
This study was supported by Trakya University, Scientific Research Projects unit (TUBAP) under the project of “In-door Environmental Quality Analysis in Education Buildings (TUBAP 2014-102)”.
ReferencesAbdul-Wahab, S. A., En, S. C. F.,
Elkamel, A., Ahmadi, L., Yetilmezsoy, K. (2015). A review of standards and guidelines set by international bodies for the parameters of indoor air qual-ity. Atmospheric Pollution Research, 6(5), 751-767.
Alves, C., Nunes, T., Silva, J., Duar-te, M. (2013). Comfort parameters and particulate matter (PM10 and PM2.5) in school classrooms and outdoor air. Aerosol and Air Quality Research, 13(5), 1521-1535.
Amato, F., Rivas, I., Viana, M., Moreno, T., Bouso, L., Reche, C., Àlva-rez-Pedrerol, M., Alastuey, A., Sunyer, J., Querol, X. (2014). Sources of indoor and outdoor PM2.5 concentrations in primary schools. Science of the Total Environment, 490, 757–765.

The investigation of carbon dioxide (CO2) and particulate matter (PM) quantities in higher education buildings
81
Apte, M. G., Fisk, W. J., Daisey, J. M. (2000). Associations between indoor CO2 concentrations and sick build-ing syndrome symptoms in U.S. office buildings: An analysis of the 1994-1996 BASE study data. Indoor Air, 10, 246-257.
ASHRAE. (2007). Ventilation for in-door air quality (ASHRAE-62). USA: American Society of Heating, Refriger-ating and Air-Conditioning Engineers.
Bari, A., Kindzierski, W. B. (2018). Characterization of air quality and sources of fine particulate matter (PM2.5) in the City of Calgary, Canada. Atmospheric Pollution Research, 9, 534-543.
Bucur, E., Ionita, L., Nicolescu, I., Petrescu, M. (2010). Considerations concerning impact assessment of pol-lution with breathable PM2.5 particulate matter. Part 1. Pollution monitoring in urban areas with intense road traffic. Journal of Environmental Protection and Ecology, 11(3), 809–814.
Can, E., Üzmez, Ö. Ö., Döğeroğ-lu, T., Gaga, E. O. (2015). Indoor air quality assessment in painting and printmaking department of a fine arts faculty building. Atmospheric Pollution Research, 6, 1035-1045.
Datta, A., Suresh, R., Gupta, A., Singh, D., Kulshrestha P. (2017). In-door air quality of non-residential urban buildings in Delhi, India. Inter-national Journal of Sustainable Built Environment, 6, 412-420.
Diapouli, E., Chaloulakou, A., Spyrellis, N. (2008). Indoor and out-door PM concentrations at a residen-tial environment in the Athens area. Global NEST Journal, 10(2), 201-208.
Ekmekcioğlu, D., Keskin, S. S. (2007). Characterization of indoor air particulate matter in selected elemen-tary schools in Istanbul, Turkey. Indoor and Built Environment, 16(2), 169-176.
Güler, N., İşçi, Ö. G. (2016). The re-gional prediction model of PM10 con-centrations for Turkey. Atmospheric Research, 180, 64–77.
Hess-Kosa, K. (2011). Indoor Air Quality; The Latest Sampling and An-alytical Methods, Boca Raton: CRC Press.
Hreha, D. M. (2007). The influence of indoor air quality (IAQ) on student test performance (Unpublished doc-
toral dissertation). Seton Hall Univer-sity, New Jersey, United States.
Huang, L. S. (2017). Assessment of indoor environmental quality in class-room in elementary schools. Journal of Environmental Protection and Ecology, 18(4), 1319–1327.
Kalimeri, K. K., Saraga, D. E., Lazaridis, V. D., Legkas, N. A., Missia, D. A., Tolis, E. I., Bartzis, J. G. (2016). Indoor air quality investigation of the school environment and estimated health risks: Two-season measure-ments in primary schools in Kozani, Greece. Atmospheric Pollution Re-search, 7(6), 1128-1142.
Lee, C., Kim, H., Lim, Y., Yang, J., Yu, S., Lee, J., Chang, J., Son, H., Park, J., Shin, D. (2015). Evaluation of the re-lationship between allergic diseases in school children at Seoul’s roadside ele-mentary schools and air pollution. At-mospheric Pollution Research, 6, 1004-1012.
Lee, M. C., Mui, K. W., Wong, L. T., Chan, W. Y., Lee, E. W. M., Cheung, C. T. (2012). Student learning per-formance and indoor environmental quality (IEQ) in air-conditioned uni-versity teaching rooms. Building and Environment, 49, 238-244.
Lee, S., Chang, M. (2000). Indoor and outdoor air quality investigation at schools in Hong Kong. Chemosphere, 41(1), 109-113.
Madureira, J., Paciência, I., Rufo, J., Ramos, E., Henrique, B., Teixeira, J. P., Fernandes, E. O. (2015). Indoor air quality in schools and its relationship with children’s respiratory symptoms. Atmospheric Environment, 118, 145-156.
Mohammed, M. O. A., Song, W. W., Ma, W. L., Li, W. L., Ambuchi, J. J., Thabit, M., Li, Y. F. (2015). Trends in indoor-outdoor PM2.5 research: A sys-tematic review of studies conducted during the last decade (2003–2013). Atmospheric Pollution Research, 6, 893-903.
Peacock, A. J. (1998). Oxygen at high altitude. US National Library of Medicine National Institutes of Health Search, 317(7165), 1063-1066.
Sarafis, P., Sotiriadou, K., Dallas, D., Stavrakakis, P., Chalaris, M. (2010). Sick-building syndrome. Journal of Environmental Protection and Ecology,

ITU A|Z • Vol 17 No 2 • July 2020 • F. Umaroğulları, D. Aydın
82
11(2), 515–522.Shakya, K. M., Peltier, R. E., Shres-
tha, H., Byanju, R. M. (2017). Measure-ments of TSP, PM10, PM2.5, BC, and PM chemical composition from an urban residential location in Nepal. Atmo-spheric Pollution Research, 8, 1123-1131.
Tham, K. W. (2016). Indoor air quality and its effects on humans—A review of challenges and developments in the last 30 years. Energy and Build-ings, 130, 637-650.
TSI. (2011). Indoor air quality hand-book a practical guide to indoor air quality investigations. Retrieved from TSI: http://www.tsi.com/uploaded-Files/_Site_Root/Products/Literature/Handbooks/IAQ_Handbook_2011_US_2980187-web.pdf.
TSMS (Turkish State Meteorolog-ical Service). (2015). Retrieved from: https://mgm.gov.tr/eng/forecast-cities.aspx.
Turunen, M., Toyinbo, O., Putus, T., Nevalainen, A., Shaughnessy, R., Haverinen-Saughnessy, U. (2014). In-door environmental quality in school buildings, and the health and wellbe-ing of students. International Journal of Hygiene and Environmental Health, 217, 733-739.
Vilcekova, S., Meciarova, L., Burdo-va, E. K., Katunska, J., Kosicanova, D.,
Doroudiani, S. (2017). Indoor environ-mental quality of classrooms and occu-pants’ comfort in a special education school in Slovak Republic. Building and Environment, 120, 29-40.
WCBBC (Workers’ Compensation Board of British Columbia). (2008). Hazards of confined spaces. Retrieved from WorkSafeBC: https://www.work-safebc.com/en/resources/health-safe-ty/books-guides/hazards-of-con-fined-spaces?lang=en&direct.
WHO (World Health Organization). (1983). Indoor Air Pollutants: Exposure and Health Effects. Copenhagen: World Health Organization, Retrieved from: http://whqlibdoc.who.int/euro/r&s/EURO_R&S_78.pdf.
Yang, J., Nam, I., Yun, H., Kim, J., Oh, H. J., Lee, D., Jeon, S. M., Yoo, S. H., Sohn, J. R. (2015). Characteristics of indoor air quality at urban elemen-tary schools in Seoul, Korea: Assess-ment of effect of surrounding environ-ments. Atmospheric Pollution Research, 6, 1113-1122.
Zhang, Z. H., Hu, M. G., Ren, J., Zhang, Z. Y., Christakos, G., Wang, J. F. (2017). Probabilistic assessment of high concentrations of particulate matter (PM10) in Beijing, China. At-mospheric Pollution Research, 8, 1143-1150.