it's time to get off our fannie
TRANSCRIPT

It’s Time to Get Off Our FannieIra Sohn Conference
May 5, 2014
Pershing Square Capital Management, L.P.
DisclaimerThe analyses and conclusions of Pershing Square Capital Management, L.P. ("Pershing Square") contained in this presentation are based on publicly available information. Pershing Square recognizes that there may be nonpublic information in the possession of the companies discussed in this presentation that could lead these companies and others to disagree with Pershing Square’s analyses, conclusions and opinions. This presentation and the information contained herein is not investment advice or a recommendation or solicitation to buy or sell any securities. All investments involve risk, including the loss of principal.
The analyses provided may include certain forward-looking statements, estimates and projections prepared with respect to, among other things, the historical and anticipated operating performance of the companies discussed in this presentation, access to capital markets, market conditions and the values of assets and liabilities. Such statements, estimates, and projections reflect various assumptions by Pershing Square concerning anticipated results that are inherently subject to significant economic, competitive, and other uncertainties and contingencies and have been included solely for illustrative purposes. No representations, express or implied, are made as to the accuracy or completeness of such statements, estimates or projections or with respect to any other materials herein and Pershing Square disclaims any liability with respect thereto. Actual results may vary materially from the estimates and projected results contained herein. The information contained in this presentation may not contain all of the information required in order to evaluate Fannie Mae or Freddie Mac and the proposal described in the presentation. The opinions, analyses, conclusions and proposals presented herein represent the views of Pershing Square and not those of any third party.
Funds managed by Pershing Square and its affiliates are invested in securities of Federal National Mortgage Association (“Fannie Mae”) and Federal Home Loan Mortgage Corporation (“Freddie Mac”). Pershing Square manages funds that are in the business of trading – buying and selling – securities and financial instruments. It is possible that there will be developments in the future that cause Pershing Square to change its position regarding Fannie Mae and Freddie Mac. Pershing Square may buy, sell, cover or otherwise change the form of its investment in Fannie Mae and Freddie Mac for any or no reason. Pershing Square hereby disclaims any duty to provide any updates or changes to the analyses contained here including, without limitation, the manner or type of any Pershing Square investment.
1
Fannie Mae & Freddie Mac (GSEs)
2
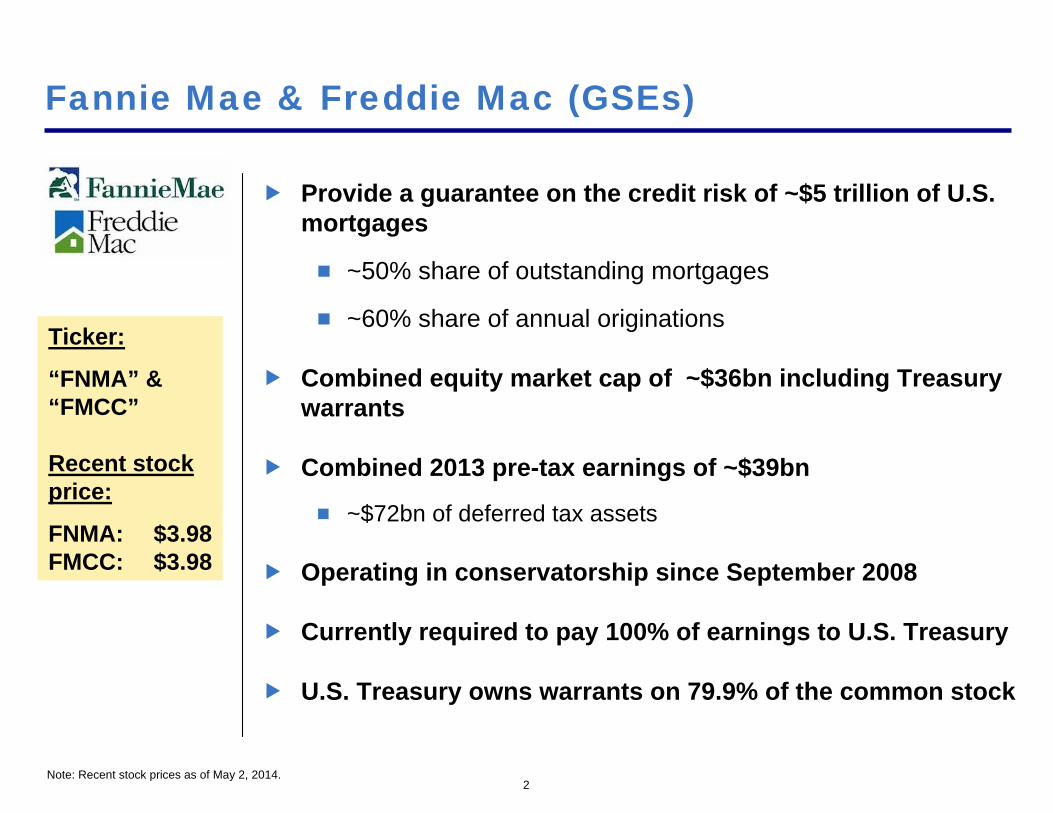
Provide a guarantee on the credit risk of ~$5 trillion of U.S. mortgages
~50% share of outstanding mortgages
~60% share of annual originations
Combined equity market cap of ~$36bn including Treasury warrants
Combined 2013 pre-tax earnings of ~$39bn
~$72bn of deferred tax assets
Operating in conservatorship since September 2008
Currently required to pay 100% of earnings to U.S. Treasury
U.S. Treasury owns warrants on 79.9% of the common stock
Ticker:
“FNMA” & “FMCC”
Recent stock price:
FNMA: $3.98FMCC: $3.98
Note: Recent stock prices as of May 2, 2014.

History of the GSEs
4
Mortgage availability was limited, with 5-to-10 year terms, floating interest rates, and ~50% loan-to-value ratios
Prior to the Great Depression
Mortgages were primarily originated and retained by local thrifts, commercial banks, and insurance companies
Banks would lend at floating interest rates for a short term to match the structure of their deposit funding sources
Supply of mortgage credit was limited and required large initial down payments
Availability and pricing of mortgage credit varied widely across the U.S. due to localized funding
Homeownership rate was ~45%
5
During the Great Depression, the U.S. mortgage market was paralyzed and required significant government involvement to eventually recover
The Great Depression
Unemployment rate was nearly 25%
Housing prices declined as much as 50%
~25% of mortgages were in default and ~10% of homes were in foreclosure
Homeowners were unable to satisfy their principal payments and were unable to refinance their short-term mortgages
The banking system was near collapse and was unable and unwilling to provide a meaningful amount of mortgage credit
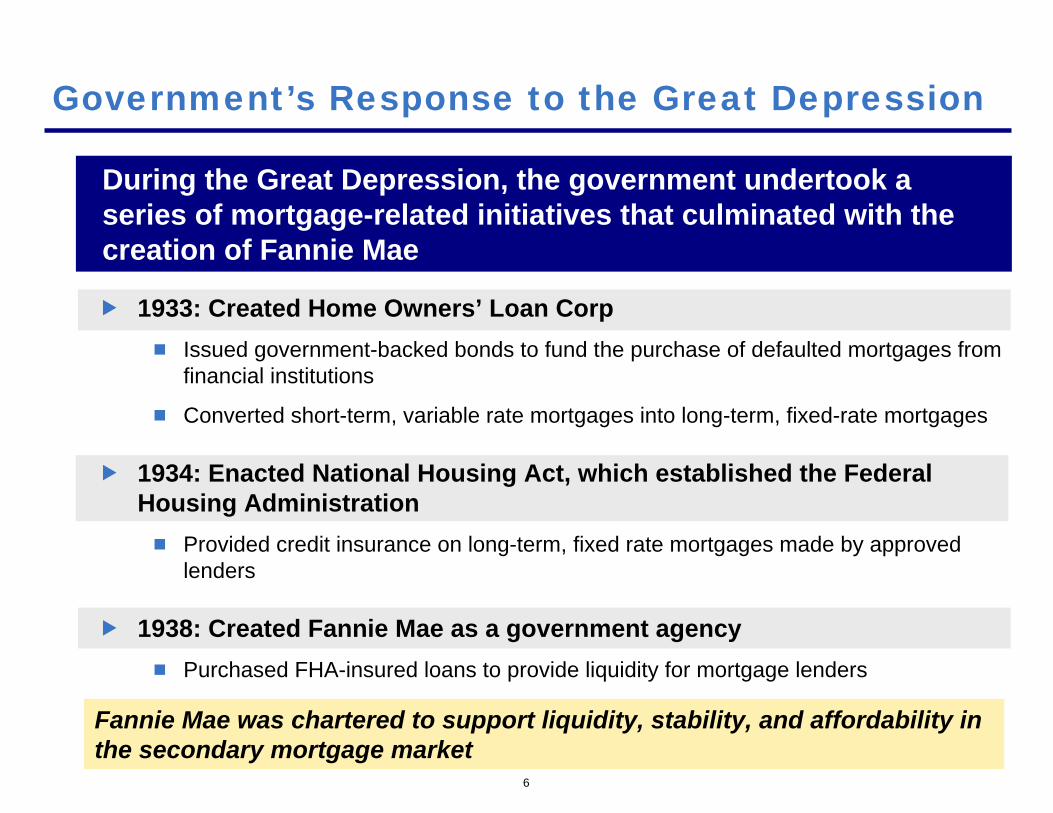
1933: Created Home Owners’ Loan CorpIssued government-backed bonds to fund the purchase of defaulted mortgages from financial institutions
Converted short-term, variable rate mortgages into long-term, fixed-rate mortgages
1934: Enacted National Housing Act, which established the Federal Housing Administration
Provided credit insurance on long-term, fixed rate mortgages made by approved lenders
1938: Created Fannie Mae as a government agencyPurchased FHA-insured loans to provide liquidity for mortgage lenders
6
During the Great Depression, the government undertook a series of mortgage-related initiatives that culminated with the creation of Fannie Mae
Government’s Response to the Great Depression
Fannie Mae was chartered to support liquidity, stability, and affordability in the secondary mortgage market
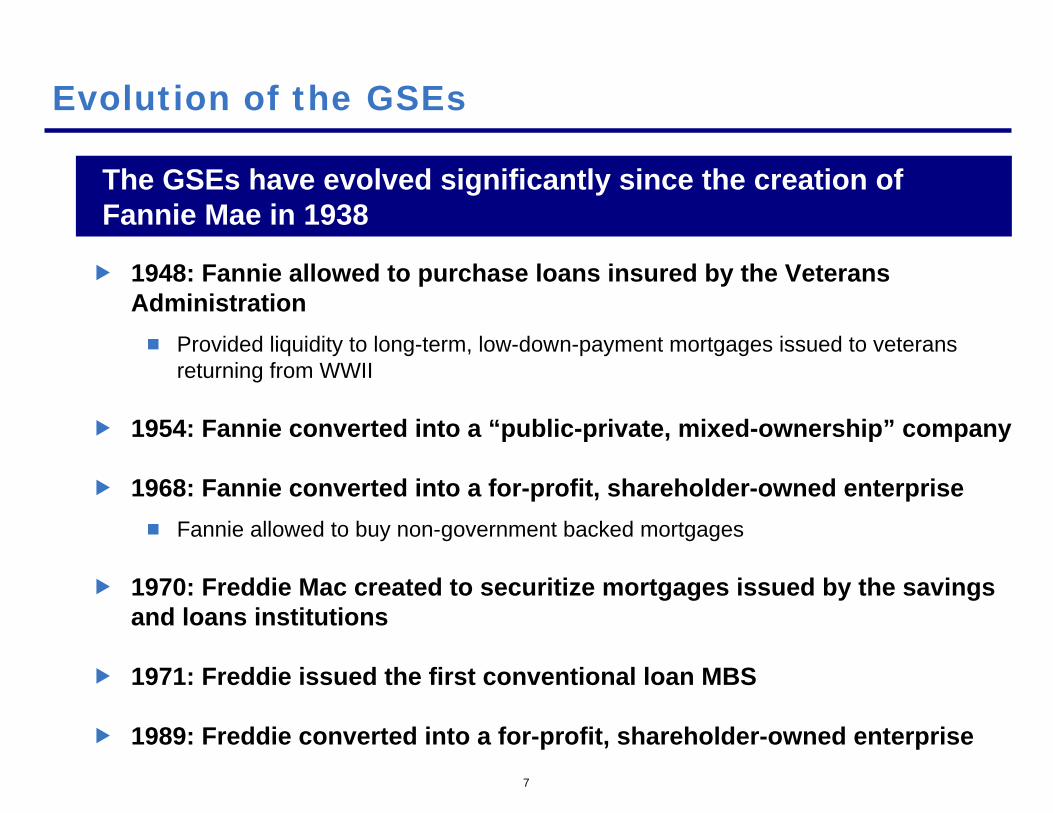
1948: Fannie allowed to purchase loans insured by the Veterans Administration
Provided liquidity to long-term, low-down-payment mortgages issued to veterans returning from WWII
1954: Fannie converted into a “public-private, mixed-ownership” company
1968: Fannie converted into a for-profit, shareholder-owned enterpriseFannie allowed to buy non-government backed mortgages
1970: Freddie Mac created to securitize mortgages issued by the savings and loans institutions
1971: Freddie issued the first conventional loan MBS
1989: Freddie converted into a for-profit, shareholder-owned enterprise7
The GSEs have evolved significantly since the creation of Fannie Mae in 1938
Evolution of the GSEs
$0
$2,000
$4,000
$6,000
$8,000
$10,000
$12,000
1980
1981
1982
1983
1984
1985
1986
1987
1988
1989
1990
1991
1992
1993
1994
1995
1996
1997
1998
1999
2000
2001
2002
2003
2004
2005
2006
2007
2008
2009
2010
2011
2012
2013
8
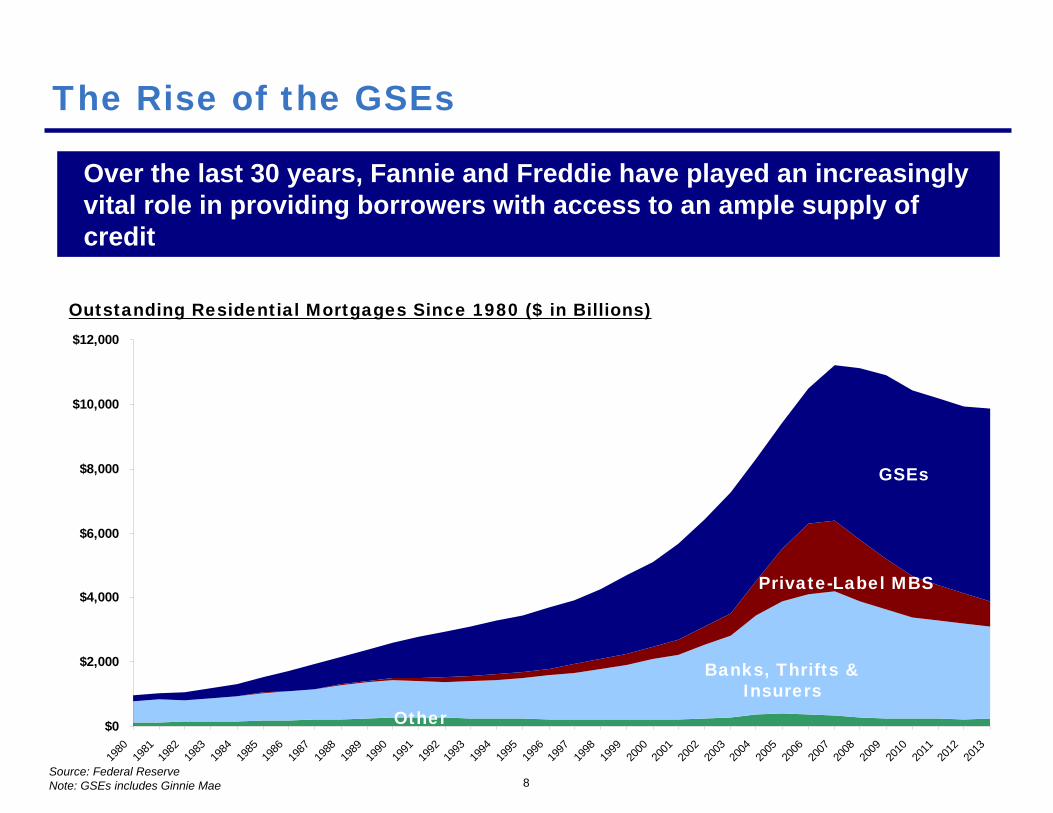
Over the last 30 years, Fannie and Freddie have played an increasingly vital role in providing borrowers with access to an ample supply of credit
The Rise of the GSEs
GSEs
Private-Label MBS
Banks, Thrifts & Insurers
Other
Source: Federal ReserveNote: GSEs includes Ginnie Mae
Outstanding Residential Mortgages Since 1980 ($ in Billions)
0%
10%
20%
30%
40%
50%
60%
70%
80%
90%
100%
1980
1981
1982
1983
1984
1985
1986
1987
1988
1989
1990
1991
1992
1993
1994
1995
1996
1997
1998
1999
2000
2001
2002
2003
2004
2005
2006
2007
2008
2009
2010
2011
2012
2013
9
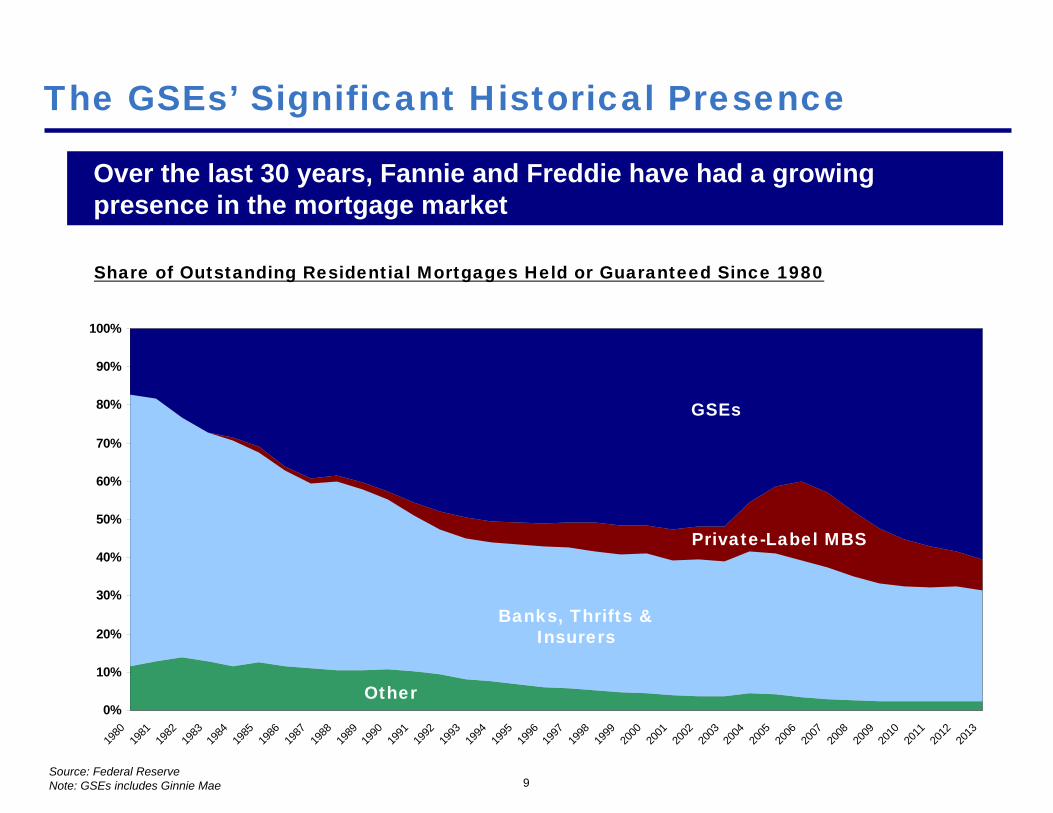
Over the last 30 years, Fannie and Freddie have had a growing presence in the mortgage market
The GSEs’ Significant Historical Presence
GSEs
Private-Label MBS
Banks, Thrifts & Insurers
Other
Source: Federal ReserveNote: GSEs includes Ginnie Mae
Share of Outstanding Residential Mortgages Held or Guaranteed Since 1980
0%
10%
20%
30%
40%
50%
60%
70%
80%
90%
100%
2000 2001 2002 2003 2004 2005 2006 2007 2008 2009 2010 2011 2012 2013Private-Label MBS Banks & Other Fannie & Freddie
10
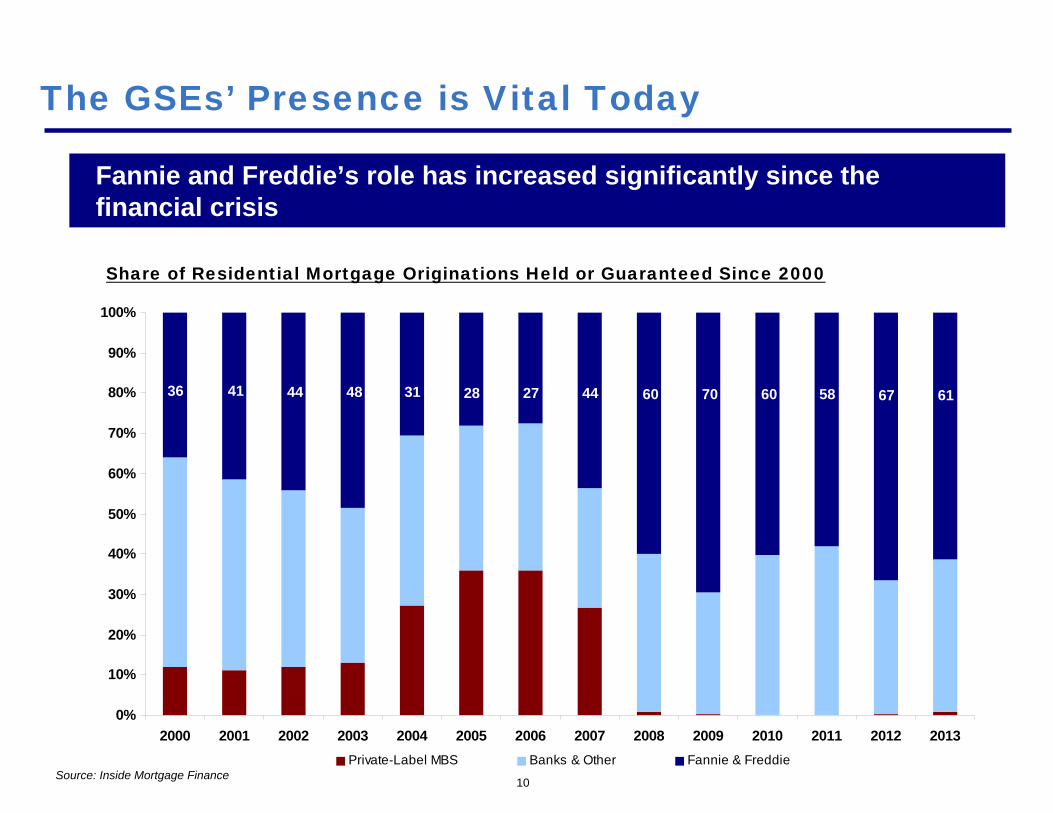
Fannie and Freddie’s role has increased significantly since the financial crisis
The GSEs’ Presence is Vital Today
Share of Residential Mortgage Originations Held or Guaranteed Since 2000
36 41 44 48 31 28 27 44 60 70 60
Source: Inside Mortgage Finance
58 67 61
The GSEs’ Critical Role in the Mortgage Market
12
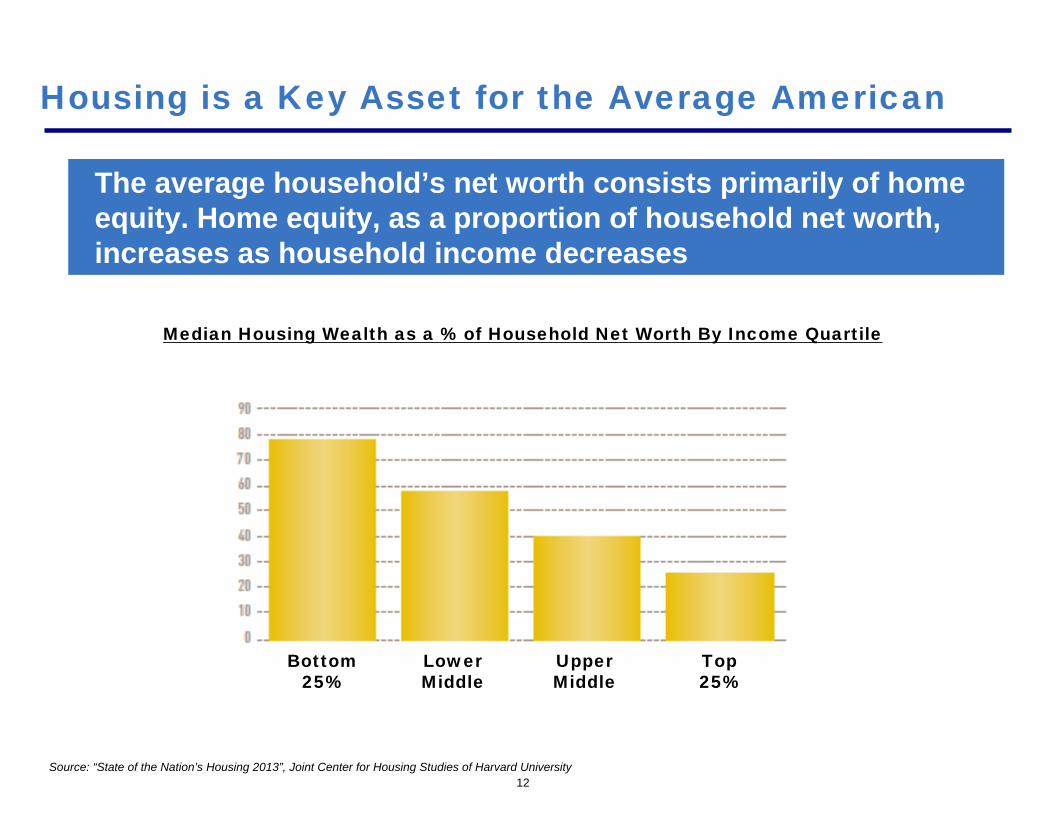
The average household’s net worth consists primarily of home equity. Home equity, as a proportion of household net worth, increases as household income decreases
Housing is a Key Asset for the Average American
Median Housing Wealth as a % of Household Net Worth By Income Quartile
Source: “State of the Nation’s Housing 2013”, Joint Center for Housing Studies of Harvard University
Bottom 25%
Top25%
Upper Middle
LowerMiddle
13
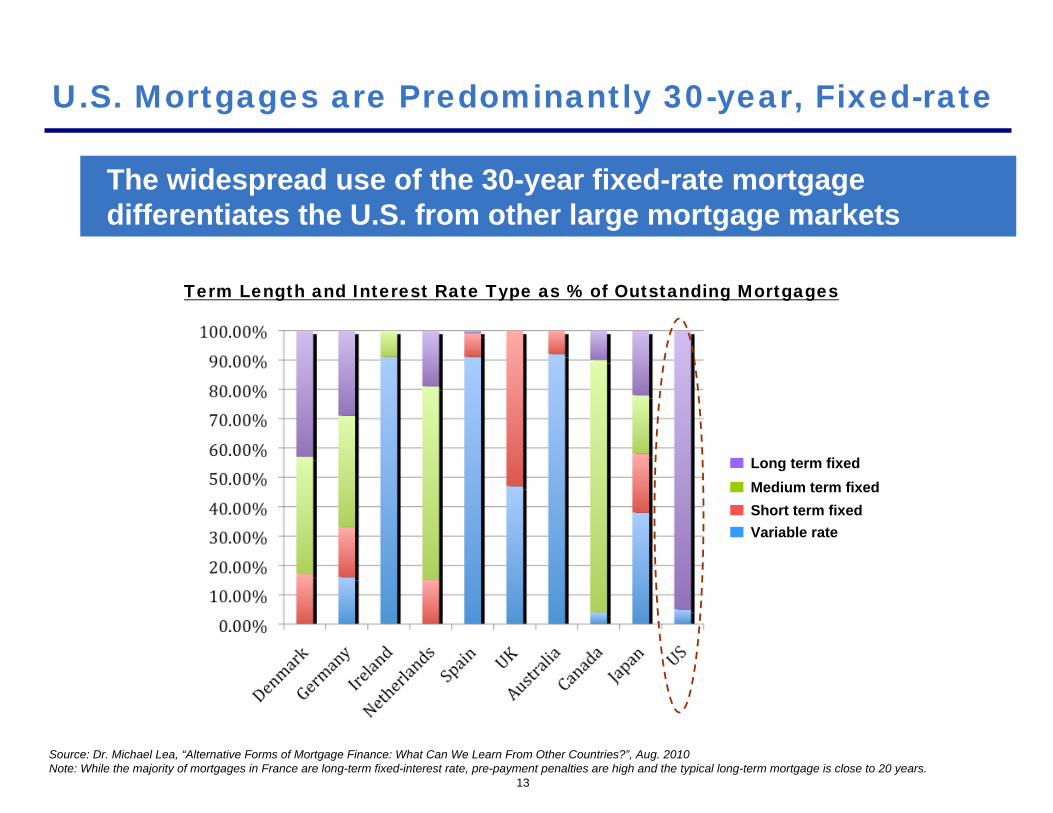
The widespread use of the 30-year fixed-rate mortgage differentiates the U.S. from other large mortgage markets
U.S. Mortgages are Predominantly 30-year, Fixed-rate
Source: Dr. Michael Lea, “Alternative Forms of Mortgage Finance: What Can We Learn From Other Countries?”, Aug. 2010Note: While the majority of mortgages in France are long-term fixed-interest rate, pre-payment penalties are high and the typical long-term mortgage is close to 20 years.
Long term fixedMedium term fixedShort term fixedVariable rate
Term Length and Interest Rate Type as % of Outstanding Mortgages
14
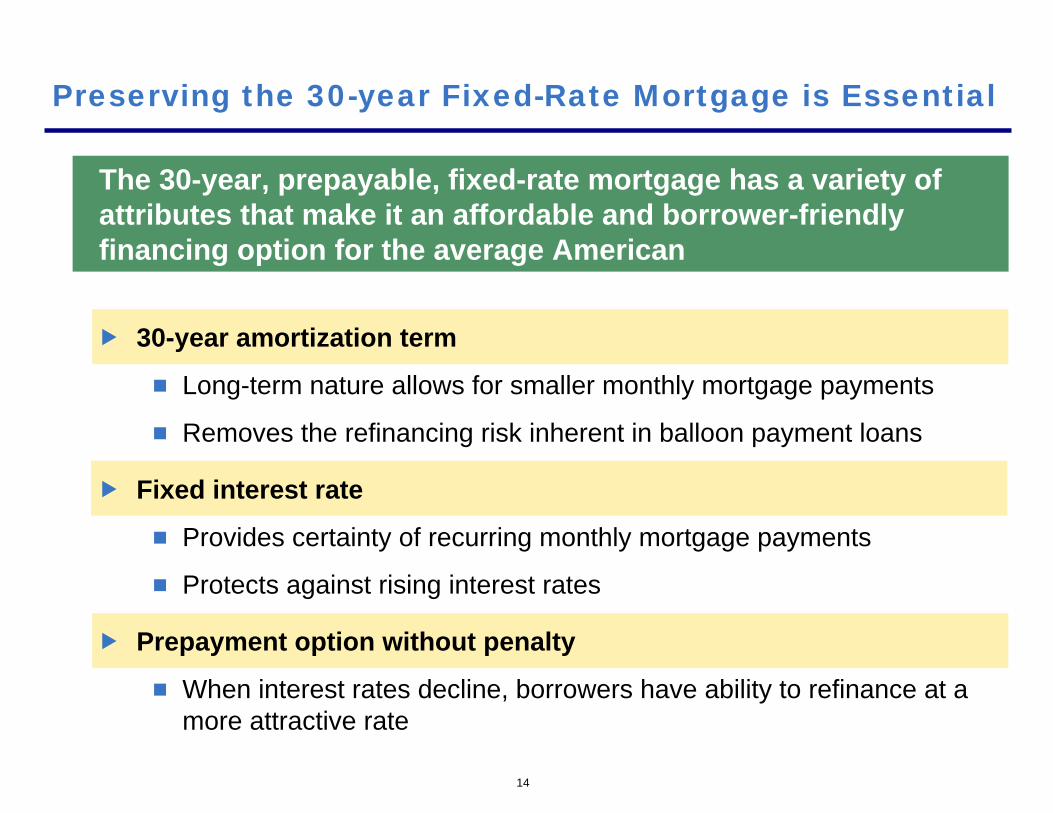
The 30-year, prepayable, fixed-rate mortgage has a variety of attributes that make it an affordable and borrower-friendly financing option for the average American
Preserving the 30-year Fixed-Rate Mortgage is Essential
30-year amortization term
Long-term nature allows for smaller monthly mortgage payments
Removes the refinancing risk inherent in balloon payment loans
Fixed interest rate
Provides certainty of recurring monthly mortgage payments
Protects against rising interest rates
Prepayment option without penalty
When interest rates decline, borrowers have ability to refinance at a more attractive rate
15
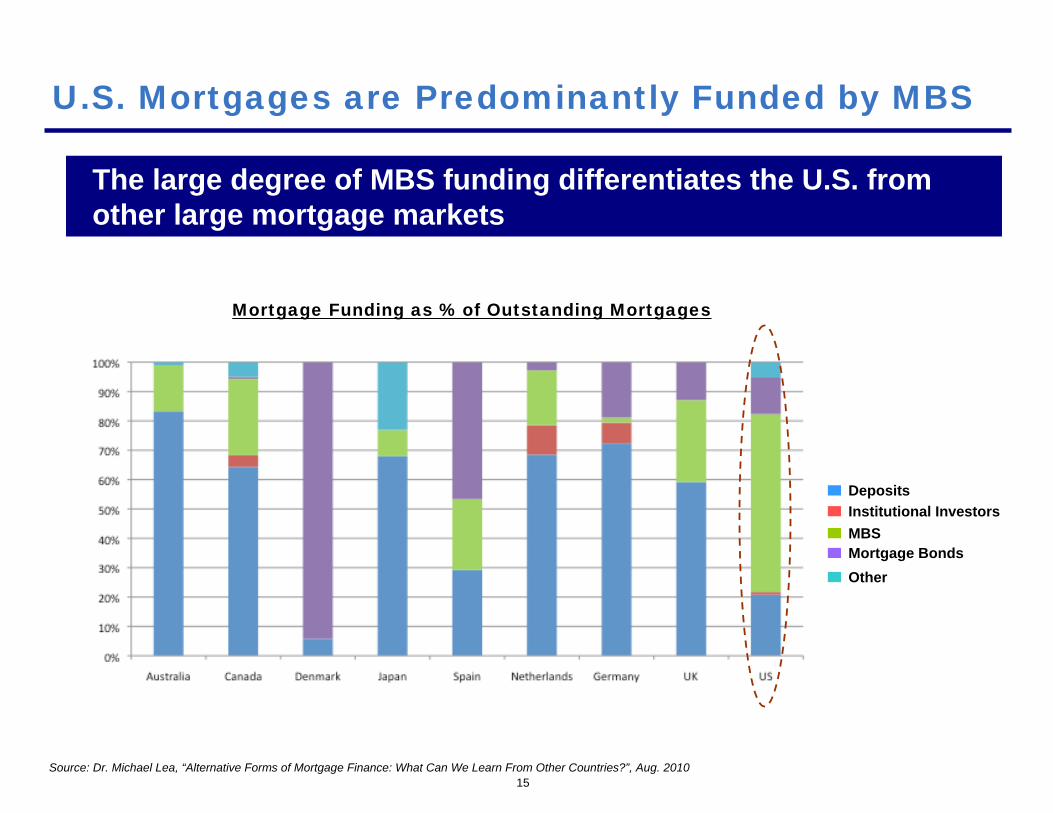
The large degree of MBS funding differentiates the U.S. from other large mortgage markets
U.S. Mortgages are Predominantly Funded by MBS
Source: Dr. Michael Lea, “Alternative Forms of Mortgage Finance: What Can We Learn From Other Countries?”, Aug. 2010
Other
MBSInstitutional InvestorsDeposits
Mortgage Funding as % of Outstanding Mortgages
Mortgage Bonds
16
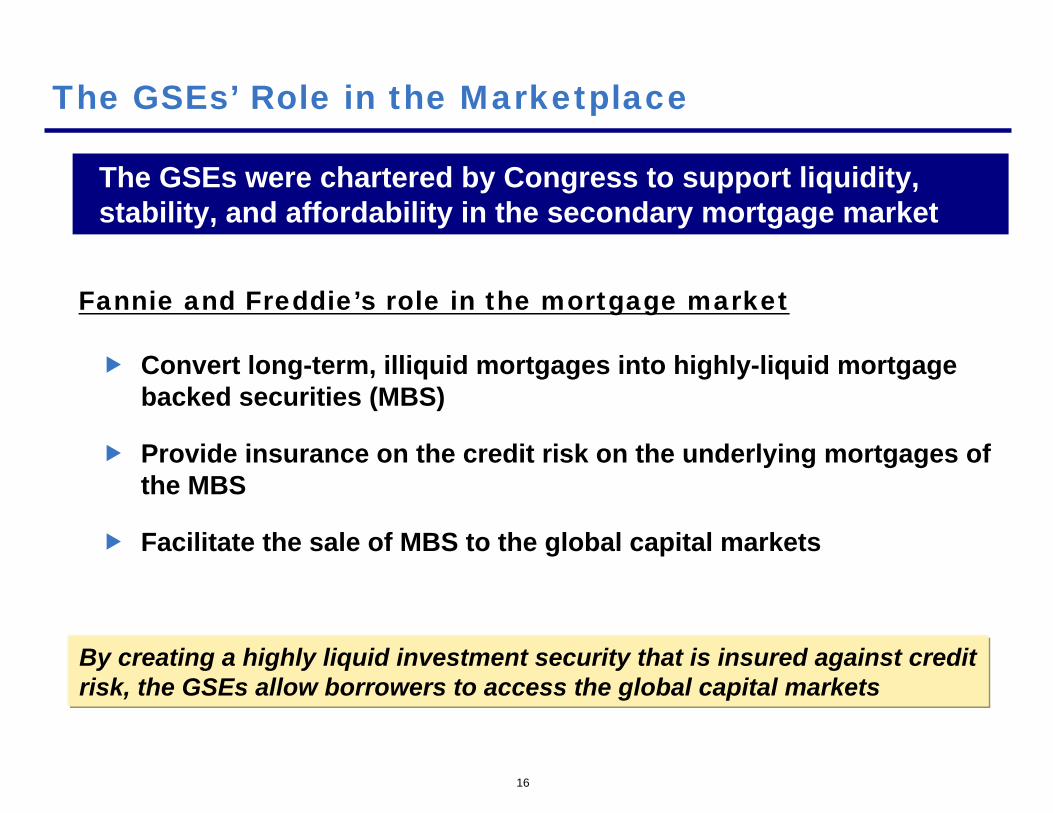
The GSEs were chartered by Congress to support liquidity, stability, and affordability in the secondary mortgage market
The GSEs’ Role in the Marketplace
Convert long-term, illiquid mortgages into highly-liquid mortgage backed securities (MBS)
Provide insurance on the credit risk on the underlying mortgages of the MBS
Facilitate the sale of MBS to the global capital markets
Fannie and Freddie’s role in the mortgage market
By creating a highly liquid investment security that is insured against credit risk, the GSEs allow borrowers to access the global capital markets
17
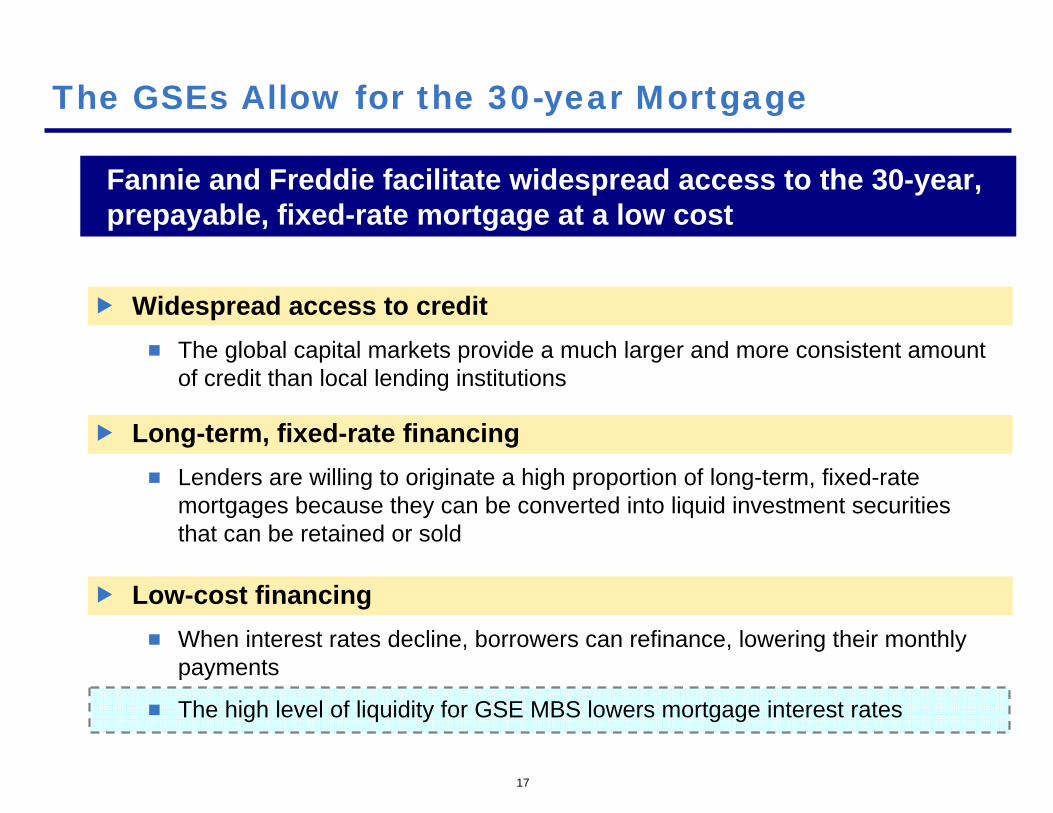
Fannie and Freddie facilitate widespread access to the 30-year, prepayable, fixed-rate mortgage at a low cost
The GSEs Allow for the 30-year Mortgage
Widespread access to creditThe global capital markets provide a much larger and more consistent amount of credit than local lending institutions
Long-term, fixed-rate financingLenders are willing to originate a high proportion of long-term, fixed-rate mortgages because they can be converted into liquid investment securities that can be retained or sold
Low-cost financingWhen interest rates decline, borrowers can refinance, lowering their monthly payments
The high level of liquidity for GSE MBS lowers mortgage interest rates
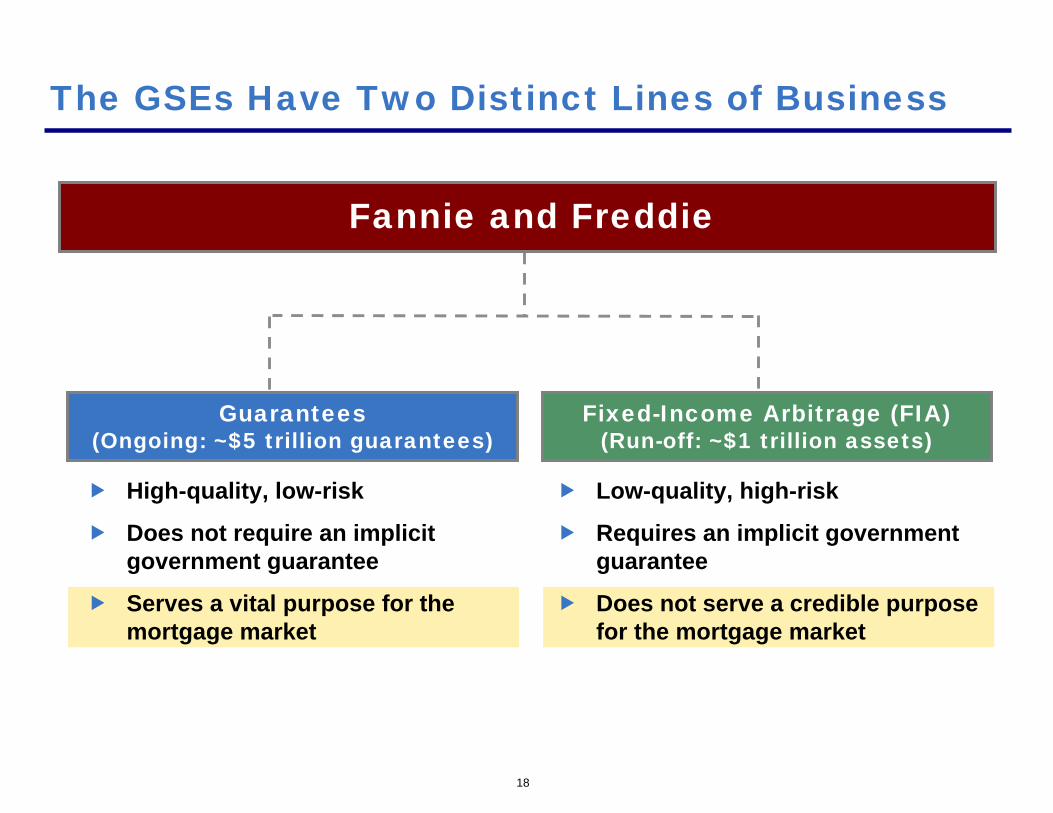
High-quality, low-risk
Does not require an implicit government guarantee
Serves a vital purpose for the mortgage market
18
The GSEs Have Two Distinct Lines of Business
Guarantees(Ongoing: ~$5 trillion guarantees)
Fixed-Income Arbitrage (FIA)(Run-off: ~$1 trillion assets)
Fannie and Freddie
Low-quality, high-risk
Requires an implicit government guarantee
Does not serve a credible purpose for the mortgage market

Guarantee Business
20
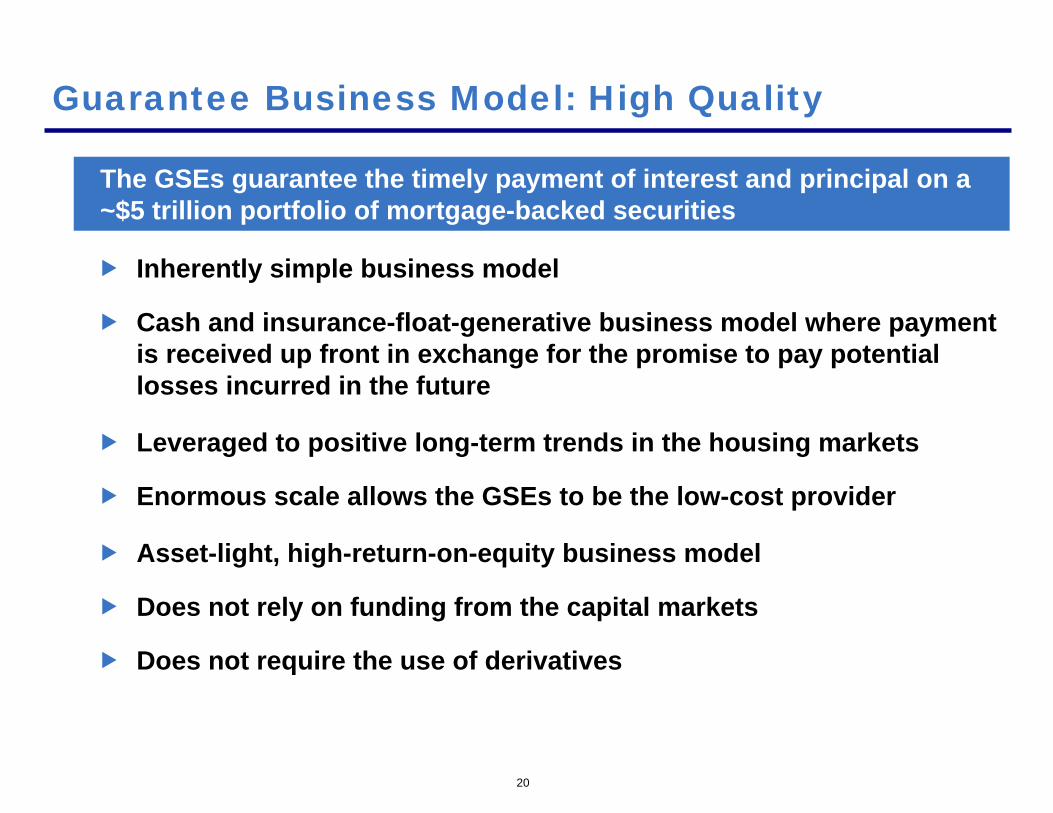
The GSEs guarantee the timely payment of interest and principal on a ~$5 trillion portfolio of mortgage-backed securities
Guarantee Business Model: High Quality
Inherently simple business model
Cash and insurance-float-generative business model where payment is received up front in exchange for the promise to pay potential losses incurred in the future
Leveraged to positive long-term trends in the housing markets
Enormous scale allows the GSEs to be the low-cost provider
Asset-light, high-return-on-equity business model
Does not rely on funding from the capital markets
Does not require the use of derivatives
21
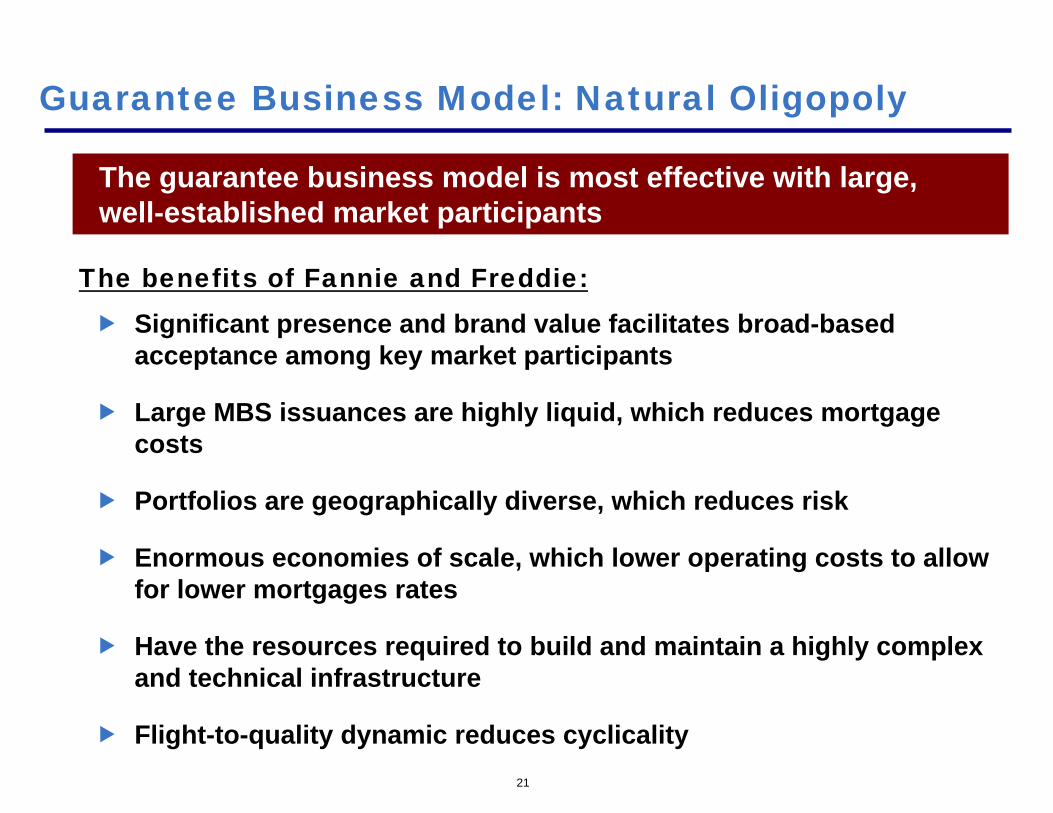
The guarantee business model is most effective with large, well-established market participants
Guarantee Business Model: Natural Oligopoly
Significant presence and brand value facilitates broad-based acceptance among key market participants
Large MBS issuances are highly liquid, which reduces mortgage costs
Portfolios are geographically diverse, which reduces risk
Enormous economies of scale, which lower operating costs to allow for lower mortgages rates
Have the resources required to build and maintain a highly complex and technical infrastructure
Flight-to-quality dynamic reduces cyclicality
The benefits of Fannie and Freddie:
22
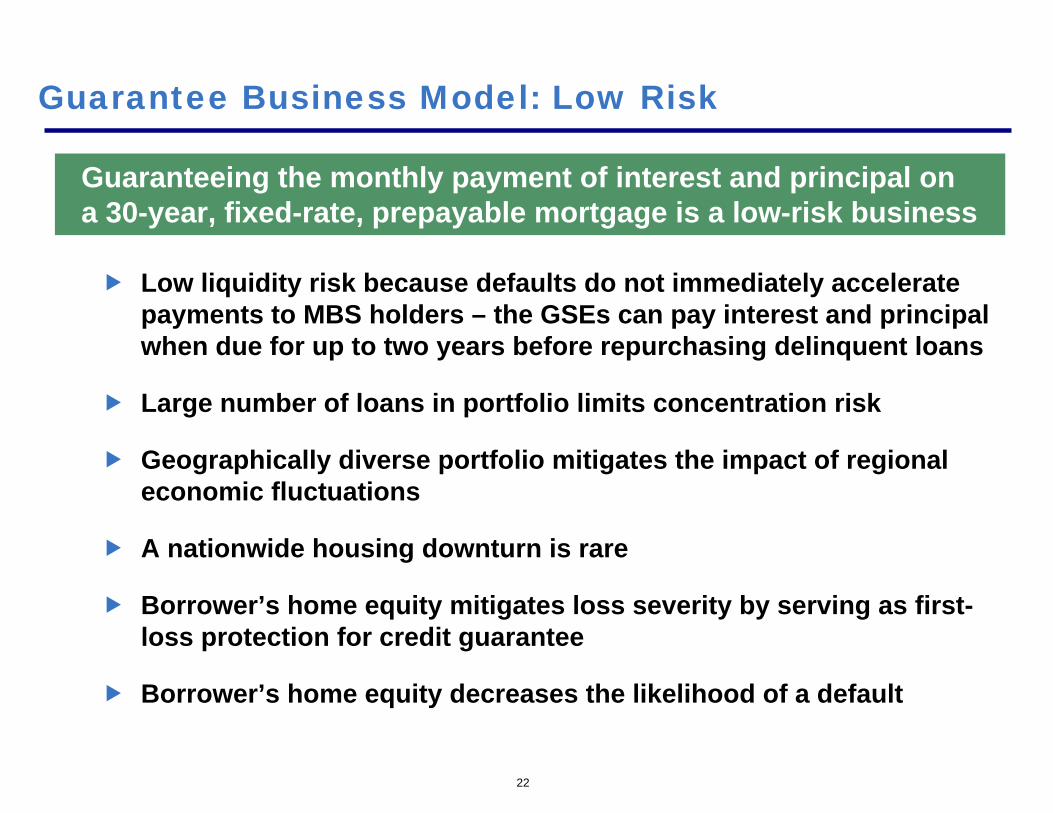
Guaranteeing the monthly payment of interest and principal on a 30-year, fixed-rate, prepayable mortgage is a low-risk business
Guarantee Business Model: Low Risk
Low liquidity risk because defaults do not immediately accelerate payments to MBS holders – the GSEs can pay interest and principal when due for up to two years before repurchasing delinquent loans
Large number of loans in portfolio limits concentration risk
Geographically diverse portfolio mitigates the impact of regional economic fluctuations
A nationwide housing downturn is rare
Borrower’s home equity mitigates loss severity by serving as first-loss protection for credit guarantee
Borrower’s home equity decreases the likelihood of a default
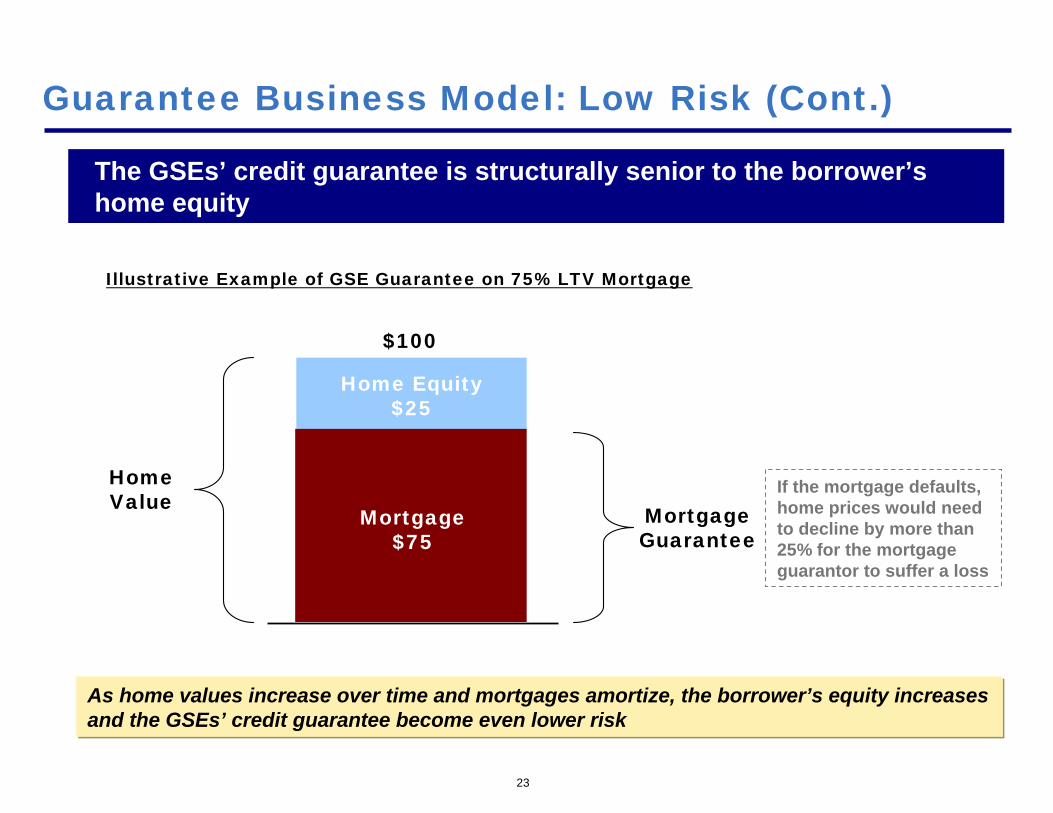
23
Guarantee Business Model: Low Risk (Cont.)
The GSEs’ credit guarantee is structurally senior to the borrower’s home equity
As home values increase over time and mortgages amortize, the borrower’s equity increases and the GSEs’ credit guarantee become even lower risk
Home Value
$100
Illustrative Example of GSE Guarantee on 75% LTV Mortgage
Home Equity$25
Mortgage$75
Mortgage Guarantee
If the mortgage defaults, home prices would need to decline by more than 25% for the mortgage guarantor to suffer a loss
24
As dominant participants in the market, the GSEs have historically retained access to capital as other participants have been forced to exit. This has allowed them to expand their market share in economic downturns, when mortgage underwriting conditions are most favorable
Guarantee Business Model: Low Risk (Cont.)
Economic downturns usually result in a decline in housing pricesand a decrease in interest rates
Lower housing prices result in reduced loan-to-replacement cost ratios
Lower interest rates result in a lower mortgage payment burden
Lower initial interest rates decrease the probability of future prepayments
Guarantees issued during an economic downturn have a lower probability of default, a longer time period to default, lower severity upon default, and greater persistency, which increases the overall quality of the guarantee portfolio and de-risks the business model
0
5
10
15
20
25
30
35
40
1990 1991 1992 1993 1994 1995 1996 1997 1998 1999 2000 2001 2002 2003 2004 2005 2006 2007 2008 2009 2010 2011 2012 2013
25
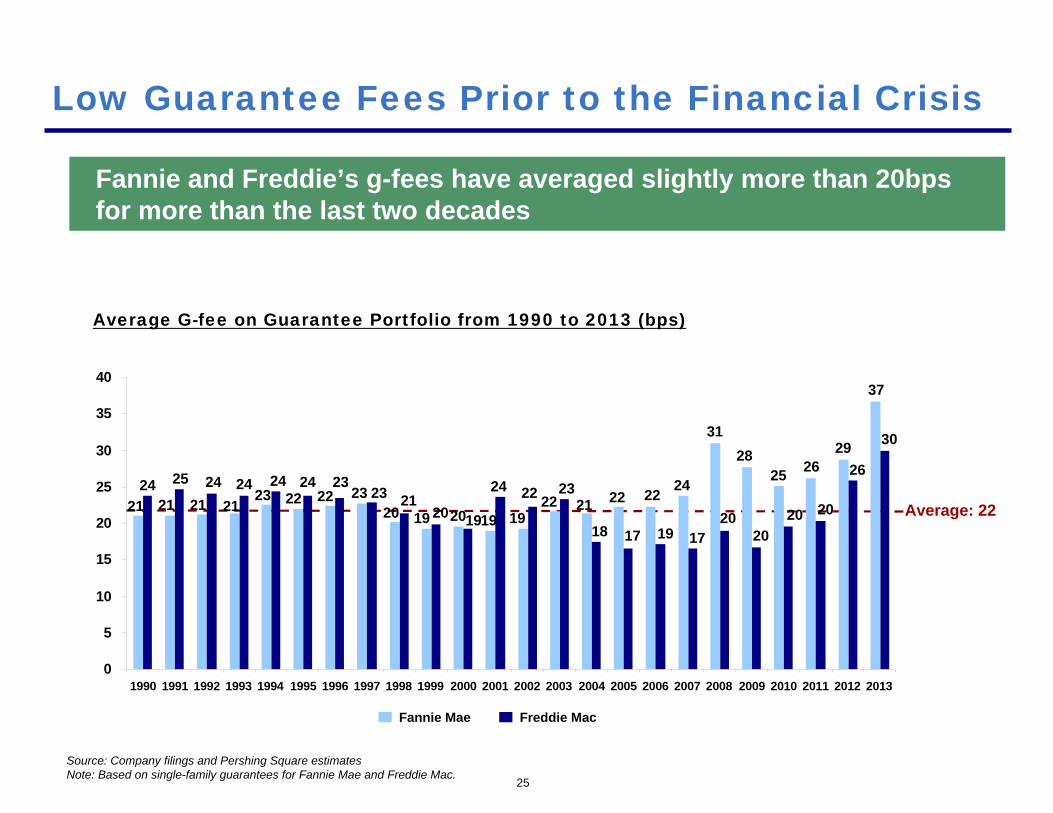
Low Guarantee Fees Prior to the Financial Crisis
Fannie and Freddie’s g-fees have averaged slightly more than 20bps for more than the last two decades
Average G-fee on Guarantee Portfolio from 1990 to 2013 (bps)
21 21 21 2123 22 22 23
20 19 20 19 1922 21 22 22 24
3128
Freddie MacFannie Mae
25 2629
24 25 24 24 24 24 2323 21
20 19
24 22 23
18 17 19 1720
2020 20
26
37
30
Source: Company filings and Pershing Square estimatesNote: Based on single-family guarantees for Fannie Mae and Freddie Mac.
Average: 22
11110
10
20
30
40
50
60
70
80
1990 1991 1992 1993 1994 1995 1996 1997 1998 1999 2000 2001 2002 2003 2004 2005 2006 2007 2008 2009 2010 2011 2012 2013
26
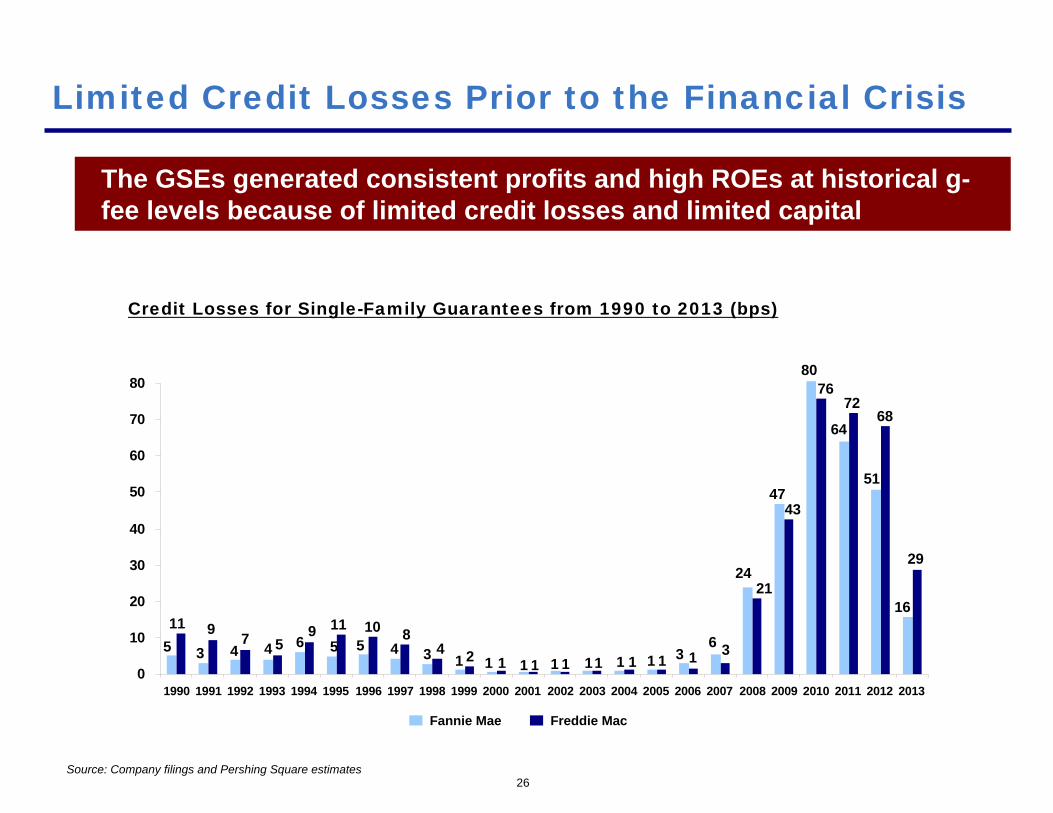
Limited Credit Losses Prior to the Financial Crisis
The GSEs generated consistent profits and high ROEs at historical g-fee levels because of limited credit losses and limited capital
Credit Losses for Single-Family Guarantees from 1990 to 2013 (bps)
Source: Company filings and Pershing Square estimates
5 3 4 4 6 5 5 4 3 1 1 1 1 1 1 1 36
24
47
80
64
51
11 9 7 59 11 10 8
4 2 3
21
43
7672
68
1 1 1
Freddie MacFannie Mae
29
16
27
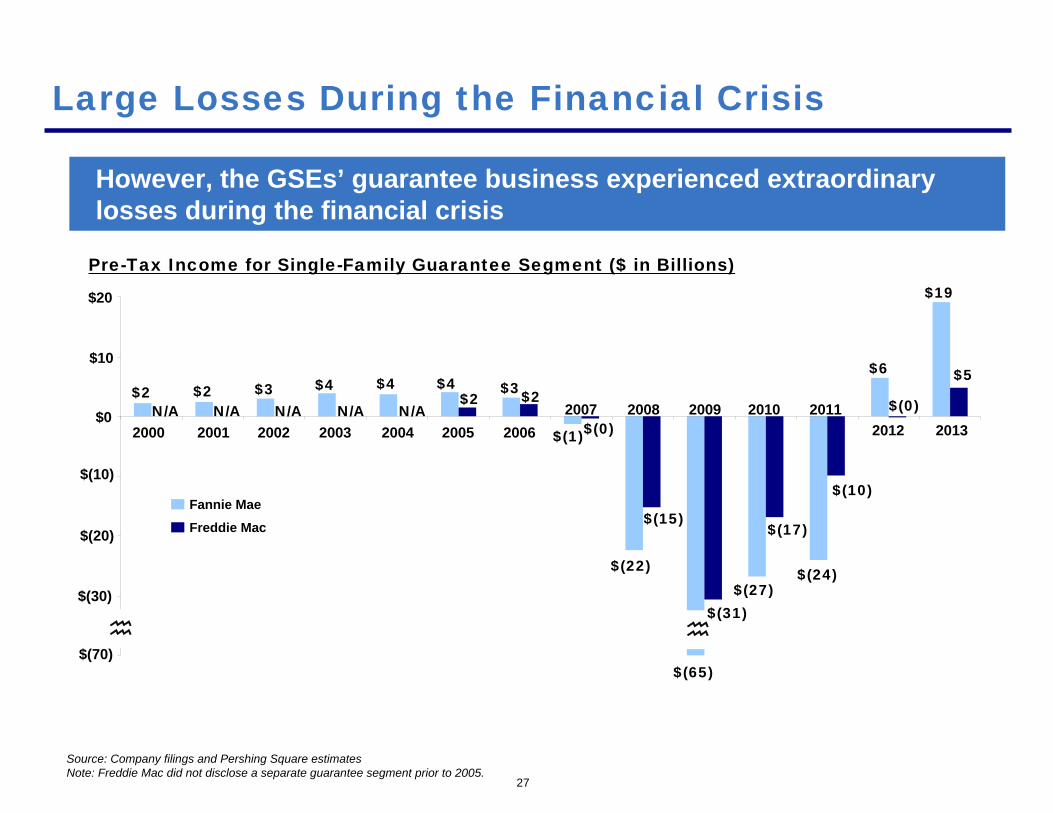
Large Losses During the Financial Crisis
However, the GSEs’ guarantee business experienced extraordinary losses during the financial crisis
Pre-Tax Income for Single-Family Guarantee Segment ($ in Billions)
2000 2001 2002 2003 2004 2005 20062007 2008 2009 2010 2011
2013
$10
$0
$(10)
$(20)
$(30)
$(70)
$2 $2 $3 $4 $4 $4 $3
$(1)
$(22)
$(65)
$(27)$(24)
$6
N/A N/A N/A N/A N/A$2 $2
$(0)
$(15)
$(31)
$(17)
$(10)
$(0)
Freddie Mac
Fannie Mae
Source: Company filings and Pershing Square estimatesNote: Freddie Mac did not disclose a separate guarantee segment prior to 2005.
$20
2012
$19
$5
($150)
($125)
($100)
($75)
($50)
($25)
$0
$25
28
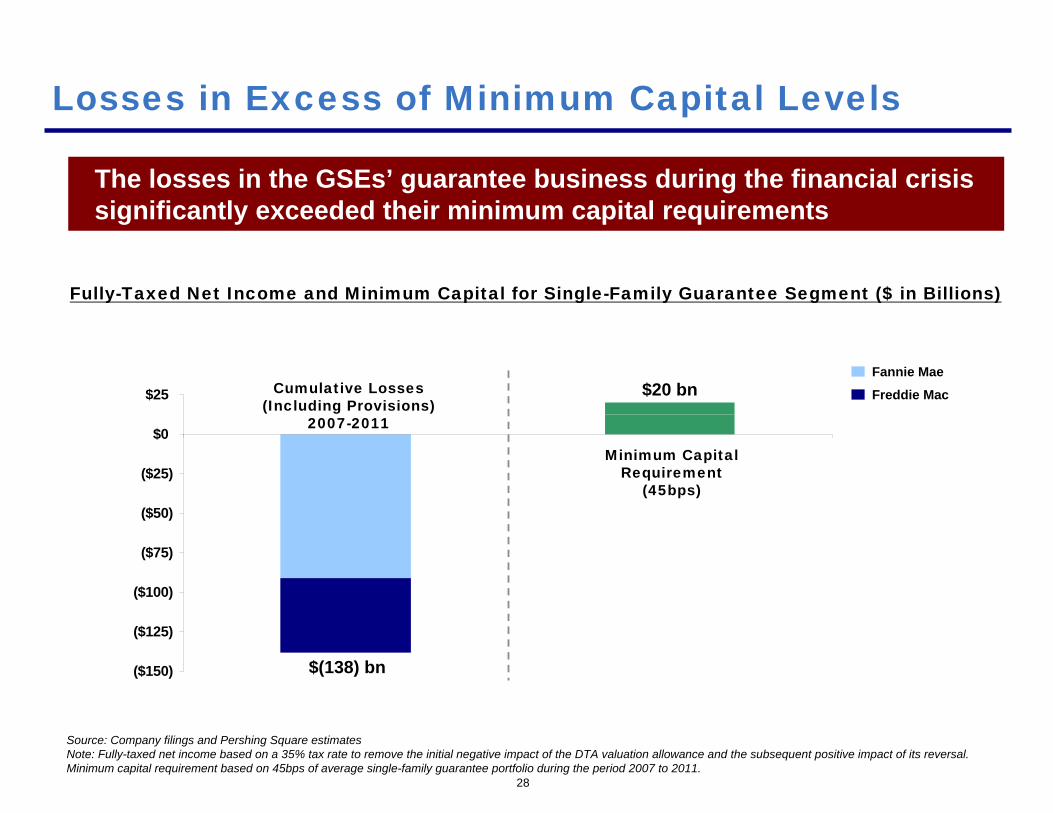
Losses in Excess of Minimum Capital Levels
The losses in the GSEs’ guarantee business during the financial crisis significantly exceeded their minimum capital requirements
Fully-Taxed Net Income and Minimum Capital for Single-Family Guarantee Segment ($ in Billions)
Cumulative Losses(Including Provisions)
2007-2011
Minimum CapitalRequirement
(45bps)
Source: Company filings and Pershing Square estimatesNote: Fully-taxed net income based on a 35% tax rate to remove the initial negative impact of the DTA valuation allowance and the subsequent positive impact of its reversal. Minimum capital requirement based on 45bps of average single-family guarantee portfolio during the period 2007 to 2011.
Freddie Mac
Fannie Mae
$(138) bn
$20 bn
$0
$50
$100
$150
$200
$250
$300
2007 2008 2009 2010 2011 Cumulative
29
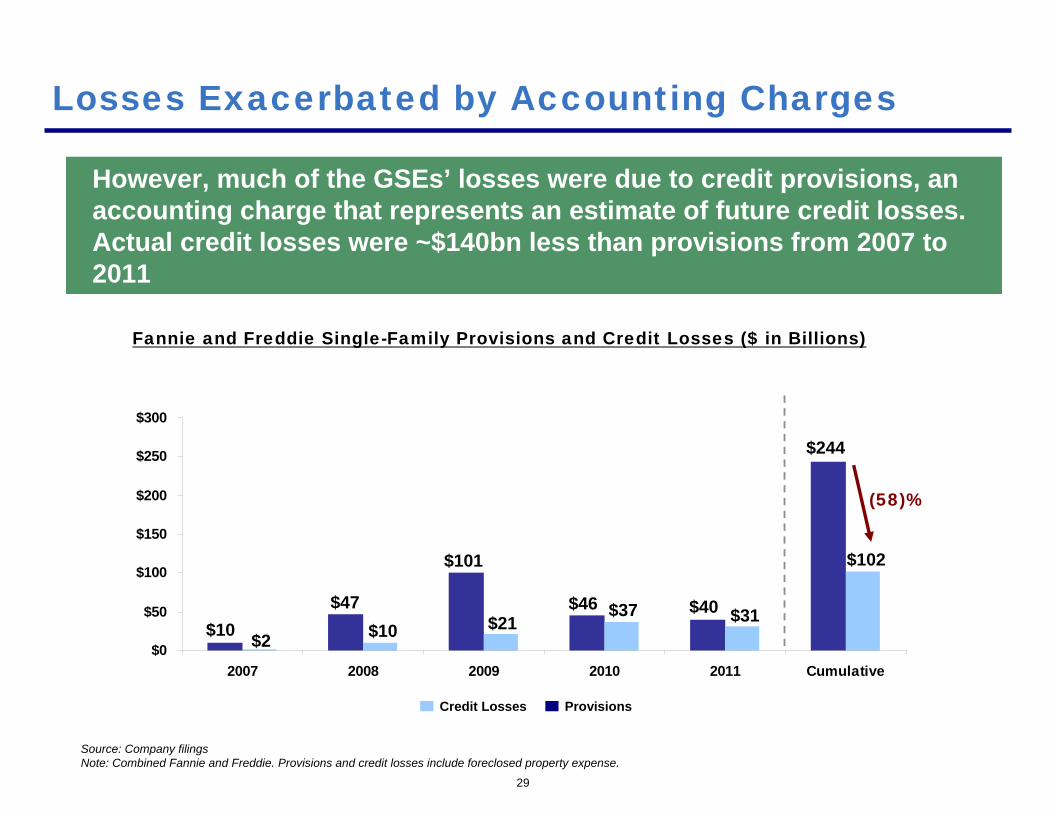
Losses Exacerbated by Accounting Charges
However, much of the GSEs’ losses were due to credit provisions, an accounting charge that represents an estimate of future credit losses. Actual credit losses were ~$140bn less than provisions from 2007 to 2011
Fannie and Freddie Single-Family Provisions and Credit Losses ($ in Billions)
Source: Company filingsNote: Combined Fannie and Freddie. Provisions and credit losses include foreclosed property expense.
$10$47
$2
$101
$46 $40$10 $21
$37 $31
ProvisionsCredit Losses
$244
$102
(58)%
($50)
($25)
$0
$25
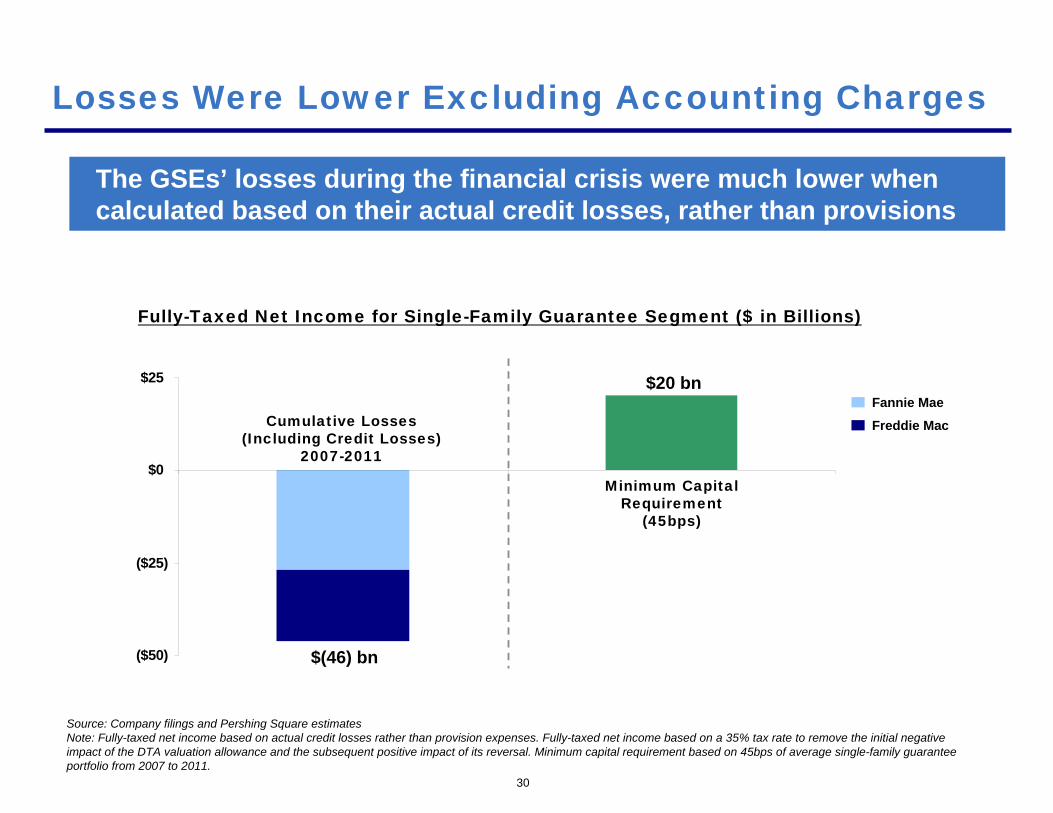
Source: Company filings and Pershing Square estimatesNote: Fully-taxed net income based on actual credit losses rather than provision expenses. Fully-taxed net income based on a 35% tax rate to remove the initial negative impact of the DTA valuation allowance and the subsequent positive impact of its reversal. Minimum capital requirement based on 45bps of average single-family guarantee portfolio from 2007 to 2011.
30
Losses Were Lower Excluding Accounting Charges
The GSEs’ losses during the financial crisis were much lower when calculated based on their actual credit losses, rather than provisions
Fully-Taxed Net Income for Single-Family Guarantee Segment ($ in Billions)
Cumulative Losses(Including Credit Losses)
2007-2011
Minimum CapitalRequirement
(45bps)
Freddie Mac
Fannie Mae
$(46) bn
$20 bn
0%
10%
20%
30%
40%
50%
31
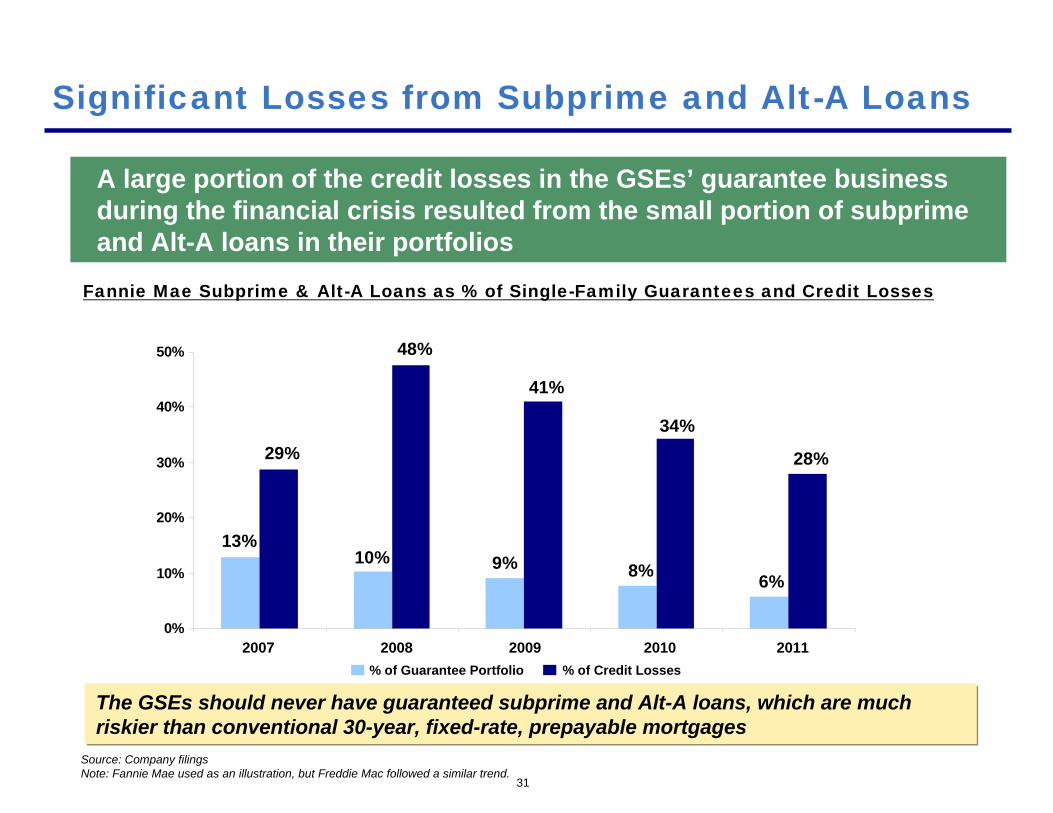
Significant Losses from Subprime and Alt-A Loans
A large portion of the credit losses in the GSEs’ guarantee business during the financial crisis resulted from the small portion of subprimeand Alt-A loans in their portfolios
Fannie Mae Subprime & Alt-A Loans as % of Single-Family Guarantees and Credit Losses
13%
% of Credit Losses% of Guarantee Portfolio2007 2008 2009 2010 2011
10% 9% 8% 6%
Source: Company filingsNote: Fannie Mae used as an illustration, but Freddie Mac followed a similar trend.
29%
48%
41%
34%
28%
The GSEs should never have guaranteed subprime and Alt-A loans, which are much riskier than conventional 30-year, fixed-rate, prepayable mortgages
($30)
($20)
($10)
$0
$10
$20
$30
Source: Company filings and Pershing Square estimatesNote: Fully-taxed net income based on credit losses, excluding the elevated credit losses in the subprime and Alt-A loans and assumes credit losses for subprime and Alt-A loans occurred at a similar rate as non-subprime and Alt-A loans. Assumes similar levels of subprime and Alt-A loans for Freddie Mac as for Fannie Mae. Fully-taxed net income based on a 35% tax rate to remove the initial negative impact of the DTA valuation allowance and the subsequent positive impact of its reversal. Minimum capital requirement based on 45bps of average single-family guarantee portfolio from 2007 to 2011.
32
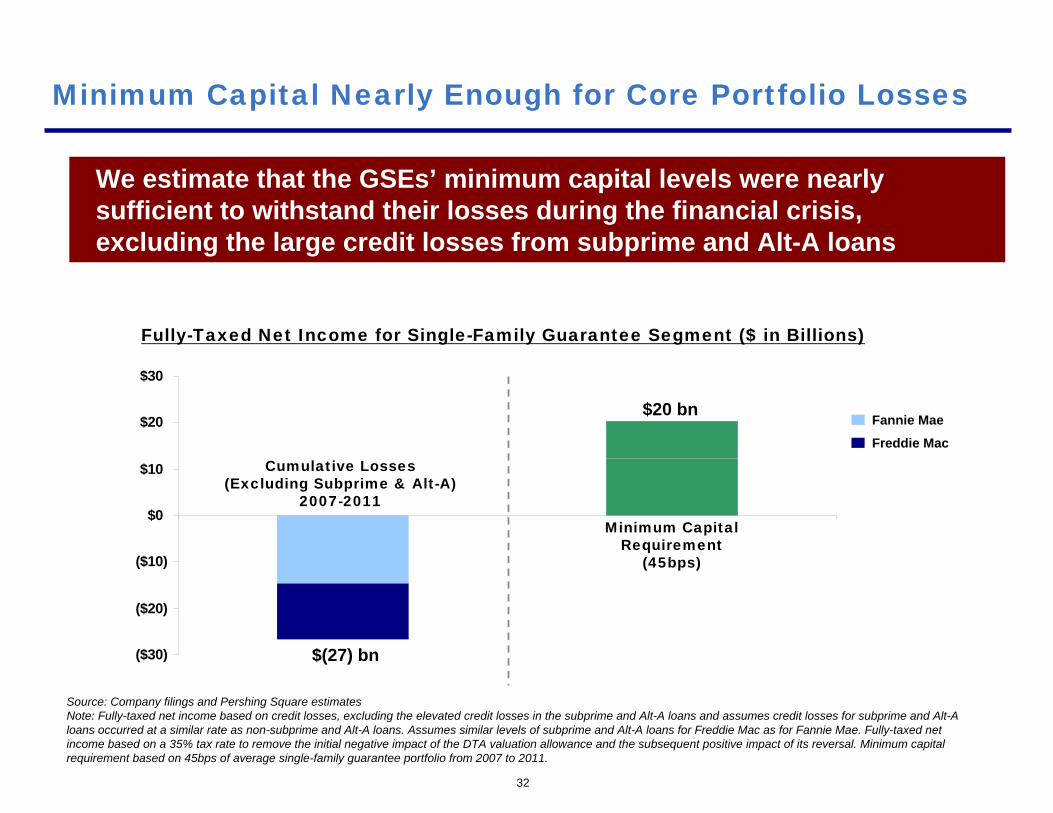
Minimum Capital Nearly Enough for Core Portfolio Losses
We estimate that the GSEs’ minimum capital levels were nearly sufficient to withstand their losses during the financial crisis, excluding the large credit losses from subprime and Alt-A loans
Fully-Taxed Net Income for Single-Family Guarantee Segment ($ in Billions)
Cumulative Losses(Excluding Subprime & Alt-A)
2007-2011
Minimum CapitalRequirement
(45bps)
Freddie Mac
Fannie Mae
$(27) bn
$20 bn
($4)
($2)
$0
$2
$4
$6
$8
$10
33
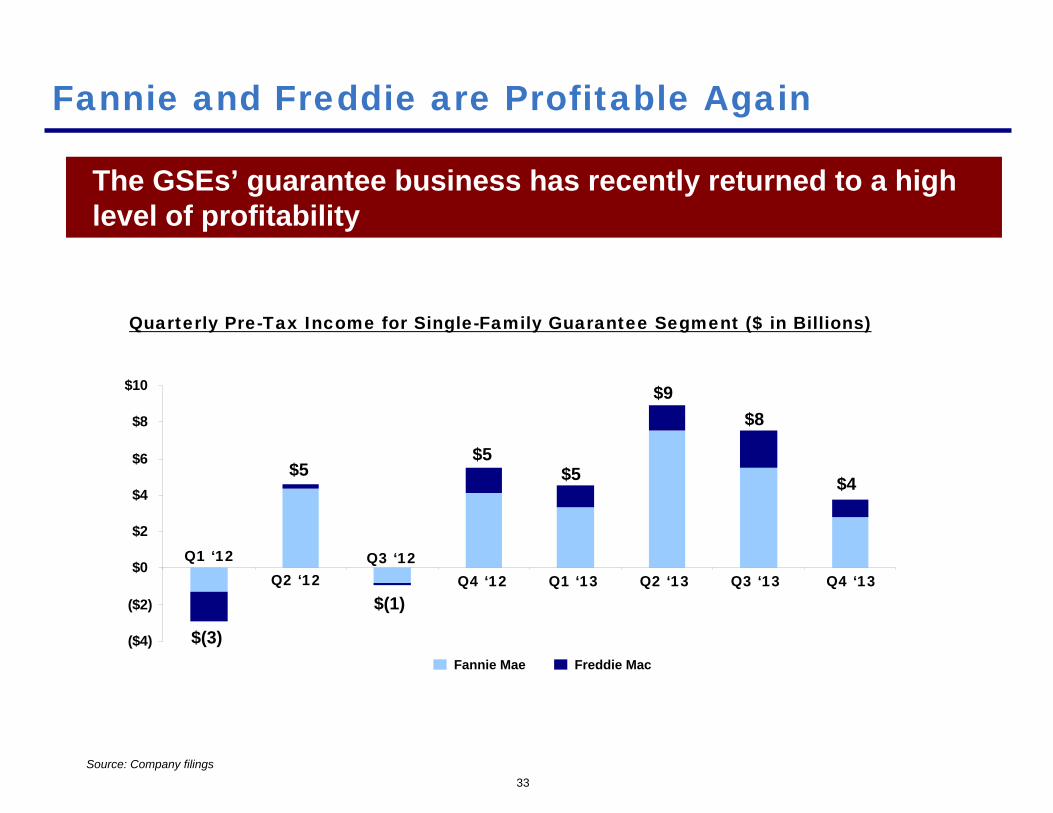
Fannie and Freddie are Profitable Again
The GSEs’ guarantee business has recently returned to a high level of profitability
Quarterly Pre-Tax Income for Single-Family Guarantee Segment ($ in Billions)
$(3)
$5$5
$5
$9$8
Freddie MacFannie Mae
Source: Company filings
Q1 ‘12Q2 ‘12 Q3 ‘13
$(1)
Q3 ‘12Q4 ‘12 Q1 ‘13 Q2 ‘13 Q4 ‘13
$4
0
10
20
30
40
50
60
70
2008 2009 2010 2011 2012 2013 Q4 '13
34
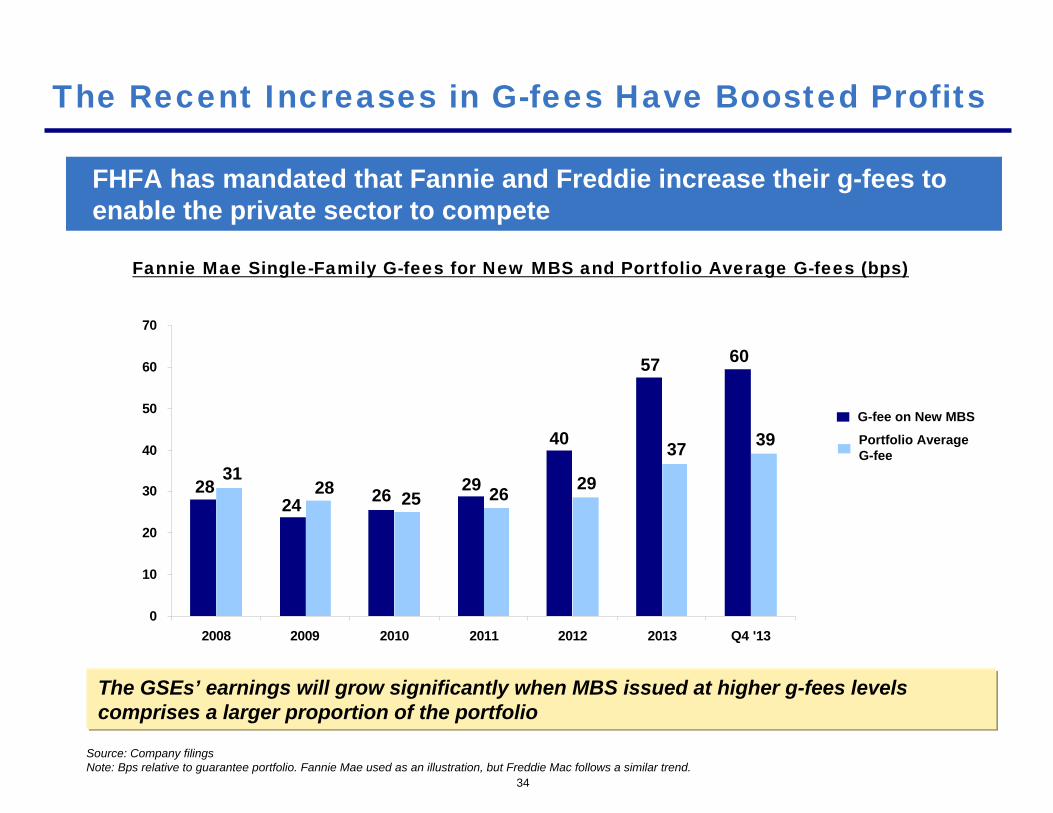
The Recent Increases in G-fees Have Boosted Profits
FHFA has mandated that Fannie and Freddie increase their g-fees to enable the private sector to compete
Source: Company filingsNote: Bps relative to guarantee portfolio. Fannie Mae used as an illustration, but Freddie Mac follows a similar trend.
Fannie Mae Single-Family G-fees for New MBS and Portfolio Average G-fees (bps)
2824 26 29
40
57 60
3128 25 26 29
37 39G-fee on New MBS
Portfolio AverageG-fee
The GSEs’ earnings will grow significantly when MBS issued at higher g-fees levels comprises a larger proportion of the portfolio
0
10
20
30
40
50
60
70
80
90
2007 2008 2009 2010 2011 2012 2013 Q4 '13
35
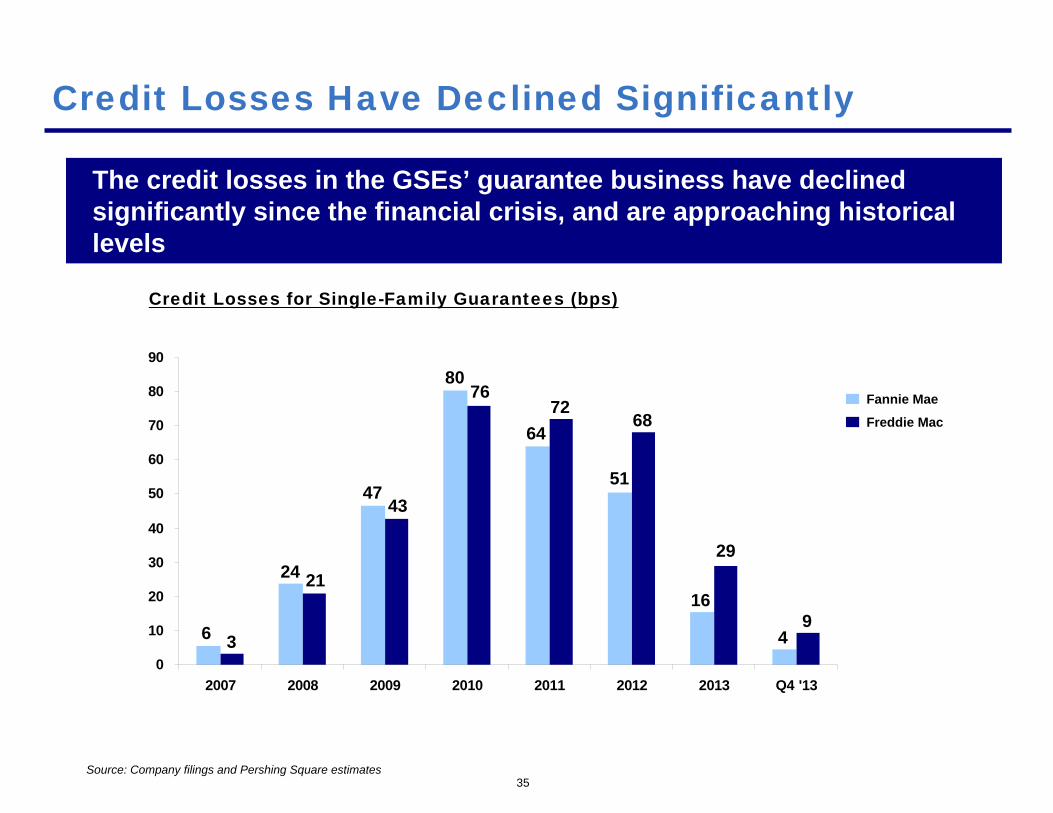
Credit Losses Have Declined Significantly
The credit losses in the GSEs’ guarantee business have declined significantly since the financial crisis, and are approaching historical levels
Source: Company filings and Pershing Square estimates
Credit Losses for Single-Family Guarantees (bps)
6
24
47
80
64
51
16
43
21
43
7672
68
29
9
Freddie Mac
Fannie Mae
$0
$5
$10
$15
36
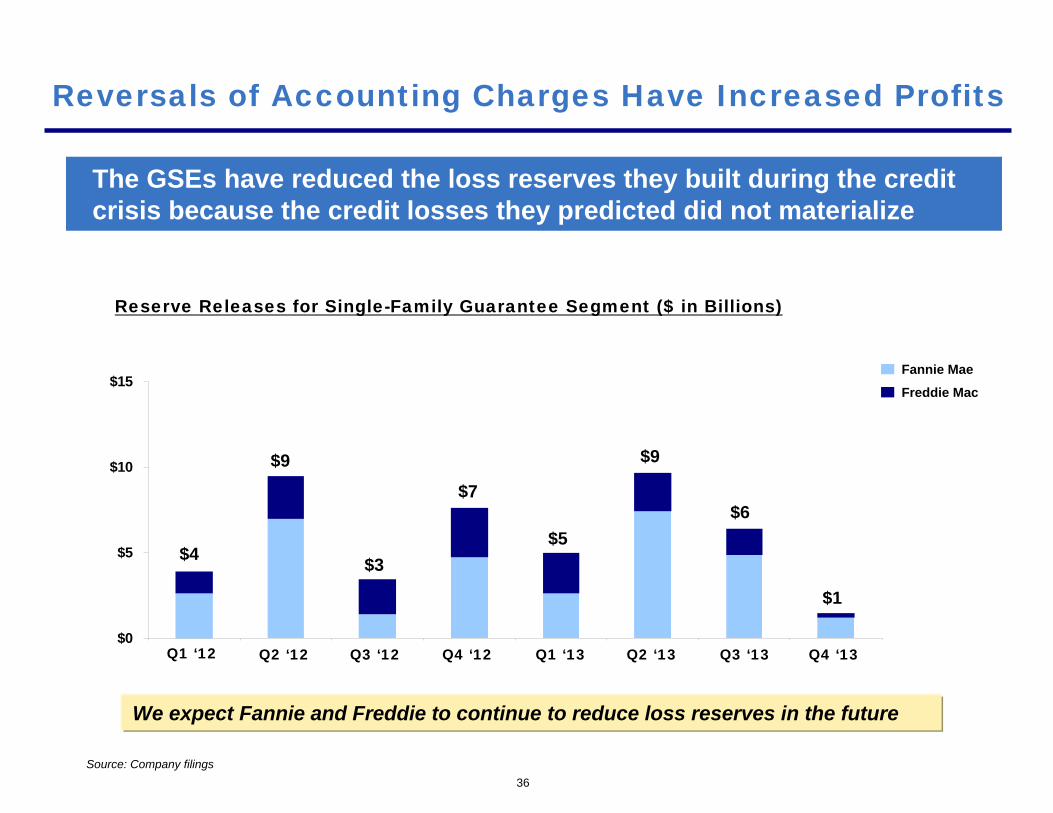
Reversals of Accounting Charges Have Increased Profits
The GSEs have reduced the loss reserves they built during the credit crisis because the credit losses they predicted did not materialize
Reserve Releases for Single-Family Guarantee Segment ($ in Billions)
$4
$9
$7
$5
$9
$6
Source: Company filings
Q1 ‘12 Q2 ‘12 Q3 ‘13
$3
Q3 ‘12 Q4 ‘12 Q1 ‘13 Q2 ‘13
Freddie Mac
Fannie Mae
We expect Fannie and Freddie to continue to reduce loss reserves in the future
Q4 ‘13
$1
Fixed-Income Arbitrage Business (FIA) –The GSEs’ Investment Portfolio
38
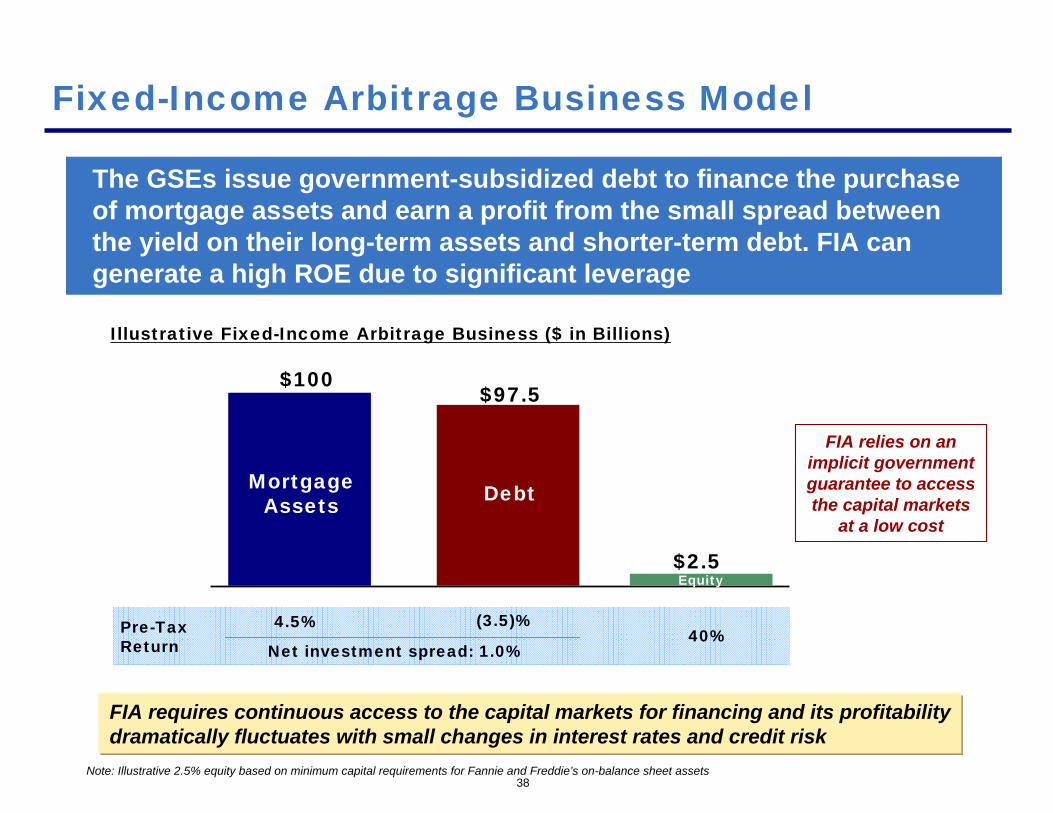
Fixed-Income Arbitrage Business Model
The GSEs issue government-subsidized debt to finance the purchase of mortgage assets and earn a profit from the small spread between the yield on their long-term assets and shorter-term debt. FIA can generate a high ROE due to significant leverage
FIA requires continuous access to the capital markets for financing and its profitability dramatically fluctuates with small changes in interest rates and credit risk
$100
MortgageAssets
$97.5
Debt
Equity$2.5
Illustrative Fixed-Income Arbitrage Business ($ in Billions)
Pre-Tax Return
4.5% (3.5)%40%
Note: Illustrative 2.5% equity based on minimum capital requirements for Fannie and Freddie’s on-balance sheet assets
Net investment spread: 1.0%
FIA relies on an implicit government guarantee to access the capital markets
at a low cost
39
FIA Serves No Credible Purpose for the Mortgage Market
- Alan Greenspan, 5/19/2005
“The Federal Reserve Board has been unable to find any credible purpose for the huge balance sheets built by Fannie and Freddie other than the creation of profit through the exploitation of the market-granted subsidy. Fannie's and Freddie's purchases of their own or each other's mortgage-backed securities with their market-subsidized debt do not contribute usefully to mortgage market liquidity, to the enhancement of capital markets in the United States, or to the lowering of mortgage rates for homeowners.”
$0
$200
$400
$600
$800
$1,000
$1,200
$1,400
$1,600
$1,800
1990 1991 1992 1993 1994 1995 1996 1997 1998 1999 2000 20012002 2003 2004 2005 2006 2007 2008 2009 2010 2011 2012 2013
40
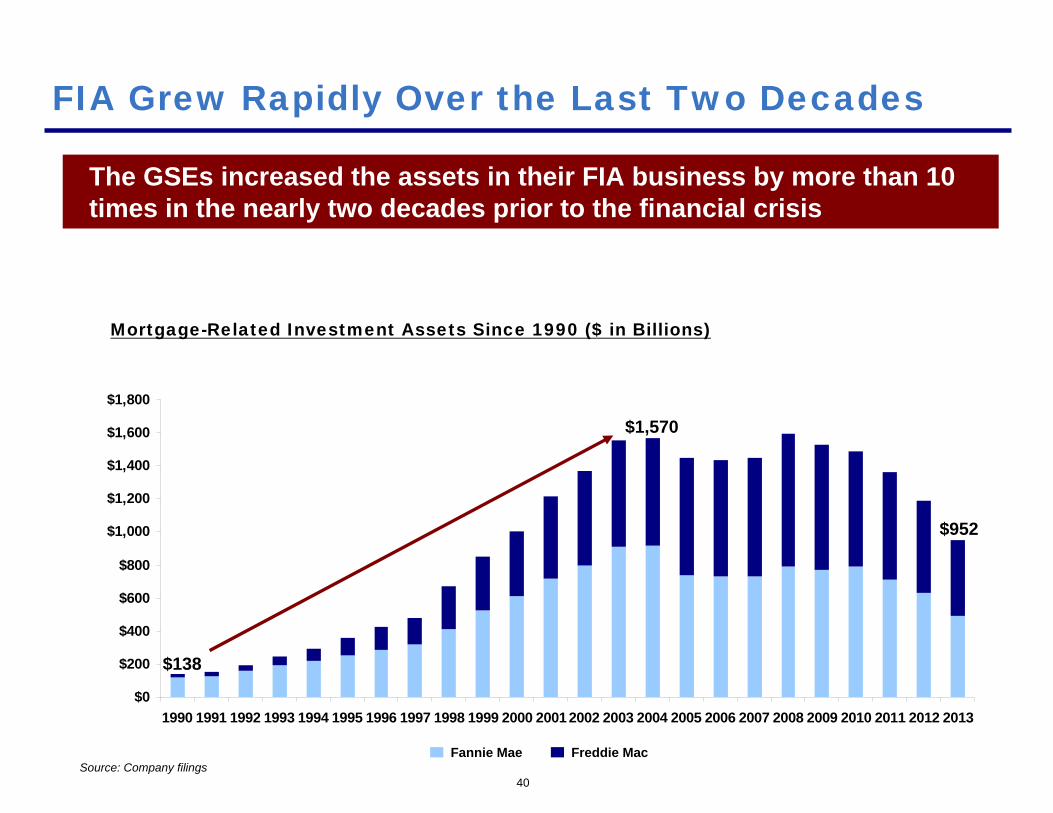
FIA Grew Rapidly Over the Last Two Decades
The GSEs increased the assets in their FIA business by more than 10 times in the nearly two decades prior to the financial crisis
Mortgage-Related Investment Assets Since 1990 ($ in Billions)
Freddie MacFannie Mae
$138
$1,570
$952
Source: Company filings
$0
$50
$100
$150
$200
$250
41
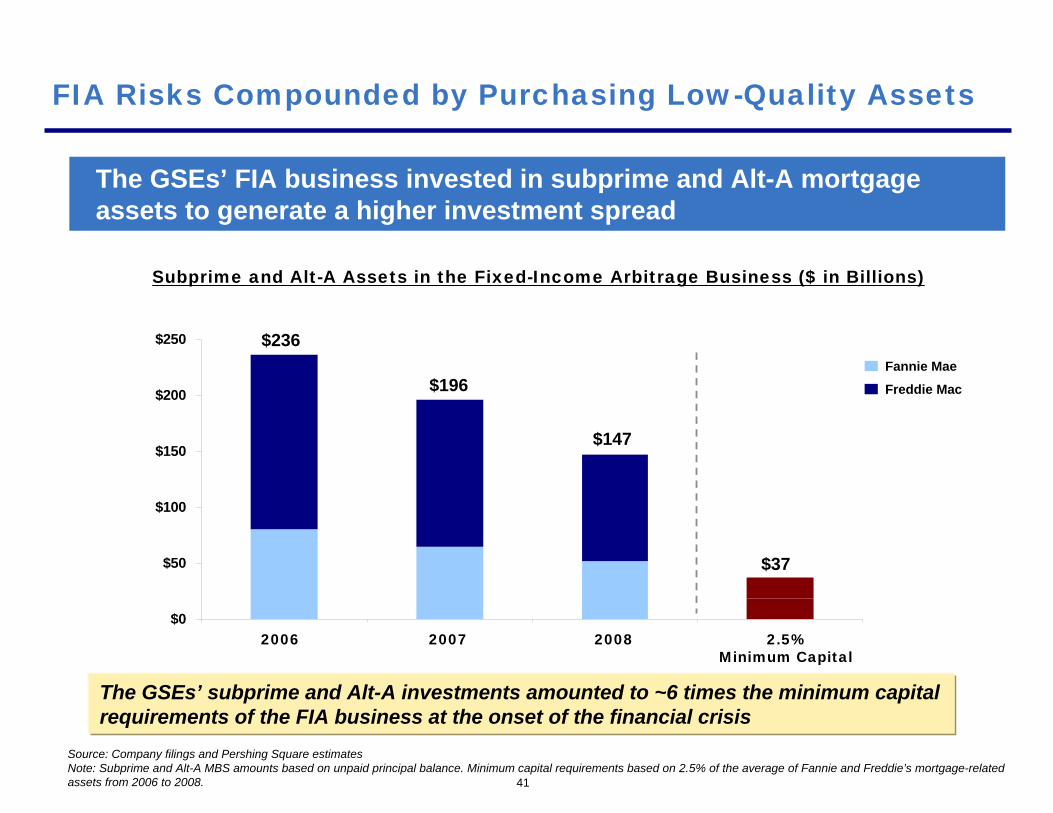
FIA Risks Compounded by Purchasing Low-Quality Assets
The GSEs’ FIA business invested in subprime and Alt-A mortgage assets to generate a higher investment spread
Subprime and Alt-A Assets in the Fixed-Income Arbitrage Business ($ in Billions)
$236
2006
$196
2007 2008 2.5% Minimum Capital
$147
$37
Source: Company filings and Pershing Square estimatesNote: Subprime and Alt-A MBS amounts based on unpaid principal balance. Minimum capital requirements based on 2.5% of the average of Fannie and Freddie’s mortgage-related assets from 2006 to 2008.
Freddie Mac
Fannie Mae
The GSEs’ subprime and Alt-A investments amounted to ~6 times the minimum capital requirements of the FIA business at the onset of the financial crisis
$0
$2
$4
$6
$8
$10
2000 2001 2002 2003 2004 2005 2006
42
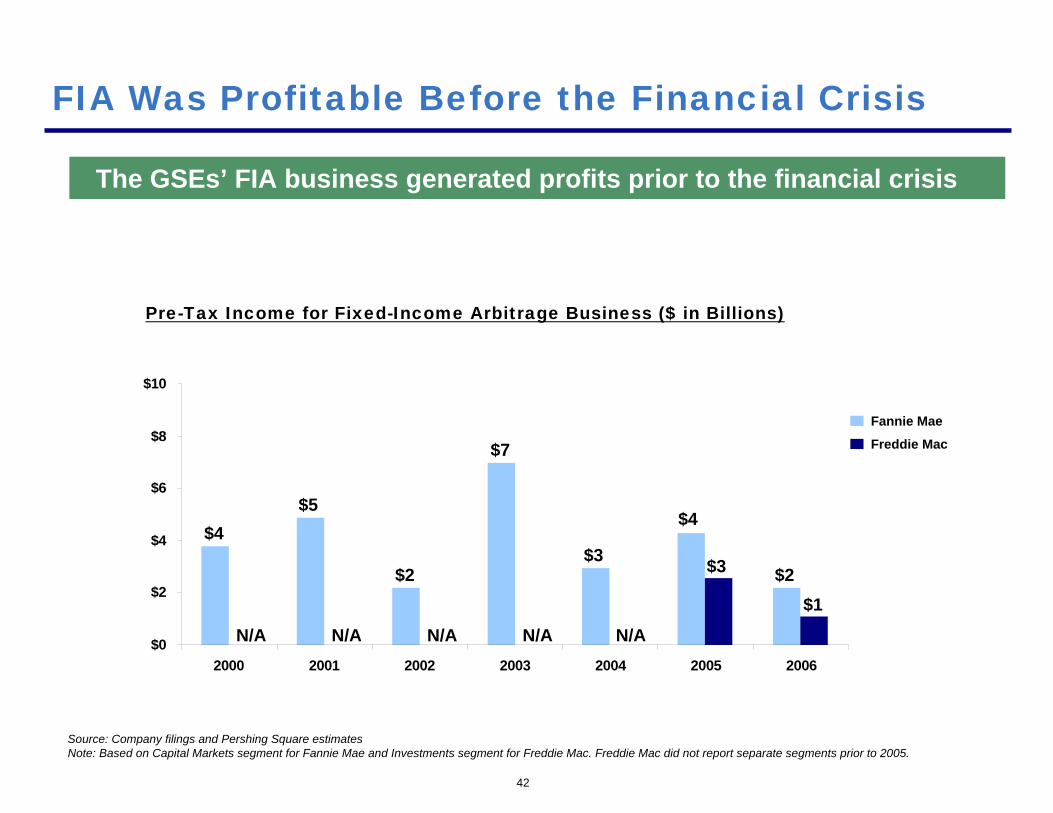
FIA Was Profitable Before the Financial Crisis
The GSEs’ FIA business generated profits prior to the financial crisis
Pre-Tax Income for Fixed-Income Arbitrage Business ($ in Billions)
$4$5
$2
$7
$3
$4
$2$1
$3
N/AN/AN/AN/AN/A
Source: Company filings and Pershing Square estimatesNote: Based on Capital Markets segment for Fannie Mae and Investments segment for Freddie Mac. Freddie Mac did not report separate segments prior to 2005.
Freddie Mac
Fannie Mae
43
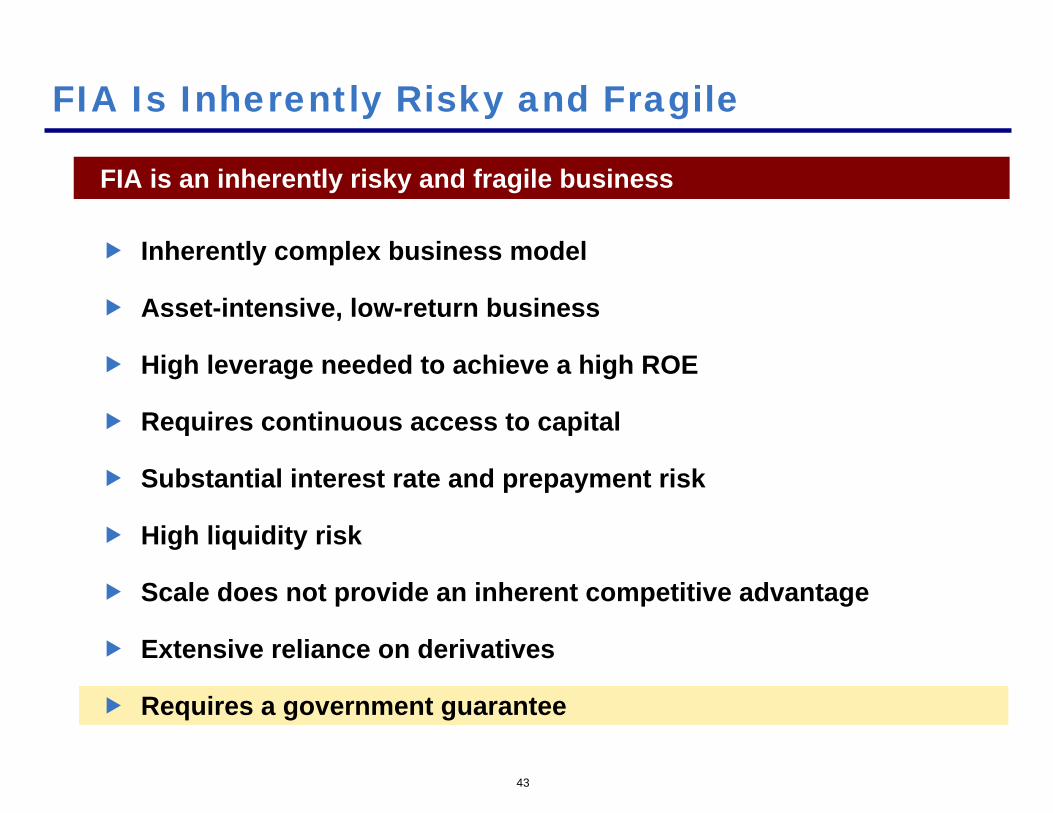
FIA is an inherently risky and fragile business
FIA Is Inherently Risky and Fragile
Inherently complex business model
Asset-intensive, low-return business
High leverage needed to achieve a high ROE
Requires continuous access to capital
Substantial interest rate and prepayment risk
High liquidity risk
Scale does not provide an inherent competitive advantage
Extensive reliance on derivatives
Requires a government guarantee
44
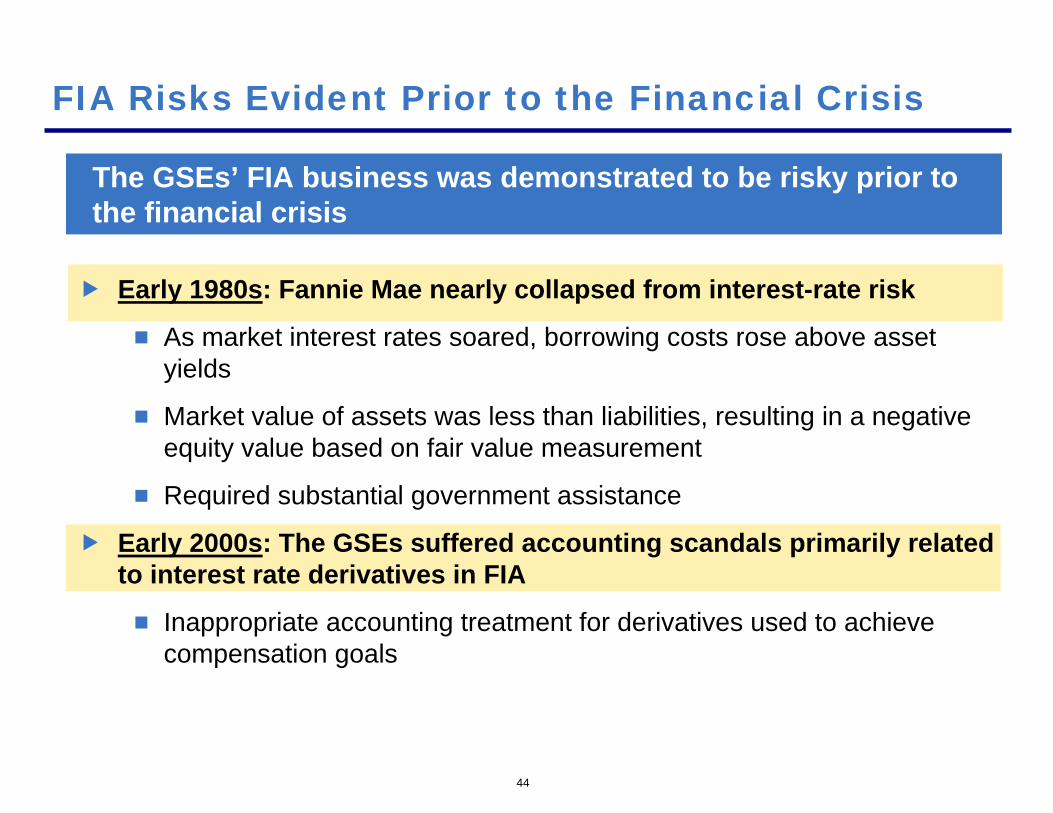
FIA Risks Evident Prior to the Financial Crisis
The GSEs’ FIA business was demonstrated to be risky prior to the financial crisis
Early 1980s: Fannie Mae nearly collapsed from interest-rate risk
As market interest rates soared, borrowing costs rose above asset yields
Market value of assets was less than liabilities, resulting in a negative equity value based on fair value measurement
Required substantial government assistance
Early 2000s: The GSEs suffered accounting scandals primarily related to interest rate derivatives in FIA
Inappropriate accounting treatment for derivatives used to achieve compensation goals
45
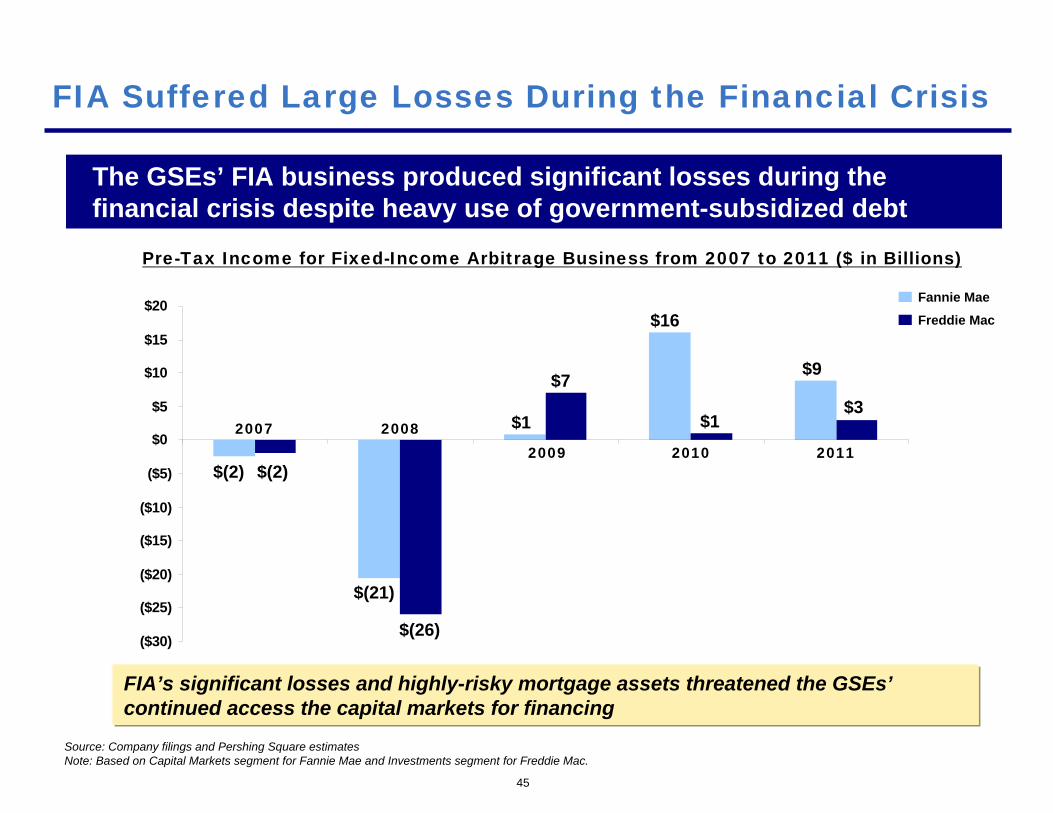
FIA Suffered Large Losses During the Financial Crisis
The GSEs’ FIA business produced significant losses during the financial crisis despite heavy use of government-subsidized debt
Pre-Tax Income for Fixed-Income Arbitrage Business from 2007 to 2011 ($ in Billions)
Source: Company filings and Pershing Square estimatesNote: Based on Capital Markets segment for Fannie Mae and Investments segment for Freddie Mac.
($30)
($25)
($20)
($15)
($10)
($5)
$0
$5
$10
$15
$20Freddie Mac
Fannie Mae
$(2)
$(21)
$1
$16
$9
$(2)
$(26)
$7
$1$3
2007 20082009 2010 2011
FIA’s significant losses and highly-risky mortgage assets threatened the GSEs’continued access the capital markets for financing
$0
$500
$1,000
$1,500
$2,000
46
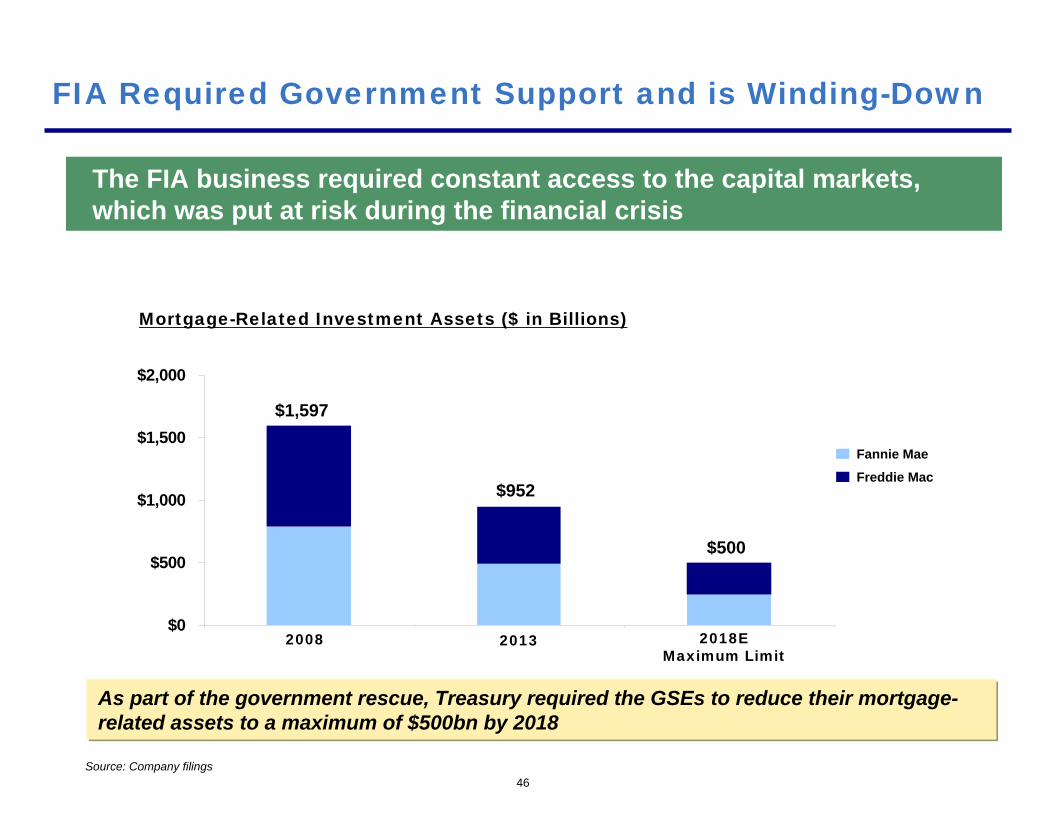
FIA Required Government Support and is Winding-Down
The FIA business required constant access to the capital markets, which was put at risk during the financial crisis
Mortgage-Related Investment Assets ($ in Billions)
Freddie Mac
Fannie Mae
2013 2018EMaximum Limit
$952
$500
Source: Company filings
As part of the government rescue, Treasury required the GSEs to reduce their mortgage-related assets to a maximum of $500bn by 2018
2008
$1,597

Conservatorship and the Net Worth Sweep
48
Conservatorship
On Sept. 6, 2008, the government placed the GSEs into conservatorship with the objective of returning them to normal operations when their businesses stabilized
- James Lockhart, FHFA Director, 9/7/2008
“Therefore, in order to restore the balance between safety and soundness and mission, FHFA has placed Fannie Mae and Freddie Mac into conservatorship. That is a statutory process designed to stabilize a troubled institution with the objective of returning the entities to normal business operations. FHFA will act as the conservator to operate the Enterprises until they are stabilized.”
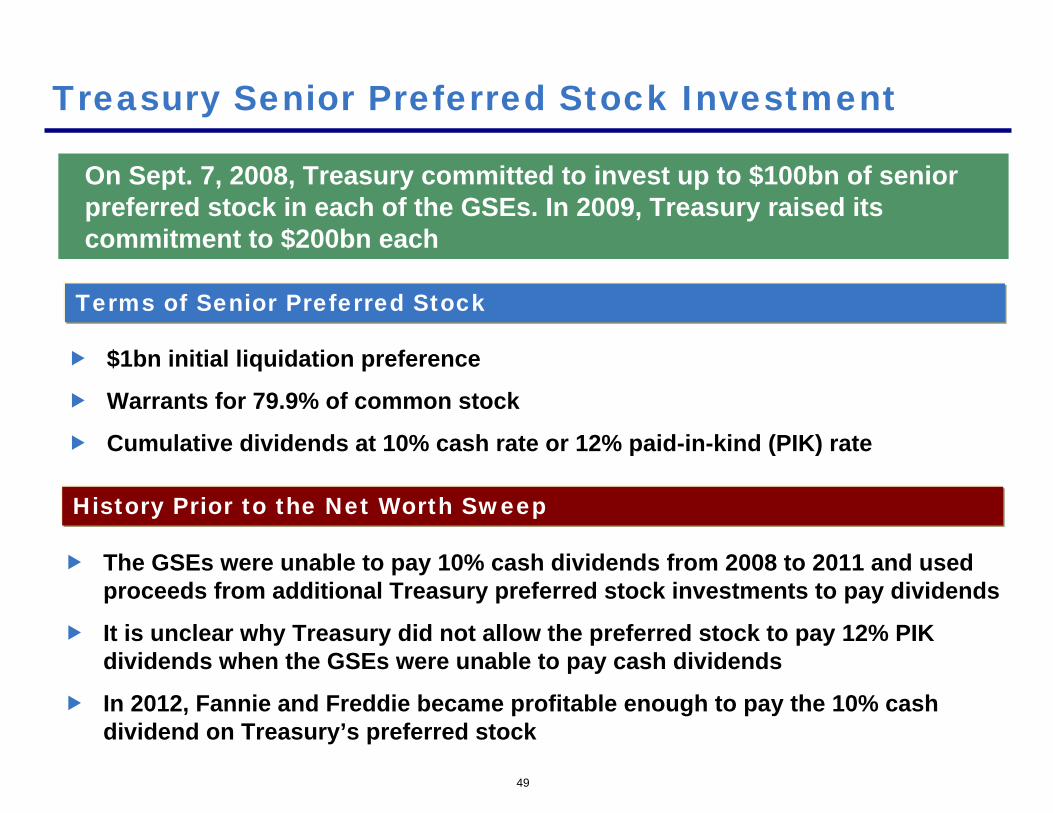
On Sept. 7, 2008, Treasury committed to invest up to $100bn of senior preferred stock in each of the GSEs. In 2009, Treasury raised its commitment to $200bn each
49
Treasury Senior Preferred Stock Investment
$1bn initial liquidation preference
Warrants for 79.9% of common stock
Cumulative dividends at 10% cash rate or 12% paid-in-kind (PIK) rate
Terms of Senior Preferred Stock
The GSEs were unable to pay 10% cash dividends from 2008 to 2011 and used proceeds from additional Treasury preferred stock investments to pay dividends
It is unclear why Treasury did not allow the preferred stock to pay 12% PIK dividends when the GSEs were unable to pay cash dividends
In 2012, Fannie and Freddie became profitable enough to pay the 10% cash dividend on Treasury’s preferred stock
History Prior to the Net Worth Sweep
($10)
$0
$10
$20
$30
$40
$50
$60
50
The Net Worth Sweep
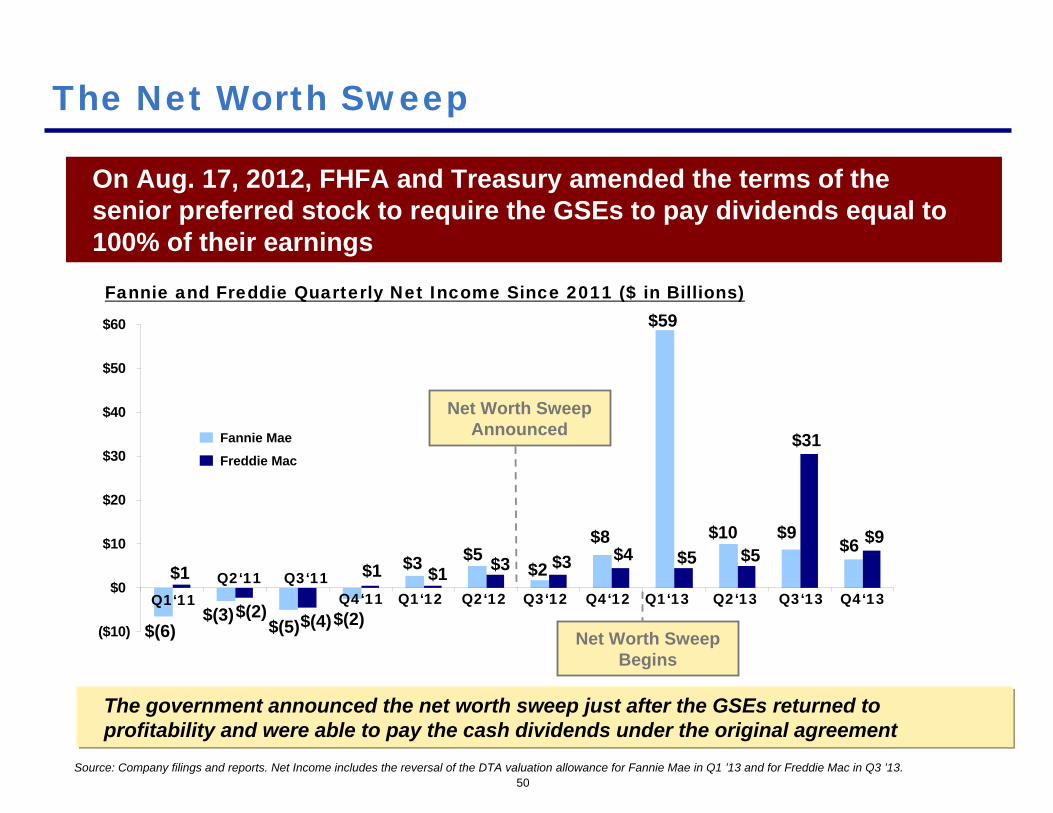
On Aug. 17, 2012, FHFA and Treasury amended the terms of the senior preferred stock to require the GSEs to pay dividends equal to 100% of their earnings
Fannie and Freddie Quarterly Net Income Since 2011 ($ in Billions)
Source: Company filings and reports. Net Income includes the reversal of the DTA valuation allowance for Fannie Mae in Q1 ’13 and for Freddie Mac in Q3 ’13.
$59
$31
$(6)$(3) $(5) $(2)
$3 $5$2
$8 $10 $9
Q1‘11Q2‘11 Q3‘11
Q4‘11 Q1‘12 Q2‘12 Q3‘12 Q4‘12 Q1‘13 Q2‘13 Q3‘13$1
$(2) $(4)
$1 $1 $3 $3 $4 $5 $5
Net Worth Sweep Announced
Net Worth Sweep Begins
Freddie Mac
Fannie Mae
The government announced the net worth sweep just after the GSEs returned to profitability and were able to pay the cash dividends under the original agreement
Q4‘13
$9$6
51
Net Worth Sweep Was Unlawful
The net worth sweep was an illegal action that we believe will ultimately be reversed by the courts
Several of the GSEs’ shareholders have sued Treasury and FHFA, and their lawsuits have experienced favorable developments
Amounts to an unconstitutional taking without just compensationViolates the 5th amendment
Exceeded the scope of FHFA’s authority as conservatorEffects a wind-down, which is inconsistent with the responsibility to preserve and conserve Fannie and Freddie’s assets
Exceeded Treasury’s investment authorizationSubstantively amounts to a purchase of a new security
Treasury’s authorization to purchase new securities ended on Dec. 31, 2009
The Net Worth Sweep:
$0
$25
$50
$75
$100
$125
$150
$175
$200
$225
2008 2009 2010 2011 2012 2013 Q1 '14 Total
52
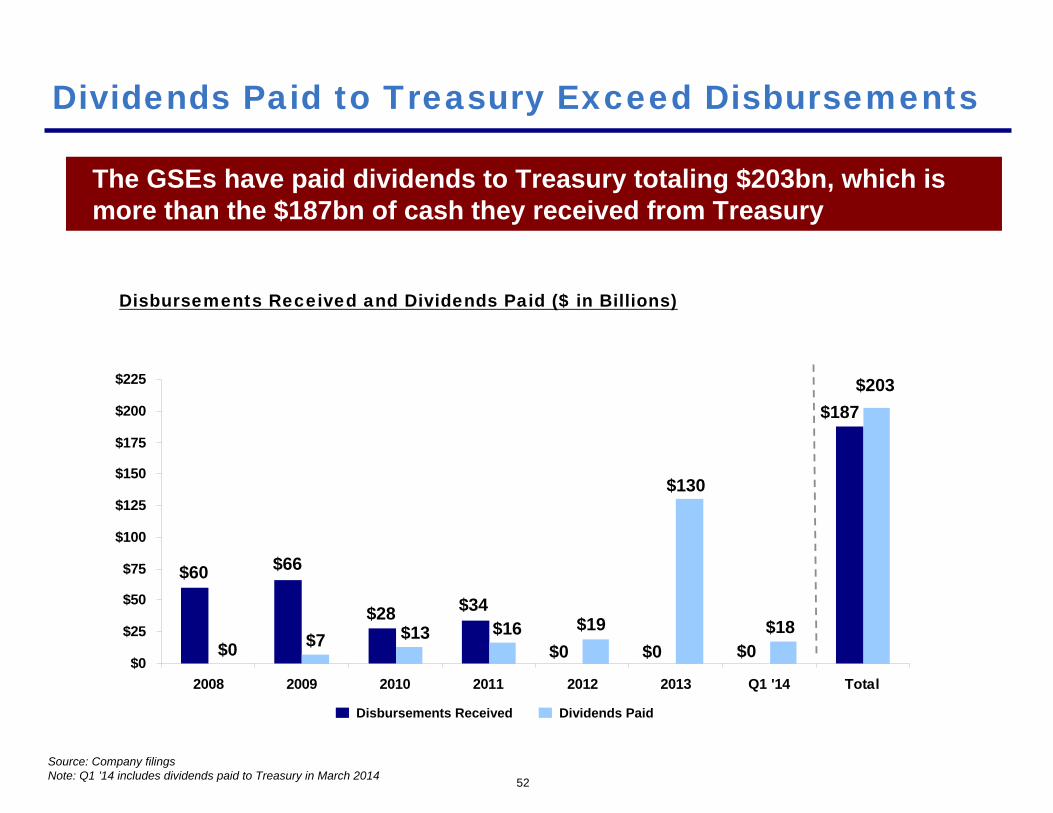
Dividends Paid to Treasury Exceed Disbursements
The GSEs have paid dividends to Treasury totaling $203bn, which is more than the $187bn of cash they received from Treasury
Disbursements Received and Dividends Paid ($ in Billions)
$60 $66
$28 $34
$0 $0
$187$203
$0 $7 $13 $16 $19
$130
Disbursements Received Dividends Paid
$18$0
Source: Company filingsNote: Q1 ’14 includes dividends paid to Treasury in March 2014
$0
$25
$50
$75
$100
$125
$150
53
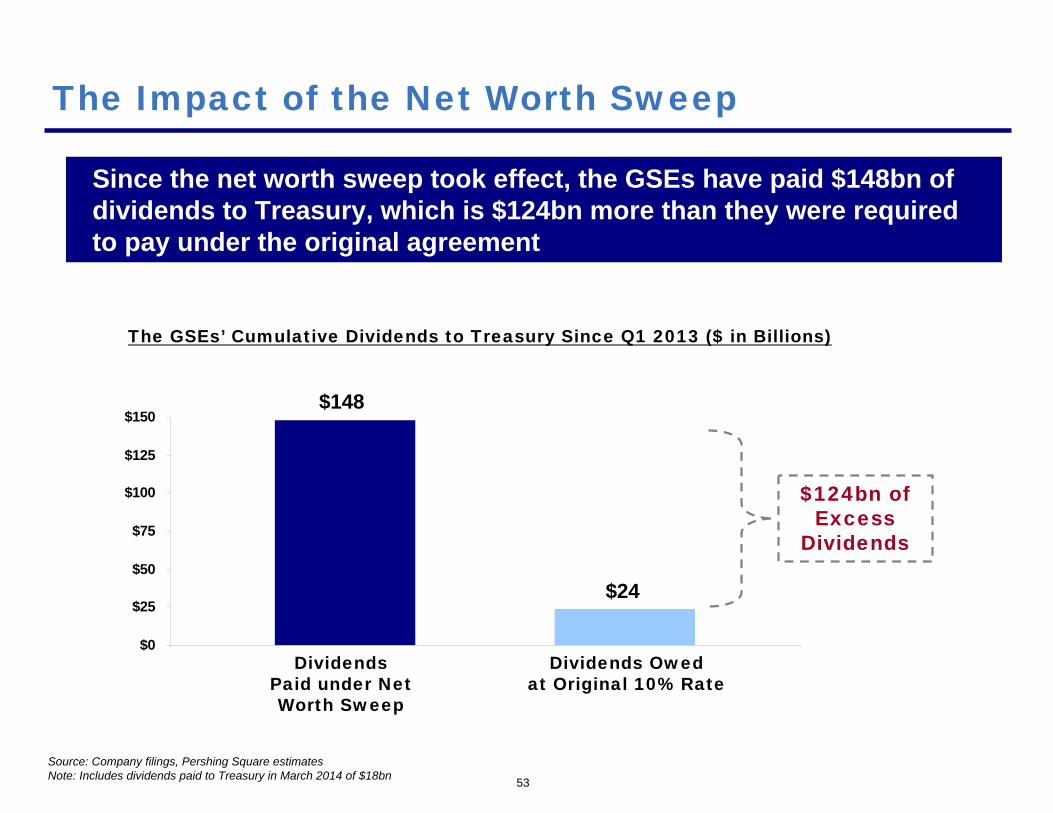
The Impact of the Net Worth Sweep
Since the net worth sweep took effect, the GSEs have paid $148bn of dividends to Treasury, which is $124bn more than they were required to pay under the original agreement
Source: Company filings, Pershing Square estimatesNote: Includes dividends paid to Treasury in March 2014 of $18bn
The GSEs’ Cumulative Dividends to Treasury Since Q1 2013 ($ in Billions)
$148
$24
DividendsPaid under Net Worth Sweep
Dividends Owedat Original 10% Rate
$124bn ofExcess
Dividends
$0
$50
$100
$150
$200
54
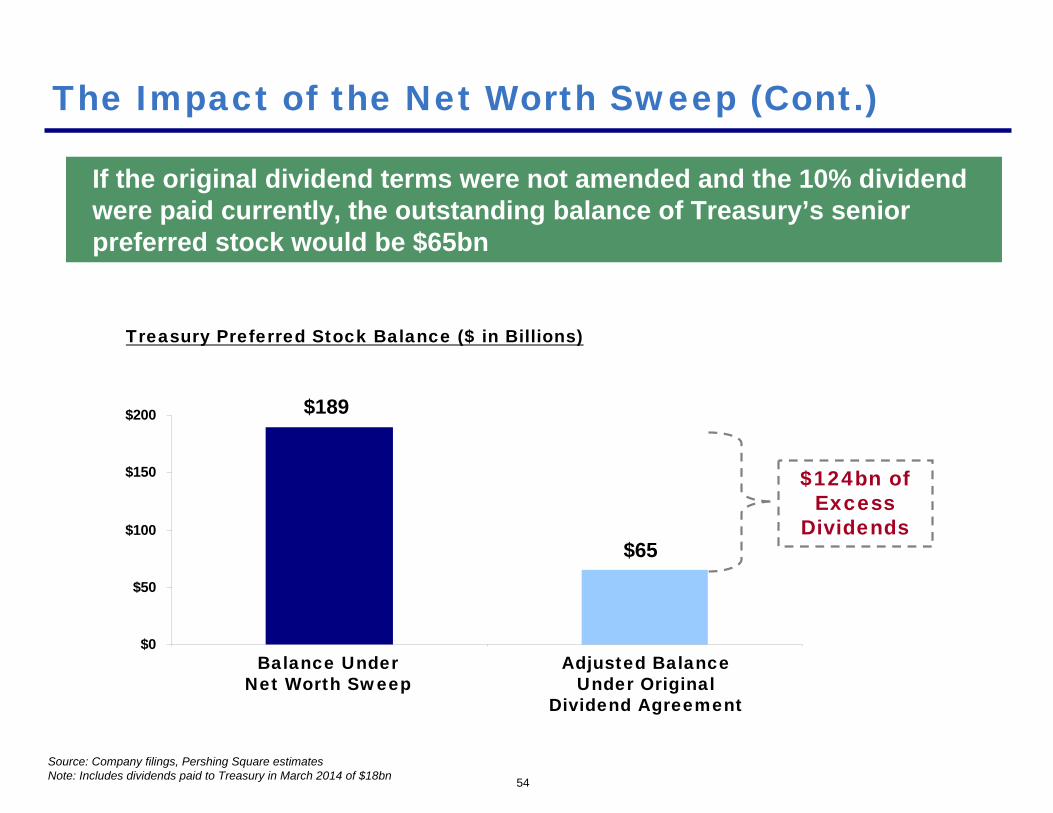
The Impact of the Net Worth Sweep (Cont.)
If the original dividend terms were not amended and the 10% dividend were paid currently, the outstanding balance of Treasury’s senior preferred stock would be $65bn
Treasury Preferred Stock Balance ($ in Billions)
$189
$65
Balance UnderNet Worth Sweep
Adjusted BalanceUnder Original
Dividend Agreement
$124bn ofExcess
Dividends
Source: Company filings, Pershing Square estimatesNote: Includes dividends paid to Treasury in March 2014 of $18bn
Recent Proposals for Housing Finance Reform
56
There have been multiple proposals for housing finance reform recently, based on similar principles and goals
Recent Proposals for Housing Finance Reform
Capital from the private sector serves as 10% first-loss credit protection for eligible MBS
U.S. government provides an explicit credit guarantee for eligible MBS that is only utilized after first-loss private capital has been exhausted
Fannie and Freddie are wound down and their role in the marketplace eliminated
Basic principles of recent proposals:
The primary goals of the recent proposals are to maintain the availability and affordability of the 30-year, fixed-rate, prepayable mortgage while protecting taxpayers from bearing the cost of a housing downturn
57
We agree with the goals of the recent proposals for housing finance reform, but believe the proposals are impractical and will work against the goals they seek to achieve
Our Perspective on Recent Proposals
Will fail to obtain the enormous amount of required first-loss capital from the private sector
Will create a new, untested mortgage finance system that will have large unintended consequences
Will result in a mortgage finance system where credit is less affordable and less available than under the current system
Will increase risk to taxpayers
Recent proposals for housing finance reform:
Prominent market participants, including Fannie and Freddie, have released detailed concerns with recent housing finance proposals
58
Recent proposals necessitate that the private sector provide as much as $500bn of first-loss capital to achieve the potential capital requirements for the existing ~$5 trillion GSE MBS portfolio
Private Sector Capital Will Not Be Sufficient
Private sector capital for new startups is unlikely and will be insufficient
Returns are uneconomic for new participants at current g-fee levels
Precedent set by the net worth sweep will discourage private capital
Existing private mortgage insurers (PMI) will not provide significant capital
Private-label securitization (PLS) will not be a meaningful source of capital
Banks will not significantly increase the amount of long-term, fixed-rate mortgages they retain on their balance sheets
Proposals will not attract the requisite amount of private capital:
By winding down Fannie and Freddie, the recent proposals eliminate the only sufficient source of private capital – the retention of the GSEs’ significant earnings power
$0
$10
$20
$30
$40
$50
$60
2004 2005 2006 2007 2008 2009 2010 2011 2012 2013
59
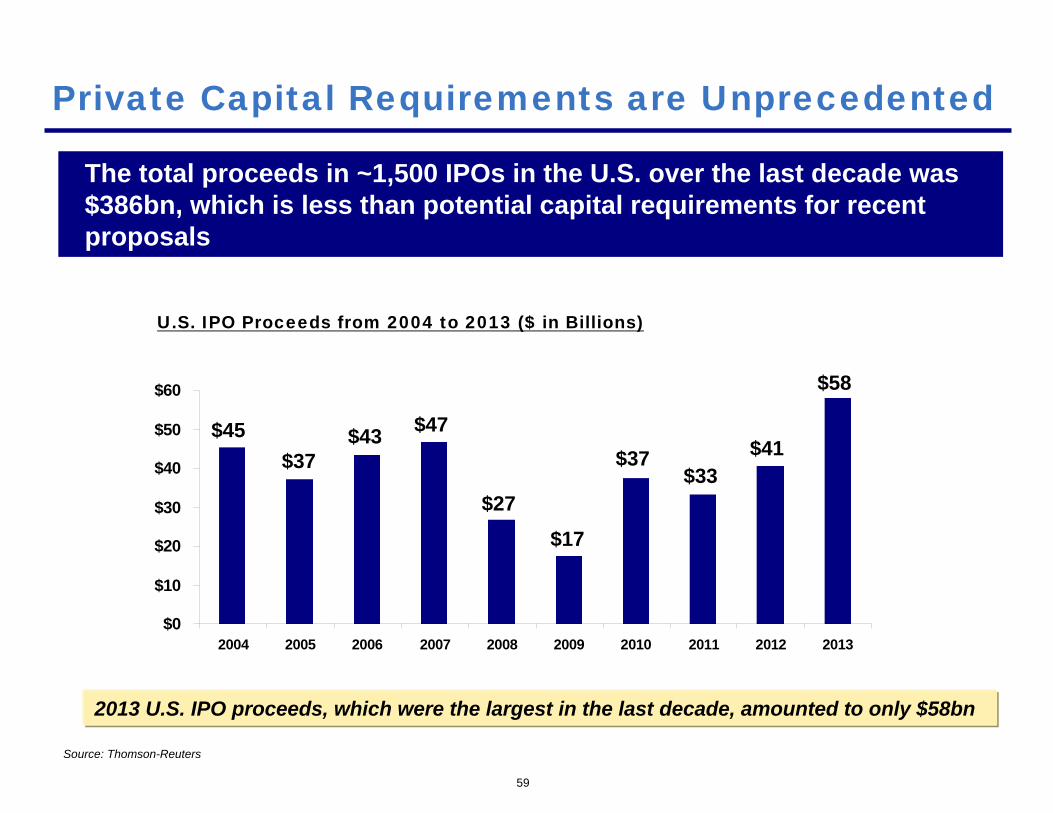
The total proceeds in ~1,500 IPOs in the U.S. over the last decade was $386bn, which is less than potential capital requirements for recent proposals
Private Capital Requirements are Unprecedented
U.S. IPO Proceeds from 2004 to 2013 ($ in Billions)
Source: Thomson-Reuters
2013 U.S. IPO proceeds, which were the largest in the last decade, amounted to only $58bn
$45$37
$43 $47
$27$17
$37$33
$41
$58
60
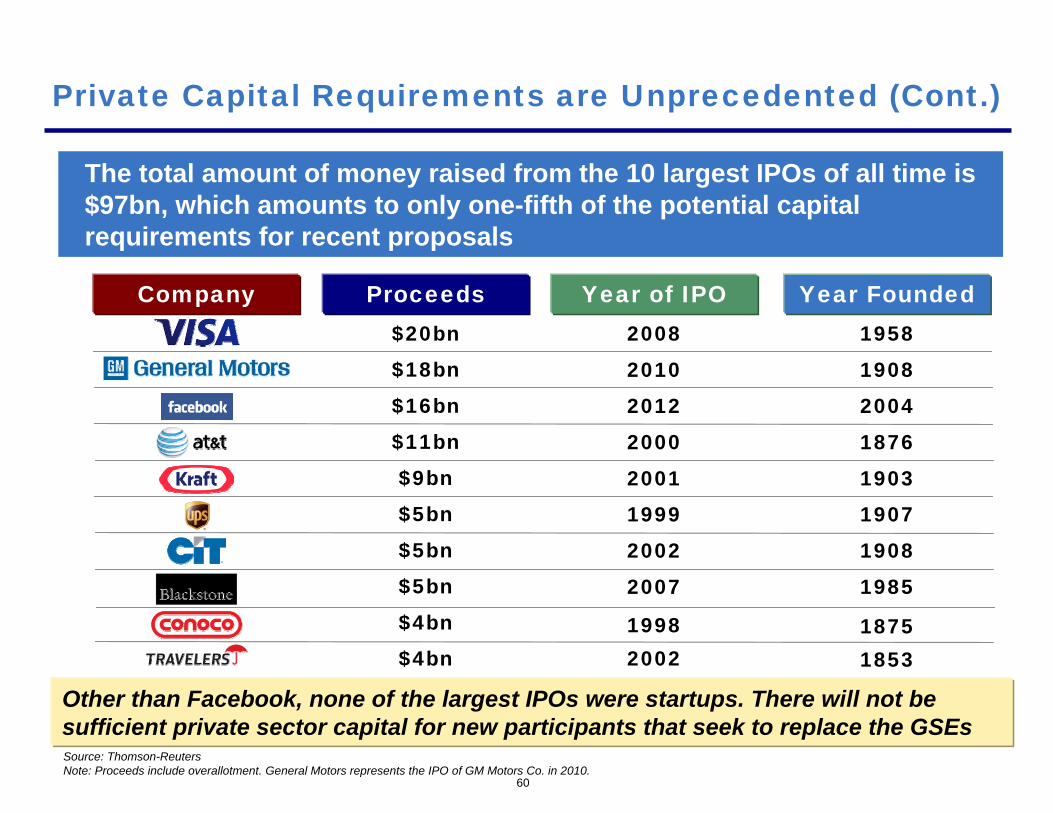
The total amount of money raised from the 10 largest IPOs of all time is $97bn, which amounts to only one-fifth of the potential capital requirements for recent proposals
Private Capital Requirements are Unprecedented (Cont.)
Other than Facebook, none of the largest IPOs were startups. There will not be sufficient private sector capital for new participants that seek to replace the GSEsSource: Thomson-ReutersNote: Proceeds include overallotment. General Motors represents the IPO of GM Motors Co. in 2010.
$20bn 2008
Company Proceeds Year of IPO
$18bn 2010
$16bn 2012
$11bn 2000
$9bn 2001
$5bn 1999
$5bn 2002
$5bn 2007
$4bn 1998$4bn 2002
Year Founded1958
1908
2004
1876
1903
1907
1908
1985
18751853
61
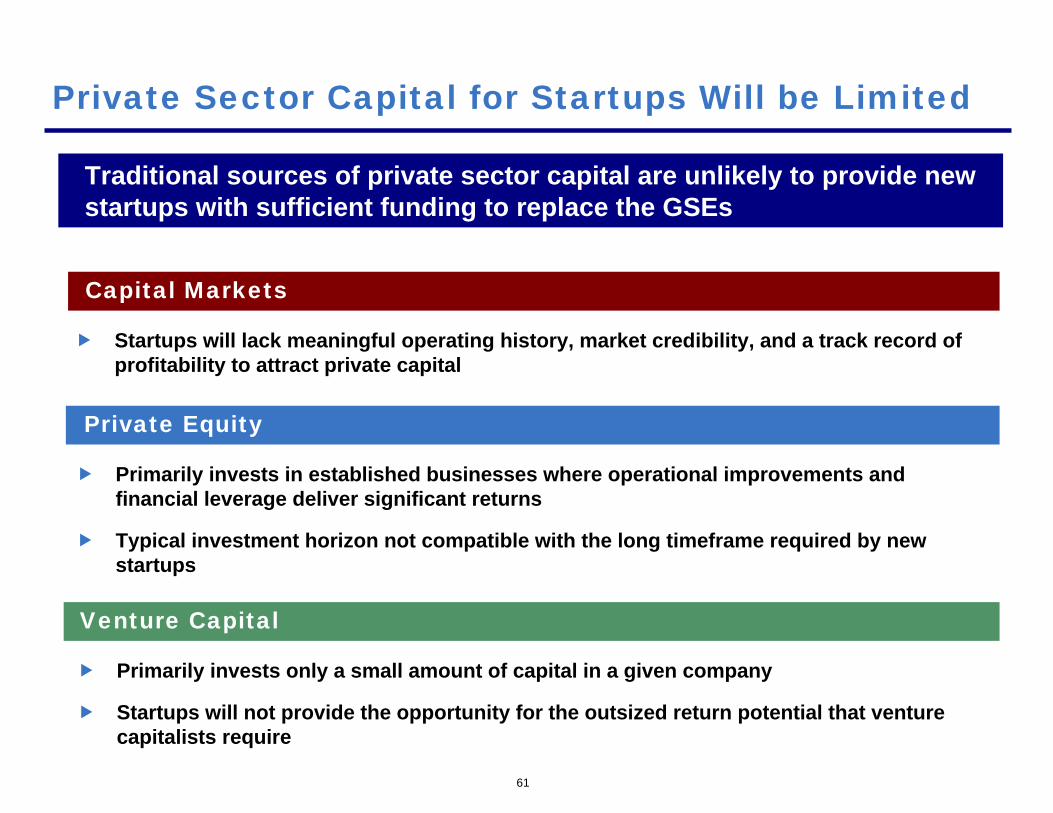
Traditional sources of private sector capital are unlikely to provide new startups with sufficient funding to replace the GSEs
Private Sector Capital for Startups Will be Limited
Startups will lack meaningful operating history, market credibility, and a track record of profitability to attract private capital
Capital Markets
Primarily invests in established businesses where operational improvements and financial leverage deliver significant returns
Typical investment horizon not compatible with the long timeframe required by new startups
Private Equity
Primarily invests only a small amount of capital in a given company
Startups will not provide the opportunity for the outsized return potential that venture capitalists require
Venture Capital
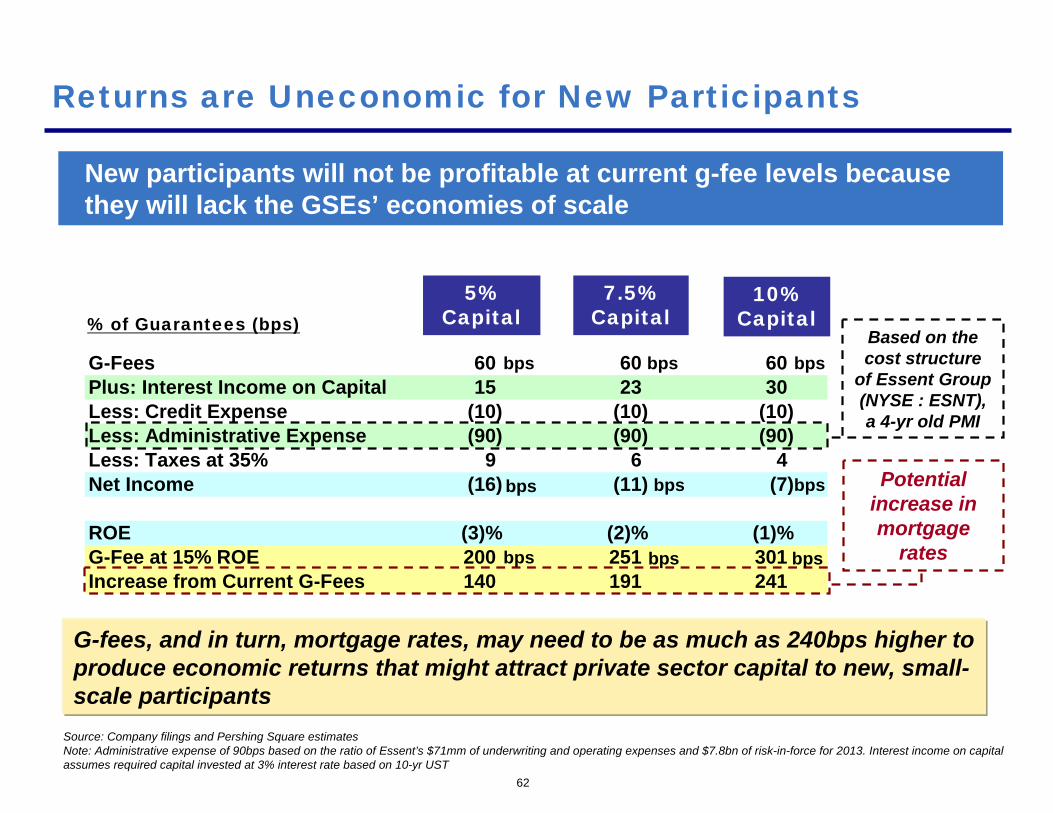
G-Fees 60 60 60Plus: Interest Income on Capital 15 23 30Less: Credit Expense (10) (10) (10)Less: Administrative Expense (90) (90) (90)Less: Taxes at 35% 9 6 4Net Income (16) (11) (7)
ROE (3)% (2)% (1)%G-Fee at 15% ROE 200 251 301Increase from Current G-Fees 140 191 241
62
New participants will not be profitable at current g-fee levels because they will lack the GSEs’ economies of scale
Returns are Uneconomic for New Participants
G-fees, and in turn, mortgage rates, may need to be as much as 240bps higher to produce economic returns that might attract private sector capital to new, small-scale participants
% of Guarantees (bps)5%
Capital7.5%
Capital10%
Capital
Source: Company filings and Pershing Square estimatesNote: Administrative expense of 90bps based on the ratio of Essent’s $71mm of underwriting and operating expenses and $7.8bn of risk-in-force for 2013. Interest income on capital assumes required capital invested at 3% interest rate based on 10-yr UST
Potential increase in mortgage
rates
Based on the cost structure
of Essent Group (NYSE : ESNT), a 4-yr old PMI
bps bps bps
bpsbpsbps
bps bps bps
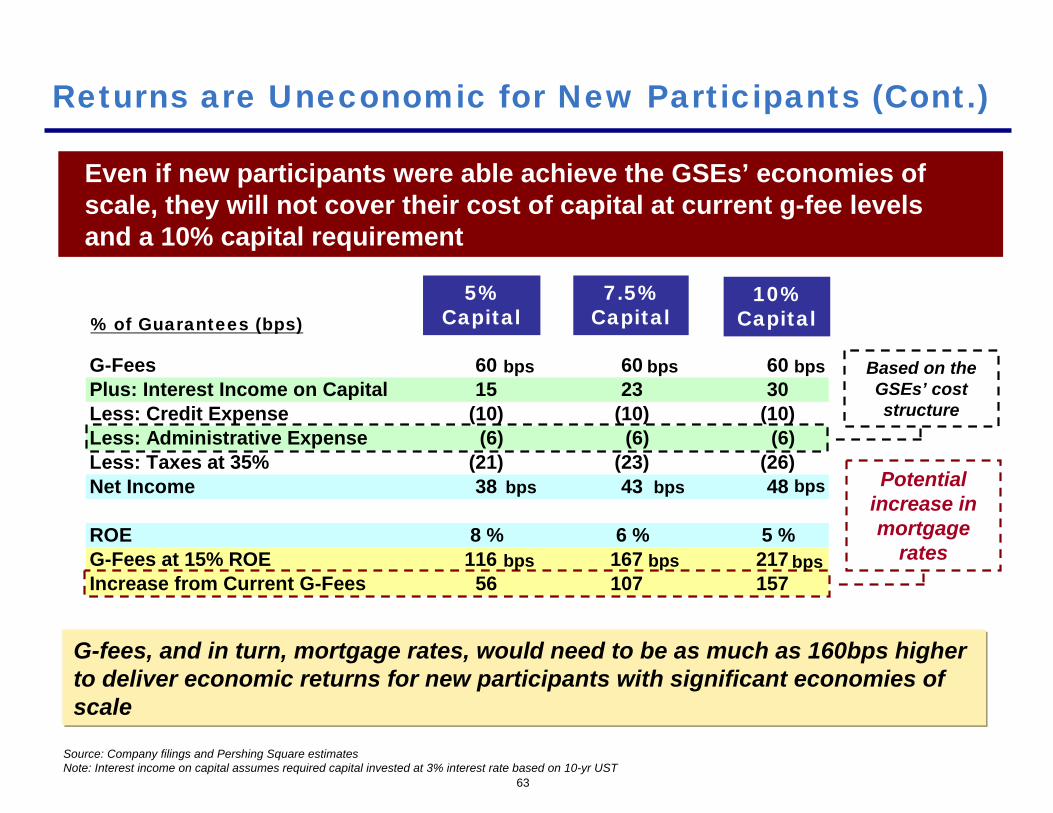
G-Fees 60 60 60Plus: Interest Income on Capital 15 23 30Less: Credit Expense (10) (10) (10)Less: Administrative Expense (6) (6) (6)Less: Taxes at 35% (21) (23) (26)Net Income 38 43 48
ROE 8 % 6 % 5 %G-Fees at 15% ROE 116 167 217Increase from Current G-Fees 56 107 157
63
Even if new participants were able achieve the GSEs’ economies of scale, they will not cover their cost of capital at current g-fee levels and a 10% capital requirement
Returns are Uneconomic for New Participants (Cont.)
G-fees, and in turn, mortgage rates, would need to be as much as 160bps higher to deliver economic returns for new participants with significant economies of scale
% of Guarantees (bps)5%
Capital7.5%
Capital10%
Capital
Source: Company filings and Pershing Square estimatesNote: Interest income on capital assumes required capital invested at 3% interest rate based on 10-yr UST
Based on the GSEs’ cost structure
Potential increase in mortgage
rates
bps bps bps
bpsbpsbps
bps bps bps
3.00%
3.50%
4.00%
4.50%
5.00%
5.50%
6.00%
$0
$100
$200
$300
$400
$500
$600
$700
Mortgage Originations (RHS)
64
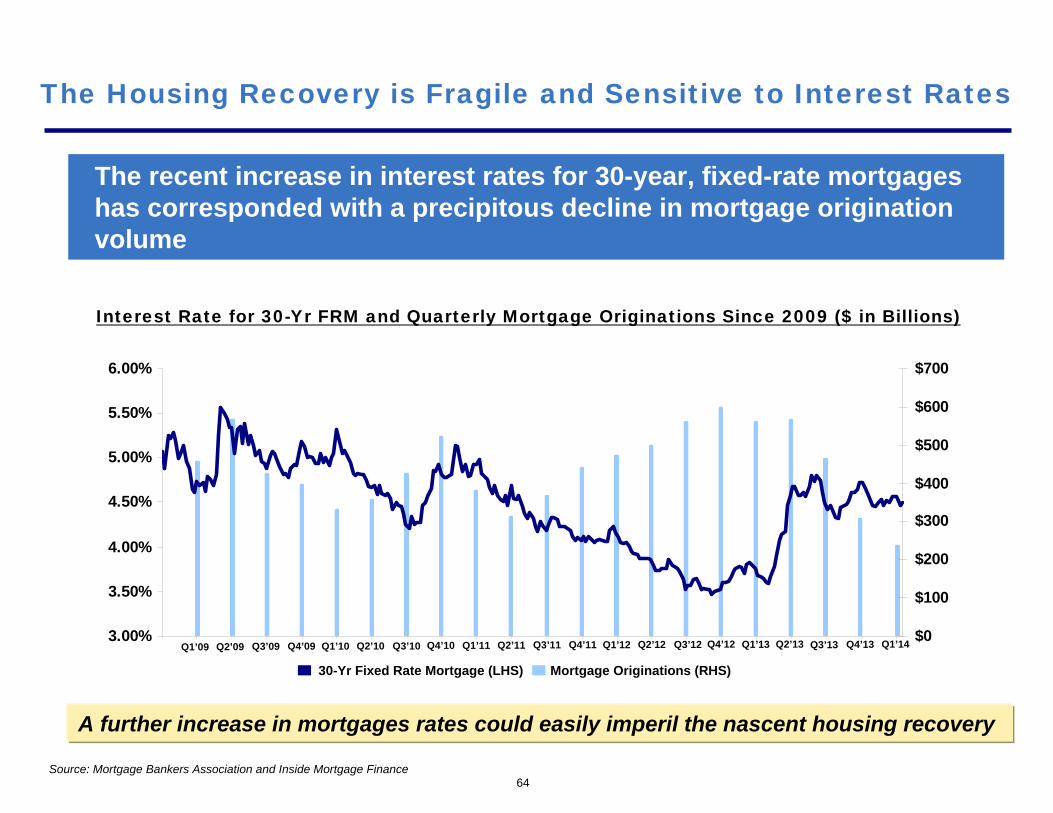
The recent increase in interest rates for 30-year, fixed-rate mortgages has corresponded with a precipitous decline in mortgage origination volume
The Housing Recovery is Fragile and Sensitive to Interest Rates
30-Yr Fixed Rate Mortgage (LHS)
Q1’09 Q2’09 Q3’09 Q4’09 Q1’10 Q2’10 Q3’10 Q4’10 Q1’11 Q2’11 Q3’11 Q4’11 Q1’12 Q2’12 Q3’12 Q4’12 Q1’13 Q2’13 Q3’13 Q4’13 Q1’14
Interest Rate for 30-Yr FRM and Quarterly Mortgage Originations Since 2009 ($ in Billions)
A further increase in mortgages rates could easily imperil the nascent housing recovery
Source: Mortgage Bankers Association and Inside Mortgage Finance
65
The government’s treatment of the GSEs’ current shareholders will make it extremely difficult to attract new private capital
Net Worth Sweep Sets a Discouraging Precedent
“What comfort can you give to private sector investors considering investing in the future of the housing finance system when they believe that the government arbitrarily changed the rules of the game mid-stream with the Third Amendment?”
- Pat Toomey, Pennsylvania Senator, Senate Banking Committee member, 3/4/2014
Excerpt of letter to U.S. Treasury Secretary Jack Lew
$0
$5
$10
$15
$20
2000 2001 2002 2003 2004 2005 2006 2007 2008 2009 2010 2011 2012 2013Current
66
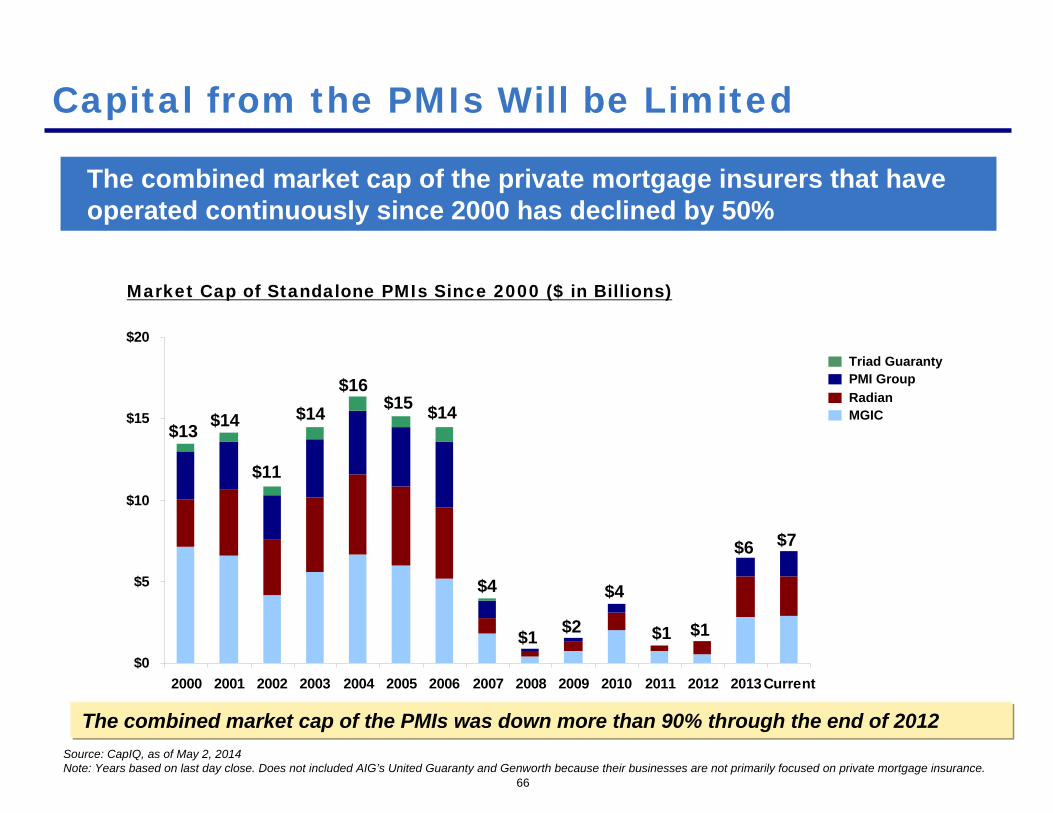
The combined market cap of the private mortgage insurers that have operated continuously since 2000 has declined by 50%
Capital from the PMIs Will be Limited
Market Cap of Standalone PMIs Since 2000 ($ in Billions)
$13
Source: CapIQ, as of May 2, 2014Note: Years based on last day close. Does not included AIG’s United Guaranty and Genworth because their businesses are not primarily focused on private mortgage insurance.
$14 $14$16
$14
$4
$2
$4
$1 $1
$7
PMI GroupTriad Guaranty
MGICRadian
The combined market cap of the PMIs was down more than 90% through the end of 2012
$11
$15
$1
$6
0%
5%
10%
15%
20%
2003 2004 2005 2006 2007 2008 2009 2010 2011 2012 2013
67
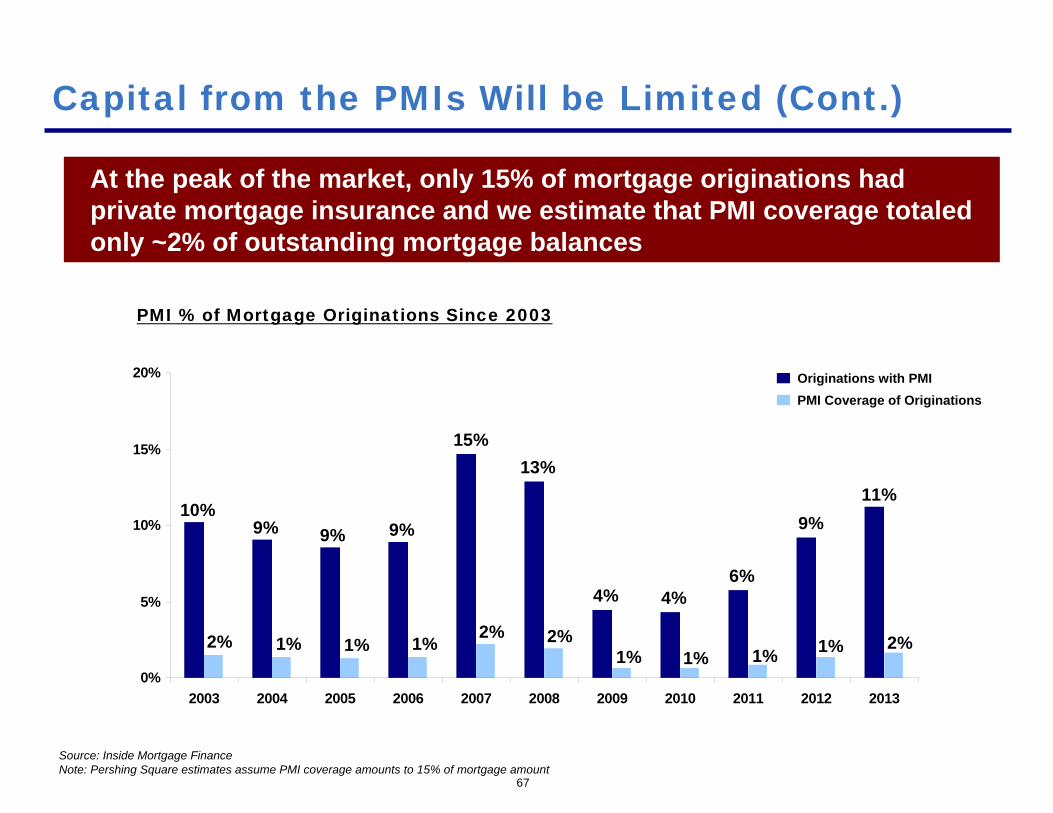
At the peak of the market, only 15% of mortgage originations hadprivate mortgage insurance and we estimate that PMI coverage totaled only ~2% of outstanding mortgage balances
Capital from the PMIs Will be Limited (Cont.)
PMI % of Mortgage Originations Since 2003
Source: Inside Mortgage FinanceNote: Pershing Square estimates assume PMI coverage amounts to 15% of mortgage amount
10%9% 9% 9%
15%13%
4% 4%6%
9%11%
2% 1% 1% 1% 2% 2%1% 1% 1% 1% 2%
Originations with PMIPMI Coverage of Originations
68
The history of the PMIs illustrates private capital’s pro-cyclical nature
Capital from the PMIs Will be Limited (Cont.)
Started in the early 1900s when title insurance firms expanded into mortgage insurance
Became widespread during the real estate boom of the 1920s
Went bankrupt or exited the business during the Great Depression
Government was the sole mortgage insurance provider until MGIC entered the market in 1957
Began to expand again until collapsing again in the 1980s due to the savings and loan crisis and multiple regional real estate crises
Relaunched in the 1990s and again expanded until collapsing during the financial crisis
History of the PMIs:
0%
5%
10%
15%
20%
25%
30%
35%
40%
2003 2004 2005 2006 2007 2008 2009 2010 2011 2012 2013
69
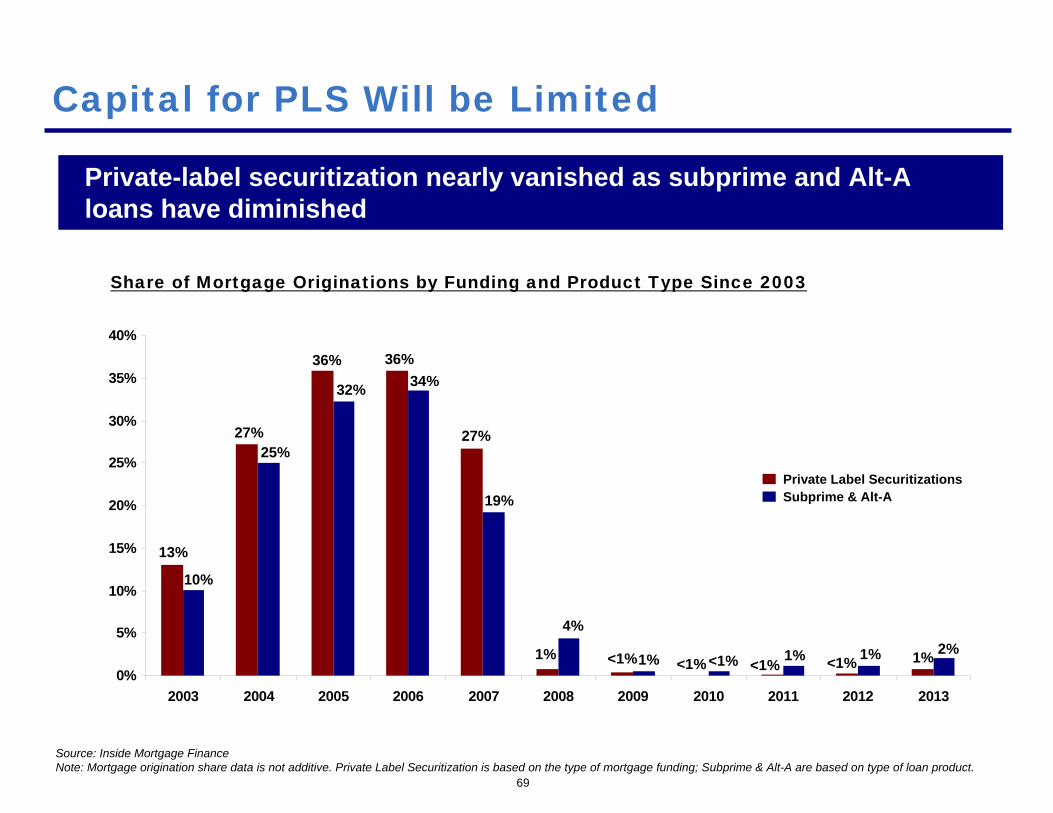
Private-label securitization nearly vanished as subprime and Alt-A loans have diminished
Capital for PLS Will be Limited
Source: Inside Mortgage FinanceNote: Mortgage origination share data is not additive. Private Label Securitization is based on the type of mortgage funding; Subprime & Alt-A are based on type of loan product.
Share of Mortgage Originations by Funding and Product Type Since 2003
13%
27%
36% 36%
27%
1% <1% <1% <1% <1% 1%
10%
25%
32% 34%
19%
4%
1% <1% 1% 1% 2%
Subprime & Alt-APrivate Label Securitizations
70
Private label securitization is unlikely to experience a resurgence in the near to medium term
Capital for PLS Will be Limited (Cont.)
Painful memories of substantial losses on subprime and Alt-A will limit investor demand
Increased capital requirements under Basel III will discourage investment banks from issuing PLS
Recent PLS have required issuers to retain subordinated tranches
Investors are unlikely to purchase subordinated tranches from issuers
Even during the peak of private-label securitization, issuers were only able to sell subordinated tranches by selling them into CDO securitizations, which were improperly rated AAA by the rating agencies
$0
$500
$1,000
$1,500
$2,000
$2,500
$3,000
$3,500
$4,000
1980
1981
1982
1983
1984
1985
1986
1987
1988
1989
1990
1991
1992
1993
1994
1995
1996
1997
1998
1999
2000
2001
2002
2003
2004
2005
2006
2007
2008
2009
2010
2011
2012
2013
0%
10%
20%
30%
40%
50%
60%
70%
80%
Share of Mortgages
71
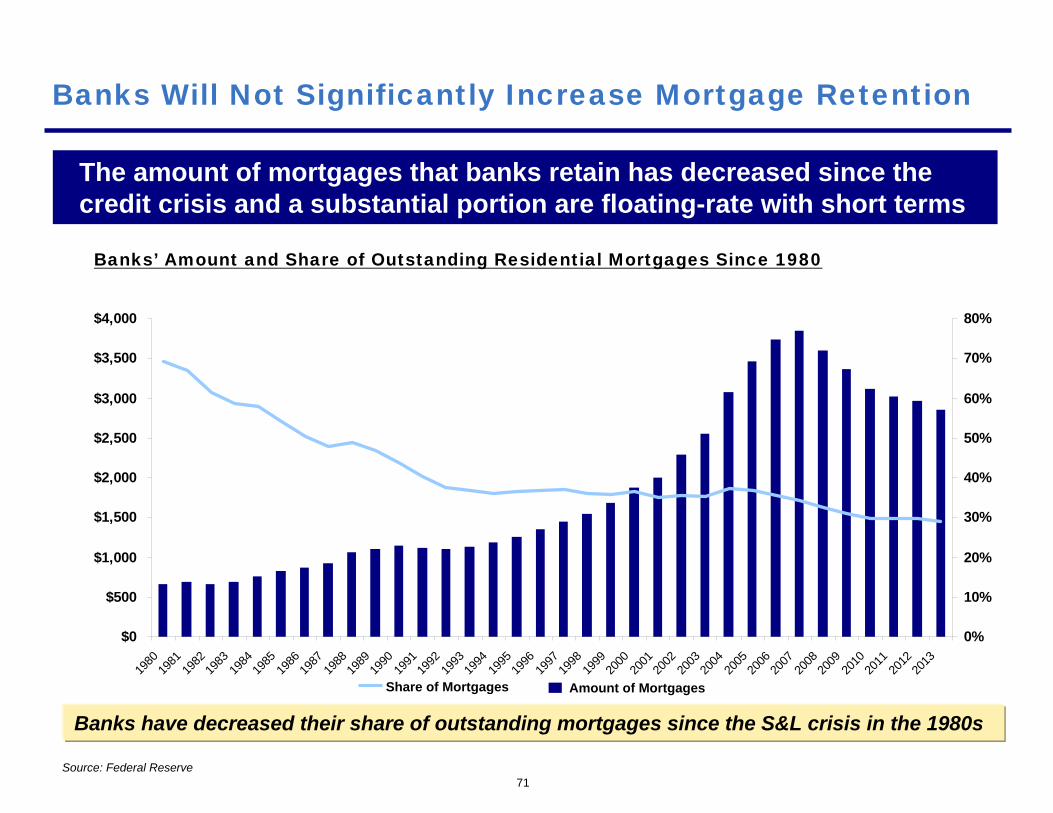
The amount of mortgages that banks retain has decreased since the credit crisis and a substantial portion are floating-rate with short terms
Banks Will Not Significantly Increase Mortgage Retention
Banks’ Amount and Share of Outstanding Residential Mortgages Since 1980
Source: Federal Reserve
Amount of Mortgages
Banks have decreased their share of outstanding mortgages since the S&L crisis in the 1980s
72
Banks are unlikely to significantly increase the amount of long-term, fixed-rate mortgages they retain on their balance sheets
Banks Will Not Significantly Increase Mortgage Retention (Cont.)
Asset-liability management limits the proportion of their balance sheets that banks will invest in mortgages
Capital requirements for GSE MBS are lower than for retained mortgages
Basel III regulations significantly increase capital requirements for mortgage assets, lowering returns
Mortgage rates are near historical lows, increasing future interest rate risk
73
Recent proposals are not only impractical, but also less effective and riskier than a reformed Fannie and Freddie
Recent Proposals are Riskier than Reformed GSEs
Untested system that lacks the GSEs’ 80-year track record of market acceptance
Increased cyclicality
Numerous small-scale start-ups will be lower quality, riskier, and more difficult to regulate than the GSEs
Explicit government guarantee will increase risk to taxpayers
Risks of recent proposals:
74
The GSEs satisfy the needs of key market participants. Proposals to replace them with an untested system carry significant risk
Proposed System is Untested
“The current secondary market structure works well for community banks and credit unions and allows them to meet their borrowers’ needs. Restructuring of this system is unchartered and untested and therefore raises numerous questions regarding fees and functionality when applied to the real-world marketplace.”
- Credit Union National Association, Independent Community Bankers of America, National Association of Federal Credit Unions, 4/11/2014
A key risk with recent housing finance proposals is that they will only demonstrate efficacy when we can least tolerate failure – during a severe housing downturn
75
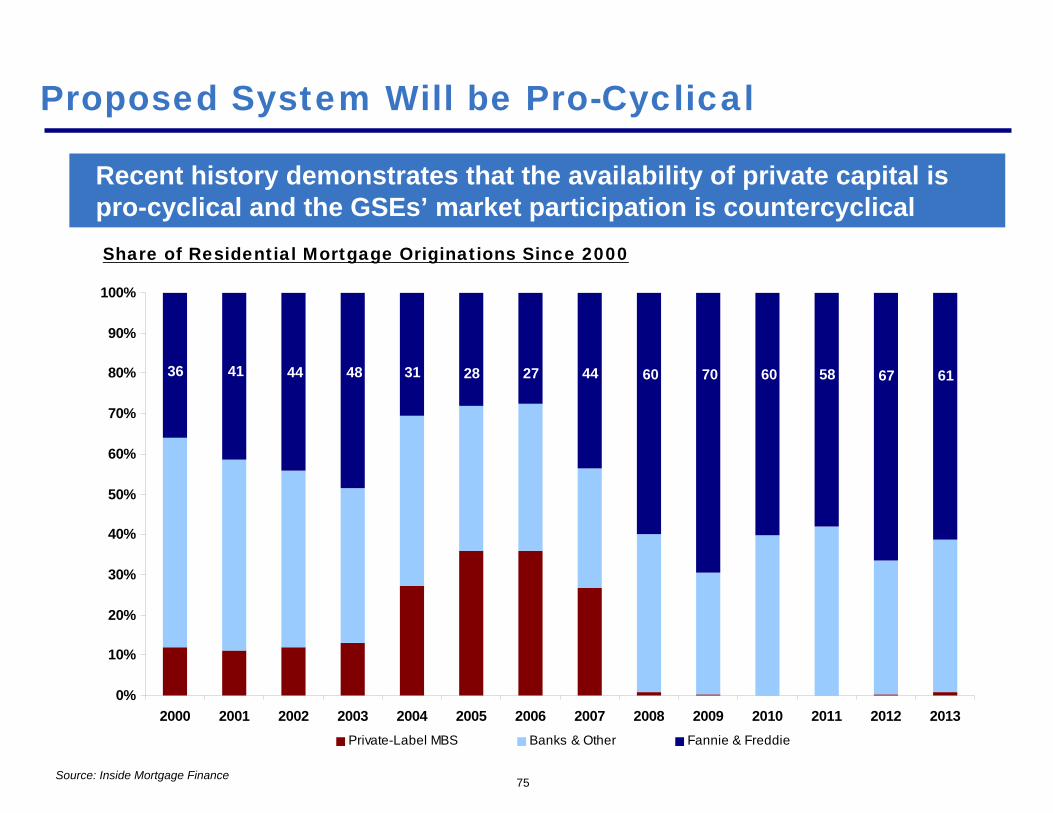
Recent history demonstrates that the availability of private capital is pro-cyclical and the GSEs’ market participation is countercyclical
Proposed System Will be Pro-Cyclical
Source: Inside Mortgage Finance
0%
10%
20%
30%
40%
50%
60%
70%
80%
90%
100%
2000 2001 2002 2003 2004 2005 2006 2007 2008 2009 2010 2011 2012 2013Private-Label MBS Banks & Other Fannie & Freddie
Share of Residential Mortgage Originations Since 2000
36 41 44 48 31 28 27 44 60 70 60 58 67 61
(200)
(150)
(100)
(50)
0
50
1/4/08
4/28/0
88/2
1/08
12/14
/084/8
/098/1
/0911
/24/09
3/19/1
07/1
2/10
11/4/
102/2
7/11
6/22/1
110
/15/11
2/7/12
6/1/12
9/24/1
21/1
7/13
5/12/1
39/4
/1312
/28/13
4/22/1
4
76
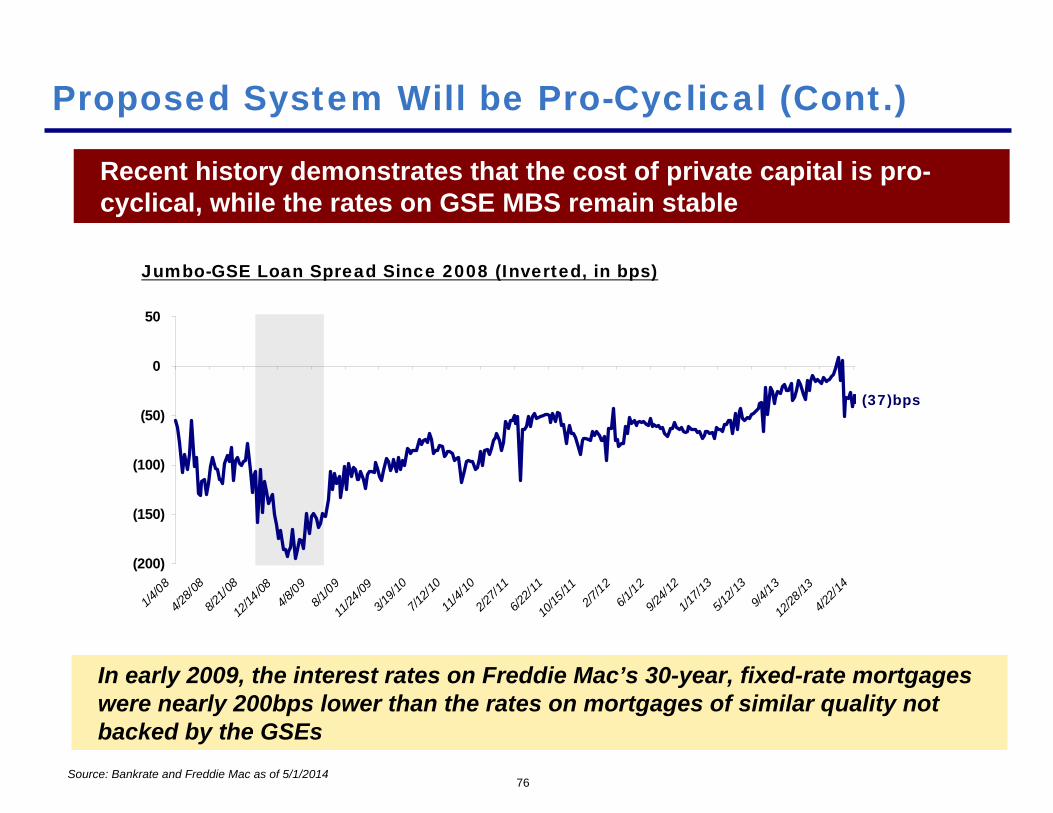
Recent history demonstrates that the cost of private capital is pro-cyclical, while the rates on GSE MBS remain stable
Proposed System Will be Pro-Cyclical (Cont.)
Jumbo-GSE Loan Spread Since 2008 (Inverted, in bps)
(37)bps
Source: Bankrate and Freddie Mac as of 5/1/2014
In early 2009, the interest rates on Freddie Mac’s 30-year, fixed-rate mortgages were nearly 200bps lower than the rates on mortgages of similar quality not backed by the GSEs
77
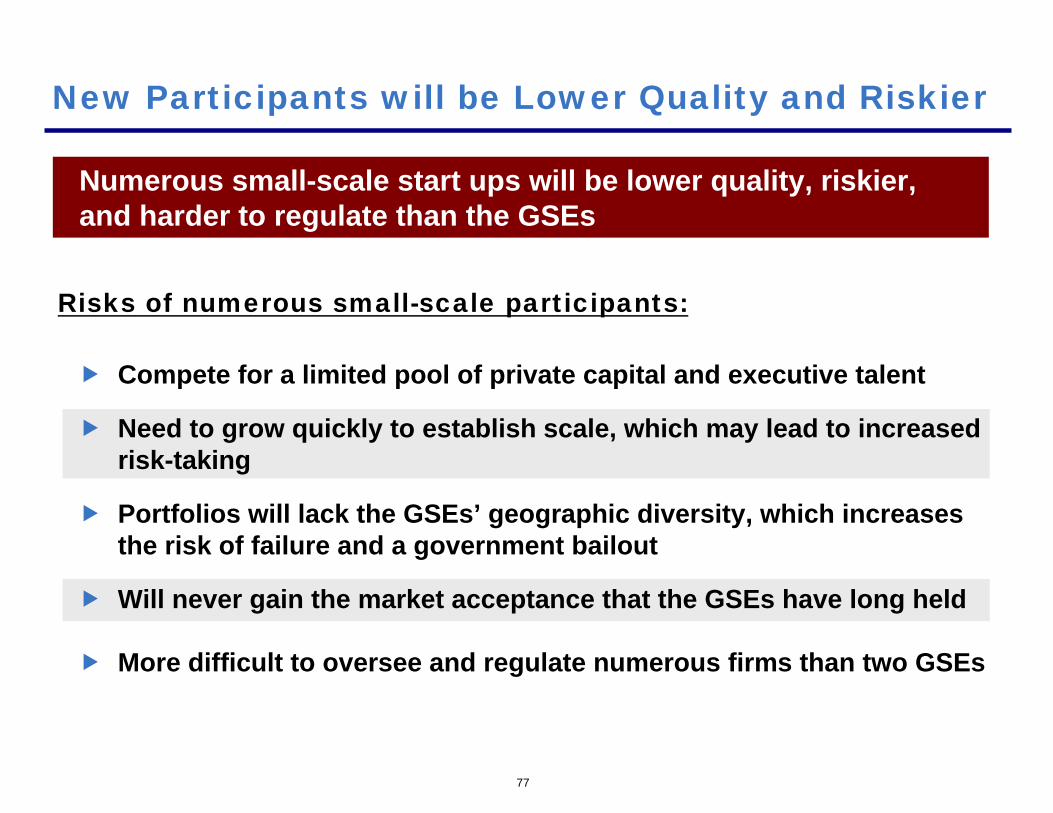
Numerous small-scale start ups will be lower quality, riskier, and harder to regulate than the GSEs
New Participants will be Lower Quality and Riskier
Risks of numerous small-scale participants:
Compete for a limited pool of private capital and executive talent
Need to grow quickly to establish scale, which may lead to increased risk-taking
Portfolios will lack the GSEs’ geographic diversity, which increases the risk of failure and a government bailout
Will never gain the market acceptance that the GSEs have long held
More difficult to oversee and regulate numerous firms than two GSEs
78
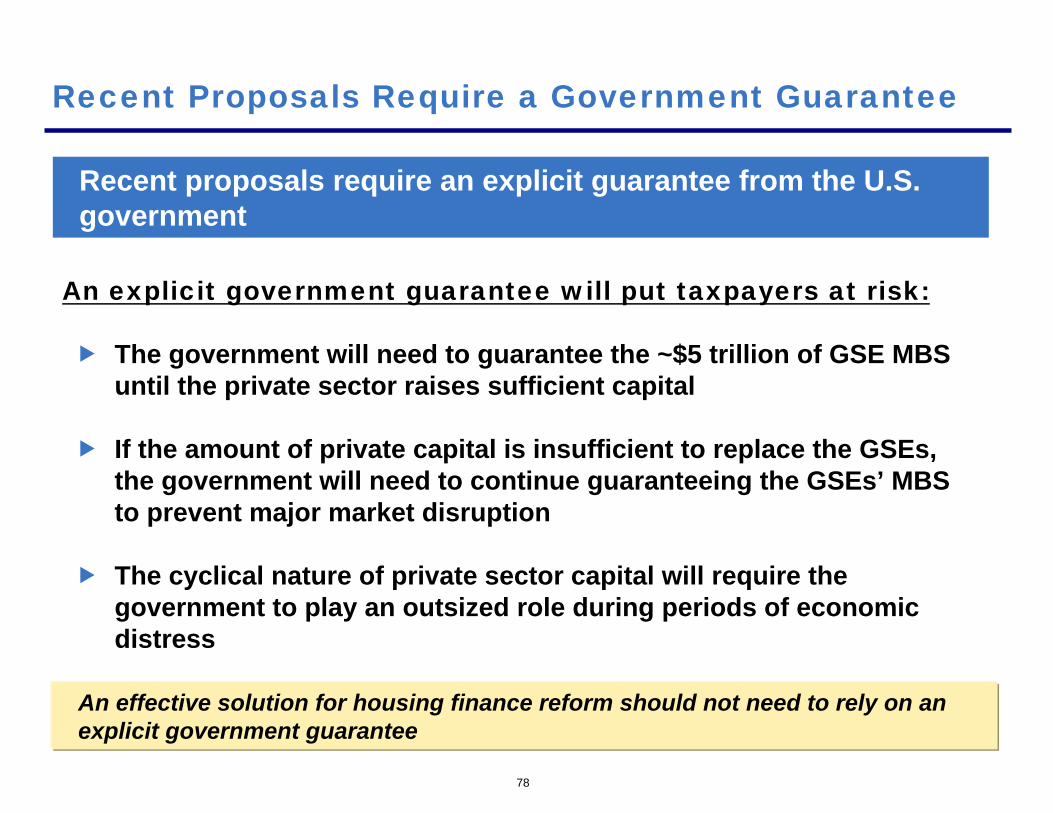
Recent proposals require an explicit guarantee from the U.S. government
Recent Proposals Require a Government Guarantee
The government will need to guarantee the ~$5 trillion of GSE MBS until the private sector raises sufficient capital
If the amount of private capital is insufficient to replace the GSEs, the government will need to continue guaranteeing the GSEs’ MBS to prevent major market disruption
The cyclical nature of private sector capital will require the government to play an outsized role during periods of economic distress
An effective solution for housing finance reform should not need to rely on an explicit government guarantee
An explicit government guarantee will put taxpayers at risk:
If the GSEs are conservatively capitalized, avoid subprime and Alt-A loans, and exit the FIA business, they will not require an explicit government guarantee

Our Recommendation for Housing Finance Reform
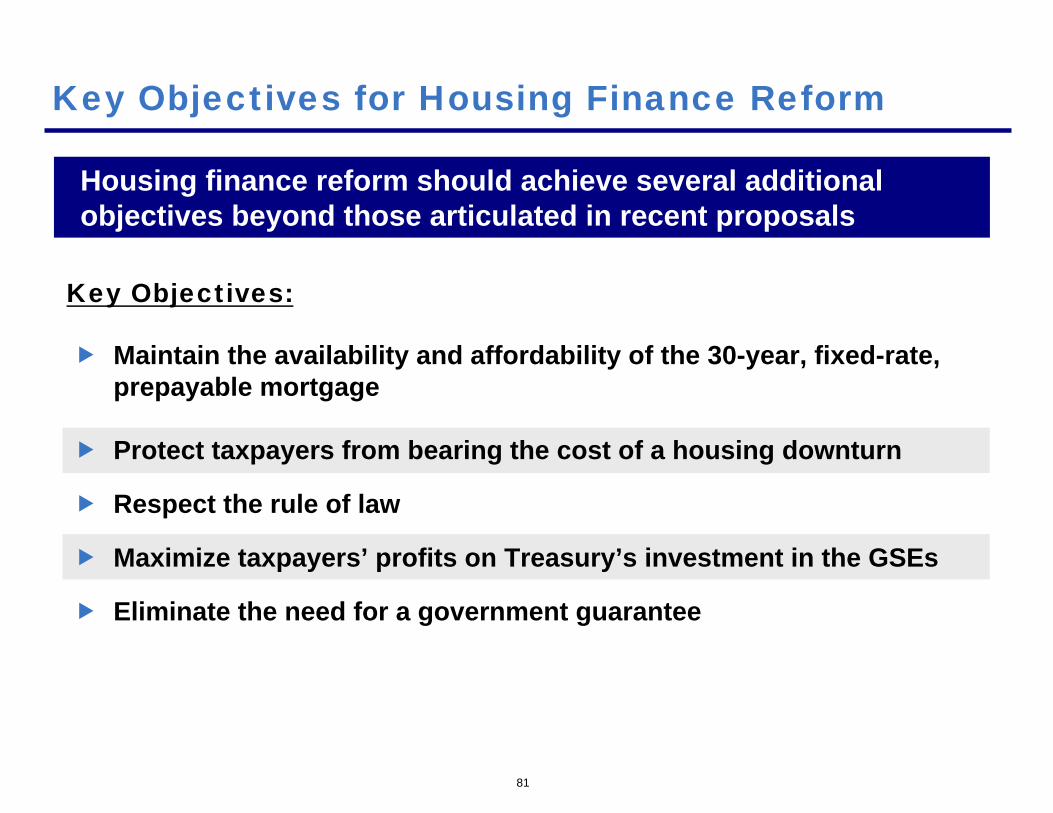
Maintain the availability and affordability of the 30-year, fixed-rate, prepayable mortgage
Protect taxpayers from bearing the cost of a housing downturn
Respect the rule of law
Maximize taxpayers’ profits on Treasury’s investment in the GSEs
Eliminate the need for a government guarantee
81
Housing finance reform should achieve several additional objectives beyond those articulated in recent proposals
Key Objectives for Housing Finance Reform
Key Objectives:
82
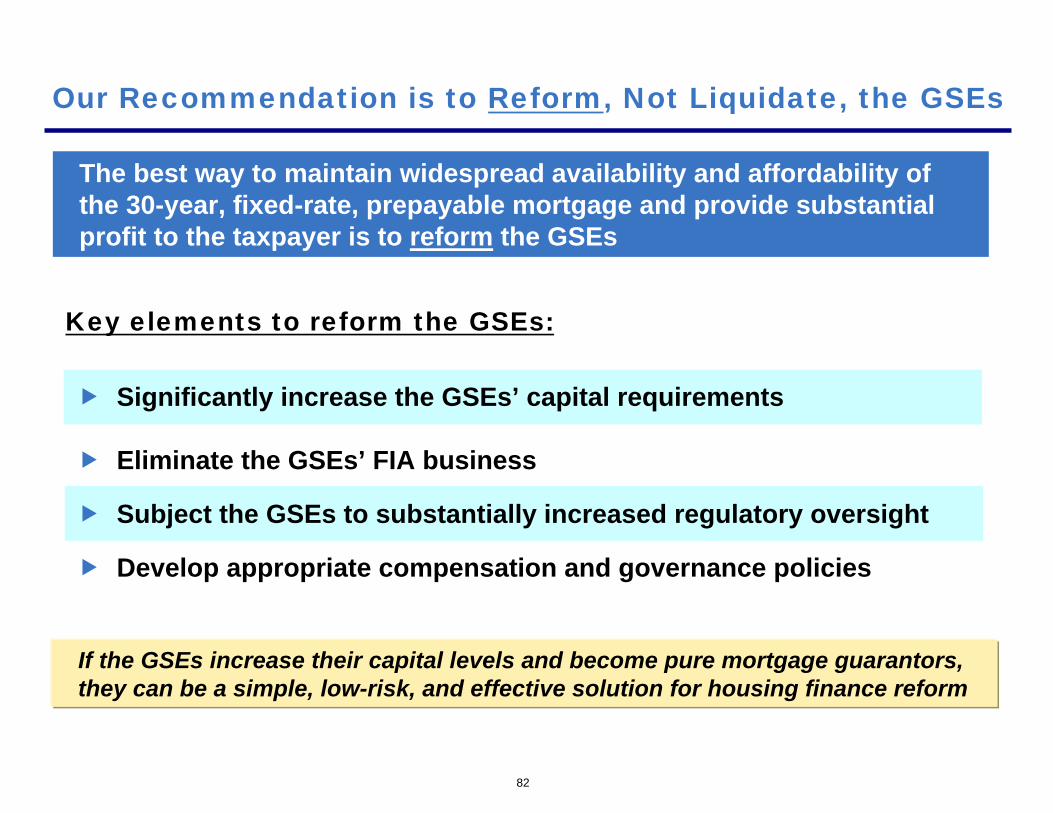
The best way to maintain widespread availability and affordability of the 30-year, fixed-rate, prepayable mortgage and provide substantial profit to the taxpayer is to reform the GSEs
Our Recommendation is to Reform, Not Liquidate, the GSEs
Significantly increase the GSEs’ capital requirements
Eliminate the GSEs’ FIA business
Subject the GSEs to substantially increased regulatory oversight
Develop appropriate compensation and governance policies
Key elements to reform the GSEs:
If the GSEs increase their capital levels and become pure mortgage guarantors, they can be a simple, low-risk, and effective solution for housing finance reform
($50)
($25)
$0
$25
$50
$75
$100
$125
83
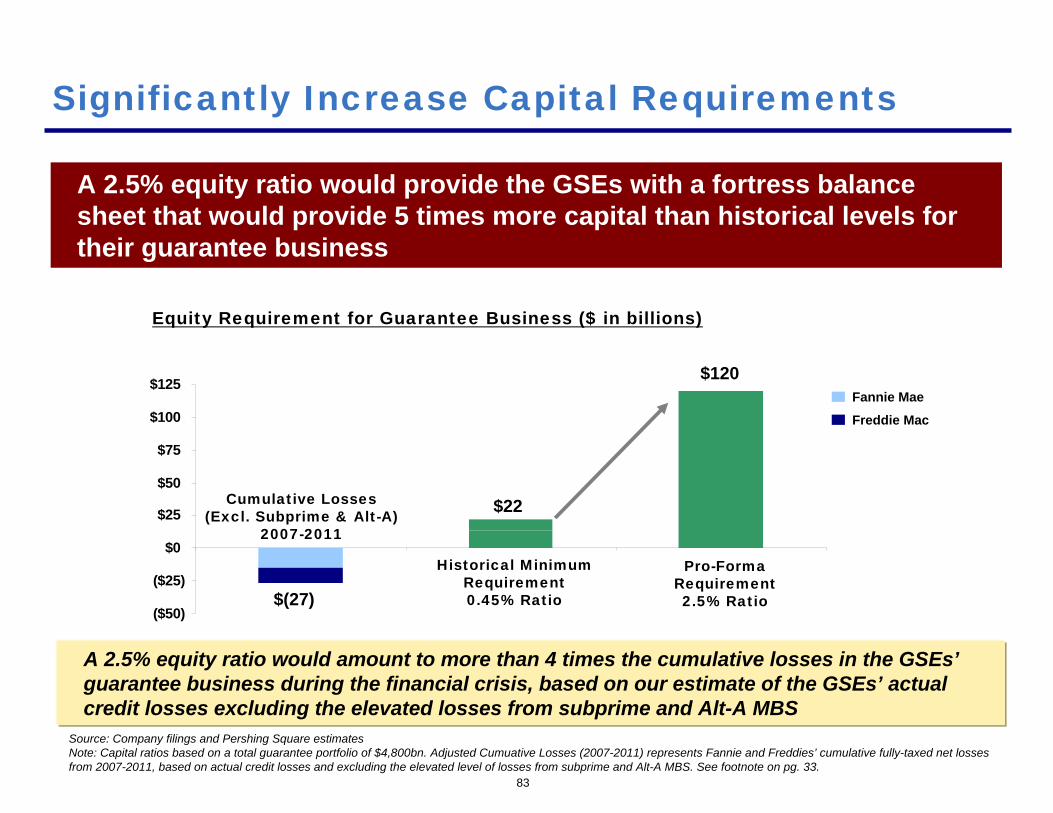
Significantly Increase Capital Requirements
A 2.5% equity ratio would provide the GSEs with a fortress balance sheet that would provide 5 times more capital than historical levels for their guarantee business
Source: Company filings and Pershing Square estimatesNote: Capital ratios based on a total guarantee portfolio of $4,800bn. Adjusted Cumuative Losses (2007-2011) represents Fannie and Freddies’ cumulative fully-taxed net losses from 2007-2011, based on actual credit losses and excluding the elevated level of losses from subprime and Alt-A MBS. See footnote on pg. 33.
Equity Requirement for Guarantee Business ($ in billions)
$22
$120
Historical Minimum Requirement0.45% Ratio
Pro-FormaRequirement2.5% Ratio
Freddie Mac
Fannie Mae
$(27)
A 2.5% equity ratio would amount to more than 4 times the cumulative losses in the GSEs’guarantee business during the financial crisis, based on our estimate of the GSEs’ actual credit losses excluding the elevated losses from subprime and Alt-A MBS
Cumulative Losses(Excl. Subprime & Alt-A)
2007-2011
84
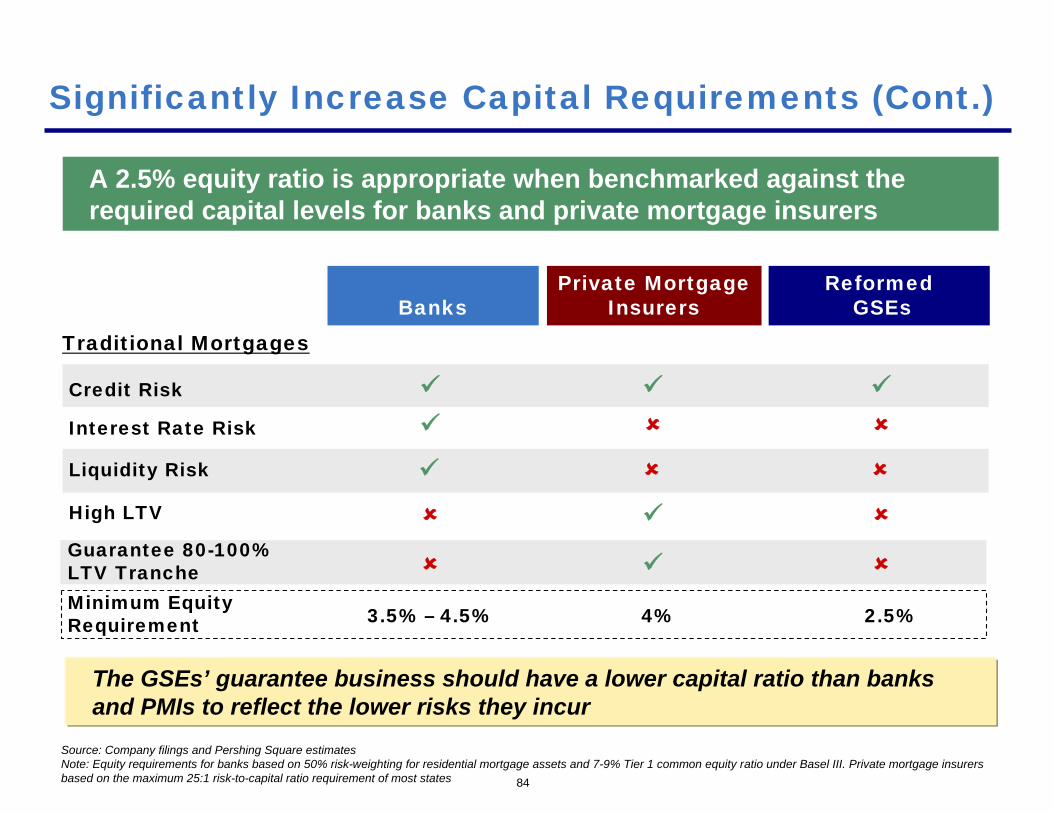
Significantly Increase Capital Requirements (Cont.)
A 2.5% equity ratio is appropriate when benchmarked against the required capital levels for banks and private mortgage insurers
The GSEs’ guarantee business should have a lower capital ratio than banksand PMIs to reflect the lower risks they incur
Source: Company filings and Pershing Square estimatesNote: Equity requirements for banks based on 50% risk-weighting for residential mortgage assets and 7-9% Tier 1 common equity ratio under Basel III. Private mortgage insurers based on the maximum 25:1 risk-to-capital ratio requirement of most states
Private Mortgage Insurers
ReformedGSEsBanks
Guarantee 80-100% LTV Tranche
High LTV
Liquidity Risk
Interest Rate Risk
Credit Risk
Traditional Mortgages
Minimum Equity Requirement 3.5% – 4.5% 4% 2.5%
85
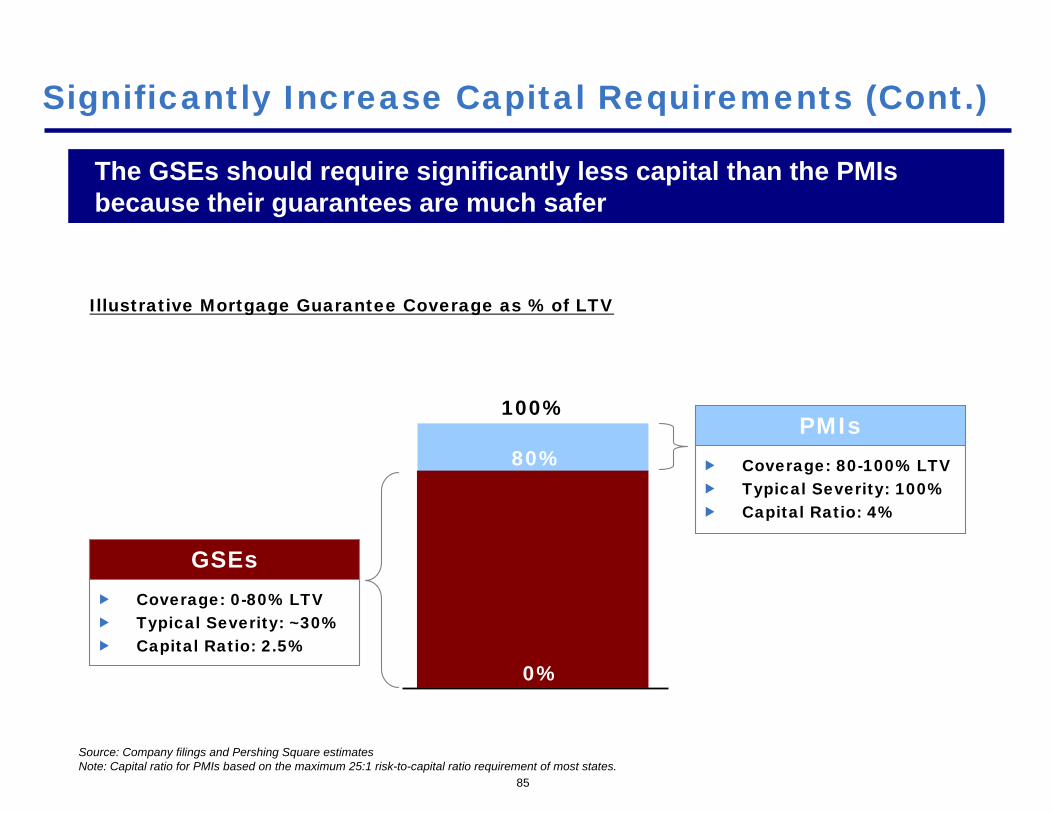
Significantly Increase Capital Requirements (Cont.)
The GSEs should require significantly less capital than the PMIsbecause their guarantees are much safer
100%
Illustrative Mortgage Guarantee Coverage as % of LTV
Source: Company filings and Pershing Square estimatesNote: Capital ratio for PMIs based on the maximum 25:1 risk-to-capital ratio requirement of most states.
80%
0%
Coverage: 0-80% LTVTypical Severity: ~30%Capital Ratio: 2.5%
GSEs
Coverage: 80-100% LTVTypical Severity: 100%Capital Ratio: 4%
PMIs
The GSEs’ balance sheets do not reflect the ~$30bn in annual revenue they will receive from g-fees on their ~$5 trillion of outstanding MBS
Significantly Increase Capital Requirements (Cont.)
The GSEs’ enormous earnings power adds a substantial additional layer of protection to a fortress balance sheet
86
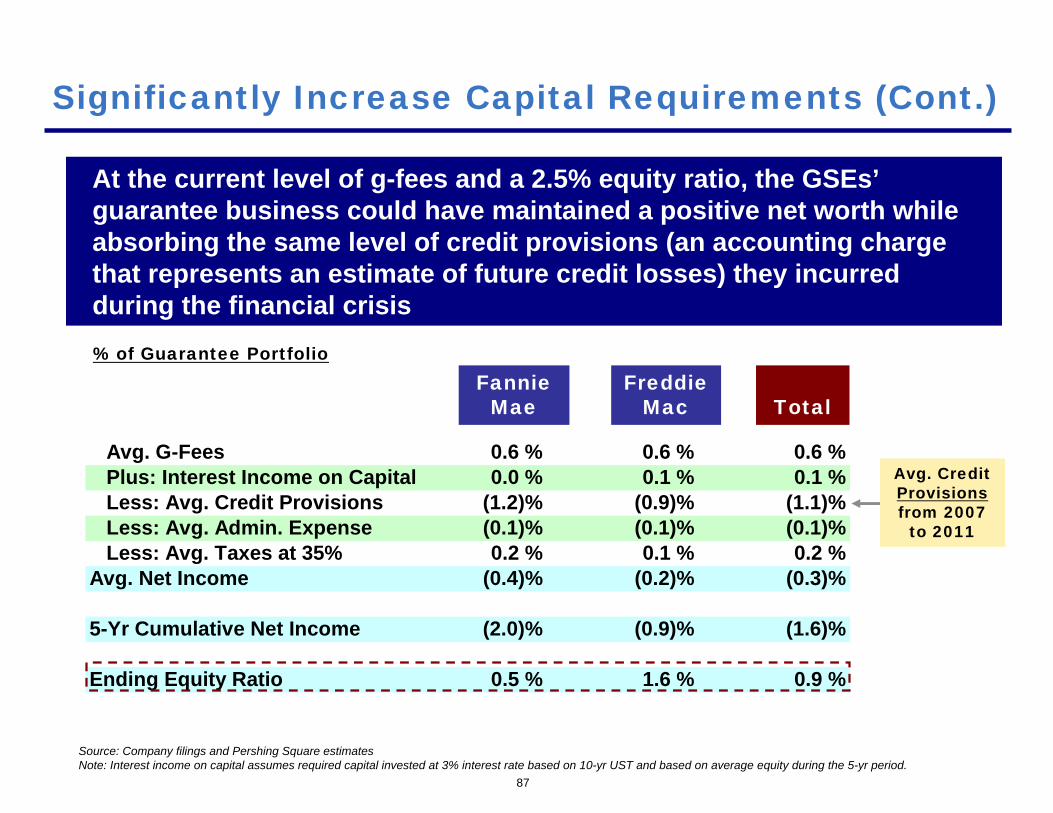
Avg. G-Fees 0.6 % 0.6 % 0.6 %Plus: Interest Income on Capital 0.0 % 0.1 % 0.1 %Less: Avg. Credit Provisions (1.2)% (0.9)% (1.1)%Less: Avg. Admin. Expense (0.1)% (0.1)% (0.1)%Less: Avg. Taxes at 35% 0.2 % 0.1 % 0.2 %
Avg. Net Income (0.4)% (0.2)% (0.3)%
5-Yr Cumulative Net Income (2.0)% (0.9)% (1.6)%
Ending Equity Ratio 0.5 % 1.6 % 0.9 %
87
Significantly Increase Capital Requirements (Cont.)
At the current level of g-fees and a 2.5% equity ratio, the GSEs’guarantee business could have maintained a positive net worth while absorbing the same level of credit provisions (an accounting charge that represents an estimate of future credit losses) they incurred during the financial crisis% of Guarantee Portfolio
FannieMae
FreddieMac Total
Avg. Credit Provisionsfrom 2007
to 2011
Source: Company filings and Pershing Square estimatesNote: Interest income on capital assumes required capital invested at 3% interest rate based on 10-yr UST and based on average equity during the 5-yr period.
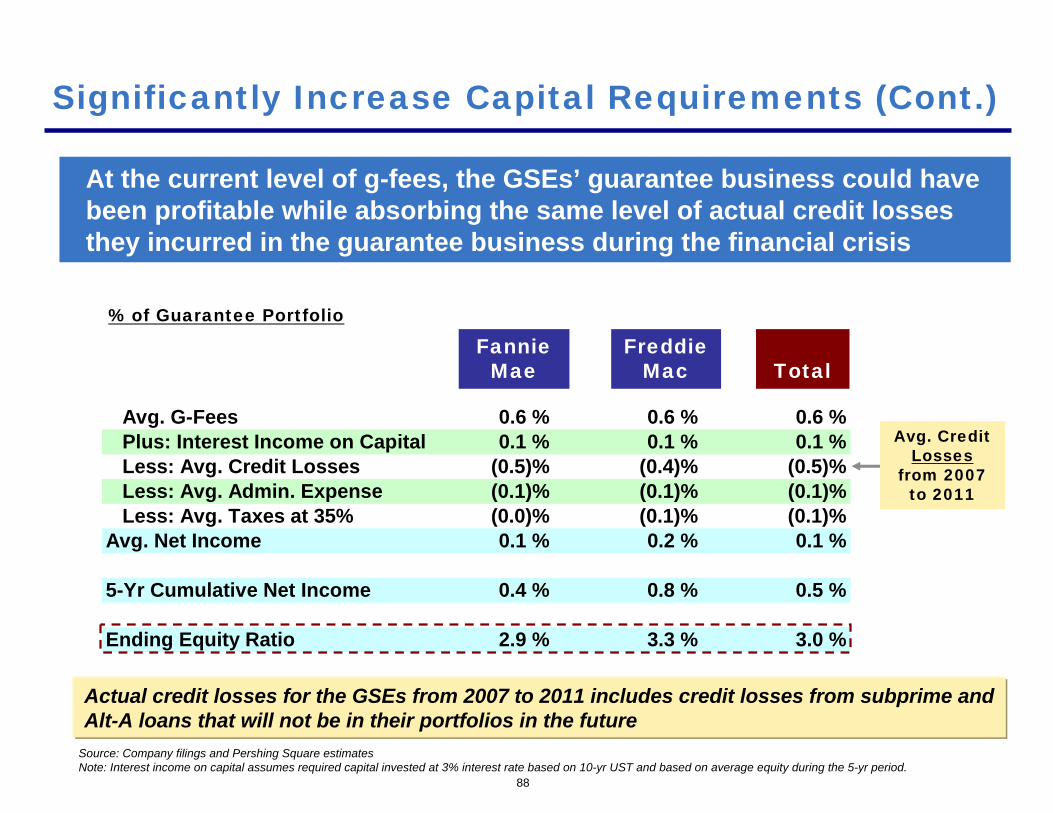
Avg. G-Fees 0.6 % 0.6 % 0.6 %Plus: Interest Income on Capital 0.1 % 0.1 % 0.1 %Less: Avg. Credit Losses (0.5)% (0.4)% (0.5)%Less: Avg. Admin. Expense (0.1)% (0.1)% (0.1)%Less: Avg. Taxes at 35% (0.0)% (0.1)% (0.1)%
Avg. Net Income 0.1 % 0.2 % 0.1 %
5-Yr Cumulative Net Income 0.4 % 0.8 % 0.5 %
Ending Equity Ratio 2.9 % 3.3 % 3.0 %
88
Significantly Increase Capital Requirements (Cont.)
At the current level of g-fees, the GSEs’ guarantee business could have been profitable while absorbing the same level of actual credit losses they incurred in the guarantee business during the financial crisis
% of Guarantee Portfolio
FannieMae
FreddieMac Total
Avg. Credit Losses
from 2007 to 2011
Source: Company filings and Pershing Square estimatesNote: Interest income on capital assumes required capital invested at 3% interest rate based on 10-yr UST and based on average equity during the 5-yr period.
Actual credit losses for the GSEs from 2007 to 2011 includes credit losses from subprime and Alt-A loans that will not be in their portfolios in the future
$0$100$200$300$400$500$600$700$800$900
$1,000
89
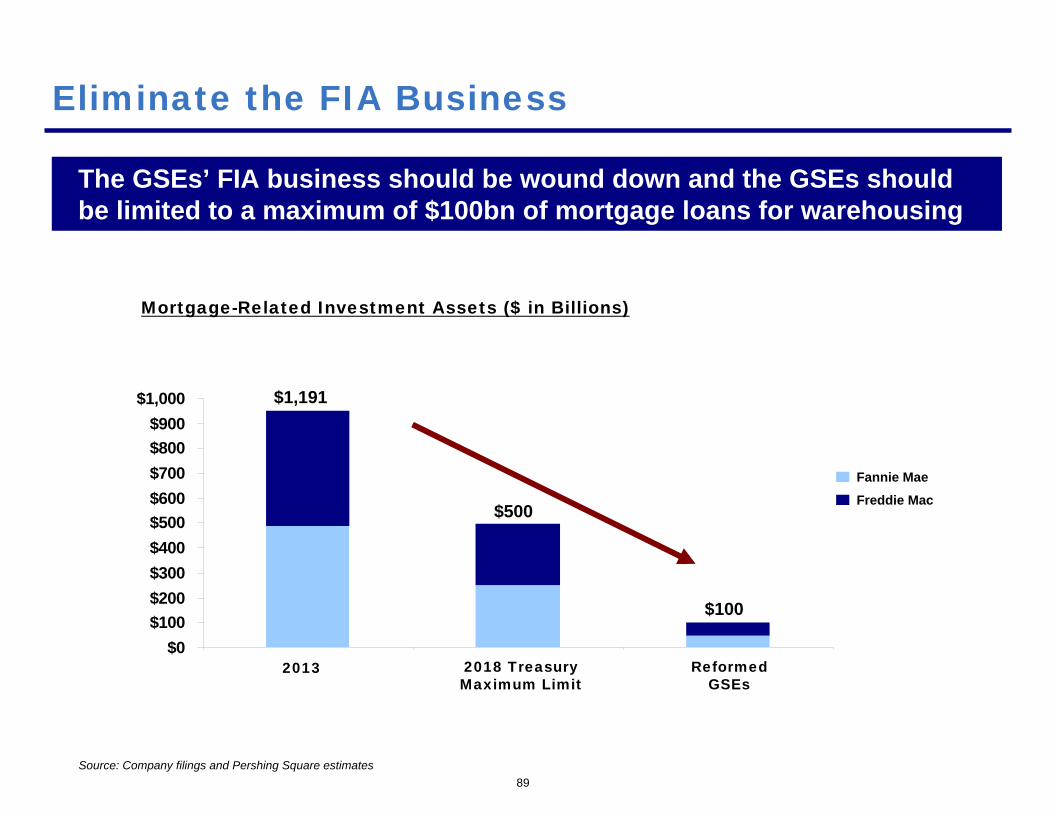
Eliminate the FIA Business
The GSEs’ FIA business should be wound down and the GSEs should be limited to a maximum of $100bn of mortgage loans for warehousing
Mortgage-Related Investment Assets ($ in Billions)
Freddie Mac
Fannie Mae
2013 2018 TreasuryMaximum Limit
ReformedGSEs
$1,191
$500
$100
Source: Company filings and Pershing Square estimates
90
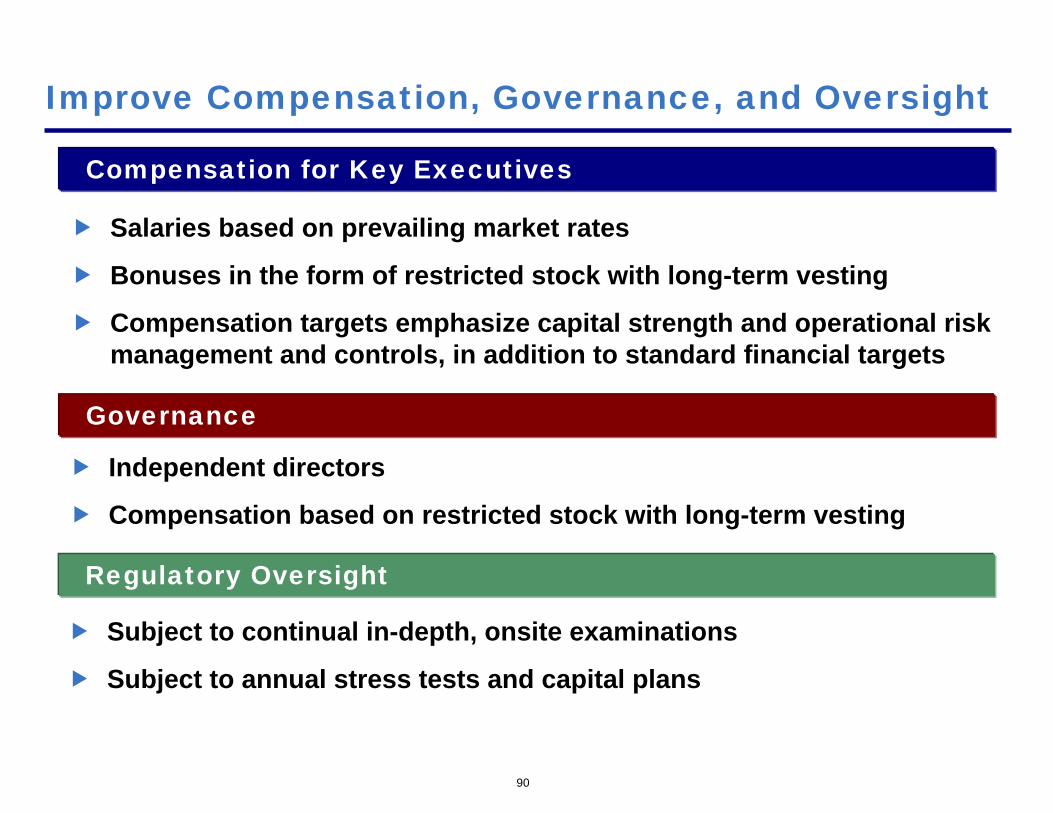
Improve Compensation, Governance, and Oversight
Compensation for Key Executives
Salaries based on prevailing market rates
Bonuses in the form of restricted stock with long-term vesting
Compensation targets emphasize capital strength and operational risk management and controls, in addition to standard financial targets
Governance
Independent directors
Compensation based on restricted stock with long-term vesting
Regulatory Oversight
Subject to continual in-depth, onsite examinations
Subject to annual stress tests and capital plans
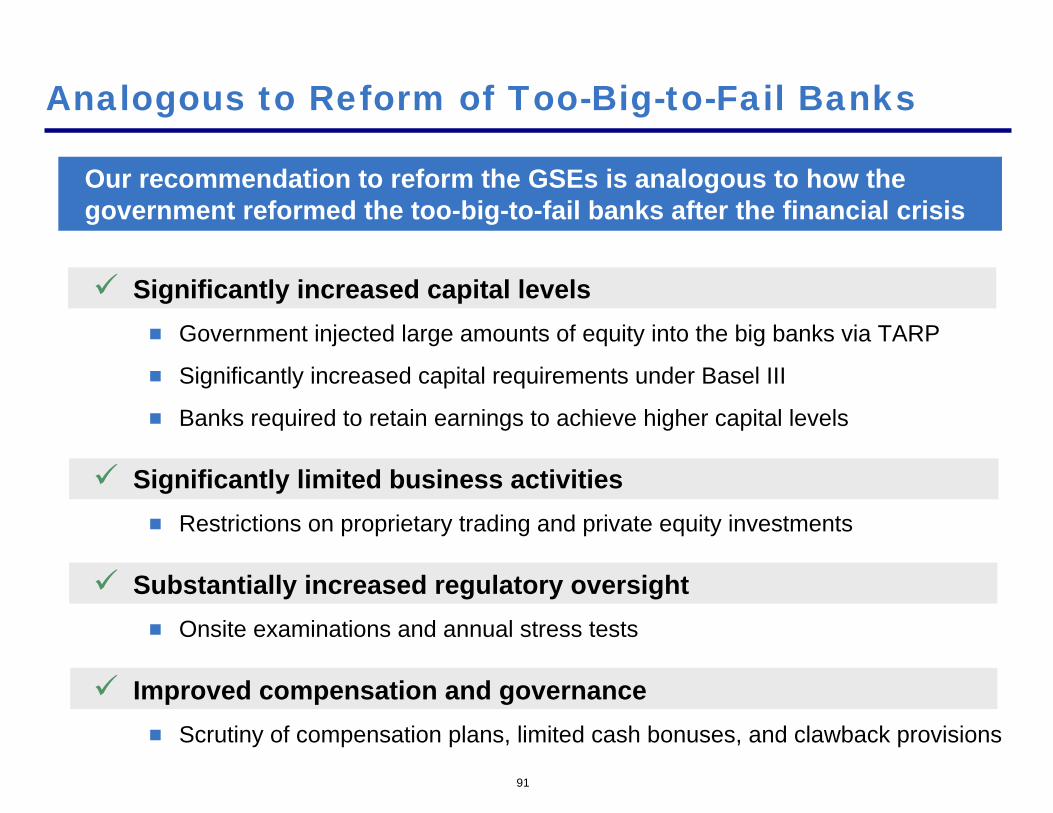
Our recommendation to reform the GSEs is analogous to how the government reformed the too-big-to-fail banks after the financial crisis
91
Analogous to Reform of Too-Big-to-Fail Banks
Significantly increased capital levelsGovernment injected large amounts of equity into the big banks via TARP
Significantly increased capital requirements under Basel III
Banks required to retain earnings to achieve higher capital levels
Significantly limited business activitiesRestrictions on proprietary trading and private equity investments
Substantially increased regulatory oversightOnsite examinations and annual stress tests
Improved compensation and governanceScrutiny of compensation plans, limited cash bonuses, and clawback provisions
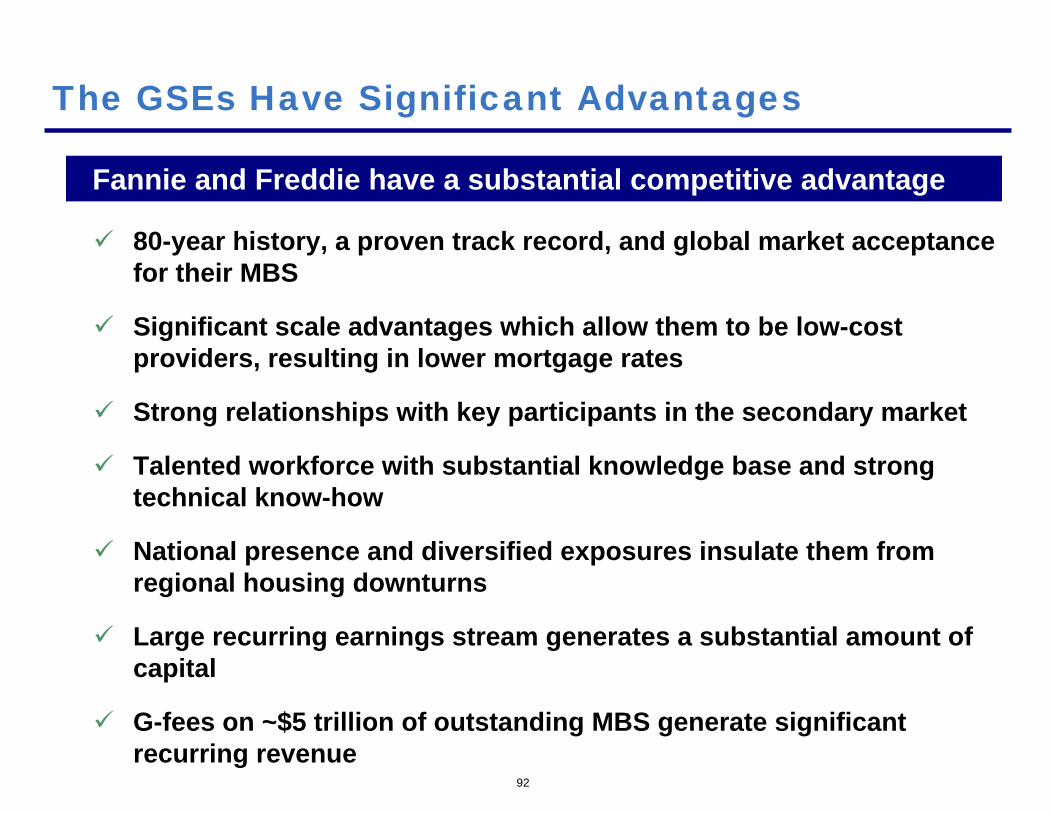
80-year history, a proven track record, and global market acceptance for their MBS
Significant scale advantages which allow them to be low-cost providers, resulting in lower mortgage rates
Strong relationships with key participants in the secondary market
Talented workforce with substantial knowledge base and strong technical know-how
National presence and diversified exposures insulate them from regional housing downturns
Large recurring earnings stream generates a substantial amount of capital
G-fees on ~$5 trillion of outstanding MBS generate significant recurring revenue
92
The GSEs Have Significant Advantages
Fannie and Freddie have a substantial competitive advantage
93
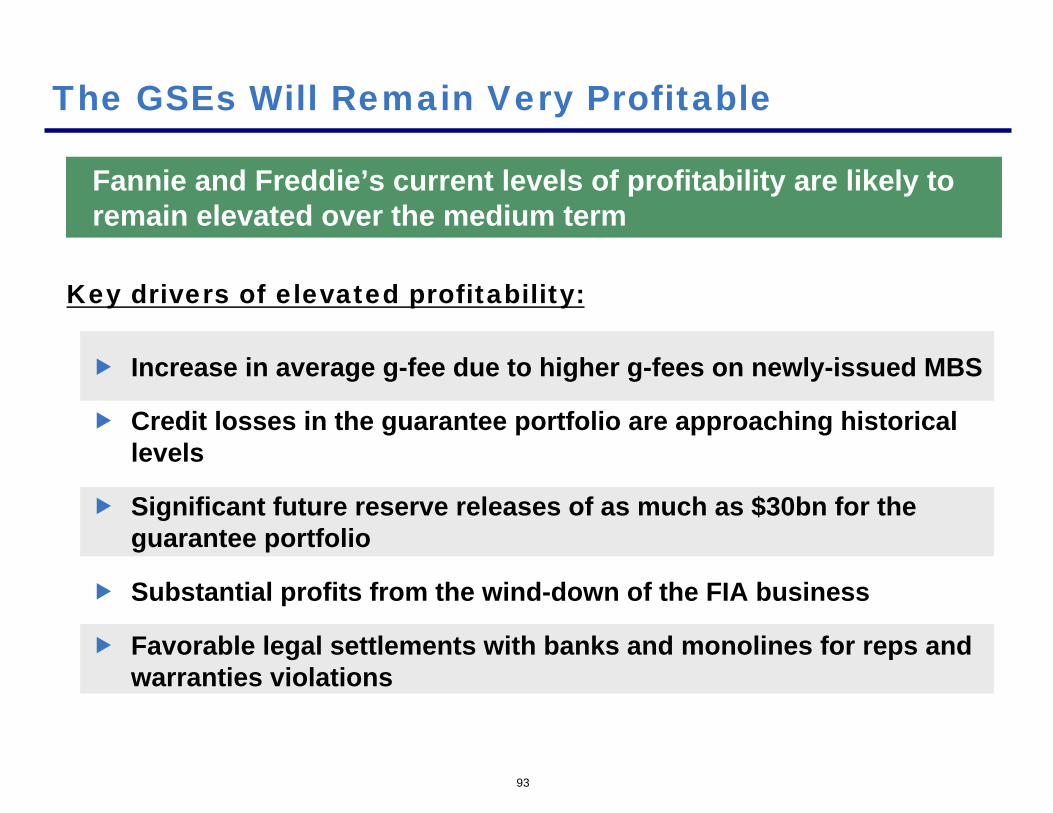
The GSEs Will Remain Very Profitable
Fannie and Freddie’s current levels of profitability are likely to remain elevated over the medium term
Key drivers of elevated profitability:
Increase in average g-fee due to higher g-fees on newly-issued MBS
Credit losses in the guarantee portfolio are approaching historical levels
Significant future reserve releases of as much as $30bn for the guarantee portfolio
Substantial profits from the wind-down of the FIA business
Favorable legal settlements with banks and monolines for reps and warranties violations
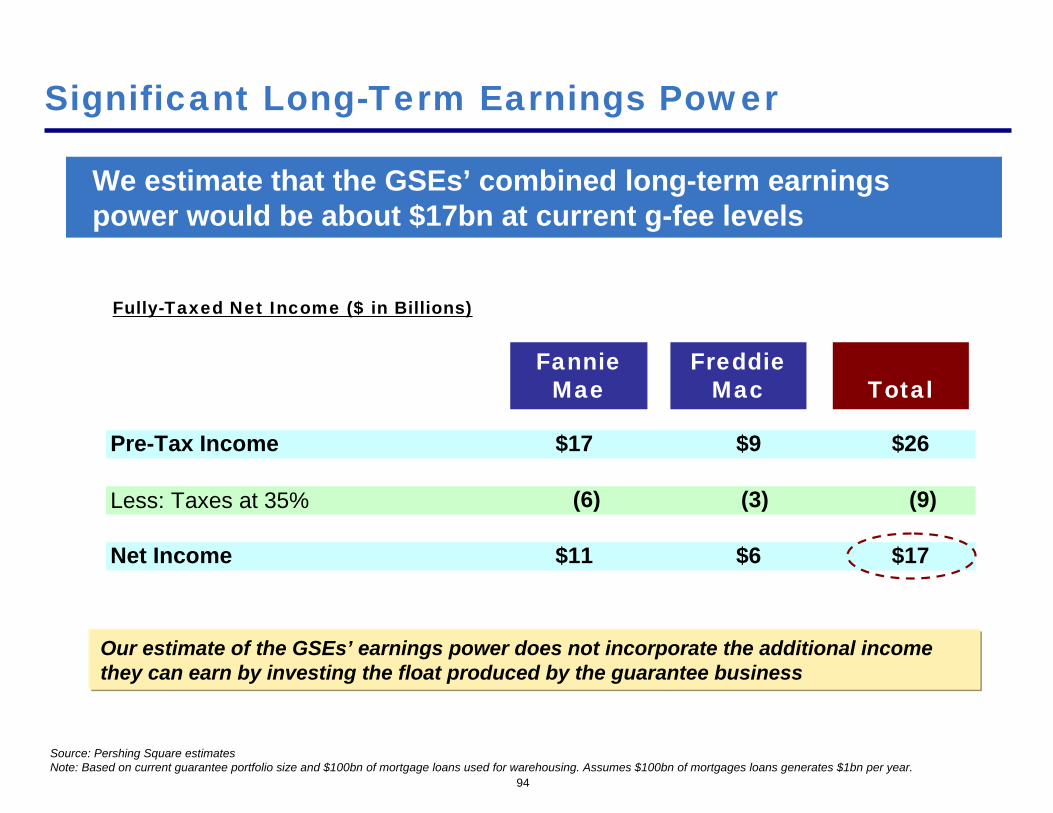
Pre-Tax Income $17 $9 $26
Less: Taxes at 35% (6) (3) (9)
Net Income $11 $6 $17
94
Significant Long-Term Earnings Power
We estimate that the GSEs’ combined long-term earnings power would be about $17bn at current g-fee levels
Fully-Taxed Net Income ($ in Billions)
Source: Pershing Square estimatesNote: Based on current guarantee portfolio size and $100bn of mortgage loans used for warehousing. Assumes $100bn of mortgages loans generates $1bn per year.
FannieMae
FreddieMac Total
Our estimate of the GSEs’ earnings power does not incorporate the additional income they can earn by investing the float produced by the guarantee business
$0
$5
$10
$15
$20
$25
$30
$35
95
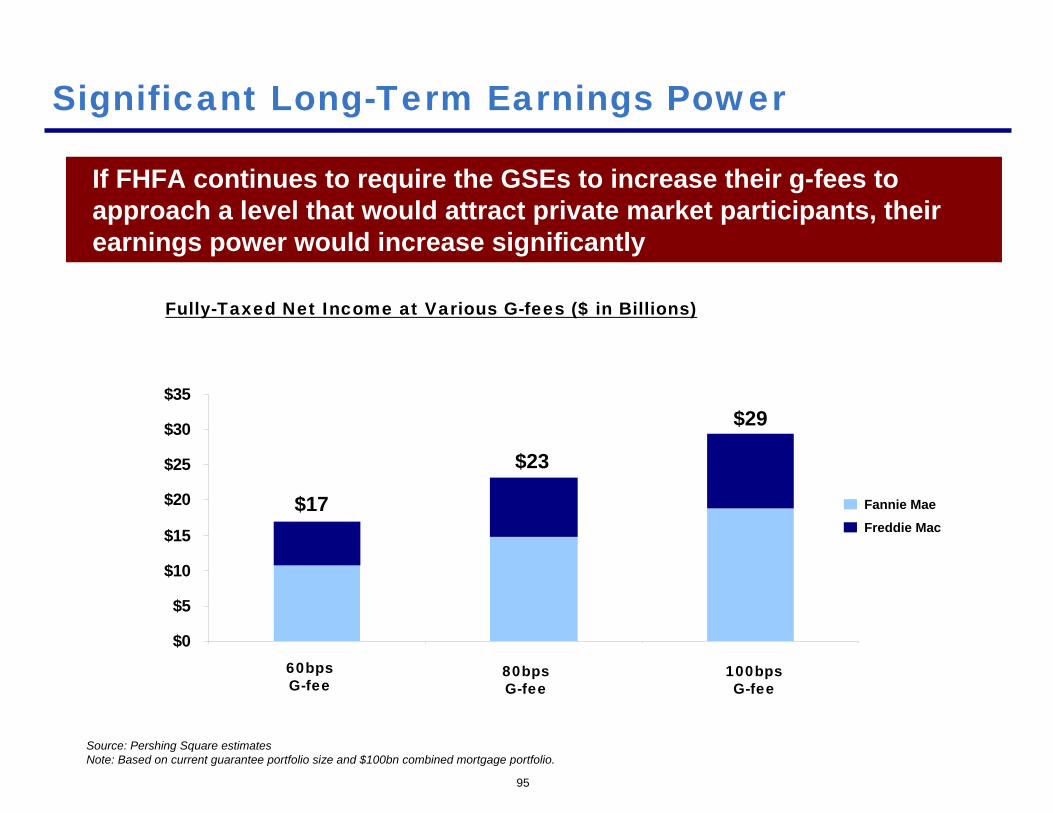
Significant Long-Term Earnings Power
If FHFA continues to require the GSEs to increase their g-fees to approach a level that would attract private market participants, their earnings power would increase significantly
Fully-Taxed Net Income at Various G-fees ($ in Billions)
$17
$23
$29
Freddie Mac
Fannie Mae
60bpsG-fee
80bpsG-fee
100bpsG-fee
Source: Pershing Square estimatesNote: Based on current guarantee portfolio size and $100bn combined mortgage portfolio.
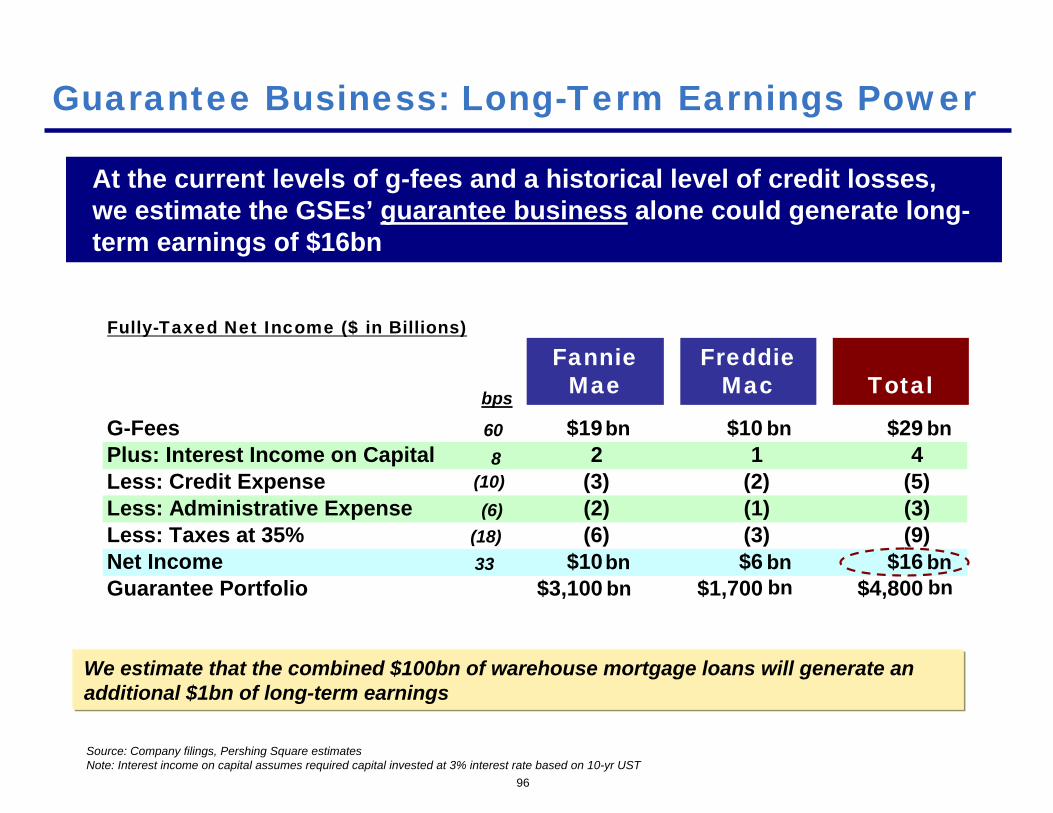
G-Fees $19 $10 $29Plus: Interest Income on Capital 2 1 4Less: Credit Expense (3) (2) (5)Less: Administrative Expense (2) (1) (3)Less: Taxes at 35% (6) (3) (9)Net Income $10 $6 $16Guarantee Portfolio $3,100 $1,700 $4,800
96
Guarantee Business: Long-Term Earnings Power
At the current levels of g-fees and a historical level of credit losses, we estimate the GSEs’ guarantee business alone could generate long-term earnings of $16bn
Fully-Taxed Net Income ($ in Billions)
FannieMae
FreddieMac Total
Source: Company filings, Pershing Square estimatesNote: Interest income on capital assumes required capital invested at 3% interest rate based on 10-yr UST
We estimate that the combined $100bn of warehouse mortgage loans will generate an additional $1bn of long-term earnings
bps
608
(10)(6)
(18)33
bn bn bn
bnbnbnbn bn bn
$0
$5
$10
$15
$20
$25
$30
97
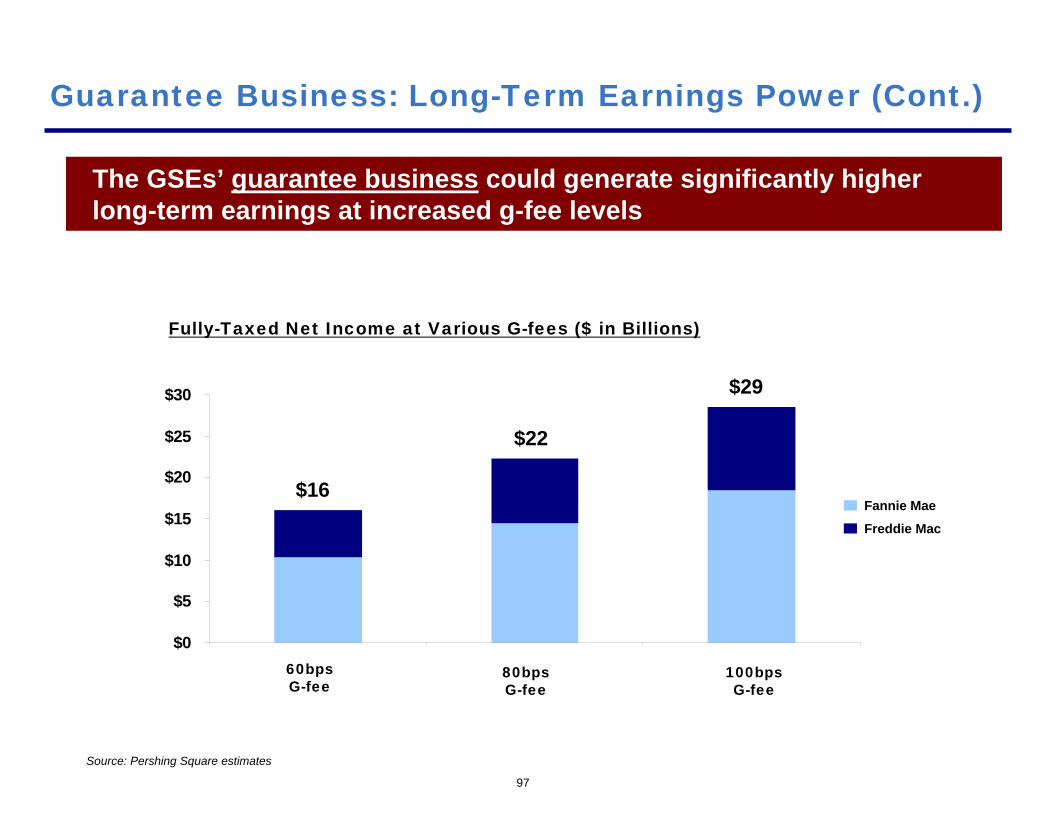
Guarantee Business: Long-Term Earnings Power (Cont.)
The GSEs’ guarantee business could generate significantly higher long-term earnings at increased g-fee levels
Fully-Taxed Net Income at Various G-fees ($ in Billions)
$16
$22
$29
Freddie Mac
Fannie Mae
60bpsG-fee
80bpsG-fee
100bpsG-fee
Source: Pershing Square estimates
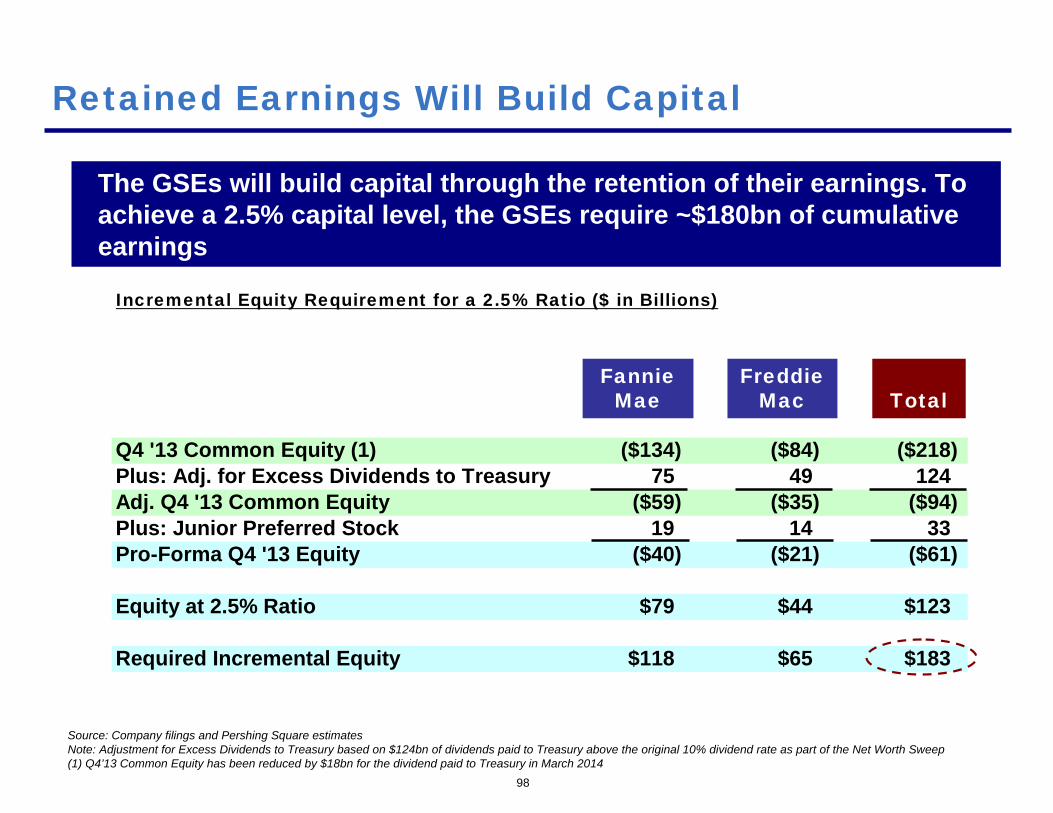
Q4 '13 Common Equity (1) ($134) ($84) ($218)Plus: Adj. for Excess Dividends to Treasury 75 49 124Adj. Q4 '13 Common Equity ($59) ($35) ($94)Plus: Junior Preferred Stock 19 14 33Pro-Forma Q4 '13 Equity ($40) ($21) ($61)
Equity at 2.5% Ratio $79 $44 $123
Required Incremental Equity $118 $65 $183
98
Retained Earnings Will Build Capital
The GSEs will build capital through the retention of their earnings. To achieve a 2.5% capital level, the GSEs require ~$180bn of cumulative earnings
Incremental Equity Requirement for a 2.5% Ratio ($ in Billions)
FannieMae
FreddieMac Total
Source: Company filings and Pershing Square estimatesNote: Adjustment for Excess Dividends to Treasury based on $124bn of dividends paid to Treasury above the original 10% dividend rate as part of the Net Worth Sweep(1) Q4’13 Common Equity has been reduced by $18bn for the dividend paid to Treasury in March 2014
$0
$5
$10
$15
$20
$25
99
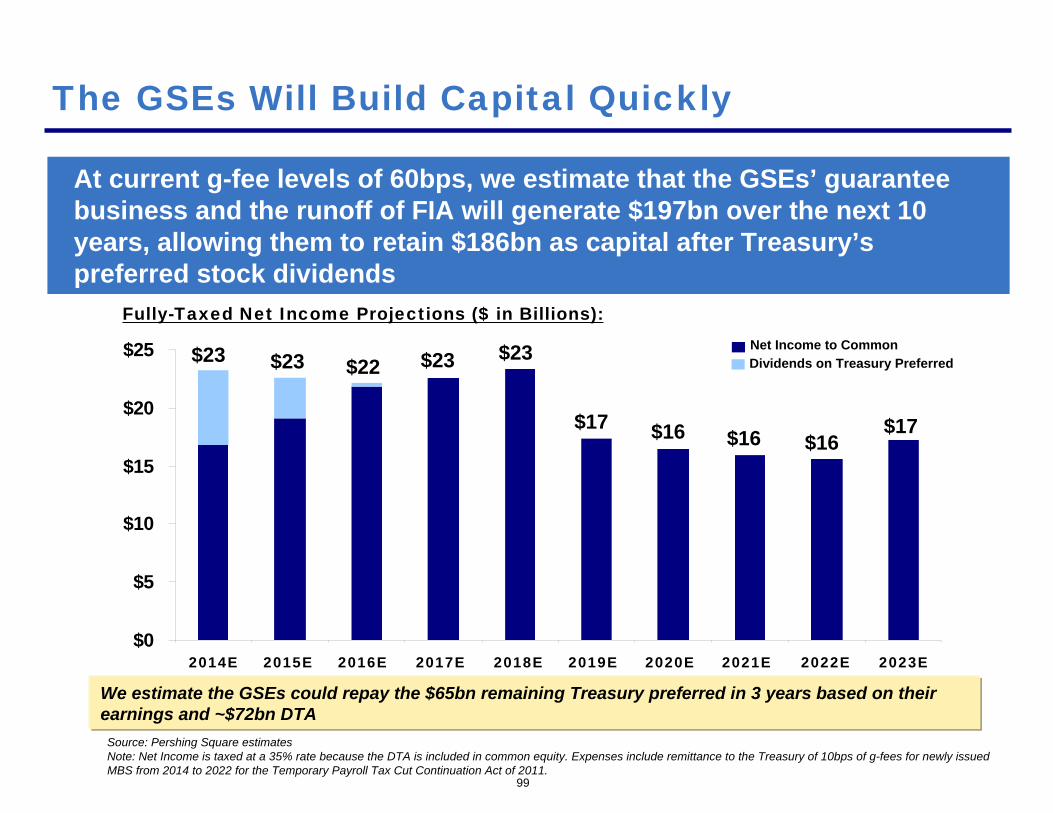
The GSEs Will Build Capital Quickly
At current g-fee levels of 60bps, we estimate that the GSEs’ guarantee business and the runoff of FIA will generate $197bn over the next 10 years, allowing them to retain $186bn as capital after Treasury’s preferred stock dividends
Fully-Taxed Net Income Projections ($ in Billions):
Source: Pershing Square estimatesNote: Net Income is taxed at a 35% rate because the DTA is included in common equity. Expenses include remittance to the Treasury of 10bps of g-fees for newly issued MBS from 2014 to 2022 for the Temporary Payroll Tax Cut Continuation Act of 2011.
$23
2014E 2015E 2016E 2017E 2018E 2019E 2020E 2021E 2022E 2023E
$23 $22 $23 $23
$17 $16 $16 $16$17
Net Income to Common
We estimate the GSEs could repay the $65bn remaining Treasury preferred in 3 years based on their earnings and ~$72bn DTA
Dividends on Treasury Preferred
$0
$5
$10
$15
$20
100
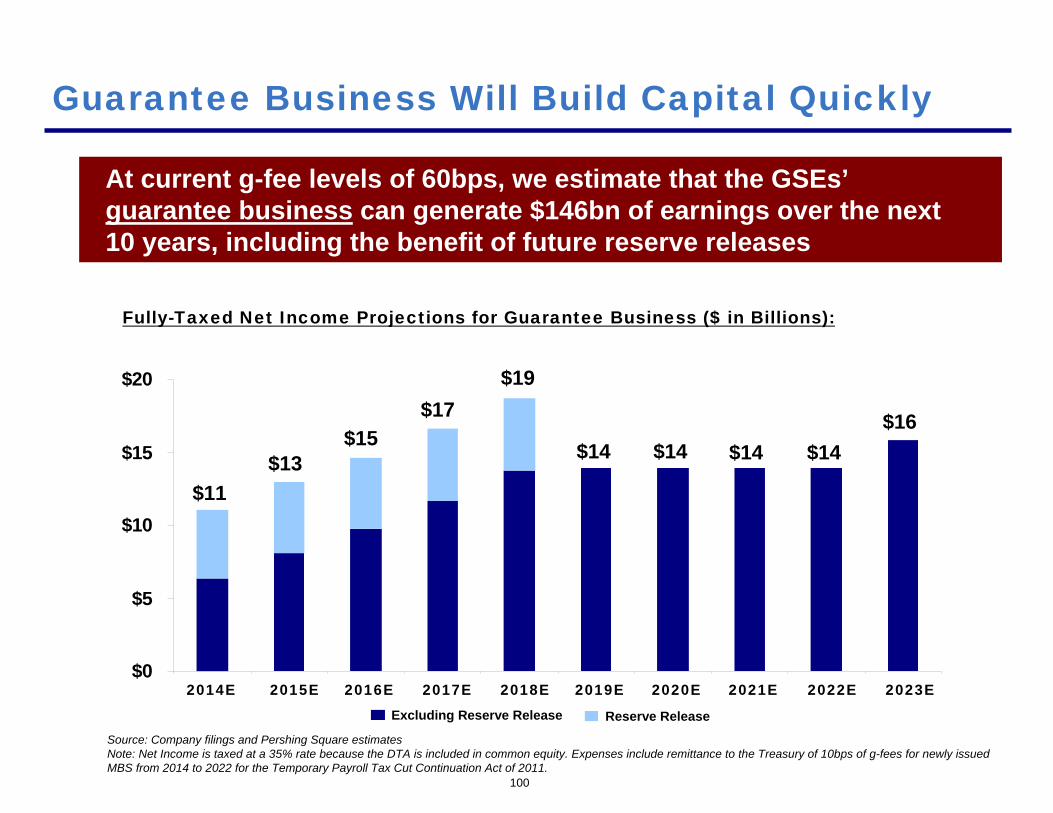
Guarantee Business Will Build Capital Quickly
At current g-fee levels of 60bps, we estimate that the GSEs’guarantee business can generate $146bn of earnings over the next 10 years, including the benefit of future reserve releases
Fully-Taxed Net Income Projections for Guarantee Business ($ in Billions):
Source: Company filings and Pershing Square estimatesNote: Net Income is taxed at a 35% rate because the DTA is included in common equity. Expenses include remittance to the Treasury of 10bps of g-fees for newly issued MBS from 2014 to 2022 for the Temporary Payroll Tax Cut Continuation Act of 2011.
$11
2014E 2015E 2016E 2017E 2018E 2019E 2020E 2021E 2022E 2023E
$13$15
$17$19
$14 $14 $14 $14$16
Excluding Reserve Release Reserve Release
$0
$3
$6
$9
$12
$15
101
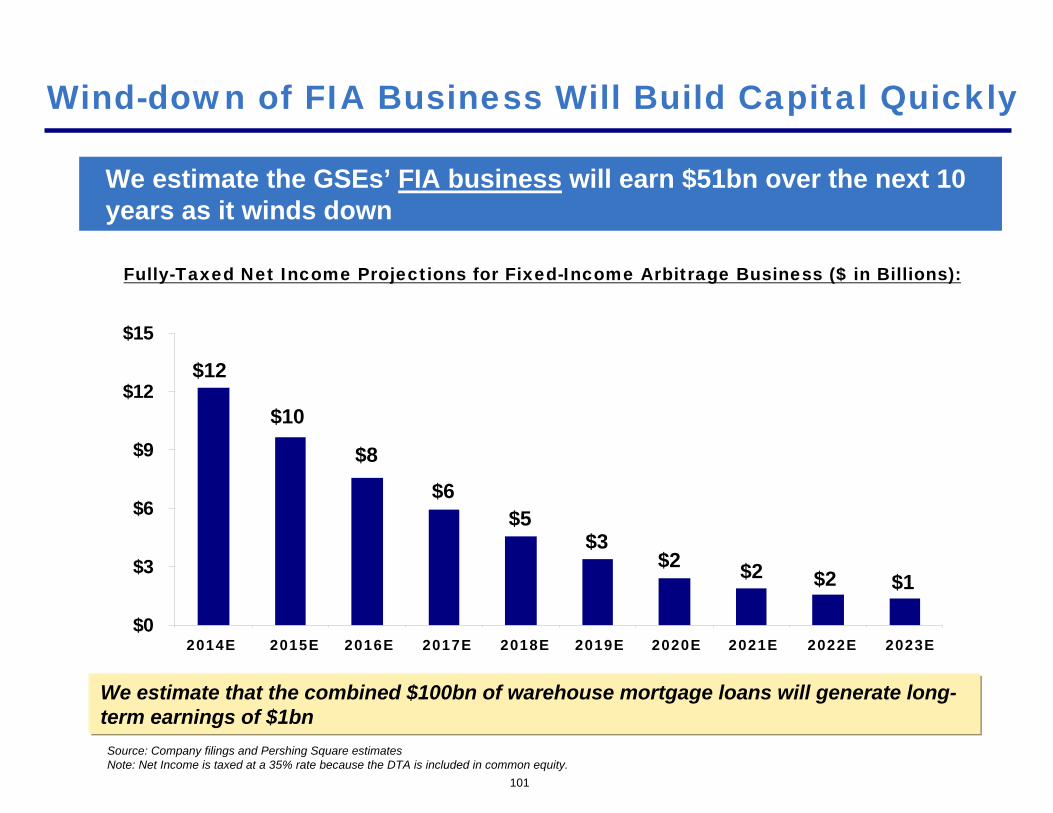
Wind-down of FIA Business Will Build Capital Quickly
We estimate the GSEs’ FIA business will earn $51bn over the next 10 years as it winds down
Fully-Taxed Net Income Projections for Fixed-Income Arbitrage Business ($ in Billions):
Source: Company filings and Pershing Square estimatesNote: Net Income is taxed at a 35% rate because the DTA is included in common equity.
$12
2014E 2015E 2016E 2017E 2018E 2019E 2020E 2021E 2022E 2023E
$10
$8
$6$5
$3$2 $2 $2 $1
We estimate that the combined $100bn of warehouse mortgage loans will generate long-term earnings of $1bn
0
3
6
9
12
102
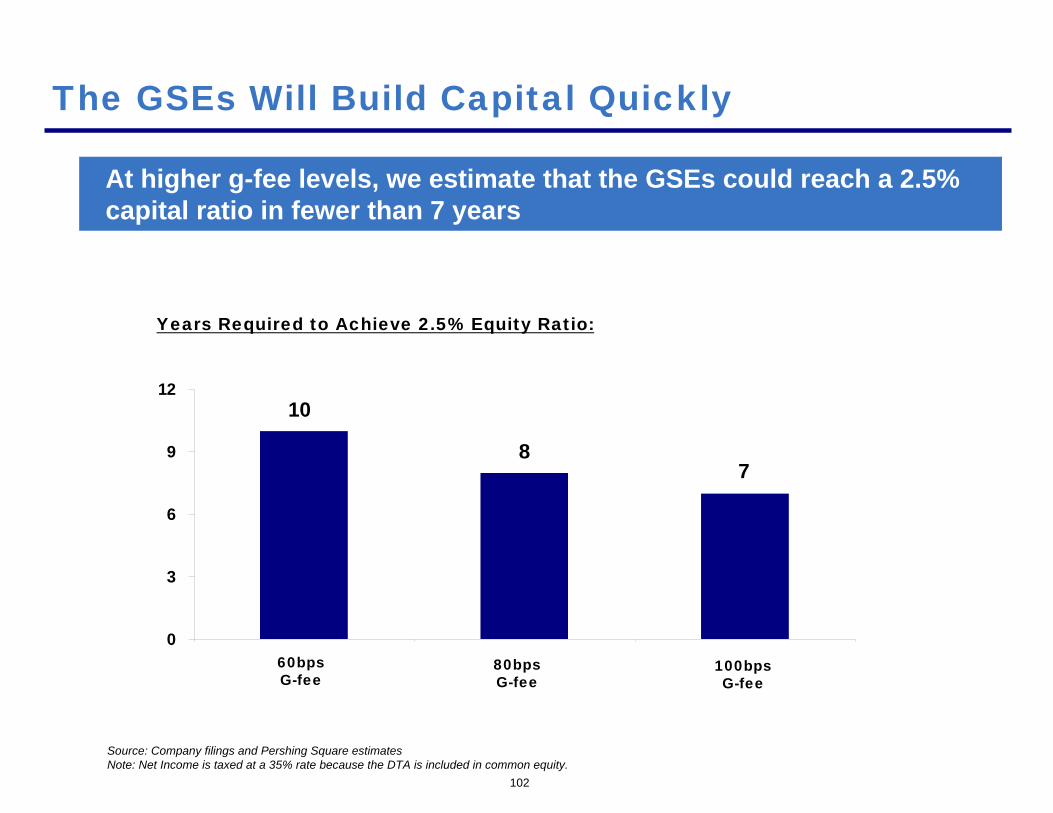
The GSEs Will Build Capital Quickly
At higher g-fee levels, we estimate that the GSEs could reach a 2.5% capital ratio in fewer than 7 years
Years Required to Achieve 2.5% Equity Ratio:
Source: Company filings and Pershing Square estimatesNote: Net Income is taxed at a 35% rate because the DTA is included in common equity.
60bpsG-fee
80bpsG-fee
100bpsG-fee
10
87

Future Value of Fannie & Freddie
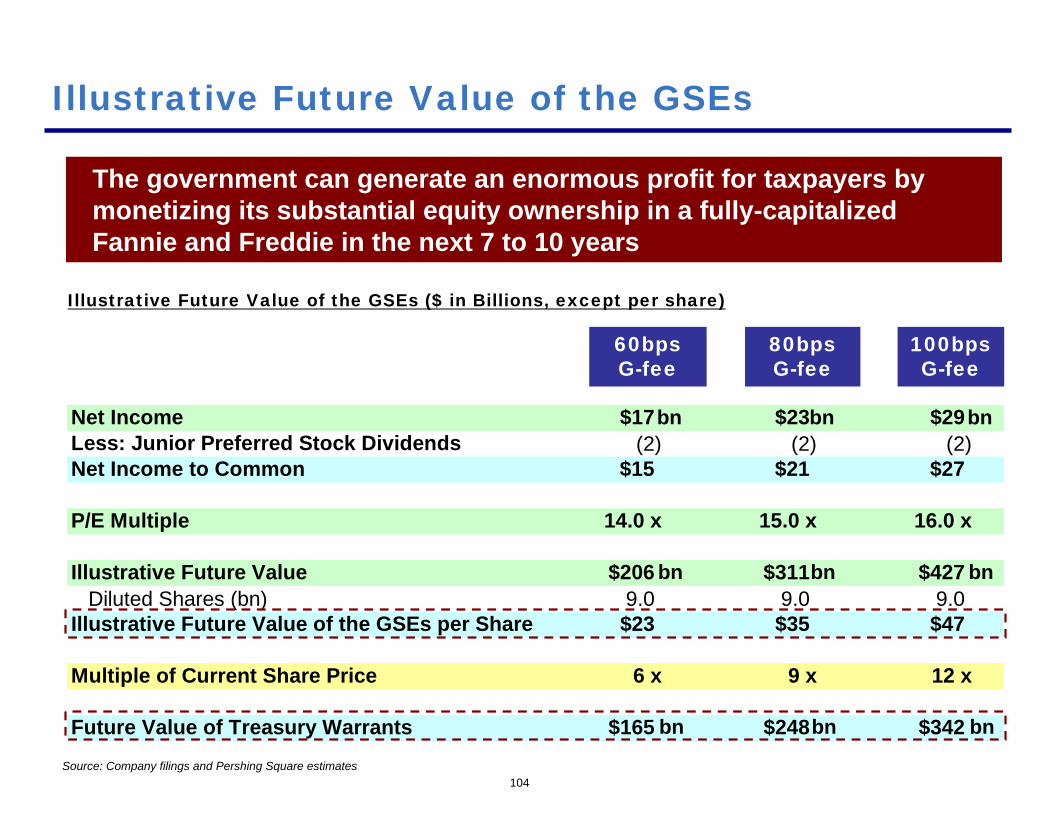
Net Income $17 $23 $29Less: Junior Preferred Stock Dividends (2) (2) (2)Net Income to Common $15 $21 $27
P/E Multiple 14.0 x 15.0 x 16.0 x
Illustrative Future Value $206 $311 $427Diluted Shares (bn) 9.0 9.0 9.0
Illustrative Future Value of the GSEs per Share $23 $35 $47
Multiple of Current Share Price 6 x 9 x 12 x
Future Value of Treasury Warrants $165 $248 $342
104
Illustrative Future Value of the GSEs
The government can generate an enormous profit for taxpayers by monetizing its substantial equity ownership in a fully-capitalized Fannie and Freddie in the next 7 to 10 years
Illustrative Future Value of the GSEs ($ in Billions, except per share)
60bpsG-fee
80bpsG-fee
100bpsG-fee
Source: Company filings and Pershing Square estimates
bn bn bn
bn bn bn
bn bn bn
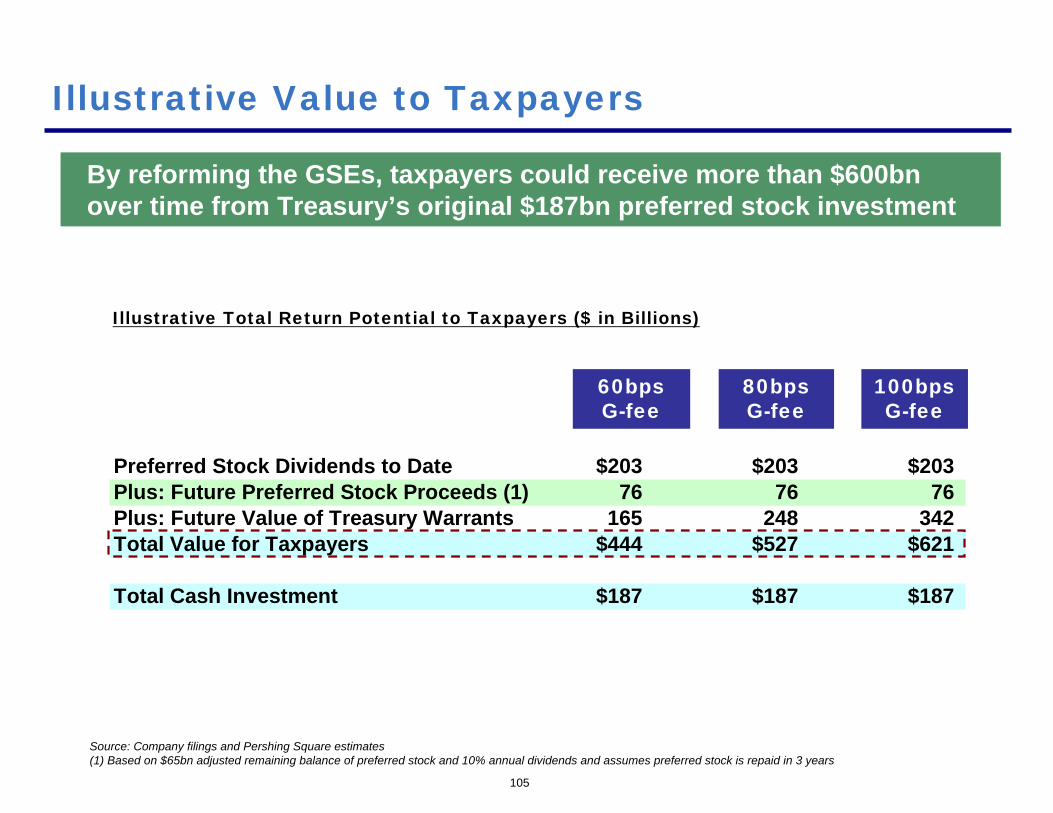
Preferred Stock Dividends to Date $203 $203 $203Plus: Future Preferred Stock Proceeds (1) 76 76 76Plus: Future Value of Treasury Warrants 165 248 342Total Value for Taxpayers $444 $527 $621
Total Cash Investment $187 $187 $187
105
Illustrative Value to Taxpayers
By reforming the GSEs, taxpayers could receive more than $600bn over time from Treasury’s original $187bn preferred stock investment
Illustrative Total Return Potential to Taxpayers ($ in Billions)
60bpsG-fee
80bpsG-fee
100bpsG-fee
Source: Company filings and Pershing Square estimates(1) Based on $65bn adjusted remaining balance of preferred stock and 10% annual dividends and assumes preferred stock is repaid in 3 years
106
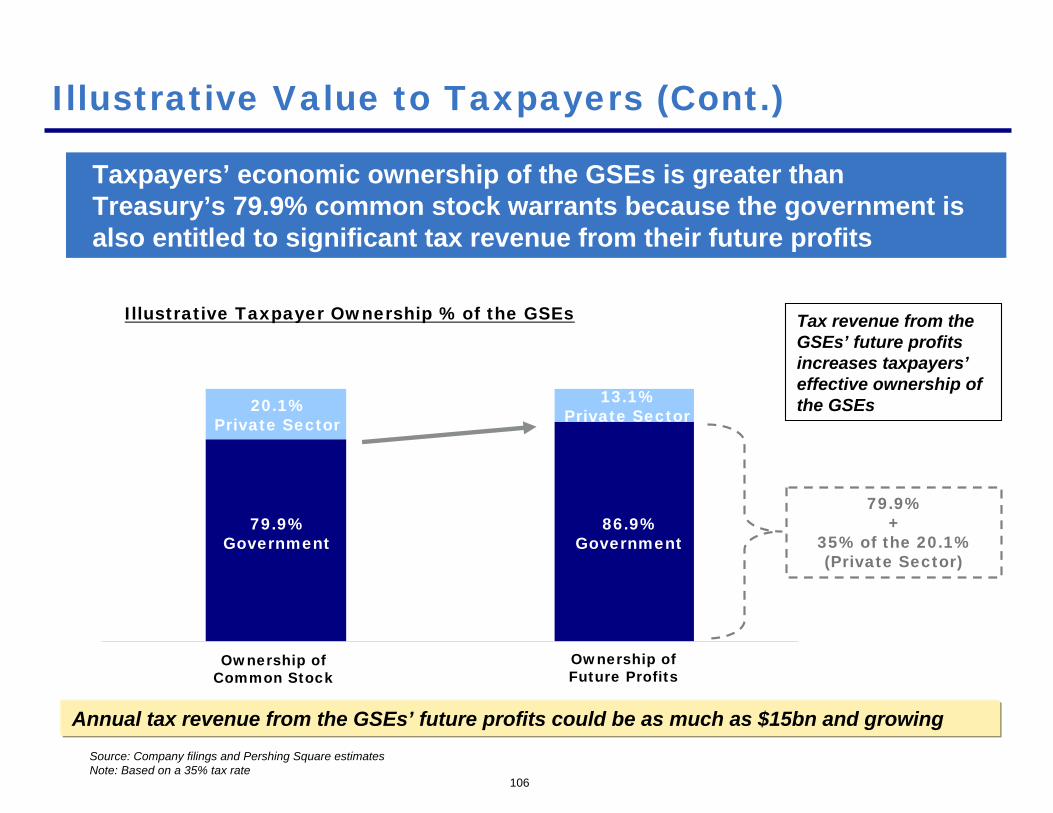
Illustrative Value to Taxpayers (Cont.)
Taxpayers’ economic ownership of the GSEs is greater than Treasury’s 79.9% common stock warrants because the government is also entitled to significant tax revenue from their future profits
Source: Company filings and Pershing Square estimatesNote: Based on a 35% tax rate
Annual tax revenue from the GSEs’ future profits could be as much as $15bn and growing
Illustrative Taxpayer Ownership % of the GSEs
Ownership of Common Stock
Ownership of Future Profits
79.9%Government
20.1%Private Sector
86.9%Government
13.1%Private Sector
Tax revenue from the GSEs’ future profits increases taxpayers’effective ownership of the GSEs
79.9%+
35% of the 20.1% (Private Sector)
107
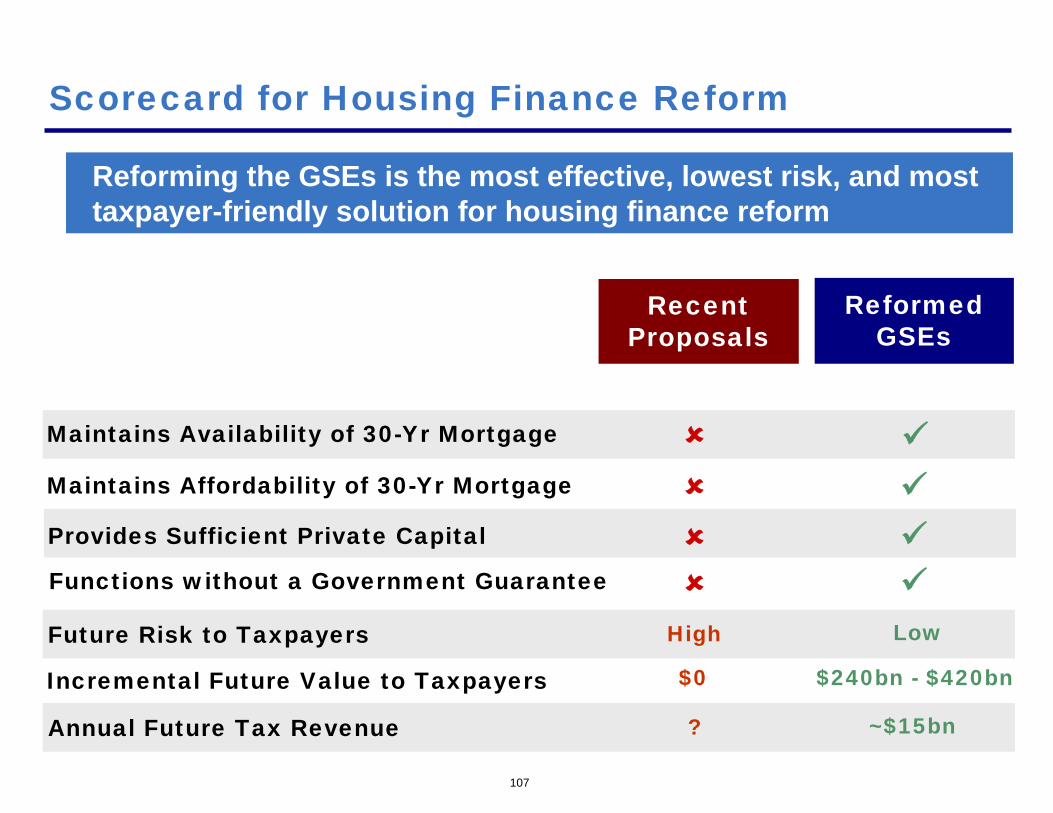
Scorecard for Housing Finance Reform
Recent Proposals
ReformedGSEs
Future Risk to Taxpayers
Functions without a Government Guarantee
Provides Sufficient Private Capital
Maintains Availability of 30-Yr Mortgage
High Low
Maintains Affordability of 30-Yr Mortgage
Incremental Future Value to Taxpayers $0 $240bn - $420bn
Reforming the GSEs is the most effective, lowest risk, and most taxpayer-friendly solution for housing finance reform
Annual Future Tax Revenue ? ~$15bn
108
Potential Alternatives to Build Capital More Quickly
Treasury converts its remaining $65bn of preferred stock into common stock at a share price that reflects the GSEs’ value
Similar to Treasury’s conversion of preferred stock in AIG and Citi
Treasury allows the GSEs to raise new capital
We estimate that the retention of the GSEs’ earnings will allow them to become fully capitalized in no more than a decade. There are several potential alternatives to capitalize them more quickly
We believe affordable housing is extremely important. Our recommendation provides an opportunity to fund affordable housing through a variety of potential alternatives
109
Thoughts on Affordable Housing
A portion of the $240 to $420bn of future taxpayer profit could be allocated to fund affordable housing
A surcharge could be implemented on newly issued MBS
The GSEs could contribute a portion of their profits above an ROE threshold
A portion of the $15bn and growing annual tax revenue from the GSEs could be allocated to fund affordable housing
Potential methods to fund affordable housing:
We welcome additional alternatives to fund affordable housing, and believe our recommendation to reform the GSEs provides the largest potential source of funds for affordable housing
Loss of available and affordable 30-year, fixed-rate, prepayablemortgages, reduced value of housing, and reduced local real estate tax revenue
Loss of as much as $420bn of additional future proceeds to the Treasury on its preferred stock investment
Loss of as much as $15bn and growing future annual federal tax revenue
Loss of more than 12,000 jobs at Fannie and Freddie
Loss of a system that has successfully served the needs of American homeowners for more than 80 years
Failing to reform the GSEs will impose significant costs on society
110
A World Without the GSEs