~ition for water in rural areas - irc :: home · snep service national d’eau potable (national...
TRANSCRIPT
~ITION4~CT
Operated byCDM and Associates
Sponsored by the U.S. Agencyfor International Development
1611 N. Kent Street, Room 1002Arlington, VA 22209-2111 USA
Telephone: (703) 243-8200Telex No. WUI 64552
Cable Address WASHAID
LIBRj~,RYINTJ~ATI’~N~LREFERENCE CENT~EFOR COMMU’~y WATER SUPPLY ANDSANITATION (IRC)
WILLINGNESS TO PAY
FOR WATER IN RURAL AREAS:
METHODOLOGICAL APPROACHES
AND AN APPLICATION IN HAITI
WASH FIELD REPORT NO. 213
SEPTEMBER 1987
Prepared for
the Office of Health,Bureau for Science and Technology,
U.S. Agency for International DevelopmentWASH ActivityNo.’166
264—4160- ~ ~
1 ht’ \\7\SI 1 I’r j’ t ~ ni~in,ig~dv ( ~flip t )r~’~~ur~ \t Kt’tt~t’ri~iit 1 I)( ‘ri 1 1( i 1
t 1 (t 1~)( rIt ig iI)~i til (0(1” (TO
~lo 011? 0 t( t? ‘. (it \~‘~t(t LUI “,
in I’~~irii )ovolt;1ITT(Ill. 1it t 11(11 (iii II 1(11 ( (‘ 1 fl1
Nnitloi~ lililIN, in
‘t t h t i iiiir~It t n~ttilt in:
II ii tT~ i’~(.(tint ~ Gi t tiit t
ii\(T-it\ ctt .Noiih ( nottilt
\i ( !iiitl

.
.

VASH FIELD REPORTNO. 213
VILLINGNESS TO PAY FOR WATER IN RURAL AREAS:KETHODOLOGICAL APPROACHESAND AN APPLICATION IN HAITI
Prepared for the Office of Health,Bureau for Science and Technology,
U.S. Agency for International Developmentunder WASHActivity No. 166
by
Dale WhittingtonJohn Briscoe
andXinming Ilu
With the assistance in the Haiti case study of
William BarronJean-Maurice Duval
Tom Bourgeois —
September 1987
Water and Sanitation toL Health Project
Contract No 5942—C—00—4085—O0,Project No. 936—5942
is sponsored by the Office of Health, Bureau for Science and Technology
13.5. Agency for International Development
Washington, DC 20523
LIBRARY, INTERNAT1ONAL REFERENCECENTRE FOR CC~1MUN1tYWAl EN SUPPLYAN~) •t~T~~(tE’)P.C. E::: £3t~, 2TCi9 AD Tho Hzigu~Tot. (070) 8i49~1t~,;t.~41j142
RN: ~LO:
26L-1g:1i Uiji

S
S
S
.

TABLE OF CONTENTS
dHAPTR_R Page
ACKNOVLEDGMENTS iii
LIST OF ACRONYMS v
EXECLJTIVE SLJMMARY vii
1. INTRODUCTION AND OBJECTIVES OF THE STUDY 1
2. VILLINGNESS TO PAY IN RURAL WATER PROJECTS: A REVIEW OFUSAID, WORLDBANK, AND 1DB PROCED~JRESAND EXPERIENCE 5
2.1 USAID Evaluatlons 62.2 World Bank Projects 72.3 1DB Projects 10
3. THEORETICAL FRAMEWORKAND METHODOLOGICALAPPROACHESASSESSINGTHE WILLINGNESS TO PAY FOR RURAL WATER SERVICE 13
3.1 Household Production Function Model 143.2 The Discrete—Continuous Water Demand Model 173.3 Sources of Data for Estimating Domestic Water
Demand Relationships 193.3.1 The Direct Approach: Contingent Valuation Method 203.3.2 The “Indirect” Approach 233.3.3 Hedonic Property Value Model 233.3.4 The Varying Parameter Demand Model 24
4. A CASE STUDY OF THE USE OF CONTINGENTVALUATIONSIJRVEYS IN SOIJTHERN HAITI 27
4.1 The Study Area 274.2 Water Sources and Water Use Patterns and Customs 304.3 Research Design 30
4.3.1 The Question Format 314.3.2 Strategic Bias 314.3.3 Starting—point Bias 324.3.4 Hypothetical Bias 32
4.4 Field Procedures 324.5 Analysis of the Source Observation Data 354.6 Analysis of the Contingent Valuation Bids in Laurent
and St. Jean du Sud 374.7 Conclusions from the Haiti Case Study 38
—1—

S
TABLE OF CONTENTS (Cont’d)
CHAPTER Page
5. SUMMARYOF FINDINGS AND CONCLUSIONS 41
6. RECOMMENDATIONS 45
REFERENCES 47
eAPPENDICES
‘ A. Household Questionnaire 55B. Analysis of the Contingent Valuation Bids 79
FIGURES
1. An Individual’s Demand Curve and the Economists’ Definitioriof Willingness to Pay 3
2. Map of Haiti 29
SPROTOS
1. Public Tap under Construction by CARE in St. Georges, Haiti 282. Women Washing Clothes in Outfiow from Captured Water
Source in Rosier, Haiti 283. CARE Public Tap and Shovers in Rosier, Haiti 344. CARE Public Tap in Port-â—Piment, Haiti 34
TABLES
1. Apparent Villingness to Pay for Water in Rural Areas 82. Comparison of Study Villages (Laurent and St. Jean du Sud) 363. Test for Strategic Bias (Laurent) 824. Test for Starting—point Bias (Laurent) 83
‘~ 5. Willlngness—to—pay Bids for Public Standposts (Laurent) 856. Willingness—to—pay Bids for Private Connectlons (Laurent) 867. Test for Direct Question and Bidding Game (St. Jean du Sud) 888. Test for Strategie Bias (St. Jean du Sud) 899. Test for Starting—point Bias (St. Jean du Sud) 9010 Willingness—to—pay Bids for Public Standposts (St. Jean du Sud) .. 9111. Willingness—to-pay Bids for Private Connections (St. Jean du Sud). 92
— ii —

ACKNOVLEDCMENTS
This study was initiated as a result of the interest of AID in improvingprocedures for developing approprlate rural water supply projects.Particularly Important in the formative stage was the interest of MonicaSindirig of the Asia and Near East Bureau and John Austin of the AID Of fice ofHealth. Individuals from the Inter—American Development Bank, including JuanAlfaro, Walter Ross, Christian Gomez, and Terry Powers, and persons from theWorld Bank, inciuding Tony Churchill, David de Ferranti, Fred Golladay, SteveMayo, Steve Malpezzi, Bob Roche, and Mike Garn, provided insights intodeveloping an approach to the problem of willlngness to pay for water in ruralareas and assisted the research team In identlfying and obtaining material forthe case studies. The study team also benefited from discussions with V.Kerry Smith of Vanderbilt University and Dennis Warner, WASH Deputy ProjectDirector. Bert Zelimer, Leonard Wolfenstein, and Charles P111 served asresearch assistants on the project, and we are indebted to them for theirefforts.
Our Held research in Haiti would not have been possible without theassistance of nurnerous individuals. In particular, ve wish to thank JonathanMitchell (CARE), Ann Raposa (CARE), Louis Jasmine (CARE), Seott Faiia (CARE),and Dave Smlth (IJSAID-Haiti).
— lii —

S
S
S
S
S
S
S
S
S

LIST OF ACRONYMS
CVM Contingent Valuation Method
IBRD International Bank for Reconstruction and Development
1DB Inter-American Development Bank
PPC Program, Policy and Coordination Bureau, AID
SNEP Service National d’Eau Potable (National Water Authority inHaiti)
USAID United States Agency for International Development
WTP Willingness to Pay
-v-

S
S
S
S
S
S
S
S
S
S
S

EXECUTIVE SIJMMARY
Progress in improving the quality and quantity of water used by people Indeveloping countries has been unsatisfactory in two respects: systems thathave been built are frequently neither used correctly nor maintained properly,and extension of improved service has been slov. A major impediment tolmproved performance is inadequate information concerning the response ofconsumers to new service options. The behavioral assumptions that typicallyunderlie most rural water supply planning efforts are simple. It is commonlyassumed that as long as the financial requlrements do not exceed 3 percent to5 percent of income, rural consumers will choose to abandon their existingwater supply in favor of the improved system. Experience has shown that thissimple model of behavioral response has usually proved incorrect.
1f rural water projects are to be both sustainable and replicable, an improvedplanning methodology is required that inciudes a procedure for elicitingInformation regarding the value that households place on different levels ofservice. A key concept in such an improved planning methodology is that of“villingness to pay.” 1f people are villing to pay for a particular service,that is a dear indication that the service is valued (and therefore viii mostlikely be used and maintained) and that it is possible to generate the fundsrequired to sustain and replicate the project. The first objective of thisstudy was thus to assess and develop the methodological approaches availablefor estimating individuals’ wiiiingness to pay for rural water services.
This report reviews the planning experiences of the United States Agency forInternational Development (USAID), the World Bank, and the Inter—AmericanDevelopment Bank (1DB) In the rural water sector in order to
(1) identify cases where wiilingness—to—pay procedureshave been incorporated into the design of rural waterprojects, and
(2) examine rural water supply project evaluations forinsights into the factors that determine villingnessto pay.
On the basis of this review, it was found that the 1DB is the only major donorin the sector systematically Incorporating willingness-to—pay considerationsin its planning and project design procedures.
The report then describes a theoretical model for understanding village wateruse behavior vhich attempts to explain both the household’s decision regardingvhich water source to use and how much water to use from that source. Theapplication of this “discrete-continuous model” of household water demand willprobably be successful in accurately predicting source choice decisions, andIt viii represent a major advance in understanding water use behaviorin developing countries.
— vii -

S
Two complernentary types of data can be used to estimate such a modeldescribing household water use behavior: The first (or “direct”) approach issimply to interview an individual and ask directly how much he or she would bevilling to pay for a public tap or private connection. This direct approachto estimating villingness to pay is termed the “contingent valuation method.”Most of the applications of the contingent valuation method have involvedefforts to measure the willingness of individuals to pay for changes inenvironmental quality and have been conducted in either the United States orVestern Europe. Until this study, no systematic attempts vere made todetermine its suitability for assessing willingness to pay for publiclyprovided goods in developing countries. Axnong the advantages, a contingentvaluation survey is inexpensive, can be used to value services not eurrentlyavailable in the village, and provides a procedure for incorporating communitypreferences into the planning process. The major disadvantage Is that for avariety of reasons individuals may not reveal their actual willingness to payin the interview process. (Ways of overcoming this problem are discussed in SChapters 3 and 4 of this report.)
The second (or “indirect”) approach is to collect data on actual observedbehavior. In this case, the planner collects information on the source ofwater chosen, the quantities of water collected by different househoids, thetime spent collecting water, and other source and household characteristics, 5and on the basis of consumer demand theory infers how much the household wouldbe villing to pay for an improved water supply. The major advantage of thisapproach is that the estimates of villingness to pay are based on vhat peopleactually do, not on what they say they will do. Among the disadvantages,(1) it may not be feasible in many locations because there is insufficientvariation in the water source and household characteristics, (2) results mayhave to be extrapolated beyond the range of the data, and (3) a discrepancymay exist between the revealed value of a commodity and the payments which ahousehold will actually make when the commodity or service is made available.The report considers other “indirect” procedures for estimating willingness topay but conciudes that they do not have great promise as practical planningtools in the rural water sector.
The secorid objective of this project was to field test the contingentvaluation methodology to determine vhether it could provide a practical toolfor Inexpensive, rapid assessments of a community’s willingness to pay forlmproved water services. The report describes a case study conducted in twovillages in southern Halti during August 1986, In which individuals ‘were askedhow much they would be villing to pay for (a) a public water tap near their Shome and (b) a private conriection or yard tap. The findings from this fieldstudy have many implications for future efforts to use the contingentvaluation methodology in developing countries. Among the most importantfindings are the following:
o Respondents took the contingent valuation questions,and indeed the entire interview, seriously. Respon—dents did not give either unrealistic or “protest”bids.
— viii —
S

o The mean of the willlngness-to-pay (WTP) bids in thevillage of Laurent for public taps was $1.15 US permonth, approximately 1.5 percent of per capita ineomeand significantly lower than the 3 percent to 5percent of Income rule of thumb. On the basis ofthese WTP estimates, the village as a whole couldafford to pay approximately $3,000 annually tovard thecost of a community water system with public taps.The mean of the WTP bids for private connections,which was $1.40 ijS, was not significantly higher.
o The research design tested for several threats to thevalidity of the survey results (strategie bias, start—ing—point bias, and hypothetical bias). No evidenceof any of these biases was found.
o The bidding game question format was more effectivethan open—ended questions.
0 The WTP bids for Laurent vere systematically relatedto the household and source characteristics suggestedby consumer demand theory. For example, householdsfarther away from their existing source vere villingto pay more for a new public tap than a householdclose to the traditional source. Similarly, high-income househoids were willing to pay more than low-income households. These results suggest that the WTPbids offered by individuals are meaningful and notsimply numbers “pulled Out of the air.”
In summary, results of the Held test in Haiti suggest that contingentvaluation surveys are feasible in developing countries and that anInexpensive, quick survey may provide valuable information on households’villingness to pay for improved water services. Such information could beparticularly helpful in (1) identifying communities vhich could meet specifiedcost—recovery targets, (2) determining prices and connection fees to chargefor the improved water services, and (3) determining the appropriate level ofservice and the water system capacity required. The implicatlons of thisstudy are not limited to the rural water sector. Contingent valuation surveysmay be a viable method of collecting villingness—to-pay information for a widerange of public infrastructure projects and public services In developingcountries.
- Ix —

.
S
S
S
S
S
S
S
S
S
S

Chapter 1
INTRODUCTION AND OBJECTIVES OF THE STUDY
Progress in improving the quality and quantity of water used by people inrural areas of the developing world has been unsatisfactory in two respects:systems that have been built are frequently neither used correctly normaintained properly, and extension of improved service to unserved populationsbas been slow. Though this poor record is not the result of a single factor,a major impediment to improved performance Is inadequate informationconcerning the response of consumers to new service options.
The behavioral assumptions that typically underlie most rural water supplyplanning efforts are simple. It is commonly assumed that so long as financialrequirements do not exceed 3 percent to 5 percent of income, rural consumerswill choose to abandon their existi.ng water supply in favor of the “improved”system. Several reviews by the World Bank, bilateral donors, and water supplyagencies in developing countries have shovn, however, that this simple modelof behavioral response to improved water supplies bas usually proved incorrect(Saunders and Warford 1977; IBRD 1986a and 1986b; Australian DevelopmentAssistance Bureau 1983; Federal Republic of Germany 1983; CanadianInternational Development Agency 1983; European Economie Community 1983).When the “3 percent to 5 percent of income” rule is used to set levels ofservice, in many communities the level of service is too bv (i.e., thecommunity does not value the improved service and, therefore, will not pay forit), vhereas in other communities the level of service is too high (that is,the community vants the service but not at the price that has to be charged).
Incorrect Information on water use can adversely affect project design interms of technology choice, level of service, the timing and scale of capacityexpansions, and the price structure established. Not only will resources beallocated inefficiently, but the financial viability of the water system maybe seriously misconstrued. Large shortfalls in revenues and inability toreach cost-recovery targets are cominonplace, with the result that operatlonsand maintenance are not carried out and systems fall into disrepair.
1f rural water projects are to be both sustainable and replicable, an improvedplanning methodobogy is required that includes a procedure for elicitinginformation on the value placed on dlfferent levels of service, and tariffsmust be designed so that at least operations and maintenance costs (andpreferably capital costs) can be recovered. A key concept in such an improvedplanning methodology Is that of “willingness to pay.” 1f people are willingto pay for a particular service, that Is a dear indication that the serviceIs valued (and therefore will most likely be used and maintained) and that Itwill be possible to generate the funds required to sustain and even replicatethe project. Because the words “villingness to pay” have both a technicalmeaning (in economics) and a lay meaning, it is important to specify preciselyhow the term is used in this study.
—1—

S
In economics, “willingness to pay” (WTP) is a measure of the maximum amountthat a person would be villing to pay for a service rather than do vithout it.As shown In Figure 1, WTP is the area under the demand curve. That is, it isnot simply the amount paid for a service but that amount plus the “consumers’ Ssurplus.” This WTP is the economist’s measure of the benefits to theindividual of a water supply project. The water demand function illustratedin Figure 1 can also provide water supply planners and engineers withinformation concerning the amount of reveriue that can be recovered ifdifferent prices are charged for water. For example, if P1 is charged, thetotal revenue from water sales will be P1Q1.
The importance of the concept of willingness to pay for water in rural areashas been understood for some time. Twelve years ago the World Bank concludedthat adequate Information on the villingness to pay for water in rural areaswas “absolutely essential for any noticeable improvement In the rural watersupply situation in the deveboping world” (Saunders and Warford 1977).Despite this long—standing recognItion, little progress has been made in thefleld. Most attempts to incorporate villingness—to—pay considerations intoproject design have been ad hoc, in large part because of the absence ofvalidated, field-tested methodologies.
The objectives of this study were, first, to assess and develop methodobogicalapproaches for estimating individuals’ wilblngness to pay for rural water Sservices, and, second, to field test one of these methodobogies to determineits applicability as a practical planning tool. Chapter 2 presents theresuits of a survey of rural water supply projeets funded by USAID, the WorldBank, and 1DB. The purposes of this survey vere (1) to determine the existingpractices of the major donors in estimating WTP for water services, (2) toidentify the most promising approaches for incorporating WTP considerations in 5project analysis, and (3) to glean insights on factors affecting WTP fromex-post project evaluations. Chapter 3 of the report discusses two majorapproaches for assessing WTP for water in rural areas of deveboping countries.The first procedure (the “indirect” approach) uses data on observed water usebehavior (that is, quantities used, travel and queue times, and perceptions ofwater quality) to infer the extent to which improved and alternative watersources are valued and thus to assess the response of consumers to differentcharacteristies of an improved water system. The second procedure (the“direct” approach) involves asking people direetly how much they would pay fordifferent levels of improved water services; this procedure is termed the“contingent valuation method” (CVM).
Chapter 4 presents the resuits of a field test of the CVM that was conducted Sin Haiti during August 1986 in colbaboration with CARE’s Southern Haiti RuralWater Supply Project funded by USAID. The fifth and final chapter presentsconclusions and policy recommendations.
S
S
—2—
S

Price(S/cubic meter)
p
_____ willingness-- topayforq
Demand Curve
q Ouantity of Water from the
Improved Source (cubic meters)
Flgure 1.
An Individual’s Demand Curve and the Economists’DefInition of Willlngness to Pay
consumer’ssurplus
amount paidfor quantity q
—3—

S
S
S
S
S
S
S
S
S
S

Chapter 2
WILLINGNESS TO PAY IN RURAL WATER PROJECTS:A REVIEW OF USAID, WORLDBANK, AND 1DB
PROCEDURESAND EXPERIENCE
During the initial stage of this project, the planning experiencesof threemajor donors that have been Involved in the rural water sector were reviewedin order to: (1) identify caseswhere willingness—to—payprocedureshave beenincorporated into the design of rural water projects; and (2) examine ruralwater supply project evaluations for Insights into revealed villingness to pay(vhether or not WTP considerations were formally incorporated into the projectdesign). Material for case studies was sought at the three major devebopmentinstitutlons that vere reasonably accessible: the U.S. Agency for InternationDevebopment (USAID), the Inter-American Devebopment Bank (1DB), and the WorldBank. Rural water supply projects that either incorporated WTP consldera—tions into project design or that might have evaluations which would beinformative on actual WTP were identified, both through discussions withofficials at these institutions and through systematic searches of projectfiles. To put the material obtained into context, it is necessary tounderstand something of the history of Involvement of these institutions inthe rural water supply sector, which has been quite different in each case.
USAID has been involved in the sector for many years but until recently hasattached little irnportance to issues of cost recovery (and thus of willingnessto pay). Because USAID has to report to Congress on projects that have beenexecuted with USAID funds, hovever, some ex—post project evaluations providedlnsights into revealed villingness to pay. The series of evaluations carriedout by the Program, Policy and Coordination (PPC) Bureau in the early 1980sproved to be a particularly valuable source of information.
The World Bank has put great emphasis in published material on issues ofwlllingness to pay and cost recovery. For example, in their book VillageWater Supp~y, Saunders and Warford (1977) pinpoint incorporation of WTPconsiderations ifito the design of rural water projects as the single mostimportant issue in the sector. The World Bank, however, is a relativenewcomer to the rural water supply sector, havlng started after thearticulatIon of the poverty groups’ development strategy in the 1970s, andstill has funded only a handful of “pure” rural water supply projects (asopposed to components of overall rural devebopment projects). Incorporationof WTP factors into the design of its rural water supply projects has beenuneven and ad hoc. Ex-post evaluations (called Project Performance AuditReports) are produced only some time after project completion and of ten areprlmarily actuarial rather than substantive In nature. These provided nouseful materlal to this study. Nevertheless, some interesting information hasemerged from the Bank’s rural water supply planning documents.
Although the Inter—American Devebopment Bank shares some characteristics withthe World Bank, It has vritten much less on the importance of willingness topay and is generally considered to take a “softer line” on cost recovery. Indiscussions with 1DB officials It was learned, however, that since the late
-5—

S
197Os all 1DB rural water projects have been prepared on the basis of a commonmethodobogy that Inciudes collecting household—level data from a large numberof families in the areas to be served and the estimation, from these data, ofdemand curves for water. These data are used by 1DB primarily to estimateoverall benefits and not to set tariffs or to decide on levels of service, butthey are a unique and rich source of Information on the demand for water inrural areas.
The Information collected from each of the institutions is thus quitedifferent. The USAID evaluations are a useful source of information onfactors that have affected participation in, and villingness to pay for,improved rural water supplies. The World Bank data provide some informationon villIngness-to-pay surveys, whlch were designed primarily to assess howtariffs should be set and whether costs could be recovered from the projects.The 1DB files offer an extensive set of household—level data, vlth analysesused almost exclusively to derive demand curves for estimating benefits. S
It is also pertinent to point out that the methods used in these cases vary.In the USAID evaluations all conciusions are drawn strictly on the basis ofobserved behavior, and inferences about determinants are made from theseobservations. The 1DB case studies also examine only actual behavior andestimate demand functions directly from that. In a few of the investigations 5carried Out in World Bank project preparation exercises, an understandirig ofthe magnitude and determinants of WTP was sought through surveys whichincluded direction questions about an individual’s willingness to pay forwater services.
2.1 USAID Evaluations
The principal conclusion dravn from the evaluations of the seven USAID ruralwater supply projects Is that “the field evidence [shows~ overwhelmingly that
no system will be successful unless it is an improvement over existingconditions and is perceived to be ZO by the community” (Dworkin 1982). TheUSAID evaluations also have numerous implicatlons for specifying thedeterminants of willingness to pay for improved water supply services in ruralareas.
Factors influencing villingness to pay are as folbows:
1. Perceived health benefits. Perceived quality of water is Simportant. Perceived quality is determined by taste, odor,cobor, and tradition and usually not by bacteriological quality.Thus, in Korea shalbow well water was preferred to chborinatedpiped water, and in Thailand many people, even those withprivate connections, would not drink the chborinated water fromthe new supply system. Health education components added to thewater supply programs in Peru, Tunisia, and Korea did not appearto affect demand.
2. Other benefits. Convenience, amenity, and economie benefits(time savings) are usually most important for recipients.
S
—6—
S

3. Level of service. In some settings (Thailand and Tunisia),pumped schemesproviding water to house connections functionedreliably whereas “simpler” techriologies providing publicfacilities did not vork well (becauseof the perceived benefitsof higher level of service and the reeipients’ greatervillingness to pay for and inaintain the pump schemes).
4. Exlstence of alternatives. Where alternatives exist (householdshalbov welis in Korea, access to a reliable spring In Peru, wetareas of Tunisia), villingness to pay for “improved service” islow. In Korea, water supply connections are consideredessential in urban areas, and connection rates are determined bysupply factors; in rural areas, connection is primarily afunction of demand factors.
5. Income. The “elasticity of connectlon probability regardingiricome” is substantial (Korea). In Thailand, poorer householdsdid not pay for house connections; In Kenya, house connectionscould be afforded only by the rich.
6. Prlce. Where different prices were charged for the same levelof service (for example, $O.25 for yard taps in gravity systemsand $O.75 per month for yard taps from pumped systems, InPanama), there were few collection problems for the cheaperservice, but substantial problems existed where the higher ratewas charged. This suggests that price elasticity of demand forthe improved service was substantial.
7. Different uses, different determinants. Even where people pay asubstantial connection charge, they may still perform some tasksat a traditional source (for example, laundry in Korea).
8. Value of women’s time. Where women are educated and employed(and where, therefore, the value of their time is higher)connection rates are higher (Korea).
9. Famlly size. Water use practices depend on family size. InPeru smaller families do laundry at home; larger families,hovever, continue to wash at the nearest stream.
Table 1, on the folbowing page, summarizes the magnitude of WTP for water inrural areas.
2.2 World Bank Projects
In most World Bank rural water supply projects no consideration is given tovillingness to pay. Ability to pay is assumed to be a proportion of totalIncome (usually 3 percent to 5 percent). This figure is then comparedwiththe payments that would be required to cover the costs of service. In someinstances, however, some effort has been made to determine willingness to pay.In the Bank’s Philippine water supply project, a sociologist was hired by the
—7—

Table 1
Apparent Villlngness to Pay for Water in Rural Areas
WaterSource
EconomieLevel Wet Areas Dry Areas
Yard Taps RichPoor
+++
++
+++++
++++
Standpipe Rich + ++++
(or Handpump) Poor 0 +++
S
S
S
S
S
S
S
S
S
S
—8-
S

borrower to assessvillingness to pay, but the survey questions were notframed in a way that could provlde useful answers for project design purposes.The results, therefore, vere apparently ignored In the design of the project.
In the Bank’s Paraguay project, in which cost recovery was a prominentfeature, no WTP analysis was conducted during the design stage. Levels ofservice and tariffs were set “in accordance with the populations’ habits,expectations, and ability to pay.”
During the implementation stage, the executing agency is to conduct a“socloeconomic survey of the community which would indicate its ability topay.” In the Bank’s Burundi project, a socioeconomic survey was conducted,prlmarily to convince the government that people were willing to paysomething, and not for choosing the levels of service or setting of tariffs.The results did show that villingness to pay was higher in drler areas andthat most people were wIlling to pay something. Again, hovever, the surveyhad little impact on project design. The only inclusion of theseconslderations In project design was the usual “affordability” analysis.
In the Bank’s project in Egypt, a large—sample survey was carried out prior tothe project. The prlmary objective was to Identlfy poverty groups and thustarget areas for the water project, but questions of willingness to pay verealso addressed. Although there were problems wlth the survey design and itsimplementatlon, some interesting results emerged:
1. Rural dwellers vere willlng to pay slightly more than urbandwellers for a private connection.
2. Willingness to pay both for private connections and standpipesupplies was highest vhere water supplies (determined by triptimes and availability) vere poor.
3. Willingness to pay for house connections averaged approximately3 percent of household income; willingness to pay for publicstandpipes was about 1 percent of household income.
From the Appraisal Report, it appears that these WTP results were notincorporated into project desIgn, although they were used to support the claimthat the services to be provlded were “affordable” and thus were used tojustify charging for water from public standpipes.
In the Bank’s project In China, no formal WTP analysis was undertaken. It wasassumed that the standard Chinese procedure of full cost recovery wouldpertain, and that vhere the amount required exceeded the usual “3 percent to 5percent of income” criterlon, lower levels of service would be provided.
In the Bank’s Mali project, a serlous effort to assess willingness to pay wasundertaken. The results of a contingent valuation survey were compared withthe results of actual expenditures. Only a llmited set of questions wereaddressed: the effect of income and distance to present source on WTP for acboser source. The effort was primarily a methodobogical exercise. The
—9—

S
results suggested that, for this limited set of hypotheses, the resuits of theWTP survey provided “reasonable” estimates. The Staff Appraisal Report of theRural Water Supply Project shows that much emphasis was placed on projected Sfinancial contributions by the villagers, but only an oblique reference ismade to the WTP survey.
In summary, all of the World Bank rural water supply projects revieved haveassumed that some degree of cost recovery will take place. Most projectreports explicitly refer to the importance of willingness to pay if costrecovery objectives are to be achieved. In several projects, surveys wereundertaken to assess wlllingness to pay. In two cases (the Philippines andBurundi), these surveys vere conducted by local consultants vith minimalguidance and poor terms of reference. The results were of little use andignored in the design of the projects. In two other cases (Egypt and Mali),serlous surveys vere undertaken to assess willingness to pay. Despite somedefects in design, the Egyptian survey showed some interesting resuits (forexample, WTP for house connections was three times WTP for standpipes). Theseresults appear to have been ignored vhen chooslng bevels of service (whichvere simply based on the usual “percentage of income” ability—to-paycriterion). The Mali case also yielded some interesting resuits (for example,the WTP depended on the availability of private welis), but these too vereapparently ignored in the project design. S
From the World Bank case studies, It can be concluded:
1. Considerable avareness exists on the part of Bank planners thatwillingness to pay must be taken into account if cost recovery Sis to be realized in rural water projects.
2. Where surveys have been conducted that address WTP issues, theresults have been used primarily for other purposes (forexample, to convince the Government of Burundi that villagerscould be asked to pay for water; to identify poverty areas inthe Egypt Provincial Water Project; to determine vhether therequired charges would exceed a preset proportion of income).In no case has the primary purpose of the survey been to provideinformation on vhich to base project planning decisions. In thefew cases vhere such information has emerged from the surveys,it has apparently been Ignored when deciding where projectsshould be located, vhat levels of service should be provided,and how tariffs should be set.
2.3 1DB Projects
1DB is the only one of the three institutions that has systematlcally Scollected and analyzed household—level data on water use practices before andafter the improvement of water supplies (statistics are also included for“control” villages with unaltered supplies). To date, 1DB has made onlylimlted use of these data. Although the data collected used a commonprotocol, the data have been analyzed only on a project—by—project basis. Noattempt has been made to analyze the ten rural water supply data sets Cor thelarger number of urban data sets) as a whole to draw general conclusions.
- 10 -
S

i The project analyses show several useful things. The benefits from Improvedsupplies are substantiab, due to reduction in hauling distances for theexisting level of water use, and increased use due to reduced cost of water(in a typlcal case comprlslng one-third and tvo—thirds of benefits,respectively), and are generally sufficient to justify most rural water supplyprojects. The price elasticity of demand is higher (for iristance,approximately —0.3 In rurab ChIle and about -0.6 in urban sluins in Brazil)than that which has been reported In developed countries. Income elasticitiesare also high (approximately 0.4 in rural Chile and 0.8 in urban slums inBrazil).
The 1DB analyses are based on the implicit assumption that people will pay forthe highest level of service for which expenditure on water does not exceed 3percent of income. No account is taken of the possibility that people may bevilling to spend more than this for a high-quality service and may beunvilling to spend even a substantlally lesser amount for bower-qualltyservice.
— 11 —

S
S
S
S
S
S
S
S
S
S
S

Chapter 3
THEORETICAL FRMIEWORKAND METHODOLOGICALAPPROACHESASSESSING THE WILLINGNESS TO PAY FOR RURAL WATERSERVICE
This chapter of the report outlines a theoretical framework for understandinghow water use patterns would change 1f a new rural water supply system isinstalled in a village. Before examining some of the theoretIcal issuesinvolved in explaining water use behavior at the village level, consider theproblem from the point of view of the rural water supply englneer or planner.Suppose there is a proposal to provide an improved water supply to a villagein vhlch people are nov carrying water from several traditional, pollutedsources to their homes. Assume that the project planner accepts as given thatthe village must pay for a new system to be constructed. Budget constraintsand the need for projects to be replicable preclude any central government ordonor subsidies. What exactly does the rural water supply planner need toknow?
First, if yard taps were made available to individual households, the projectplanner would need information on how many households would connect to the newsystem at various combinations of connection fees and monthly charges.Second, for those households that did connect to the system, he would need toknow how much water they would consume (monthly charges are generally notbased on the volume used; therefore, the household would probably face a zeroshort run marginal cost of water). On the basis of this information, theproject planner could determine whether the revenues collected would cover thecost of the system. Similarly for standposts and handpumps, the projectplanner needs to estimate the number of households that would use the newsource (for at least some of their water needs), if different prices werecharged, and the total amount of water which would be used.
Finally, the rural water supply planner needs a basis upon vhich to select thetechnobogy for the project and the price to be charged. For example, a systemmight be selected that provides the highest level of service for which thereveriues could be collected to cover the costs. Alternatively, the decisioricould be to choose that technology that would serve the most households orresult in greatest use of high quality water from new sources in the village,subject to the constraint that cost recovery objectives can be met. 1f thebenefits of the new water system could be approximately estimated, a moreappropriate objective would be to choose the technobogy and price vhichmaximized the net benefits. Whatever objective Is selected, however, theplanner needs the Information to measure the llkely consequences of theproject and compare them to the project costs.
The theoretical framework should thus assist the rural water supply planner orengineer in thinking about two questions: (a) What will happen if varioustypes of interventions are made in the provision of water supply? and (b) Howshould the changes in behavior that result from different interventions bevalued? Both questions require that the planner look carefully at howindividuals use water and why they choose one water source rather than anotherfor particular purposes.
— 13 —

S
A new rural vater supply system will never be the only source of water in avillage; a community cannot exist without some water supply. The questionthus becomes one of determining how individuals will view the proposed newwater supply relative to their existing sources. The new source may differfrom traditional sources in a variety of dimensions, such as quality,convenlence, reliability, and real resource costs (money and time).
An obvious place to look for insight into this decision is consumer demandtheory. Because one of the major benefits of a piped water system, handpump,or standpost cboser to the home than a traditional source will be the timesaved from not having to carry water (IBRD 1986a), the application of consumerdemand theory to village water use must explicltly incorporate time as afactor in the individual’s decision. The theory must also address theempirical evidence from many developing countries which shows that when wateris delivered inside the home through yard taps, water use inereasesdramatlcably, from approximately 20 liters per caplta per day to approximately S100 liters per capita per day. 1f the water supply is outside the home, overa wide range of distances the quantity of water used Is not very sensitive tothe distance of the home from the source.
Whether the home is 15 meters or 500 meters from the source, water use percapita will generally be 15 to 25 liters per capita per day. The quantity of 5water use per capita typically decreases sbowly as the distance of the homefrom the source increases beyond about 500 meters. The type of water service(yard taps versus standposts or handpumps) thus seems to be a more importantdeterminant of the quantity of water used than any simple relationship betweenwater use and distance would suggest.
S3.1 Household Production Function Model
One way to determine the effect of a new rural water supply system, such ashandpumps or yard taps, on vater-use behavior in a village is to observe asituation where such a system has been installed and determine the number ofpeople using the new source and the quantity of water used. 1f functional Srelationships can be estimated which are consistent with a theoreticalunderstanding of how individuals use water sources, and vhich “explain” thewater—use behavior in the village which has a new source installed, then theestlmated “model” of water-use behavior can be used to predict what wouldhappen if a new system was introduced into a village lacking an improvedsupply.
Consider the estimation of a model of water-use behavior in a village whichhas an improved water suppby, say a handpump. Water is obtained fromdifferent sources and used for different purposes. For example, animal washingmay be done at a particular source. On the other hand, water for drinking andcooking must be carried from the source to the house. The water may betransported by household members, hired help, or water vendors. Finally,other uses, such as bathing, may occur at either the source or the home,presumably depending among other factors on the price of water at the sourceand the cost of transporting it to the home.
S
— 14 —
S

To get the water from the sources to the house, members of the household incurseveral types of costs. They may have to pay a price for water at thehandpump; certainly they will spend time going to the source, possibly waitingin a queue, and returning to the house wIth the water. Other inputs in thewater transport process may include animals, carts, buckets, jugs, and otherutensils. To “produce” water for use at the home, the Individual must combinewater from the source with her time and other factor inputs. 1f a certainquallty of water is desired for drinking, additional time and Inputs rnight berequired to improve the quality of water. For example, abum could be added toremove suspended sollds, and time and fuel could be expended to boil water toimprove its bacteriological quality. The cost of water to the household Isthe sum of the price paid at the source, the value of the time spentcollecting and transporting the water to the home, and the cost of the otherfactor inputs used In carryIng and perhaps treatlng water. 1f the totaltransport costs are greater than the convenience of using water at home, thenwater will be used at the source.
From the perspective of consumerdemand theory, it Is thus a complex task topredict the Impact of a new water source on water use patterns in a village.Formally, It is necessary to simultaneously estlmate a system of demandfunctions for water use at the sources and at the home. The demand for waterfrom the sources may in some cases be derived from the demand for water in thehome, in the sense that there would be no water demanded from the sourceunless It was subsequently carried to the home. In other situations, such aswater for washing, the water at the source and in the home should beconsidered close substitutes for each other. The information necessary tofully characterize consumer vater—use behavior at the village level thusincludes: (a) the individual’s demand for water at the different sources asan input into the household’s use of water at the home, (b) the individual’sdemand functions for water as a final consumption good at the source, and (c)the individual’s demand function for water at the home.
For the purpose of deveboping a practical approach to modeling water demandrelationships at the village level, this problem can be simplified by makingtwo important assumptions. First, at any particular time a household isassumed to use only one source for a particular category of water use (such asdrinking). In other words, It is assumed that in a given period a householdobtains drinking water from a single source and water for washing from asingle source (which may or may not be the same source used for drinking andcooking water). This assumption is generally corroborated by empiricalevidence in rural areas, but its validity for any specific case must bechecked. Second, a household is assumed to use all of the water of apartlcular use category at the home, not at the source.
— 15 —

S
Given these two assumptlons the demand for water at the home can be estimatedwith a single equation model. Let the demand function for water at the homebe:
= f (SP, y, S)
vhere is the quantity of water demanded,
SP is the shadow price of water,
y is the household’s income, and
S is a taste vector determined by the household’ssocioeconomic characteristics (other thanincome).
S
Assuming a linear functional form, the demand function can be written as:
= a0 + a1SP + a2y + a3S + e
vhere e is a random term. S
1f the shadow price of water can be calculated (for example, as a function ofthe money price and travel time per unit volume), this water demand modelcould be estimated from a cross section of households in a village.
SThis traditional dernand model has not, however, been successful in explainingvariations in householdwater use behavior at the village level. This shouldnot be surprIsing given the empirical evidence which shows that when peoplemust carry water to their homes, they consume essentially the same quantlty ofwater over a relatively wide range of distances (White, Bradley, and White1972; Cairncross et al. 1980). This does not mean, however, that thecollection time, taste, price of water, and other explanatory variabbes willnot have an influence on the choice of water source. Once the source choicedecision is made, the amount people consume from their chosen source may ormay not depend on the variables suggested by consumer demand theory. Noempirical evIdence exists on the question of whether households choose thequantity of water they want and then choose the source, or choose thesource and then choose the quantity—.-or whether they make these decisions Ss imul taneously.
Although this traditional vater—demand model based on the household productionfunction framework does not provide an adequate basis for modebing villagewater use, It does form the basis for one part of the discrete-continuousmodel described in the next section. S
S
— 16 —
S

3.2 The Discrete—Continuous Water Demand Model
For each category of water use being modebed, It is required to estimate arelatlonship to explain: (a) why sonie househoids use one source and somehouseholds use another and (b) why households consume particular quantities ofwater. The discrete—continuous model described in this section provides aframework vhich explains the probability that a household would choose aparticular source (a discrete variable) as a function of the characteristicsof the available water sources (including the prices charged, the distance ofthe sources from the household, and other attributes of the sources),socioeconomiccharacteristics of the household (such as income, age structure,education, religion), and a random variable.
The structure of this problem is not unique to village water supply planningand has been dealt with previously in estimating the demand for housing andelectricIty (McFadden 1978 and 1981; Dubin and McFadden 1984). Regardingelectricity, for instance, the individual decides on the electrlcal appliancesto buy and their energy efficiency (a discrete choice), and also on how muchelectriclty to use given the choice of appliances (a continuous choice).Because the optimal discrete choice could depend on the outcome of thecontinuous choice, and vice versa, the two decisions should theoretically bemodeled slmultaneously. Studies of other applications of the discrete-continuous model indicate that ignoring the simultaneous nature of these twodecisions can lead to biased parameter estimates (Lee and Trost 1978; Dubinand McFadden 1984).
The discrete—continuous model comprises two parts. Part 1 is the discretechoice model describing the probability that a household will choose aparticular water souree:
Model 1
Probh~ = f(Whj,yh,Sh)
where ProbhJ = the probability that household h selects source jWhj = the characteristIcs of source 1, 1 = 1, 2, . . .n,
perceived by household h
= household income
Sh = the socioeconomic characterlstics of household h
1f Model 1 can be estimated successfully for a village wlth an improved watersystem, a water supply planner could then collect data on W and in avillage without an improved water system. 1f the estimateci~~model can beassumed to be generalizable across the two villages, the probability thathouseholds in the village without the improved water system will use the newimproved source(s) can be estimated.
— 17 —

S
Once it is known how many familles choose to come to the new source, theplanner needs to know how much water will be used from the new source 1fcertain prices and connection fees are charged. To understand the determinantsof the quantity of water used, the following demand function can be estimated,based upon the household production framework developed in the previoussectlon:
Model II
(a) For those households who choose source j (say theimproved source)
= ~ ~h’ Sh)
where = quantity of water demandedby household Sh conditional on the decision to usesource j.
(b) For those househoids who choose source i (one of theexisting traditional sources)
S= g1(W~~,y~,S~)
where i and j indicate two different sources. Model
II would be estimated for each source.
In Model II, the contlnuous demand function indicates how much water would beused 1f different priees were charged at the sources; this information isrequired to determine whether costs can be recovered. The quantlties of waterdemanded from different sources are assumed to be modeled by different demandfunctions. Thus, Model II implies that a demand function would be estimatedfor each source. Models 1 and II can also be used to derive estimates of thewelfare changes (that is, benefits) of the new water source(s) (Hanemann1984b).
Source characteristlcs which are likely to be important explanatory varlablesin Models 1 and II are perceived water quality, cash prlces for bothconnection and per unit use, and reliability. Household characteristics whichare likely to be important explanatory variables are income (cash and in Skind), household size and composition, length of residence, education ofhousehold members, expendlture patterns, and the value of time. Thecollection time consists of travel time to and from the water source, queuetime, and fill time. The travel time will be different for differenthouseholds. The queue and fl11 time may vary across sources but not fordifferent households.
Because the decisions on which source to use and the quantity of water to beused are interdependent, the error term for Model 1 is correlated with theerror terms for Models Ila and lib. A least squares estimation procedure will
S
- 18 —
S

thus yield biased and inconsistent estimates. A two-step estimation procedurehas been shown to be practical and provides satisfactory parameter estimates(Lee and Trost 1978; Hecknian 1978; Lee 1979; Maddala 1983; Hanemann1984a):
Step 1
(a) Maximum likelihood estimation of a multinomial bogit model forthe discrete probabilities alone yields consistent but notefficIent estimates (because the information on the continuouschoices is ignored).
(b) Ordinary least squares’ estimates of the continuous choice(using the estimated values from (a) above) gives consistentestimates of the parameters.
Step 2
Use these consistent estimates for maximization of the likelihood function.Because the initial estimates are consistent, a single Newton-Raphsoniteration will provide estimates with the same asymptotic distribution as thegbobal maximum likelihood estimator. The two—step procedure gives estimateswhich are consistent and asymptotically normal.
On the basis of preliminary research by the authors, the discrete choice partof the discrete—continuous model (Model 1) will probably be successful inaccurately predicting source choIce decisions by households, and this willrepresent a major advance in understanding water-use behavior in developingcountries (Whlttington et al. 1987). The research team is less optimisticabout the continuous demand model (Model II) because there are significantdifferences in consumption dependingon whether water is available outside orinside the yard and because, for a given level of service, the traditionaldemand model with the usual Independent variables explains relatively littleof the variation in the quantity used.
3.3 Sourcesof Data for Estimating Domestic Water Demand Relationships
Two complementary types of data can be used to estimate models describingdomestic water use behavior, such as those outlined In the preceding section.The first (the “direct” approach) is data generatedby answers to hypotheticalquestions on wiblingness to pay for improved water sources. The second (the“indirect” approach) is data on actual observedbehavior. In the latter case,the researcher measures the quantities of water collected by differenthouseholds and the time spent collecting water and, on the basis of consumerdemand theory, infers how much the household would be villing to pay for animproved water supply.
- 19 -

S
3.3.1 The Direct Approach: Contingent Valuation Method
The direct approach to collecting data on willingness to pay is simply tointerview an individual and ask directly how much he or she would be villingto pay for a public fountain or yard tap. In the economie literature, thisdirect approach to estimating villingness to pay is termed the “contingentvaluation method” (CVM) because the interviewer asking the question is simplycollecting information rather than actually proposing to deliver the goods orservices 1f the individual agrees to pay a specified amount. S
A willingness to pay bId obtained from a contingent valuation survey can beinterpreted as a decision by the household on whether to use the new improvedsource. The first part of the discrete—continuous model (that is, thediscrete choice model) can be used to explain this decision as a function ofhousehoi.d characteristics and source characteristics. The data obtained from 5a contingent valuation survey is not, however, suitable for estimating thesecond part of the discrete—continuous water demand model (the traditionaldemand equation conditional upon source choice) because it is not possible toask the quantity of water he or she would use 1f a new source such as aprivate connection were installed in their home. Indivlduals cannot beexpected to give reasonable or rellable answers to such a question becausethey do not have any direct experience with the private connection (and even1f they did could probably not quantify their expectations in volumetric unitsaccurately).
The methodology for conducting contingent valuation studies has been developedover the last decade, largely by environmental and resource economists workingon the problem of appraising the provision of public goods (Freeman 1979a; SCummings, Brookshire, and Schulze 1986). Most of the applications of the CVMhave lnvolved attempts to measure the willingness to pay of individuals forchanges in environmental quality and have been conducted in the United Statesor Western Europe (Randali et al. 1978; Mitchell and Carson 1986). The CVMapproachhas been used in this area becausemarkets typically do not exist forsuch public goods and thus observationson how consumersrespond to changesin 5prices and quantltles are not directly observable.
Several approaches have been used in asking the contingent valuationquestion(s). The simplest and most straightforward is to ask the individualdirectly the maximum amount he or she would be willing to pay for the proposedwater supply improvement. One disadvantage of this approach is that someindividuals may not understand the idea that they are being queried to givethe maximum amount. Another problem is that people often need time to reflecton the question and simply do not have an immediate response. They may needhelp in thinking about the question, such as information about how much theyare paying for other public services. Alternative approaches have been used toelicit individuals’ wlllingness to pay, including bidding games, multiple—choice questions, payment cards, and yes—no questions regarding a single Sprice. One of the objectives of the field study conducted as part of thisproject was to determine whIch of these approaches seems most appropriate foruse in developing countries.
S
- 20 -
S
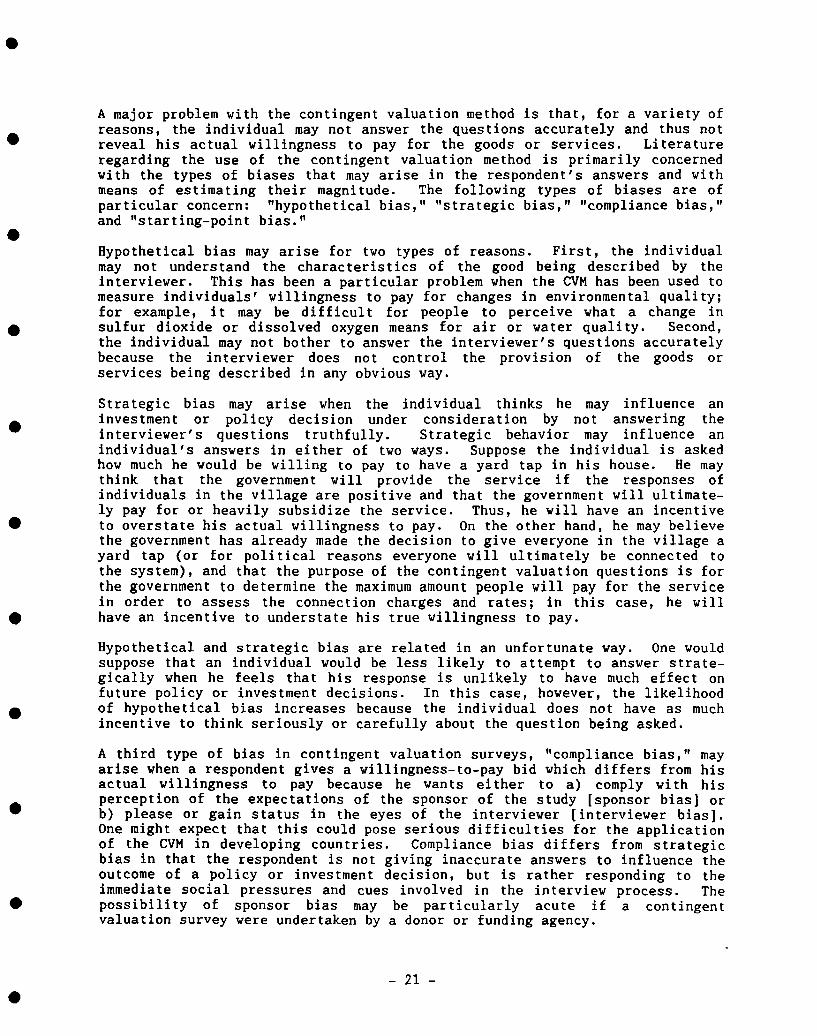
A major problem vith the contingent valuation method is that, for a variety ofreasons, the individual may not ansver the questions accurately and thus notreveal his actual willingness to pay for the goods or services. Literatureregarding the use of the contingent valuation method is primarily concernedwith the types of biases that may arise in the respondent’s answers and wIthmeans of estimating their magnitude. The folboving types of biases are ofparticular concern: “hypothetical bias,” “strategie bias,” “compliance bias,”and “starting—point bias.”
Hypothetical blas may arise for two types of reasons. First, the individualmay not understand the characteristics of the good being descrIbed by theinterviewer. This has been a particular problem when the CVM has been used tomeasure individuals’ villingness to pay for changes in environmental quallty;for example, It may be difficult for people to perceive vhat a change insulfur dioxide or dissolved oxygen means for air or water quality. Second,the individual may not bother to answer the Interviewer’s questions accuratelybecause the interviewer does not control the provision of the goods orservices being described in any obvious way.
Strategie bias may arise when the individual thinks he may influence aninvestment or policy decision under consideration by not answerlng theinterviewer’s questions truthfully. Strategie behavior may influence anindividual’s answers in either of two ways. Suppose the Individual is askedhow much he would be willing to pay to have a yard tap in his house. He maythink that the government will provide the service 1f the responses ofindividuals in the village are positive and that the government will ultimate—ly pay for or heavily subsidize the service. Thus, he will have an Incentiveto overstate his actual willingness to pay. On the other hand, he may believethe government has already made the decision to give everyone In the village ayard tap (or for political reasons everyone will ultimately be connected tothe system), and that the purposeof the contingent valuation questions is forthe government to determine the maximum amount people will pay for the servicein order to assess the connection charges and rates; in this case, he willhave an incentive to understate his true willingness to pay.
Hypothetical and strategie bias are related in an unfortunate way. One wouldsuppose that an individual would be less likely to attempt to answer strate—gically when he feels that his response Is unlikely to have much effect onfuture policy or investment decisions. In this case, however, the llkelihoodof hypothetical bias increases because the individual does not have as muchincentive to think seriously or carefully about the question being asked.
A third type of bias in contingent valuation surveys, “compliance blas,” mayarise when a respondent gives a willingness-to—pay bid which differs from hisactual willingness to pay because he vants either to a) comply with hisperception of the expectations of the sponsor of the study [sponsor bias] orb) please or gain status in the eyes of the interviewer [interviewer bias].One mlght expect that this could pose serlous difficulties for the applicationof the CVM in developing countries. Compliance bias differs from strategieblas in that the respondent Is not giving inaccurate answers to influence theoutcome of a policy or investment decision, but is rather responding to theimmediate social pressuresand cues involved in the interview process. Thepossibility of sponsor bias may be particularly acute if a contingentvaluation survey vere undertaken by a donor or funding agency.
— 21 —

S
A fourth type of threat to the validity of contingent valuation surveys istermed “starting—point bias.” One means of eliciting an individual’s maximumwillirigness to pay is called a “bidding game,” in which the interviewer asks a 5question such as, “Would you be willing to pay $X per month for a yard tap?”1f the respondent answers affirmatively, the enumerator raises the price inspecified Increments and repeats the questlon. This procedure continues untilthe respondent says no; the last price to which the respondent answeredaffIrmatively is then taken as the maximum willingness to pay. Starting-pointbias exists 1f the initial price used by the enumerator affects the 5individual’s fina]. willingness—to-pay bid. Empirical evidence from the UnitedStates suggests that starting-point bias can be a significant problem incontingent valuatlon surveys (Boyle, Bishop, and Welsh 1985).
The conventional visdom has been that these various sources of bias makecontingent valuation surveys unreliable and at best inferlor to “hard” marketdata. In the specifie case of rural water suppiles, the World Bank conciudedmore than a decade ago that “the questionnaire approach to estimatingindividuals’ willingness to pay has been shown to be virtually useless”(Saunders and Warford 1977). The available evidence seems to indicate thatthe magnitude of these biases is not as large as some economists initiallyfeared (Cummings, Brookshire, and Schulze 1986). In a wide variety ofsituatlons, people in the United States and Western Europe appear to answer Scontingent valuation questions truthfully. Whether this will prove true forthe water supply problein in a different culture in a deveboping country is anempirical questlon which is addressed in the next chapter.
Despite the potential problems posed by various biases, the contingentvaluation method has several significant advantages as an approach forestimating the willingness to pay in deveboping countries for rural watersupplies. First, a survey which attempts to estimate willingness to pay isrelatively Inexpensive and certainly a small fraction of the cost of a watersystem. The benefits resulting from a WTP survey in terms of Improved design,technobogy choice, site selection, and pricing practices can be many times thecost of a study. This is a methodology which both donor agencies andgovernments could afford to put into practice to assist with site selectionand choice of technobogy decisions. Second, the CVM forces donor agencies andwater authorities to consult with local people and determine theirpreferences. It could thus provide one element of an overall approach toincrease communlty participation and citizen involvement. Third, it can beused to assess responses to services presently unavailable. Fourth, thesummation of the WTP bids over the sample households ylelds a readily Sunderstandable measure of the total benefits to the sample populatlon of theimproved water system. The use of sophisticated statistical techniques isnecessary for the estimation of the discrete choice model of the households’water source decisions, but not for an easily interpretable indication of theaverage household’s total willingness to pay based on the bids obtained in thecontingent valuation survey. Finally, the limitations of the contingent 5valuatlon method must be considered relative to the limitations of othermethods for estimating willlngness to pay. Models estimated wIth data onobserved behavior (discussed in the next section) also require assumptionswhich may not be realistic and may sometimes yield poor prediction.
S
— 22 —
S

3.3.2 The “Indirect” Approach
The discrete-continuous model discussed in section 3.2 can be estimated withdata on observed behavior. This requires that the researcher collecthousehold—level information on the quantities of water consumed for differentpurposes, the time spent collecting water from different sources (lncludingthose not used by the household), perceptions of the quality of differentsources, and socioeconomic characterIstics of the household. This data-collection effort should be carried Out in a village which already has avariety of different sources (some vith different money prices) and withsources located In such a way that individuals face real choices among them.In other words, individuals in one part of the village do not all go to ahandpump, and individuals in another location all go to a kiosk. Thehouseholds must have real options, and some must choose one and some another.
This procedure of estimating the model with data on observed behavior Isappealing because the resuits are based on vhat people actually do in practicerather than vhat they say they will do. Limitations of the approach do exist,however. First, the planning problem is to examine communities withoutimproved water supplies; vater-use behavior must be modeled in another villagewith an improved supply. The results of this indirect analysis must thus beextrapolated beyond the range covered by the data. Second, there may be adiscrepancy between the revealed value of a commodity to a household and thepayments which a household will actually make when the commodity is provided.Third, the implementation of this approach does not require any sort ofcommunity participation. Fourth, the indirect approach will probably not befeasible in most situations because there will not be sufficient variation ineither the dependent variables (source choice and quantity of water) or inthe independent variables (socioeconomic characteristics and householdcharaeteristics).
Other inodellng approaches exist for estimating the willlngness to pay forwater which use data on observed behavior, but they suffer from theselimitations as well as others. Two of these are outlined bebov, but they donot hold as much promise as the estimation of the discrete-continuous modelwith data on household and source characteristics collected in householdinterviews.
3.3.3 Hedonic Property Value Model
The hedonic property value model has been used in the environmental andresource economics field to estimate the benefits from lmprovements inenvironmental quality (Freeman 1979a and 1979b); conceptually it could beapplied to the problem of estimating the willingness to pay for improved ruralwater supply services. The hedonic property value model describes a house asa bundle of neighborhood, site, and structural characteristics, one of whichcould be the type of water supply and wastewater disposal facilities it has.1f different houses in an area have different water supply facilities,variations in the equilibrium housing prices over the sites reveal thehousehold’s willinigness to pay for a change in the level of water services.
— 23 —

S
In the hedonic property value approach, the household is assumed to maximizeits utility through the consumptlon of a composite market good x and theattributes of its house (z0, z1, ..., zm):
Maximize U(x, z0, z1, Zm)
subject to px + R(z0, z1, ~ Z,,,) = y
where z0 might be the water supply facilities available to the Shouse,
U(.) is the household’s utility function,
y is household income, and
p is the price of the composite market good.
The first order conditions for a solution to this problem require that thehousehold’s marginal willingness to pay for a housing attribute z equal theimpllcit price of z~. The hedonic price function R(z0, z1, ?Zm) relatesthe market price of a house to its attributes, and is assumed to be the resultof the actions of many households in the housing market. S
The hedonlc property value technique consists of two stages: (1) theestimation of the hedonic price function and (2) using the implicit price of ahousing attribute—-in this case the water services available to thehousehold-—to measure the household’s willingness to pay for an improvement inwater supply services. The model thus assumes that the household can freelysearch over all houses and locations to find the optimal levels of housingattributes and that there Is a competitive, active housing market.
It would appear, however, that rural housing markets in deveboping countriescan rarely be assumed to operate in this fashion. Houses are not tradedfrequently or freely, and meaningful data on market prices will simply not beavailable in rural areas. The hedonic property value model is not thus apromising approach for estimating households’ willlngness to pay for Improvedwater supply services in rural areas, although there may be situations vhereit can be applied in urban areas.
3.3.4 The Varying Parameter Demand Model S
The varying parameter demand model also addresses the question of how muchpeople are willing to pay for different attributes of a water source (Vaughnand Russell 1982). Suppose the factors influencing the quantity of waterdemanded by a household are classified into two groups: (a) variables
S
S
— 24 —
S

associated with the household, such as Income and other socioeconomiccharacteristlcs, and (b) variables associated with the water sources, such astaste and odor. The household’s demand function for water can be vritten as:
0hj = f[SPh), Sh, W1]
where0hj is the arnount of water demanded by household h which
uses source j;is a vector of the characteristics of source j;
Sh is a vector of the characteristics of household h; and
SPh~ is the shadow price of water from source j for
household h.
The varying parameter demand model attempts to separate the effects of priceand water quality on water demand into two estimation stages. First, a demandfunction is estimated for each source. Since W~is constant for a givensource j, the demand function to be estimated for each source becomes
0hj = f.[SPh, ~h’
Let us assume this function takes the folbowing linear form:
0hj = a0~ + all*SPh + a2J*Sh + eh~
where eh is an error term.
This demand function can be estimated from a cross section of households whichchoose source j. The subscript j on the estimated parameters a0, a1, and a2indicates the fact that the water quality variable W~is not included in thefunction.
1f there are n water sources, there will be n such demand equations, and thusn different sets of a1’s, the estimated parameters. The variation in theestimated parameters can be explained by the source attributes. Thisestimation is the second stage of the varying parameter demand model. Inother words, the following model is estimated for a cross section of sources:
a. = g[W~] + e~
The estimated coefficients of this equation reveal the average household’s
wlllingness to pay for each of the source attributes.
The varying parameter demand model requires a larger sample of sources thanwould be available in a single village and thus households must be pooledacross villages. Data will rarely be available for a large enough sample ofvillages for the varying parameter demand model to be generally applicable orfor It to be a feasible procedure in most practical planning contexts. Itdoes, however, have promise as a basis for future research, and the approachcould be used to collaborate other methods.
— 25 —

S
S
S
S
S
S
S
S
S
S
S

Chapter 4
A CASE STUDY OF THE USE OF CONTINGENTVALUATION SURVEYSIN SOUTHERNHAITI
4.1 The Study Area
In August 1986, the research team conducted contingent valuation surveys andsource observations in two villages in southern Haiti: Laurent and St. Jeandu Sud. Southern Haiti was selected as the research area for two reasons.First, decisions about the level of service and the choice of technobogy forwater supply systemsare particularly dlfficult in Haiti. IDB’s experienceshows that in most of Latin Amerlca, rural communities can afford and arewilling to pay the operations and maintenance costs of yard taps. Per capitaincomes in Haiti, hovever, are the lowest In the Western Hemisphere: in 1980more than two—thirds of the population of 5 million people had per capitaannual incomes less than $155 US. Most individuals simply cannot afford thecosts associated wlth private connections. As one of the 30 least—developedcountries in the world, Haiti thus provldes a field setting similar to thesituation in much of Africa and in some parts of Asla and a situation where anaccurate understanding of the willlngness of the population to pay for ruralwater services is likely to be particularly important for sound investmentdecisions.
Second, the United States Agency for International Development is currentlyfunding a rural water supply project in southern Haiti that is designed toprovide service to approximately 160,000 individuals in 40 villages. Theproject is executed by CARE which, as the implementing agency, is responsiblefor all site selection, construction, and community organization. CARE’sstandard village water supply project is a gravity—fed system supplied withwater from a captured mountain spring, feeding a few public standposts in arural community (photos 1 and 2). BecauseCARE had been experiencing the sameproblems that gave rise to this research (that is, simplistic demandassumptions not belng fulfilled in practice), CARE staff participatedenthusiastically in the study. CARE provided experienced enumerators for ourhousehold surveys, bogistlcal support, and valuable advice on a wide range ofissues, from questionnaire design and translation to data on local water usecustoms. The affiliatlon of this research effort with the continuing CAREproject provided the research team access to villages and justified itspresence and purpose to the local population, vhich was essential to thesuccessof the vork.
Both villages are located vithin a 50-kilometer radius of Les Cayes, theprovincial capital of southern Halti (see Figure 2). The region ismountainous, with numerous streams draining into the Caribbean Sea. Thepopulatlon of the villages varies, from approximately 1,000 in St. Jean du Sudto 1,500 in Laurent. Laurent lies approximately ten kilometers inland alongthe main highway from Port—au—Princeto Les Cayes, one of the best roads inthe country. St. Jean du Sud Is more remote but can be reached by gravelroad; it is a coastal community. The coastal areas are hot and humid, buttemperatures decrease considerably in the interior as elevation increases.The rainy seasons are October to January and May to June; this study wasconducted during the middle of the July to September dry season.
— 27 —

Photo 1: Public tap under construction by CAREin St. Georges, Haiti
Photo 2: Women washing clothes in outfiow fromcaptured water source in Rosier, Haiti(system constructed by CARE)
.~ :~-----~
‘~~l— ~ —.~ ~
S
.
•1~ b ~
- ~ -
— 28 —

S S S
~~AP WO ~SO ~ 1 UWITIO W*?IOWS
Ma, 1fl
0 S 0 S S
Figure 2. Map of Haiti

S
The populations of both villages consist primarily of small-scale farmers whocultivate sorghum, beans, corn, nee, manioc, sweet potatoes, plantains, andyams. Sugar cane, coconuts, mangos, and vetiver (a erop used in theproduction of essential oils for perfume) are the principal agriculturalproducts sold in rural and urban markets. Deforestation and soil erosion aresevere problems in the area, and agricultural yields have been declining as aresult. Few people have regular vage employment, and remittances fromrelatives and friends living abroad or in Port—au—Prince are common. St. Jeandu Sud has only a few fishermen; the coastal fishery has been severelydepleted and yields are bow. Eighty percent of the population of Haiti is Silliterate; the illiteracy rate in the study area is probably even higher.Malnourishment is videspread among chlldren in the villages studied. Thetypical family lives in a three—room mud house with plastered walls and athatched or tin roof.
4.2 Water Sources and Water Use Patterns and Customs
Inhabitants of both villages have aecess to several sources of fresh water.In Laurent there are seven sources vithin approximately two kilometers of mostof the population: one protected well and six springs in dry river beds. Thesprings provide only modest amounts of water, and individuals often wait morethan an hour to draw supplies. The average three-kibometer round trip to awater source can sometimes take several hours. In St. Jean du Sud a smallriver runs through the community, and the village has numerous additionalsources, typically small springs in mountain valleys or artesian wells.
In both villages, the populations state strong preferences for clean drinkingwater and sometimes valk considerable distances past alternative sources tocollect drinking water from sources they consider pure. Water for drinkingand cooking is usually collected by vomen and children and carried home inrelatively standard—size containers (approximately 20 liters for adults).Although children under five years of age are usually bathed at home inbasins, adults and older children express a strong preference for bathing inrivers. Cbothes-washing is usually done in nivers. In Laurent, some SIndividuals actually pay for public transport to make the roughly ten-kilometer round trip to the nearest river to do laundry.
4.3 Research Design
The research design was deveboped to test whether contingent valuation surveys Scould be used to estimate water demarid relationships suggested by consumerdemand theory and thus used to reliably estimate individuals’ villingness topay for improved water services. As discussed in Chapter 3, economie theorysuggests that an individual’s demand for goods Is a function of the price ofthe goods, prlces of substitute and complementany goods, the individual’sincome, and the individual’s tastes, usually measured by the individual’ssocioeconomic characteristics.
In CARE’s water supply project, the characteristics of the goods——publicstandposts or private conneetions-—are the same for everyone. There is novolumetnic charge for water from public standposts; an individual can use asmuch water as desined. Whether or not a household demands water from the S
- 30 -
S

public vaten system thus depends on the price charged for access to the newsystem or for participation in the project. 1f the charge is higher than agiven household’s maximum willingness to pay, the household will elect not touse the new water system. Maximum willingness to pay will vany from householdto household and should be a function of all of the vaniables in the demandfunction, except the pnice of the goods themselves. The WTP bids should thusbe positively nelated to income, the cost of obtaining water from existingsources, the education of household members, and number of household members,and negatively correlated with the individual’s perception of the quality ofwater at the traditional source that was used before the construction of theimproved water supply system. The WTP bids of vomen respondents arehypothesized to be higher than those of men because women carry most of thewater, but alternative interpretations are certainly possible.
The research design was developed to test vhether WTP bids are systematicallyrelated to the variables suggested by economie theory. 1f the variatlon inbids cannot be explained by such variables, three logical explanations can beoffered. First, economie theory may not be an appropniate conceptualframework for explaining the behavior and preferences involved. Second,economie theory may be correct, but the contingent valuation method may not bea sound method for collecting information to estimate the water demandrelationships suggested by such theory. Third, errors In execution of theresearch, such as poor questionnaire design, could lead to invalid inferencesabout the relationship between the WTP bids and the independent variables.
Because contingent vabuation surveys have seldom been attempted in developingcountries, the research design was constructed to test for the existence andmagnitude of several of the threats to the validity of such survey resultsdiscussed in Chapter 3.
4.3.1 The Question Format
The question format itself may affect the WTP bids. In the contingentvaluation surveys, different vays of asking the questions were tried. Bothopen—ended, direct questions—-for example, “What is the maximum you would bewilling to pay per month to have a public standpost near your house?”-—and twoforms of biddlng games that relied on a series of yes—no questions——forexample, “Would you be willing to pay $X per month for a public standpost nearyour house?”——were used. Examples of the dlfferent question formats areincluded in Appendix A.
4.3.2 Strategie Bias
Most attempts to estimate strategie bias have been highly structuredexperiments in which one group of respondents is told one set of facts about asituation that minimizes their incentive for strategie behavior and anothergroup receives a different set that maximizes their incentives for strategiebehavior (Bohm 1972; Mitchell and Carson 1986). Because the surveys for thisresearch were conducted within the context of CARE’s continuing rural watersupply project, it was impossible to construct a counterfactual situation(this would have entailed deceiving the study population about CARE policies).Instead, the magnitude of strategie bias was estimated in the folbowing way.
— 31 —

S
In Laurent and St. Jean du Sud, the study population was divided into twogroups. One group was read a statement that was intended to minhmizestrategie bias (Statement A), and the second group was read a statement that 5was accurate but lef t questions about the purpose of the study unansvered(Staternent B). The hypothesis was that 1f individuals acted strategically,bids from those who received Statement B would be lover than those whoreceived Statement A, because the former would fear that a high bid wouldresult in a higher charge by the community water committee. (Both statementsare included in the household questionnaire in Appendix A).
This may not in fact be a strong test for strategie bias because thedifferences in the two statements are quite subtle. In future research, itwould be useful to have follow-up interviews vith selected respondents todetermine vhether the differences that the research team vished to suggestwere understood. An in-depth anthropobogical research ef fort might alsoelicit information on what types of strategie “thoughts” passed throughrespondents’ minds during the interview process. 1f strategie behavior isfound to exist, anthropobogical research mlght also yiebd insights into how tominimize It during the interview.
4.3.3 Starting-point Bias 5
To test for starting—point bias, three different versions of the questionnairewere distributed, eaeh wlth different initial prices in the bidding games, toboth villages. The questionnaires were randomly distributed in each samplepopulat ion.
S
4.3.4 Hypothetical Bias
Hypothetical blas arising from the respondent’s unfamiliarity with iinprovedwater services, such as public fountains, is not likely to exist. Many ruralwater systems have already been built in southern Haiti; the respondents vereall familiar with public water fountains and private water connections andreadily understood the possibility that their coinmunity would receive a newwater system. Moreover, each respondent was shown two cobor photographs ofpublic standposts CARE had built in nearby villages. Household membersusually studied these with great interest.
Moreover, if individuals will not take the contingent valuation questions Sseriously——for whatever reason--the WTP bids will presumably not besystematically related to household characteristies and other factorssuggested by economie theory. The test for hypothetical bias was thus thesame as the test for the usefulness of the contingent valuation method and theapplicability of consumer demand theory: Were bids systematically related tothe variables suggested by economie theory?
4.4 Field Procedures
Field vork in the two villages consisted of two parts: household surveys andsource observations. Eight CARE health education promoters and two localcollege students were trained for two days to carry out the household
— 32 —
S

interviews. Prior to field—testing the questionnaire, a “focus group” washeld in St. Jean du Sud in vhich individuals from the community discussedcommunity vater—use practices and attitudes. A focus group is simply anarrangement to get individuals in the community together in a group, toinformally discuss the study and the survey questionnaire. The use of focusgroups sterns from group theory and the observation that individuals are moreapt to talk about a problem or issue freely in the security of a group ratherthan in a one—on—one interview. During the 1950s focus groups vere used in theUnited States to obtain qualitative data from consumers about their reactionsto product advertlsing and promotion efforts. The use of a focus group in St.Jean du Sud was useful and facilitated the development of a sound surveyinstrument. Particular attention was paid in the focus group to householddecision-making on water—related matters and to community expectations aboutoperation and maintenance costs. The focus group was not intended, however,to substitute for a pretest of the questionnaire. The Creole questlonnairewas pretested extensively in a nearby village before the CARE enumerators weretralned, and another day of pretesting was carried out by CARE staff aftertraining. Because microcomputers vere available, revisions to thequestionnaire could be incorporated literally overnight and new copies madefor field vork the next day.
In both Laurent and St. Jean du Sud the majority of households wereinterviewed. Enumerators were instructed to try to interview someone in everyhouse. 1f no one was at home, a follow—up visit was usually arranged. Thehousehold interview consisted of four parts. The first dealt with basicoccupational and demographic data for the family members, and summaryinformation on where the family obtained its water. The second part consistedof additional questions on the location of each water source that the farnilyused, perceptions of the water quality at each source, the average number oftimes each family member went to each source per day, and the number ofcontainers they carried home (the enumerator asked to see the containers usedto carry water and estimated their volume). In the third part of thequestionnaire, the enuinerator read one of the statements used to test forstrategie bias and shoved the respondent the photographs of public standpostsCARE had built in other villages (photos 3 and 4). The respondent was thenasked separately for a WTP bid per month for (a) public standposts and (b) aprivate connection. The fourth part was a series of questlons on the healthand education of family members and the household’s assets (such as whetherthe household had a radio or a kerosene lamp). The principal investigatorsand the enumerators had agreed that It was not possible to obtain accurateinformation on household income through interviews (in fact the enumeratorssimply refused to ask either income or expenditure questions because of theantagonism such questions aroused). As a substitute, the enumerator recordeda series of observations about the construction of the house itself, such asvhether the house was painted, whether the roof was straw or tin, and vhetherthe floor of the house was dirt or cement.
Detailed maps of both villages were prepared that indicated the location ofall houses and major struetures in the village as well as all water sources.Enumerators who could read maps were given a map of the village they workedin, asked to assign a number to each household interviewed and to record thatnumber on the map. The enumerator also gave each respondent a ribbon and anindex card with the corresponding household number on it and asked therespondent to wear the ribbon or bring the index card on a designated day to
— 33 —

Photo 3: CARE public tap and showers in Rosier, Haiti(Photograph used in contingent valuation survey)
Photo 4: CARE public tap in Port—a—Piment, Haiti(Photograph used in contingent valuation survey)
S
S
S
S
S
t~t~
* ‘
— 34 — S

the water source used. Enumerators ‘who could not read a map vere given a setof ribbons with preassigned numbers, dropped at specific points in thevillages, and Instructed to interview households in c].early specified areasand assign a number to each household interviewed; one of the senior membersof the research team then recorded on the map which househoids vere located inthe specified areas. Data from household interviews vete generally enteredinto the microcomputer on the same day the interviews vere conducted, andprocessed vith dBase III programs. Summary statistics vere continuallycornpiled during the course of the f leid vork and discrepancies in the data andproblems with the survey implementation could be quickly detected.
The second part of the field vork consisted of observing the quantities ofwater collected by individuals at all the sources around the village. Theobjective of these observations was to verify the information individualsprovided in household interviews on the sources they used and the quantitiesof vater collected. Local residents vere hired to serve as source observers;they were typically secondary school students on summer vacation. All sourceobservers received one day of training in estimating the volumes of variouscontainers and in recording data in their notebooks. Each time an individualarrived at a source, the source observer recorded household number, name,gender, relative age (adult or child), time of arrival, quantity of watercarried away, and whether the individual bathed or did laundry. All sourcesvere observed on the same day from sunrise to sunset. Two shifts of sourceobservers vere used for each source (for example, in St. Jean du Sud, where 15sources were observed, the research team hired and trained 30 individuals).The source observers vere monitored closely by the principal investigators toensure the quality of the data collected.
Table 2 presents a summary comparison of the two study villages.
4.5 Analysis of the Source Observation Data
The analysis of the source observatlon data for Laurent increased confidencein the quality of the water use data obtained from the household interviews.In Laurent, data vere recorded on 119 trips to water sources by individuals(or groups of Individuals from the same household) who identifled themselvesto source observers either by wearing a ribbon or displaying an index cardvith their household number. The sources these individuals said they used fordrinking and cooking in the interview were compared with the source theyactually went to on the day of the source observations. Out of the 119observations, the interview responses vere consistent vith the sourceobservations for 101 househoids (85 percent). Next, the quantities of waterpeople said they used in the interviev vete compared with the amount thesource observers actually sav them collect. For Laurent, the responsesobtained in the interview were on average 25 percent higher than the quantityof water recorded by the source observers.
Several possible explanations exist for this difference. First, the sourceobservers could, of course, have simply missed a trip by a family member,vhich would reduce the total quantity recorded in the source observation data.This could have occurred, for example, if one family member forgot theirhousehold number or could not identify themseives to the source observer.
- 35 -

Table 2
Comparison of Study Villages (Laurent and St. Jean du Sud)
Laurent St. Jean du Sud
1. Estimated Population 1,500 1,000
2. Number of Households Interviewed 170 143
3. Number of Water Sources 7 many
4. Number of Source Observations 119 87
5. Type of Terrain relativelyrugged flat
6. Was the Focus GroupInterview Conducted? no yes
7. Type of WTP Question Asked:
(a) Direct(b) Bidding game
noyes
yesyes
8. Was the Test for Starting-pointBias Conducted? yes yes
9. Was the Test for StrategieBias Conducted? yes yes
10. Mean WTP bid ($US/mo.)
(a) For standposts(b) For private connection
(in addition to chargefor standposts)
$1.15
.
$1.40
$1.10
$1.14
S
S
S
S
S
S
S
S
S
S
— 36 —

Second, the water sources were only observed for one day, which may not havebeen representative. Third, different groups of individuals were employed forthe source observers and the enumerators for the household interviews. Theremay have been systematic differences in the way they recorded the volumes ofwater containers. The source observations for Laurent, hovever, generallycorroborate the Information obtained from the household interviews. In theanalysis of the contingent valuation bids, the water use data from thehousehold interviews was used. The conclusions for St. Jean du Sud are moretentative because It ralned during the morning of the source observations,undoubtedly altering water collection patterns and reducing the quantity ofwater collected on this day. During the day of the source observations,information was recorded for 87 households who identified themselves by theirhousehold interview number. The average quantity of water collected by ahousehold based on the source observations In St. Jean du Sud was only 55percent of the quantity households reported in the household interviews.
Despite this large difference, there was other information supporting thereliabllity of the household interview Information. Forty-four of thesehousehoids said in their interview that they used only one source for watercarried to the home; in the source observations 49 households used only onesource. In the interviews, 38 households said they carried water home fromtwo sources; In the source observations 34 households used two sources. Inthe interviews, five households said they used three sources; in the sourceobservations, four househoids used three sources.
4.6 Analysis of the Contingent 1
Valuation Bids In Laurent and St. Jean du Sud
Execution of the contingent valuatlon survey went smoothly in Laurent. Onlythe bidding game question format was used in Laurent because respondentsusually felt that the bidding game was similar to the type of negotiationtypical of local markets in rural Haiti, and it thus worked better thanopen-ended questions. The mean bids of respondents who received the twoopening statements designed to test for strategie bias were not statisticallysignificant, and thus, on the basis of this test, respondents do not seem tobe behaving strategically when answering WTP questions. Similarly forstarting—point bias, there is no evidence that the initial starting point inthe bidding game influenced the final WTP bids for either standposts orprivate connections. Therefore, neither of these tests for bias indicated anyproblems with the use of the contingent valuation methodology.
1 A full discussion of the results of the statistical analysis of thecontingent valuation bids is presented in Appendix B.
— 37 —

S
The mean of the VTP bids in Laurent for public standposts was 5.7 gourdes perhousehold per month. This is roughly 1.5 percent of per capita income and issignificantly lover than the 5 percent rule of thumb often used in rural watersupply planning for maximum “ability to pay.” The WTP question for privateconnections assumed that public standposts were already provided in thevillage. The mean of the WTP bids for private connections was 7.1 gourdes.This bid is in addition to the bid for the public standpost.
The variation in the WTP bids for standposts and private connections in SLaurent is systematically related to variables suggested by economie theory:household wealth (as a proxy for income), education of household members, thedistance of the household from their existing water source, and therespondent’s perception of the quality of the water at their existing source.The results of the analysis indicate that WTP bids are not random or simplynumbers “pulled out of the air.” These results suggest that hypothetical biasmay not be a serious problem and that the WTP bids provide meaningfulInformation.
The resuits for St. Jean du Sud are less conclusive than those for Laurent duein part to implementation problems with the contingent valuation survey.Nevertheless, the results of the tests for strategie bias and starting—pointbias are consistent with those from Laurent: no evidence exists of either typeof bias. The overall mean bid in St. Jean du Sud for public standposts was5.5 gourdes per household per month, 96 percent of the value for Laurent. Themean bid for private connections was 5.7 gourdes per month, 80 percent of thevalue for Laurent. The variations in WTP bids for St. Jean du Sud could not beexplained as a function of the economie variables used in analyzing the bidsfrom Laurent.
4.7 Conelusions from the Haiti Case Study
From this research one cannot, of course, determine whether individuals in the 5villages would in fact pay the amounts they indicated in the contingentvaluation survey if a water agency actually tried to collect the money. To doso, It would be necessary to conduct a contingent valuation survey in avillage before a water system is built, then resurvey after the system iscompleted and collection efforts made and compare the prior bids with theaetual responses.
Nevertheless, the preliminary results of this research strongly suggest thatcontingent valuation surveys are a feasible method for estimating individuals’willingness to pay for improved water services in rural Haiti. This outcomehas important policy implications for rural water supply projeets such asCARE’s because It seems to show that going into a village and conductlng arelatively simple househo].d survey can yield reliable information on the/ population’s willingness to pay for improved water services. The potentialimportance of this strategy to eventual site selection and project design canbe illustrated vith three examples from CARE’s rural water supply project insouthern Haiti.
S
— 38 —

One of CARE’s first projects was constructed in Port—â—Piment, a coastal townof approximately 5,000 people. Before the completion of the new water system,the town relied om poor—quality shallow wells, river water, and one springapproximately three kilometers away. The spring provides large quantities ofhigh—quality water for drinking, but the six—kilometer round trip to fetch itimposed a heavy burden on the population. CARE designed the capacity of thenew water system to provide 60 liters per capita per day from 11 publicstandposts and planned for 20 percent of the population to have privateconnections.
When CARE agreed to construct the new system, there was great enthusiasm amongthe populatlon. CARE community organizers had no trouble establishing a localwater committee that collected a $1 US fee from each household to establish afund for operations and maintenance. In fact, the people of Port—â-Piment andthe new water committee soon wanted to know CARE’s policy for installingprivate connections. The National Water Authority in Haiti (SNEP) usually hasresponsibility for operatIng water systems with private taps and collectingmonthly charges; theIr standard fees are $25 IJS for a tap and $3 IJS per month,regardless of the volume used. Many local residents--far more than plannedfor in CARE’s standard system design-—expressed a desire for private taps onthese terms, signing up and making additional deposits of $5 US. Because thesprlng that was captured for the Port-â—Piment system could have suppliedseveral times the amount of water that the design called for, more prlvateconneetions could easily have been provided by using a larger pipeline fromthe source.
Regarding the findings of this research, if CARE had spent a few days carryingout a contingent valuation survey in Port—â—Piment before completing thesystem design, it might have been possible to predict this high demand forprivate connections. The high willingness to pay for private connections inPort—â-Piment indicates both that the beriefits of the project are likely to belarge and that a strorig possibility exists that any cost—recovery objectivescould be met. The Information from a contingent valuation survey would haveindicated that Port—â—Piment was an appropriate site for a new water systemand that the system should be designed to provide higher numbers of privateconnections.
As a second example, consider the CARE water system in Rosier. CARE selectedthis site for its first project because the source was near the village andeasy to capture, not because there was a shortage of water in the community.In addition to numerous nearby springs, two mountain streams flow through thevillage and are used for washing clothes and bathing. Because Rosler wasCARE’s first site, CARE staff paid close attention to water use after theproject was in operation and metered the f ive new public standposts. Waterconsumption at these standposts turned out to be approximately six liters percapita per day, not the 60 liters originally planned. Because the time savedcarrying water was relatively insignificant in comparison to communities suchas Port—â—Piment and Laurent, and the people of Rosier were probably alreadysatisfied vith the quality of water nearby, it should have been possible toanticipate that the benefits of the Rosier project would be bv. 1f CARE hadcarried out a contingent valuation survey in Rosier prior to the constructionof the project, there would probably have been many zero bids and a bv meanhousehold willingness to pay for public standposts. CARE could thus probablyhave predicted this bv water consumption in Rosier.
— 39 —

S
A third example Is the problem of defining the service population for St. Jeandu Sud. The CARE planning methodology called for counting the houses within atwo—kilometer band on either side of the main road through town, where thepublic standposts would likely be bocated. It was then assumed that all ofthese households would use the new water system and that the capacity of thesystem could be based upon this service population. The contingent valuationsurvey conducted in St. Jean du Sud showed, however, that people living backin the hills away from the road were much less likely to be villing to pay forpublic standposts located In town and probably would not use the proposed newwater system. From these results, CARE was able to devebop more realisticestimates of the service population for St. Jean du Sud and thus moreaccurately determine the appropriate capacity of the system.
S
S
S
S
S
S
- 40 -
S

Chapter 5
SUMMARYOF FINDINGS AND CONCLUSIONS
As indicated in Chapter 1, the study had two objectives: (1) to assess anddevebop methodobogical approaches for estimating indivlduals’ willingness topay for rurab water services and (2) to conduct a Held test of one approachfor estimating willingness to pay. Both of these objectives were accom—plished, as summarized below.
Summary of Review of Methodobogical Approaches For Estimating WTP
This study examlned the methodobogical approaehes available for assessingindividuals’ willingness to pay for improved water supplies. On the basis ofthis assessment, it is conciuded that the traditional demand model forexplaining quantity of water demanded by a household is inadequate for ruralvIllages in developing eountrIes. The report describes a theoretical modelfor understanding village water-use behavior which attempts to explain boththe household’s decision regarding which water source to use and how muchwater to use from that source. The application of this “discrete—continuousmodel” of household water demand will likely be successful in accuratelypredicting source choice decisions and it will represent a major advance inunderstanding vater—use behavior in developing countries.
Two complementary types of data can be used to estimate such a modeldescribing household water—use behavior. One approach is to collect data omactual observed behavior (the “Indirect” approach). In this case, the plannermeasures the quantities of water collected by different households, the timespent collecting water, and other source and household characterlstics and, onthe basis of consumer demand theory, infers how much the household would bevilling to pay for an improved water supply. The major advantage of thisapproach is that the estimates of willingness to pay are based on what peopleactually do, not on what they say they will do. Some of the disadvantagesare: (1) It may not be feasible in many bocations because there isinsufficient variation in the water source and household characteristics, (2)results may have to be extrapolated beyond the range of the data, and (3) adiscrepancy may exist between the revealed value of a commodity and thepayments which a household will actually make when the commodity or service ismade available. Other “Indirect” procedures for estimating willingness to payare considered, but it is concluded that they do not have great promise aspractical planning tools in the rurab water sector.
A second approach is simply to interview an individual and ask directly howmuch he or she would be willing to pay for a public tap or private connection.This “direct” approach to estimating villingness to pay Is termed the“contingent valuation method.” Some of the advantages of using data from acontingent valuation survey are: (1) it is inexpensive, (2) It can be used tovalue services not presently available in the village, and (3) It provides aprocedure for incorporating community preferences in the planning process.The major disadvantage is that, for a variety of reasons, in the interviewprocess individuals may not reveal their actual willingness to pay.
— 41 —

S
Most of the applications of the contingent valuation method have involvedefforts to measure the willingness of individuals to pay for changes inenvironinental quality and have been conducted either in the United States orWestern Europe. In the specific case of rural water supplies in developingcountries, a decade ago Saunders and Warford (1977) concbuded that “thequestionnaire approach to estimatIng individuals’ willIngness to pay has beenshovn to be virtually useless.” No empirical support exists for thisconciusion, however. IJntll the Haiti case study conducted as part of this *project, no systematic attempt was reported in the literature to determine thesuitability of the contingent valuation methodology for assessing thewillingness to pay for publicly provided goods in deveboping countries.Because the contingent valuation approach offered the promlse of a rapid,inexpensive means of determining willingness to pay for improved watersupplies, high priority was placed in this study on determining whether the Sapproach was practical.
F i nd 1 ngs
The findings from the Haiti field study of the contingent valuationmethodobogy have many lmplications for future efforts to use the method indeveboping countries. Among the most important findings are the folboving:
Finding No. 1
The research design tested for several threats to the validityof the survey results (strategie bias, starting—point bias,hypothetical blas). No evidence was found of any of thesebiases.
Finding No. 2 S
The bidding game question format was more effective thanopen—ended questions.
Finding No. 3
The WTP bids for Laurent vere systematically related to thehousehold and source characteristies suggested by conswnerdemand theory. For example, households farther away from theirexisting source vere vil].ing to pay more for a new public tapthan a household cbose to the traditional source. Similarly,higher—income households were willlng to pay more than bv—income househoids.
— 42 — S

Finding No. 4
The mean of the WTP bids In the village of Laurent for publictaps was $1.15 IJS per month, approxlmately 1.5 percent of percapita income and significantly bower than the 3 percent to 5percent of income rule of thumb. The mean of the WTP bids forprivate connections (assuming the public taps vere already inplace) was not significantly higher: $1.40 US per month.
Finding No. 5
AnalysIs of data collected from source observations indicatesthat the water use informatIon provided by respondents inhousehold interviews is reasonably aceurate.
Conclusions
On the basis of these findings and the field experience in Haiti, the researchteam reached the folbowing conciusions:
Conclusion No. 1
The contingent valuation survey for estimating willingness topay was practical and feasible in the field.
Conclusion No. 2
Respondents took the contingent valuation questlons, and indeedthe entire interview, seriously. Respondents did not givevildly unrealistic or “protest” bids.
Conclusion No. 3
The WTP bids offered by individuals are meaningful and notsimply numbers “pulled out of the air.”
Conclusion No. 4
The results of the field test in Haiti suggest that contingentvaluation surveys may provide valuable information onhouseholds’ willingness to pay for Improved water services.Such information could be particularly helpful in(1) IdentifyIng communities which could meet specifiedcost—recovery targets, (2) determining prices and connectionfees to charge for the improved water services, and(3) deterruining the appropriate level of service and the watersystem capacity required.
— 43 —

S
Conclusion No. 5
A villingness—to-pay study may be useful even when a donor iscommitted to providing free water because the results of thestudy may help identify villages where an improved water supplyis most desired and thus most likely to be used.
Conclusion No. 6
Additional experienee is required with contingent valuationsurveys in other countries to determine whether the conclusionsof the Haiti case study canbe generalized.
Conclusion No. 7
The lmplications of this study are not limited to the ruralwater sector; contingent valuation surveys are likely to be aviable method of collecting willingness to pay information for awide range of public infrastructure projects and public servicesin deveboping countries. In particular, contingent valuationsurveys are likely to prove useful for estimating individuals’willingness to pay for household sanitation services, operationsand maintenance of water supply systems, and transportation andhousing improvements.
S
S
S
S
S
- 44 —
S

Chapter 6
RECOMMENDATIONS
Investigation of the problem of estimating households’ willingness to pay forwater services is still in the preliminary stages vith much vork yet to bedone. The folboving are the most Important recommendations for future vork:
Recommendation No. 1
USAID should support a field test of the indirect approach toestimating willingness to pay for water services. Thediscrete—continuous model should be estimated vith datacollected from such a field test of the “indirect” approach andthe estimates of willingness to pay derived from the direct andindirect approaches should be compared and evabuated.
Recommendation No. 2
Research should be conducted to test (1) whether households needmore time (that is, a few hours or days) to consider thequestion of how much they would be villing to pay for improvedwater serviees and (2) whether households’ bids would differ if
,they were allowed to discuss the villingness-to—pay questions[~/jwith other members of their family, their neighbors, or inf’organized community meetings.
Recommendation No. 3
Contingent valuation surveys should be eonducted vhichexplicitly incorporate (1) variations in connection fees forimproved water services and (2) changes in the bocation ofimproved services in the village.
Recommendation No. 4
Anthropobogical studies should be conducted in conjunction withcontingent valuation surveys (1) to better understand issuesrelevant to water use behavior and better construct the wordingof the questionnaire, (2) to expbore the reasons why individualsansvered the vay they did, and (3) to examine why the estimatesof villingness to pay derived from the indirect and directapproaehes are different.
— 45 —

S
Recommendatlon No. 5
Future research should attempt to validate the estimates ofwillingness to pay based on both the direct and indirectapproaches. The most reliable test for both the direct andindirect approaches is whether the estimated model can predictindependently observed behavior. For the contingent valuationestimates, the ex—ante WTP bids should be compared with theactual payments made after a new system is installed.
Because the indirect approach will be used in a village whichalready has an improved water supply, the comparison of behaviorbefore and after the installation of a water system cannot beused to validate the model estimated vith such data. For theIndirect approach, the forecasting ability of the model may betested in two other ways. First, the sample of households In aparticubar village could be divided into two groups. The datafrom one group would be used to estimate the model. Theestimated model would then be used to predict the source choice(and perhaps water consumption) of the househoids in the secondgroup. 1f the predicted and actual choices were similar, itcould be conciuded that the model based om observed behavior was Svalidated for that particular village. Second, the modelestImated from observations in one village could be used topredict behavior in another village. Again, 1f the predictedand actual choices vere similar, the model could be eonsideredto be validated.
S
Recommendation No. 6
USAID should support the preparation of a manual or set ofguidelines for water supply planners that summarizes the lessonslearned from this research effort concerning the practicaldetails of designing and implementing a contingent valuationsurvey in a deveboping country.
S
S
S
— 46 —
S

REFERENCES
— 47 —

S
S
.
S
S
S
S
S

REFERENCESFOR CHAPTER2
USAID Evaluations:
Bigelow, R.E., and Chiles, L. 1980. Tunisia: CARE Water Projects. Washington,D.C.: AID Project Impact Evaluation Report No. 10.
Chetwynd, E., et al. 1981. Korea Potable Water System Project: Lessons fromExperience. Washington, D.C.: AID Project Impact Evaluatlon Report No.20.
Dworkin, D. 198Oa. Kenya Rural Water Supply: Programs, Progress, Prospects.Washington, D.C.: AID Project Impact Evaluation Report No. 5.
1980b. Rurab Water Projects in Tanzania. Washington, D.C.: AIDEvaluation Special Study No. 3.
1982. Community Water Supply in Developing Countries: Lessons fromExperience. Washington, D.C.: AID Program Evaluation Report No. 7.
Dworkin, D., et al. 1980. The Potable Water Project in Rural Thailand.Washington, D.C.: AID Project Impact Evaluation Report No. 3, 1980.
Haratani, J., et al. 1981. Peru: CARE OPG Water Health Services Project.Washington, D.C.: AID Project Impact Evaluatlon Report No. 24.
Meehan, R., et al. 1982. Panama: Rural Water. Washington, D.C.: AID ProjectImpact Evaluation No. 32.
World Bank Reports:
Arab Republic of Egypt: Beheira Provincial Potable Water Supply Project,
1981.
Burundi: Rural Water Supply Project Appraisal Report, 1985.
China: Rural Water Supply Project, 1985.
Mali: Rural Water Supply Project, 1983.
Paraguay: Second Rural Water Supply and Sanitation Project, 1981.
The Phillppines: First Rural Water Supply and Sanitation Project Ap~raisalReport, 1982.
— 49 —

S
Inter—American Development Bank Project Reports:
SChile: Programa de Agua Potable Rural: IV Etapa, Washington, D.C., 1985.
Eb Salvador: Rural Water Supply Program(III Stage), Washington, D.C., 1985.
Federative Republic of Brazi.l: Pedra Do Cavabo Drinking Water Supply Projectfor Salvador (Bahia). Project Report 1983.
Haiti: Second Stage of the Community Health Posts and Rural Drinking WaterSupply Program, Washington, D.C., 1985.
Honduras: Rural Water Supply Program, Washington, D.C., 1985.S
S
S
S
S
S
- 50 -
S

GENERALREFERENCES
Australian Devebopment Assistance Bureau. 1983. In: World Health Organization,Catabogue of External Support. New York: International Drinking WaterSupply and Sanitation Decade Publication No. 3, April, p. 19.
Becker, G.S. 1965. A Theory of Albocation of Time. The Economie Journal,September.
Becker, Cray. 1976. The Economie Approach To Human Behavior. The Universityof Chicago Press.
Birdsall, N., and Orivel, F. 1983. Villingness to Pay for Health and Water InRural Mali: Do WTP Questions Vork? Washington, D.C.: World Bank PHNDept.
Bockstael, N.F.; Hanemann, W.M.; and Kling, C.I. 1986. Modeling RecreationalDemand in a Multiple Site Framework. Unpublished paper.
Bohm, P. 1972. Estimating Demand for Public Goods: an Experiment. EuropeanEconomie Review 3:111-30.
Boyle, K.J.; Bishop, R.; and Welsh, M. 1985. Starting—point Bias inContingent Valuation Bidding Games. Land Eeonomics, May, Vol. 61, No. 2.
Briscoe, J.; Charkrabarty, M.; and Ahmed, S. 1981. How Bengali VillagersChoose Sources of Domestic Water. Water Supply and Management. 5:165-81.
Brookshire, D.S.; Thayer, M.A.; Schulze, W.D.; and d’Arge, R.C. 1982. ValuingPublic Goods: A Comparison of Survey and Hedonic Approaches. AmericanEconomie Review. 72:165—77.
Bruzelius, N. 1979. The Value of Travel Time. London: Croom Helm Ltd.
Cairncross, S., et al. 1980. Evaluation of Village Water Supply Planning.Chichester: John Wiley & Sons.
Canadian International Devebopment Agency. 1983. In: World HealthOrganization, Catabogue of External Support. New York: InternationalDrinking Water Supply and Sanitation Decade Publicatlon No. 3, April,p. 218.
Caslay, D, and Lury, D. 1981. Data Colleetion In Developing Countries.Oxford: Clarendon Press.
Coopers & Lybrand Associates Ltd. 1979. Egypt Provineial Water Supply Project
:
Report on a Survey of Consumers’ Attitudes to Potable Water Supplies.
- 51 -

S
Cummings, R.G.; Brookshire, D.S.; and Schulze, W.D. 1986. Valuing PublicGoods: The Contingent Valuation Method. Totowa, New Jersey: Rowman andAllenheld Publishers.
Deaton, A., and Muellbauer, J. 1980. Economics and Consumer Behavior.Cambridge University Press.
DeSerpa, A.C. 1981. A Theory of Economics of Time. The Economie Journal,December. S
Dickie, M.; Fisher, A.; and Gerking, S. 1985. Market Transactions andHypothetical Demand Data: A Cooperative Study. Iiniversity of Wyoming,Department of Economics: Unpublished paper, November.
Dubin, J.A. and McFadden, D.L. 1984. An Econometric Analysis of ResidentialEbectrical Appliance Holdings and ConsumptIon. Econometrica, March,Vol. 52, No. 2.
European Economie Community. 1983. In: World Health Organization, Catabogue ofExternal Support. New York: International Drinking Water Supply andSanitation Decade Publication No. 3, April, p. 218. S
Federal Republic of Germany. 1983. In: World Health Organization, Catabogue ofExternab Support. New York: International Drinking Water Supply andSanitation Decade Publication No. 3, April, p. 19.
Freeman, A.M. 1979a. The Benefits of Environmental Improvement Theory andPractice, Resource for the Future. Johns Hopkins University Press. S
1979b. The Hedonie Price Approach to Measuring Demand forNeighbourhood Characteristies. In: Segal, D. (ed.), The Economies ofNeighbourhood. Academie Press.
Hanemann, M.W. 1984a. Discrete/Continuous Models of Consumer Demand. SEconometrica, May, Vol. 52.
1984b. Welfare analysis with discrete choice model. University ofCalifornia at Berkeley: Working paper No. 173.
Heckman, J.J. 1978. Dummy Endogenous Variables in a Simultaneous EquationSystern. Econometrica, July, Vol. 46, No. 6.
IBRD. 1986a. Water Supply and Urban Development Department. Rural WaterSupply and Sanitation: Time for a Change. Washington, D.C.: Draf t paper,June.
1986b. Improving the Effectiveness of Investment in the Water Sector. SWashington, D.C.: World Bank/UNDP Water Decade Program, June.
Kriesel, W., and Randall, A. 1986. Evaluating National Policy by ContingentValuation. Paper submitted at the annual meeting of the AmericanAgricultural Economics Association, July.
- 52 -

Lancaster, K.J. 1965. A New Approach to Consumer Theory. Journal of PoliticabEconomics, 74.
Lee, L.F. 1979. Identification and Estimation in Binary Choice Models withLimited Dependent Variable. Econometriea, July, Vol. 47, No. 4.
Lee, L.F., and Trost, R.P. 1978. Estimation of Some Limlted Dependent VarlableModels vith Application to Housing Demand. Journal of Econometrics8: 357—82.
McFadden, D. 1978. Modeling the Choice of Residential Location. In: SpatiabInteraction Theory and Planning Model. Edited by A. Karlquist et al. NewYork: North Holland Publishing Co.
1981. Econometric Models of Probabilistic Choice. In: StructuralAnalysis of Discrete Data. Edited by Manski and McFadden. Cambrldge: MITPress.
Maddala, G.S. 1983. Limited-Dependent and Qualitative Variables inEconometrics. Cambridge University Press.
Mitchell, R.C., and Carson, R.T. 1984. Willingness to Pay for NationalFreshwater Quality Improvements. Washington, D.C.: Draf t report forIJSEPA Resources for the Future, October.
1985. Will Respondents Answer Honestby? Observations on StrategieBias and Contingent Valuation Surveys. In: Using Surveys to Value WaterQuality Beneftis: The Contingent Valuatlon Method (Chapter 3).Washington, D.C.: Draft paper for USEPA Resources for the Future, 29January.
1986. Using Surveys to Value Public Goods: The Contingent ValuationMethod. Washington, D.C.: Forthcoming from USEPA, Resources for theFuture.
Michael, R.T., and Becker, G.S. 1973. Om the New Theory of Consumer Behavior.Swedish Journal of Economies 75.
Philips, L. 1975. Applied Consumption Analysis. North—Holland Publishing Co.,American Elsevier Publishing Co. Inc.
Pollak, R.A., and Watcher, M.L. 1975. The Relevance of the HouseholdProduction Function and Its Implications for the Albocation of Time.Journal of Political Economics.
Powers, T.A. 1978. Benefit-Cost Analysis of Urban Water Projeets. WaterSupply and Management (Great Britain: Pergamon Press); 1:371.
Randall, A.; Grunevald, 0.; Johnson, S.; Ausness, R.; and Pagoulatos, A. 1978.Reclaiming Coal Surface Mines in Central Appalachia: A Case Study of theBenefits and Costs. Land Economics, November, 54(4):472—89.
— 53 —

S
Randall, A.; Hoehn, J.P.; and Brookshire, D.S. 1983. Contingent ValuationSurveys for Evaluating Environmental Assets. Natural Resources Journal, 5July, 23:636—55.
Randail, A.; Ives, B.; and Eastman, C. 1979. Bidding Games for the Valuationof Aesthetic Environmental Improvements. Journal of EnvironmentalEconomics and Management 1:132—49.
Randall, A.; Hoehn, J.P.; and Tolley, G.S. 1981. The Structure of ContingentMarkets: Some Results of a Recent Experiment. Paper presented at theAmerican Economie Association Annual Meeting in Washington, D.C.
Saunders, R., and Warford, J. 1977. Village Water Supply. Johns HopkinsUniversity Press.
Smith, V.K.; Desvousges, W.H.; and McGivney, M.P. 1983. Estimating WaterQuality Benefits: An Econometric Analysis. Southern Economie Journal,October; Vol. 50, No. 2.
Smith, V.K.; Desvousges, W.H.; and Flsher, A. 1985. A Comparison of Direct andIndirect Methods for Estimating Environmental Benefits. Unpublished Spaper, 18 September.
Smith, V.K., and Desvousges, W.H. 1986. Measuring Water Quality Benefits.Kluver—Nijhoff.
Vaughn, W.J., and Russell, C.S. 1982. Valuing a Fishing Day: An Application ofA Systematic Varying Parameter Model. Land Economics, November,pp. 450—63.
White, G.F.; Bradley, D.J.; and White, A.U. 1972. Drawers of Water: DomesticUse in East Africa. University of Chicago Press.
Whittington, D.; Lauria, D.; Okun, D.; and Mu, X. 1987. Water Vending inDeveloping Countries. VASH Technical Report No. 45. Arlington, Virginia:Water and Sanitation for Health Project.
S
S
S
— 54 —
S

APPENDIX A
Household Questionnaire
- 55 —

S
S
S
S
S
S
S
S
S
S
S

APPENDIX A
Household Questionnaire
INTRODUCTORY STATEMENT 1
(FOR THOSE VILLAGES WHEREWATER SYSTEMSARE ALREADY COMPLETED)
We are working with CARE on a water study. CARE has helped people in______________ to build a potable water system. We will be asking questionsto determine 1f people in ______________ like this new water system and whatis the best system to build for other communities.
Your responses are assisting us only on questIons concerning potable watersystems. These responses will aid us to better understand how to supplypotable water to other communities. And, these responses are not going tochange anything in regard to the water system already in ________________
1f you do not want to respond to these questions you are free to stop atanytime.
INTRODUCTORYSTATEMENTII(FOR THOSE VILLAGES WHEREWATERSYSTEMSHAVE NOT BEEN STARTED)
We are working with CARE on a water study. CARE vants to help peopbe in____________ supply water to their community. We would like to ask you somequestlons to be able to know vhat needs to be done in ______________ to supplypotable water.
Your responses are assisting us only on questions concerning potable watersystems. And, these responses will also aid us to better understand how tosupply potable water to other communities.
It you do not want to respond to these questiofls you are free to stop atanytirne.
— 57 —

Questionnaire Series *:
Time Interview Starts:
Household *: _________
Name of Locality: ____
Name of Enumerator:
Ends: ____________
Date of Interview:
1ST PART
HOUSEHOLDQUESTIONNAIRE
1. Name of Person Being Interviewed:
S
Age: _____ MAN / WOMAN
2. Name of Head of Household: _______________
Is this a femabe—headed household? YES / NO
3. How many peopbe live In this house? _______
How many adults (over age 18)? ____________
How many young people (ages 13-18)? _______
How many children (ages 5—12)? ____________
How many children under f ive? _____________
S
S
S
S
Are other peopbe helping the respondent answer questions?
YES / NO
S
S
S
S
S
- 58 —
S

4. What is the occupation of the head of your household
?
Does he/she or other members have other occupations?
OTHER OCCUPATIONSFIRST 1 2 3OCCUPATION
Farmer
Mason/Carpenter
Sailor/Fisherman
Craf tsman
Factory Worker
Small Business
(Madam Sara)
Large Business
Voudou Priest,Medicine Man,Midwife
Professional
Other ( )
5. Vhere is your household getting water this week?
a)b)c)d)
Where does your household get water for:
lst 2nd 3rd 4th
Place Place Place Place
- Drinking- Cooking— Adult Bathing- Children Bathing— Cbothes Washing— Utensil Washirig- Animal Bathing- Animal Drinking
— 59 —

6. Does your household get water at these same sources during therainy season? YES / NO
1f no, vhere does your household get water during the rainyseason?
a)b)c)d)e)
Where does your household get water during the rainy season for:
lst 2nd 3rd 4thPlace Place Place Place
— Drinking _____________________________________________
- Cooking __________________________________________- Adult Bathing __________________________________________- Children Bathing __________________________________________- Cbothes Washing _____________________________________________
- Utensil Vashing _____________________________________________
— Animal Bathing ____________________________________________- Animal Drinking __________________________________________
7. Can you show me vhat containers your household uses for eollecting water?
a)b)c)d)e)
How much water does eachcontainer hold?
For each container, how manytimes is it filled daily?
8. Does your household collect rainwater? YES / NO
Does your household have a tank to collect rainwater?
- 60 -
YES / NO
S
S
S
S
S
S
S
S
S
S
S

9. Does your household use water vhich comes from Cayes or another town?YES / NO
1f yes,
a) Vhat town is this? ______________________________
b) Does your household pay for this water? YES / NO
How much does your househobd pay per galbon? ___________
c) 0fl average, how many gallons does your household get
from _____________________ each trip? ___________________
d) Does your household pay for having this water transported? YES / NO
How much does your househobd pay to have this watertransported? __________________________
e) How many tlmes does your household get water from ___________________
weekly? ______________________
f) Does someone else transport this water for you or doesa member of your household transport this water?
10. In Port—au-Prince, people often sell water by the bucket.Suppose someone in _________________ starts selling tap waterthat is of good quality. 1f a large bucket (7 galbon)cost ** , would your household buy It? YES / NO
How many of these buckets would your household buy daily?
** Different prices are given here, the folboving was used in Haiti:0.10 or 0.20 or 0.30 or 0.40 or 0.50 gourdes.
— 61 —

S
2ND PART
1. Source name:
(Complete the folbowing questions for each source)
S
2. Does your household use this water at the source? YES / NO
3. 1f you have to choose three words: Good / Fair / Badwhich would you choose to describe the folbowing for this source?
a) Coborb) Odorc) Tasted) Dirte) No Microbes in
the waterf) Reliabilityg) No quarrels at
the source
h) Distance
4. (Complete the folbowinghouse.)
NOT FAR FAR VERY FAR
for this source 1f water is carried back to the
How many people in your household carry water each day? ______
How many adults? _____
How many children?
1)
2)
3)
4)
5)
6)
How many times each daydoes each person go tothis source to get water?
— 62 —
How much water doeseaeh person carry inone trip?
S
S
GOOD FAIR BADS
S
S
S
S
S
S

3RD PART VILLINGNESS TO PAY FOR WATER
Introduction [Opening Statement A]
(The enumerator should read sentence after sentence.)
1 am going to ask you some questions In order to know if you or someone fromyour household would be willing to pay money to ensure that the CARE PotableWater Project will be successful in Laurent/Sin Jean du Sud.
We would like you to ansver these questions at ease. There are no wronganswers.
The water system is going to be managed by a coinmittee of people fromLaurent/Sin Jean. This committee will be chosen by the people of Laurent/SinJean.
CARE has decided to help Laurent/Sin Jean by constructing a water system inthis community. Your answers cannot change the fact that CARE has decided tobuild this water system.
CARE never demands money from those people who collect water from publicfountains. You will not have to pay money at the public fountains.
We need you to tell the truth in order for CARE to construct the best watersystem that Laurent/SIn Jean needs.
Did you understand everythIng that 1 was saying?(1f not, the enumerator should repeat the above sentences again.)
3RD PART WILLINGNESS TO PA! FOR WATER
Introduction [Opening Statement B]
(The enumerator should read sentence after sentence.)
1 am going to ask you some questions in order to know 1f you or someone fromyour household would be willing to pay money so that the CARE Potable WaterProject will be suceessful In Laurent/Sin Jean du Sud.
The water system is going to be managed by a committee of people fromLaurent/Sin Jean. This committee will be chosen by the people of Laurent/SinJean.
The committee will decide the amount each household will have to pay tooperate and maintain the water system.
Did you understand everything that 1 was saying?(1f not, the enumerator should repeat the above sentences again.)
— 63 —

S
Series A WTP Questions (Open-ended Questions)
A.1 Here are pictures of CARE public fountains in Rosier and Port—â—Piment
(show pictures). Households collect any amount of water and at anytime.
What is the largest amount of money your household would be willing topay each month without diffieulty to have a public fountain in yourneighborhood?
SAmount of Money: ______________
1 don’t know: _____________
A.2 CARE thinks if people want to have a private connection, it is aprivilege and the household has to pay for It. (The enumerator shouldexplain what this means: a private connection meaning a pipe installedin the house with a tap.)
CARE will already have set up public fountains SO that, everyone willhave at their disposal good drinking water. Suppose that the amount ofmoney for installing a private connection will cost 125 gourdes plusmoney for the materials. The water from the private connection can beused only in your house. You won’t be able to sell water or use It towater gardens. 1f you do not pay each month, your private conneetionwill be disconnected.
How much would your household be willing to pay each month to have aprivate conneetion?
SAmount of Money: _______________
1 don’t know: ______________
1f your househobd could pay more, how much do you think your householdwould be willing to pay each month to have a private connection?
SAmount of Money: ______________
1 don’t know: ______
S
S
S
— 64 —
S

Series B WTP Questions (Bidding Game No. 1)
B.1 Here are pictures of CARE public fountains set up in Rosier andPort—â—Piment (show pictures).
(a) Do you think your household would be willing to pay (2 or 5 or 7)gourdes each month to use a public fountain bocated in yourneighborhood?
Yes _____
No _____
1 don’t know
Go to (b)Go to (c)Go to (f)
(b) We do not know how much the water committee will decide for eachhousehold to pay for using the public fountain each month. 1f thedecision is for each household to give 10 gourdes each month, wouldyour household be willlng to pay this?
YesNo _____
1 don’t know
Go to (f)Go to (d)Go to (f)
(c) We do not know how much the water committee will deelde for eachhousehold to pay for using the public fountain each month. 1f thedecision is for eaeh household to give 0.50 gourdes each month, wouldyour household be villing to pay this?
Yes _____
No _____
1 don’t know
Go to (e)Go to (f)Go to (f)
(d) Would your household be willing to pay (5 or 7 or 8) gourdes eachmonth to use a public fountain bocated in your neighborhood?
Yes _____
No _____
1 don’t know
Go to (f)Go to (f)Go to (f)
(e) Would your household be villing to pay (1 or 2 or 5) gourdes eachmonth to use a public fountain bocated in your neighborhood?
YesNo _____
1 don’t know
Go to (f)Go to (f)Go to (f)
(f) ThInk for a moment, what is the largest amount of money yourhousehold would be villing to pay each month to use a publicfountain? 1f it would cost your household more than this amount,your household could not af ford to pay and would not be able to usethe public fountain.
Amount of Money: ____
1 don’t know: ____
Go to the next pageGo to the next page
— 65 —

S
B.2 CARE thinks that 1f your household wants to have a private conneetion itis a privilege and your household bas to pay for It (explain 1f needed).It is going to be the responsibility of the water committee to fix theamount people will pay each month. This has nothing to do with thissurvey. Suppose your household pays 125 gourdes for the installationplus the money for the materials and CARE has already set up publicfountalns so that, everyone will have at their disposal good drinkingwater.
(a) Would your household be willing to pay (5 or 10 or 15) gourdes eaehmonth to have a private conneetion?
Yes _____
No _____
1 don’t know
Go to (b)Go to (c)Go to (f)
(b) We are not able to know beforehand how much money the water committeeis going to demand for a private connection each month. 1f thecommittee asks 20 gourdes each month, would your household be willingto pay to have a private connection?
YesNo _____
1 don’t know
Go to (f)Go to (d)Go to (f)
S
(c) We are not able to know beforehand how much money the water committeeis going to demand for a prlvate connection each month. 1f thecominittee asks 2.50 gourdes eaeh month, would your household bewilling to pay to have a private connection?
YesNo _____
1 don’t know
Go to (e)Go to (f)Go to (f) S
(d) Would your household be willing to pay (10 or 15 or 17) gourdes eachmonth to have a private connection?
Yes _____
No _____
1 dori’t know
Go to (f)Go to (f)Go to (f)
(e) Would your household be willing to pay (3 or 5 or 10) gourdes eachmonth to have a private connection?
Yes _____
No _____
1 don’t know
Go to (f)Go to (f)Go to (f)
S
S
S
S
S
S
S
S— 66 —

(f) Nov, take a moment to refleet. What is the largest amount of moneyyou think your household would be willirig to pay each month to have aprivate connection?
Amount of Money:1 don’t know:
Go to (g)Go to (g)
(g) Do you think that your household can pay the installation charge andthe amount for the materials?
Yes _____
No _____
1 don’t know
Go to the next pageGo to the next pageGo to the next page
— 67 —

Series C WTP Questions
C.1
(Bidding Game No. 2)
(a) Do you think your household would be villing to pay 0.50 gourdes eachmonth to use a public fountain in your neighborhood?
Yes Go to (b)_____ Go to (f)
1 don’t know Go to (f)
(b) Do you think your household would be willing to pay 2 gourdes eachmonth to use a public fountain in your neighborhood?
Yes _____
No _____
1 don’t know
Go to (c)Go to (f)Go to (f)
(c) Do you think your household would be willing to pay 5 gourdes eaehmonth to use a public fountain in your neighborhood?
Yes _____
No _____
1 don’t know
Go to (d)Go to (f)Go to (f)
S
(d) Do you think your household would be willing to pay 7 gourdes eachmonth to use a public fountain In your neighborhood?
YesNo _____
1 don’t know
Go to (e)Go to (f)Go to (f)
S
(e) Do you think your household would be willing to pay 10 gourdes eachmonth to use a public fountain in your neighborhood?
YesNo _____
1 don’t know
Go to (f)Go to (f)Go to (f)
S
(f) Take a moment, vhat is the greatest amount of money your householdwould be villing to pay to use a public fountain. 1f it would costyour household more than this amount, your household could not af fordto pay and would not be able to use the public fountain.
Amount of Money:1 don’t know:
____ Go to the next page
Go to the next page
— 68 —
S
S
S
No
S
S
S
S

C.2 CARE thinks that ii your household vants to have a private connection Itis a privilege and your household has to pay for it (explain if needed).It is going to be the responsibility of the water committee to fix theamount people will pay eaeh month. This has nothing to do wlth thissurvey. Suppose your household pays 125 gourdes for the installationplus the money for the materlals and that everyone will have at theirdisposal good drinking water at public fountains.
(a) Would your household be villing to pay 2.50 gourdes each month tohave a private connection?
Yes _____
No _____
1 don’t know
Go to (b)Go to (f)Go to (f)
(b) Would your household be willing to pay 5 gourdes each month to have aprivate connection?
Yes _____
No _____
1 don’t know
Go to (c)Go to (f)Go to (f)
(c) Would your household be wllling to pay 10 gourdes each month to havea private connection?
YesNo _____
1 don’t know
Go to (d)Go to (f)Go to (f)
(d) Would your household be villing to pay 15 gourdes each month to havea private connection?
Yes _____
No _____
1 don’t know
Go to (e)Go to (f)Go to (f)
(e) Would your household be willing to pay 20 gourdes each month to havea private conneetion?
Go to (f)_____ Go to (f)
1 don’t know Go to (f)
(f) Take a moment to reflect. Vhat is the largest amount of money youthink your househobd would be willing to pay to have a privateconnection?
Amount of Money:1 don’t know:
____ Go to (g)____ Go to (g)
YesNo
— 69 —

(g) Do you think that your household can pay the installation charge andthe amount for the materials?
Yes _____
No _____
1 don’t know
Go to the next pageGo to the next pageGo to the next page
- 70 -
S
S
S
S
S
S
S
S
S
S

Series D WTP Questions (Bidding Gatne No. 3)
D.1
(a) Do you think your household would be willing to pay 10 gourdes eachmonth to use a public fountain in your neighborhood?
Yes _____
No _____
1 don’t know
YesNo1 don~’t know
Go to (f)Go to (b)Go to (f)
Go to (f)Go to (c)Go to (f)
(c) Do you think your household would be willing to pay 5 gourdes eachmonth to use a public fountain in your neighborhood?
Yes _____
No _____
1 don’t know
Go to (f)Go to (d)Go to (f)
(d) Do you think your household would be willing to pay 2 gourdes eaehmonth to use a public fountain in your neighborhood?
Yes _____
No _____
1 don’t know
Go to (f)Go to (e)Go to (f)
(e) Do you think your household would be willlng to pay 0.50 gourdes eaehmonth to use a public fountain in your neighborhood?
Yes _____
No _____
1 don’t know
Go to (f)Go to (f)Go to (f)
(f) Take a moment, what is the greatest amount of money your householdwould be villing to pay to use a public fountain. 1f It would costyour household more than this amount, your household could not af fordto pay and would not be able to use the public fountain.
Amount of Money:1 don’t know:
____ Go to the next page____ Go to the next page
(b) Do you think your household would be willing to paymonth to use a public fountain in your neighborhood?
7 gourdes each
— 71 —

D.2 CARE thinks that 1f your household wants to have a private connection itis a privilege and your household has to pay for it (explain if needed).It is going to be the responsibility of the water committee to fix theamount people will pay each month. This has nothing to do with thissurvey. Suppose your household pays 125 gourdes for the installationplus the money for the materials and that everyone will have at theirdisposal good drinking water at public fountains.
(a) Would your household be villing to pay 20a private connection?
YesNo _____
1 don’t know
Go to (f)Go to (b)Go to (f)
(b) Would your household be vIbling to pay 15 gourdes each month to havea private connection?
S
Yes _____
No _____
1 don’t know
Yes _____
No _____
1 don’t know
Go to (f)Go to (c)Go to (f)
Go to (f)Go to (d)Go to (f)
(d) Would your household be willing to pay 5 gourdes each month to have aprivate connection?
S
YesNo _____
1 don’t know
Go to (f)Go to (e)Go to (f) S
(e) Would your household be willing to pay 2.50 gourdes each month tohave a private connection?
YesNo _____
1 don’t know
(f) Take a moment to reflect.think your household wouldconnec t ion?
Amount of Money: ____
1 don’t know: ___
Go to (f)Go to (f)Go to (f)
What is the largest amount of money yoube willing to pay to have a prlvate
Go to (g)Go to (g)
— 72 —
S
S
S
S
S
Sgourdes eaeh month to have
(c) Would your household be willing to pay 10a private connection?
gourdes eaeh month to haveS
S

(g) Do you think that your household can pay the installation charge andthe amount for the materials?
YesNo _____
1 don’t know
Go to the next pageGo to the next pageGo to the next page
- 73 -

— 74 —
S
S
S
S
S
S
S
4TH PART CONCERNING HEALTH
1. Hov inany times did you or another member of your householdgo to the
Medical Center last month? _______________________________
(Questions 2—3 are concerning infants only.)
2. Are there infants in the household who had diarrhea last week?
YES / NO
How many infants had diarrhea last week? ____________________
3. Are there infants in the household that had skin infections last week?
YES / NO
S
S
S
S

5TH PART LEVEL OF EDUCATION & MEASURE OF HOUSEHOLD ASSETS
1. Do teenagers and children in your household go to school?
YES / NO
What grades are they in?
LEVEL OFEDUCATION
Did you go to school?What grade have you completed?Did your husband/wife go to school?What grade has he/she completed?Did other adults in the household go to school?What grades have they completed?
TEENAGERS& CHILDREN
Uneducated ______________________________
KindergartenInfant Class (1)Preparatory (2—3) ____________________________
Elementary (4-5) ____________________________
Mlddle Class (6—7)
6th, Sth (8—9) ____________________________
4th, 3rd, 2nd (10—12) ____________________________
Rheto ____________________________
Ph 1 bosophy ______________________________
University ____________________________
2. Do you own your house or do you rent your house?
Own _____ Rent _____
3. How many rooms does your house have? _____________________
4. Do you have people in a foreign country who send you rnoney?
YES / NO
YES / NO
YES / NO
YES / NO
ADULTS
- 75 -

6. How are the vails of the house constructed?
a) Bbock/Stoneb) Masonc) Lattice/Straw
7. How Is the fboor made?
a) Mosaic/Brickb) Cementc) Dirt
Is the house (doors and windows) painted?
Does the house have a front poreh?
Does
Does
Does
Does
the household have a latrine?
the household have a radio?
the household have a Coleman Lantern?
the household have a glass lamp?
YES / NO
YES / NO
YES / NO
YES / NO
YES / NO
YES / NO
OBSERVATIONS TO BE MADE BY THE ENUMERATOR
5. How is the house covered (i.e., what is the roof made of)? (Put an (x)
next to the correct answer)
a) Concreteb) Sheet metalc) Straw
S
S
S
S
8.
9.
10.
11.
12.
13.
S
S
S
S
S
S
— 76 —
S

6TH PART FOR THE ENUMERATORTO COMPLETE
We would like you to respond to these questions about the survey.
1. Was the person who responded to the questions irritated? YES / NO
2. Did he/she give you a warm velcome? YES / NO
3. Do you think he/she was a little nervous? YES / NO
4. Do you think he/she made efforts to tell the truth? YES / NO
5. Was it diffieult for him/her to respond to thequestioris on villingness to pay? YES / NO
6. How do you evaluate the responses given?
(Choose one)
Excellent / good / fair / mediocre / bad
Do you have any eomments you would like to make about this survey?
DON’T FORGETTO RECORDWHAT TIME THE INTERVIEW ENDED!
— 77 —

S
S
S
S
S
S
S
S
S
S
S

APPENDIX B
Analysis of the Contingent Valuation Bids
— 79 —

S
S
S
S
S
S
S
S
S
S
S

APPENDIX B
Analysis of the Contingent Valuation Bids
B.1. ANALYSIS OF THE WTP BIDS IN LAIJRENT
In Laurent, 170 questionnaires were conducted out of approximately 225households. The research team’s impression from sitting in on many of thehousehold interviews is that respondents took the contingent valuationquestIons, and Indeed the entire interview, quite seriously. Fourteen percentof the households gave an answer of “1 don’t know” in response to the WTPquestion for public standposts; there was a 25 percent nonresponse rate forthe WTP question for private connections. The mean of the WTP bids In Laurentfor the public standposts, 5.7 gourdes per month ($1.14 US; $]..00 US = Sgourdes) seems realistic. It never seemed that respondents gave widelyunrealistic or “protest” bids. Based on the pretest and initial field vork inSt. Jean du Sud, It was concluded that the bidding game question formatworked better than the direct, open—ended questions. People generally feltmore comfortable with the bidding games, and in fact the enumerators remarkedthat the bidding game format was very famillar and easily understood becauseIt was similar to the ordinary kind of bargaining that goes on in localmarkets of rural Haiti. Hence In Laurefit only the bidding game questionformat was used.
In this section of Appendix B the resuits of the statistical analysis of thedata obtained from the household surveys in Laurent are discussed. Table 3presents the results of the tests for strategie bias for the WTP questions forboth public standposts and private connections. The 150 total responses forpublic standposts were relatively evenly divided between Statement A (77responses) and Statement B (73 responses), as were those for the privateconnections. As anticipated, for respondents who received Statement A, themean bids for both public standposts and private connections were hlgher thanfor those who received Statement B, but the difference- is not statisticallysignifieant. On the basis of this test, there is no reason to believe thatrespondents were acting strategically vhen they answered the WTP questions.
Table 4 presents the results of a similar statistlcal test for starting—pointbias. 1f starting-point bias were a problem, It would be expected that thebv starting point (2 gourdes for public standposts; 5 gourdes for privateconnections) would result in a bower bid, and that the high starting point (7gourdes for public standposts; 15 gourdes for private connections) wouldresult in higher bids. The mean bids in Table 4do not appear to varysystematically with the starting point. The null hypothesis that the threesamples are from the same population (that there is no difference in theresponses from individuals who received different starting points) cannot berejected.
On the basis of these results, there was no reason to attempt to adjust theanalysis of WTP bids for strategie or starting-point bias. The mean of WTPbids in Laurent for the public standposts was 5.7 gourdes per household permonth. This is roughly 1.5 percent of per capita Income and is signifleantlybover than the 5 percent rule of thumb often used in rural water supply
— 81 —

S
Table 3
Test for Strategie Bias (Laurent) S
Willingness to Pay for Public Standposts
SOpening Statement Opening Statement
A* B*
Total observations 77 73Mean WTP bid** 6.0 3.4Standard deviation 3.8 3.9
Overall mean 5.7Standard deviation 3.8t—statistie 1.1Probability 0.3
Null hypothesis that the two samples are from the same populationcannot be rejected at an acceptable confidenee level.
Willlngness to Pay for Private Connections
Opening Statement Opening Statement SA* B*
Total observations 67 65Mean WTP bId** 7.5 6.7Standard devlatlon 9.0 9.8
Overall mean 7.1Standard deviation 9.4t—statistic 0.5Probabillty 0.6
Null hypothesis that the two samples are from the same populationcannot be rejected at an acceptable confidence level.
* Opening Statements A and B are contained in the household questionnaire inAppendix A.
S** Mean WTP bid in gourdes per month. 5 gourdes = $1 US.
S
- 82 —
S

Table 4
Test for Starting-point Bias (Laurent)
Willlngness to Pay for Public Standposts
Number of observationsMean WTP bid**Standard deviation
F: .32
Starting Point
2 gourdes* 5 gourdes
56 47
Probability: .73
Null hypothesis that the three samples are from the same population cannot be
rejected at an acceptable confidence level.
Willingness to Pay for Private Connections
5 gourdesStarting Foint
10 gourdes 15 gourdes
Number of observationsMean WTP bid**Standard deviation
F: .06Probability: .94
Null hypothesis that the three samples arerejected at an acceptable confidence level.
416.7 7.48.3 8.8
437.1
11.0
from the same population cannot be
* 5 gourdes = $1 VS
** Mean WTP bid in gourdes per month.
7 gourdes
475.4 6.0 5.73.8 3.9 3.9
48
— 83 —

.
planning for maximum “ability to pay” for public standposts. The mean of WTPbids for private connections, 7.1 gourdes, was not much higher (1.8 percent ofper capita income), but this bid is in addition to the bid for the public 5fountains, which yields a total mean bid for a private connection of 12.8gourdes per month (3.3 percent of per capita income).
The next step In the analysis was to model the variations In the bids forpublic standposts and private connections as a function of the variables thatvere the primary focus of the research design. The value of the WTP bid wastaken as the midpoint of the last interval defined in the bidding game. Tomeasure income an ordlnal measure of the value of household assets wasdeveboped, based on eight questions and observations about the quality ofhousing construction and household possessions (VLTH). This was supplementedwith two other indicators of income: (1) vhether the household receivedremittances from relatives living abroad (FINC); and (2) the occupations ofthe principal members of the household (IOCP). Remittance data were simplytreated In the model as a dummy variable. Occupation data vere used to grouphouseholds into two categories (farmers and nonfarmers) and were alsorepresented by a dummy variable. Education was measured as the sum of theyears of school of up to two adults in the household (HHED). From the villagemap the distance of each household to its drinking water source (DIST) wasmeasured; these distances served as a measure of the cost of obtaIning water Sfrom the existing source, which was treated in the model as the “price” of thecbose substitute of the improved water service. The measure of water qualitywas based on the respondent’s answers to seven questiofls concerning taste,odor, healthfulness, rellabllity, cobor, dirt, and conflict (quarrels) at thesource.
Tables 5 and 6 present the results of ordinary least squares regressions ofthe bids for public standposts and private connections for Laurent on thevariables suggested by consumer demand theory. The F—statIstics illustratethat the overall models for the WTP bids for public standposts and privateconnections are highly significant. The coefficients for all the independentvariables, except sex of the respondent and foreign remittances in the WTP forprivate connections model, have the expected sign. The variables forhousehold vealth, household education, distance from existing water source,and water quality are all statistically significant at the 95 percentconfidence level. The only variables which are not significant are sex ofrespondent and the two dummy variables, foreign remittances and occupation.These results indicate that the WTP bids are not random (more than 30 percentof the variation in WTP bids for private connectIons has been explained by the Sindependent variables), and that the WTP bids are indeed systematicallyrelated to the variables suggested by economie theory. Although the R2’s mayappear bow, they compare very favorably with the resuits of slrnllareross—section studies in the United States (Smith and Desvousges, 1986).
The research team thus concludes from this analysis (1) that the contingent Svaluation methodobogy can be used to devebop estimates of wilbingness to payfor rural water services, at least in Haiti, and (2) that strategie,hypothetical, and starting-point biases do not appear to pose serious threatsto the validity of the results.
S
— 84 —
S

Table 5
Willingness—to-pay Bids for Public Standposts (Laurent)
Dependent variable:
Villingness to pay for public standpost (gourdes*/month)
Independent variable: Coefficient t
Intercept 2.836 1.51
Household wealth Index 0.334 2.974(WLTH)
Household vith foreign income 0.409 0.58(FINC, =1 1f yes)
Occupation index —0.706 —1.14(IOCP = 1 1f primary occupation
is farmer)Household education level 0.369 3.28
(HHED)Distance from existing source 0.003 4.86
(DIST)Quality index of existing source —0.307 -3.16
(QULT = 1 1f respondent isenthusiastic about the qualityof the water)
Sex of respondent —0.091 -0.17(RSEX, =1 if male)
Adjusted R2 0.255F value 8.034Degrees of freedom 137
* S gourdes = $1 VS
— 85 —

S
S
Table 6
Willingness-to-pay Bids for Private Connections (Laurent)
S
Dependent variable:
Willingness to pay for private connections (gourdes*/month)
Independent variable: Coefficient
Intereept —1.468 —0.32
Household vealth index 1.280 4.73(WLTH) S
Household with foreign income —0.654 -0.42(FINC, =1 1f yes)
Occupation index —2.463 —1.69(IOCP = 1 1f primary occupationis farmer)
Household education level 0.986 3.83 5(HHED)
Distance from existing souree 0.003 2.24(DIST)
Quallty index of existing source —0.664 —2.79(OULT = 1 if respondent Isenthusiastie about the qualityof the water)
Sex of respondent 0.307 0.25(RSEX, =1 1f male)
Adjusted R2 0.338F value 10.251Degrees of freedom 120
* 5 gourdes = $1 VS
S
S
— 86 —
S

B.2 ANALYSIS OF THE WTP BIDS IN ST. JEAN Dli SUD
For a variety of reasons, the research team has much less confidence in theresults of the contingent valuatlon survey in St. Jean du Sud than in theresults from Laurent. The water source situation turned Out to be much morecomplex in St. Jean du Sud than was initially anticipated. There were nodear boundaries to the cornmunity or to CARE’s anticipated service area, andthus It was difficult to know a priori vhat the service populatlon would be ifpublic fountains vere Installed along the main street in tovn. During thecourse of the interviews, as the enumerators moved back into the hills awayfrom town, they continually “discovered” small sources (springs) that had beenunknown to them and that were of ten used by only a few househoids. Thisdiversity of water sources and the fact that households collect vater frommultiple sources makes any attempt to explain the variation in WTP bids muchmore problematic than in Laurent.
For example, consider the explanatory variable for distance of the householdfrom the existing water source. In Laurent It was straightforward to measurethis on the village map. In St. Jean du Sud, for those households which usedmultiple sources, it was not dear which source to use. The research teamchose to measure the distance to the cbosest source used, but clearly theunderlying water use behavior is more complex than this procedure wouldindicate. Moreover, in Laurent almost all Individuals traveled overrelatively flat terrain from their homes to existing water sources.
In St. Jean du Sud, hovever, the land was much more rugged, and the measure ofdistance does not take into account elevation changes.
There was a high nonresponse rate in St. Jean du Sud (25 percent for publicstandposts; 65 percent for private connections). The overall mean bid forpublic standposts in St. Jean du Sud was 5.5 gourdes per household per month,96 percent of the value for Laurent. The mean bid for private connections inSt. Jean du Sud vas 5.7 gourdes per month, 80 percent of the value forLaurent. The latter result is consistent with the facts that Laurent is ingeneral a wealthier village than St. Jean du Sud, and that the existing watersituation in Laurent is vorse than in St. Jean du Sud.
Table 7 compares the mean of the bids obtained from the direct question andthe bidding game for both public standposts and private connections. The nullhypothesis that the two samples are from the same population cannot berejected at an acceptable confidence level, but the mean for the bidding gamefor public standposts is over 20 percent hlgher than for the direct question.Tables 8 and 9 present the resuits of the tests for strategie bias andstarting—point bias in St. Jean du Sud for both public standposts and privateconnections. These results are consistent vlth the t indings from Laurent:there is no evidence of either type of bias.
Tables 10 and 11 present the results of ordinary least squares regressions ofthe bids for public standposts and private connections for St. Jean du Sud onthe same explanatory variables reported for Laurent. Both the adjusted R2values and the F-statistics for the two regressions are much bower than thevalues obtained for Laurent. Only one of the explanatory variables issignificant in both regressions: the household wealth index. The sign of thecoefficient on the household education index is in the expected direction, butthe coefficient is not significant. In both regressions the sign of thecoefficient on distance is not in the direction expected.
— 87 —

Table 7
Test for Direct Question and Bidding Game (St. Jean du Sud)
Willingness to Pay for Public Standposts
Direct Question Bidding Game
Total observationsMean WTP bidStandard devlation
Overall meanStandard deviatlont—statisticProbabili ty
5.74.5
Null hypothesis that the two samples are from the same
rejected at an acceptable confidence level.
Willingness to Pay for Private Conneetions
population cannot be
Direct Questlon Bidding Game
Total observationsMean WTP bidStandard deviation
Overall meanStandard deviationt—s tatist ieProbabili ty
112.76.1
5.77.11.570.12
396.57.3
Null hypothesis that the two samples are from the same
rejected at an acceptable confidence level.
- 88 -
population cannot be
S
S
S
274.85.4
79S
5.54.70.850.40
S
S
S
S
S
S
S

Table 8
Test for Strategie Bias (St. Jean du Sud)
Willingness to Pay for Public Standposts
Opening Statement Opening StatementB*
Total observations 65 41Mean WTP bid 5.2 6.0Standard deviatlon 4.4 5.2
Overall mean 5.5Standard deviation 4.7t—statistic 0.91Probability 0.37
Nuli hypothesis that the two samples are from the same population cannot berejected at an acceptable confidenee level.
Willingness to Pay for Private Connections
Opening Statement Opening StatementA* B*
Total observations 31 19Mean WTP bid 5.7 5.6Standard deviation 7.7 6.3
Overall mean 5.7Standard deviation 7.1t—statistie 0.04Probability 0.97
Null hypothesis that the two samples are from the same population cannot berejected at an acceptable confidence level.
* Opening Statements A and B are contained in the household questionnaire inAppendix A.
— 89 —
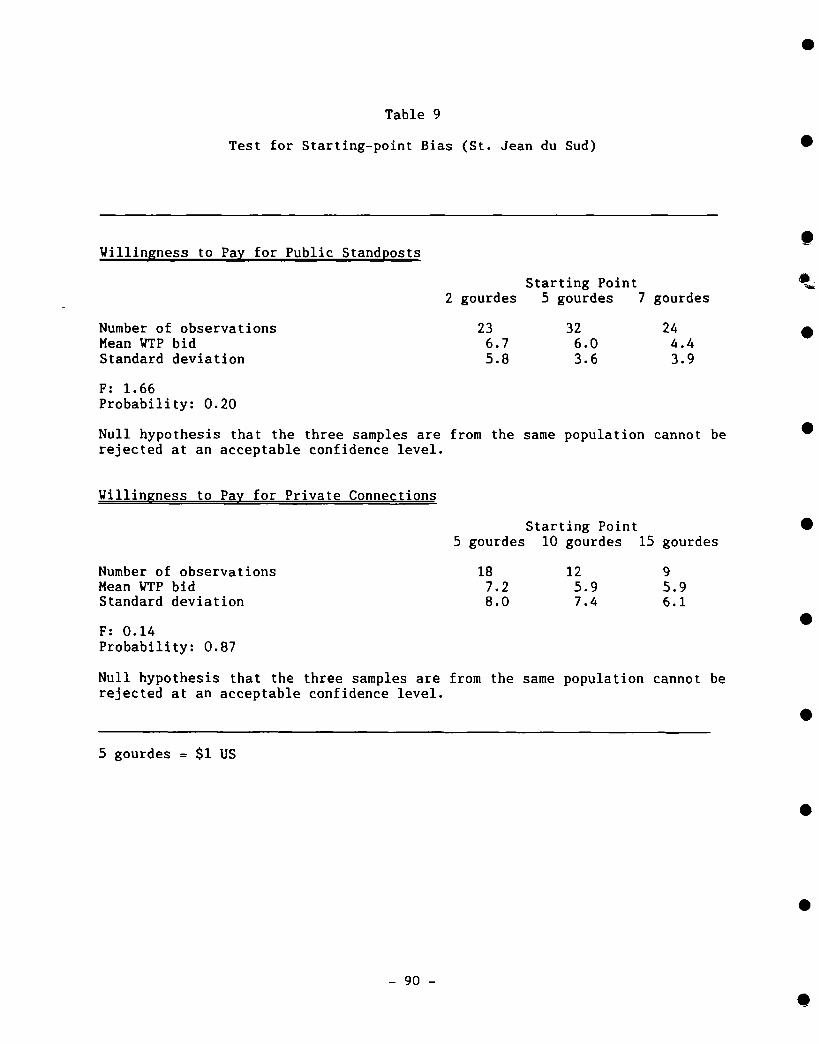
Table 9
Test for Starting-point Bias (St. Jean du Sud)
Wiblingness to Pay for Public Standposts
Number of observations 23Mean WTP bidStandard deviation
F: 1.66Probability: 0.20
Starting Point2 gourdes 5 gourdes 7 gourdes
6.732
6.024
4.45.8 3.6 3.9
Null hypothesis that the three samples are from the same population cannot be
rejected at an acceptable confidence level.
Willingness to Pay for Private Connections
Starting Point5 gourdes 10 gourdes 15 gourdes
Number of observationsMean WTP bidStandard deviatlon
F: 0.14Probability: 0.87
Nuli hypothesis that the three samples are fromrejected at an acceptable confidence level.
the same population cannot be
5 gourdes = $1 IJS
— 90 -
S
S
S
S
S
0~
S
S
18 12 97.2 5.9 S.98.0 7.4 6.1
S
S
S

Table 10
Willingness-to-pay Bids for Public Standposts (St. Jean du Sud)
Dependent variable:
Willingness to pay for public standpost (gourdes*/month)
Independent variable: Coefficient t
Intercept -1.71 —0.80Household wealth index 0.37 2.69
(WLTH)Household with foreign ineome 1.20 0.88
(FINC, =1 if yes)Oceupation index —0.125 -0.14
(IOCP = 1 if primary occupationis farmer)
Household education level 0.192 1.02(HHED)
Distance from existing source 0.02 1.72(DI ST)
Quality index of existing source 0.29 1.79(QULT = 1 if the respondent Isenthusiastic about the qualityof the water)
Sex of respondent 0.68 0.72(RSEX, =1 1f male)
Adjusted R2 0.09F value 2.50Degrees of freedom 98
* 5 gourdes = $1 VS
— 91 —

S
S
Table 11
Willingness—to-pay Bids for Private Connections (St. Jean du Sud)
S
Dependent variable:
Willingness to pay for private connections (gourdes*/month)
Independent variable: Coefficient t
Intercept 0.35 0.10
Household wealth index 0.60 2.11(WLTH)
Household with foreign income —3.40 —1.12(FINC, =1 1f yes)
Oecupation index 1.65 0.78(IOCP = 1 1f primary occupationis farmer)
Household education level 0.25 0.57(HHED)
Distanee from existing souree 0.001 0.30(DIST) S
Quality index of existing source -1.09 —0.50(QVLT = 1 if the respondent isenthusiastic about the qualityof the water)
Sex of respondent —1.19 —0.54(RSEX, =1 if male)
Adjusted R2 0.02F value 1.14Degrees of freedom 42
S
* S gourdes = $1 VS
S
S
— 92 —
S

This analysis of the WTP bids for St. Jean du Sud adds a note of caution aboutvhether the contingent valuation methodobogy yields reliable results which aresystematically related to the factors suggested by consumer demand theory.Hovever, the poor quality of the results for St. Jean du Sud in comparison toLaurent is more likely to be related to the different question formats andimplementatlon diffieulties (i.e., the complex water sources situation and therugged terrain) than to any generic problems vith the methodology itself.
— 93 —

S
1 S
S
S-
S
t
S-


S
FSSW nam~t fl7 ~ kI&.,L.TâTI~je~Iiiu~na weiw w w w
S
S
S
S”
S
S
S
S