iteman - assessment systems corporation manual 5 data matrix file: fixed-width the fixed-width...
TRANSCRIPT

User Manual Classical Item and Test Analysis
Version 4.4
April 2017
WE MAKE ASSESSMENTS SMARTER, FASTER, AND FAIRER
Iteman

Contact Information Assessment Systems Corporation
125 Main Street SE
Minneapolis, MN. 55414
763.476.4764
www.assess.com
License Unless you have purchased multiple licenses for Iteman 4.4, your license is a single-
user license.
Technical Assistance and support If you need technical assistance using Iteman 4.4, please contact
[email protected]. , Please provide us with the invoice number for your license
purchase when you request technical assistance.
Citation Assessment Systems Corporation (2017). User Manual for Iteman 4.4. Minneapolis,
MN: Author.
No part of this publication may be reproduced, stored in a retrieval system, or
transmitted in any form or by any means—electronic, mechanical, photocopying,
recording, or otherwise—without the prior written consent of the publisher.
Copyright © 2017 by Assessment Systems Corporation
All Rights Reserved
Iteman is the trademark of Assessment Systems Corporation

Table of Contents
1. Introduction .............................................................................................................................. 1
Your Iteman 4 License and Unlocking Your Copy ........................................................... 2
2. Input Files and File Menu .................................................................................................... 4
The Data Matrix File ........................................................................................................ 4
Data Matrix File: Delimited ......................................................................................... 4
Data Matrix File: Fixed-Width ..................................................................................... 5
Data Matrix File: Iteman 3 Data Format ..................................................................... 5
The Item Control File ...................................................................................................... 6
File Menu ........................................................................................................................ 7
3. Running the Program ........................................................................................................... 9
The Files Tab ................................................................................................................... 9
The Input Format Tab ................................................................................................... 10
Differential Item Functioning (DIF) ........................................................................... 12
The Scoring Options Tab ............................................................................................... 12
The Output Options Tab ............................................................................................... 14
Using Multiple Runs Files .............................................................................................. 16
Creating a Multiple Runs File .................................................................................... 16
Opening a Multiple Runs File .................................................................................... 18
A Sample MRF File .................................................................................................... 19
Getting Started: Running the sample files .................................................................... 19
4. What’s in the Report? .......................................................................................................... 21
Output: Introduction Section ........................................................................................ 21
Test-Level Output: Summary Statistics ......................................................................... 21
Test-Level Output: Reliability Analysis.......................................................................... 22
Test-Level Output: Graphics ......................................................................................... 23
Test-Level Output: Conditional Standard Error of Measurement ................................ 24
Item-Level Output ......................................................................................................... 24
5. How do I interpret the output? ........................................................................................ 30
Item Difficulty ............................................................................................................... 30
The P value (Multiple Choice) ................................................................................... 30
The Item Mean (Polytomous) ................................................................................... 30
Item Discrimination ...................................................................................................... 31
Multiple Choice Items ............................................................................................... 31
Polytomous Items ..................................................................................................... 31

DIF Statistics .................................................................................................................. 32
Option statistics ............................................................................................................ 33
Scores Output File ......................................................................................................... 33
Collusion Index (Bellezza & Bellezza, 1989) .................................................................. 35
References ................................................................................................................................. 36
Appendix A: The Iteman 3 Header ....................................................................................... 37
The Control Line ............................................................................................................ 37
The Keyed Responses ................................................................................................... 38
The Number of Alternatives ......................................................................................... 38
The Scale Inclusion Codes ............................................................................................. 39
Appendix B: Troubleshooting ............................................................................................... 40
Please check the data file format specifications .......................................................... 40
Please check the number of items or number of ID columns specified in the Iteman 3
Header........................................................................................................................... 40
Please select an input file with an Iteman 3 Header .................................................... 40
Valid item responses of 0 were identified. The Iteman 3 Header does not support
item responses that begin at 0. .................................................................................... 41
At least one valid item response of 0 was identified. .................................................. 41
At least one unidentified response character was identified and will be scored as
incorrect. ....................................................................................................................... 41
Check the data matrix file, examinee XXX did not respond to all XXX items ............... 42
Appendix C: Formulas ............................................................................................................. 43
Conditional Standard Error of Measurement Formulas ............................................... 43
Livingston Classification Consistency Index .................................................................. 43
Differential Item Functioning ........................................................................................ 43
Item Collusion Index ..................................................................................................... 44
Appendix D: Program Defaults File ..................................................................................... 46

Iteman Manual 1
1. Introduction
Iteman™ is a Windows® application designed to provide detailed item and test analysis
reports using classical test theory (CTT). The purpose of these reports is to help testing
programs evaluate and improve the quality of test items by examining their psychometric
characteristics.
Iteman has a friendly graphical user interface (GUI) that makes it easy to run the program,
even if you are not familiar with psychometrics. The GUI is organized into five tabs:
Settings, Files, Input Format, Scoring Options, and Output Options. These are discussed in
detail in Chapter 3: Running the Program.
Iteman 4.4 offers several substantial advantages over Iteman 3, which was available
approximately 1995-2010:
1. The most important advantage is the addition of graphics. It is now possible to
produce an item quantile plot for each item. Moreover, you control the number of
points in the plot. Additional graphics are also produced.
2. Iteman 4 is able to handle pretest (trial or unscored) items—items that are not
included in the final score but for which statistics are still desired.
3. More statistics are calculated, including the alpha (KR-20) reliability coefficient with
each item deleted, several split-half reliability coefficients (both with and without
Spearman-Brown correction), conditional standard error of measurement, and
subgroup P (proportion correct) statistics for up to seven ordered groups.
4. Instead of simple ASCII text files, the output is now automatically assembled as a
formal report document, which saves the menial copy-and-paste typically done to
draft a report. Results are also in a comma-separated value (CSV) format that is able
to be manipulated (sorted, highlighted, etc.) in spreadsheet software. It additionally
produces a CSV file of examinee scores.
5. Scaled scores and subscores can calculated.
6. Scores can be classified into two groups at a specified cut score, and the two
groups can use your labels, such as Pass and Fail.
7. Items can be analyzed relative to an external score rather than the total score on a
test.
8. The maximum number of items that can be analyzed has been increased to 10,000.
9. A “batch” type of capability, using a “Multiple Runs File” has, been added to allow
you to run multiple data sets without having to use the graphic user interface for

Iteman Manual 2
each run. Multiple Runs files can be created outside Iteman in a text editor or
interactively within Iteman.
Your Iteman 4 License and Unlocking Your Copy Unless you have purchased a network or multiple-computer license, your license for
Iteman 4 is a single-user license. If you would like to use Iteman 4 on a network or by more
than one user, please contact us to arrange for the appropriate number of additional
licenses.
Iteman 4 is downloadable as a demonstration version. It is limited to no more than 100
items and 100 examinees, but has no expiration date. We can permanently convert your
demo copy to the fully functioning software by email, phone, or fax once you have
completed the license purchase. To purchase, visit the www.assess.com/iteman.
To unlock Iteman 4, please email [email protected] with:
1. Your name and email address.
2. Your organization or affiliation.
3. Your invoice number (in the top right corner of your invoice). You should make
a record of your invoice number since you might be asked for it if you request
technical support.
4. The App ID. You can copy it from the screen below or click the Request a
License Key button to automatically open an email message. Click CLOSE to
proceed using the demo version.
Iteman Manual 3
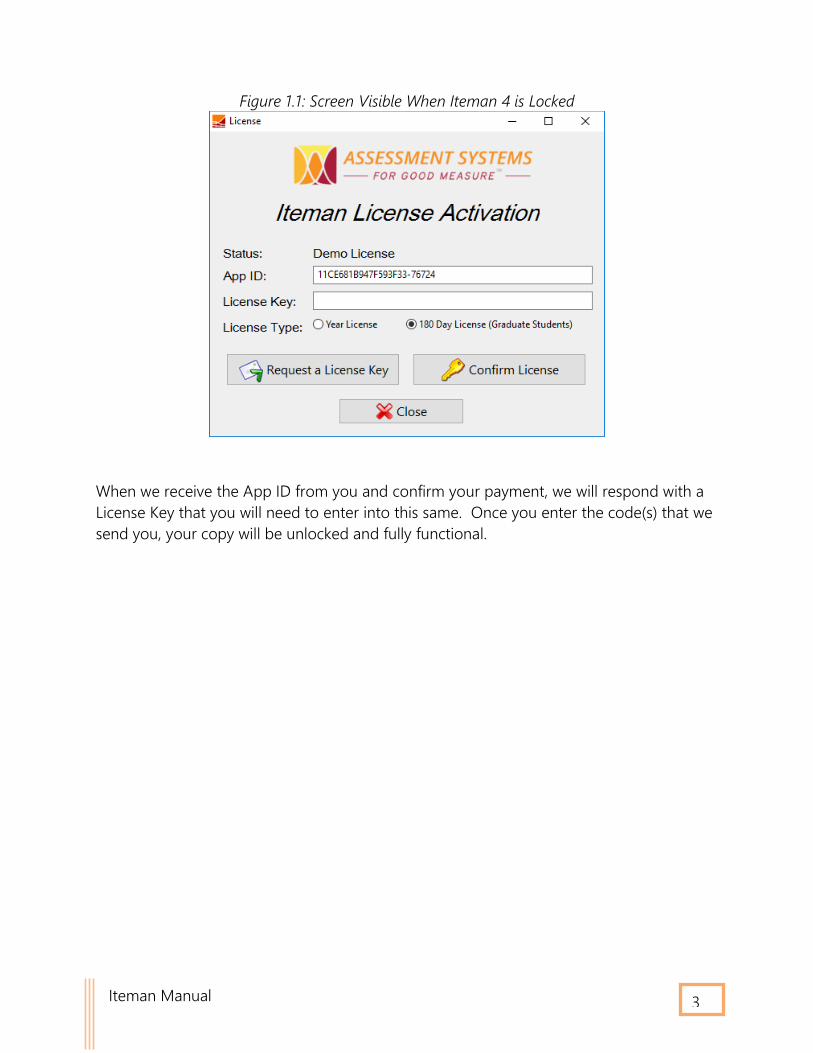
Figure 1.1: Screen Visible When Iteman 4 is Locked
When we receive the App ID from you and confirm your payment, we will respond with a
License Key that you will need to enter into this same. Once you enter the code(s) that we
send you, your copy will be unlocked and fully functional.
Iteman Manual 4
2. Input Files and File Menu
Iteman 4 requires two input files: the Data Matrix File and an Item Control File. The formats
for these files are described in the following sections. The approach is inspired by statistical
analysis software, which often has a Variables tab and a Data tab.
The Data Matrix File The Data Matrix File is the file that contains examinee identification (ID) or name, and the
responses to each item. Responses can be alphabetical (A,B,C,D… or a,b,c,d…) or
numerical (1,2,3,4…), where A = a = 1, etc. It follows the standard approach of rows being
people and columns being items or observations. Iteman accepts 3 formats: delimited,
fixed-width, and Iteman 3.
Data Matrix File: Delimited
Iteman 4 permits the use of a data matrix file that is delimited by either a comma or a tab.
The comma separated value (.csv) approach is often the easiest to work with because you
can edit the files in standard spreadsheet software. As shown in Figure 2.1, this now
permits the inclusion of variable length examinee IDs. Chapter 3: Running the Program
describes how to specify a delimited input file.
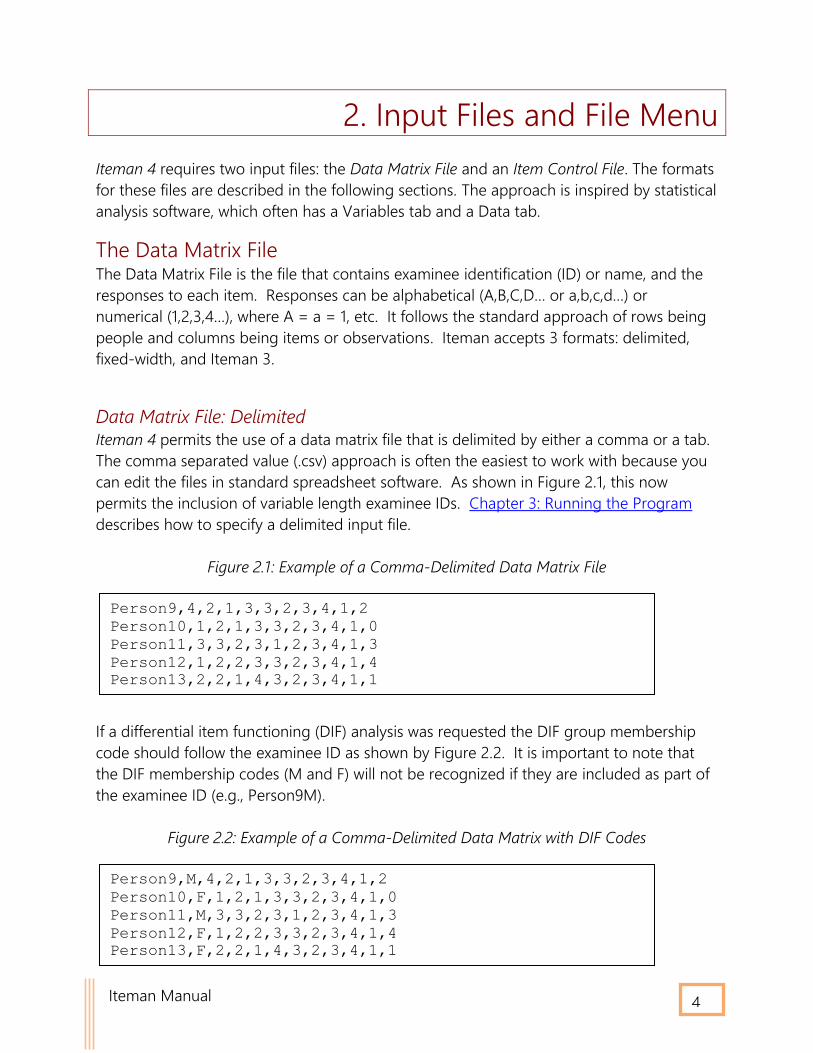
Figure 2.1: Example of a Comma-Delimited Data Matrix File
If a differential item functioning (DIF) analysis was requested the DIF group membership
code should follow the examinee ID as shown by Figure 2.2. It is important to note that
the DIF membership codes (M and F) will not be recognized if they are included as part of
the examinee ID (e.g., Person9M).
Figure 2.2: Example of a Comma-Delimited Data Matrix with DIF Codes
Person9,4,2,1,3,3,2,3,4,1,2
Person10,1,2,1,3,3,2,3,4,1,0
Person11,3,3,2,3,1,2,3,4,1,3
Person12,1,2,2,3,3,2,3,4,1,4
Person13,2,2,1,4,3,2,3,4,1,1
Person9,M,4,2,1,3,3,2,3,4,1,2
Person10,F,1,2,1,3,3,2,3,4,1,0
Person11,M,3,3,2,3,1,2,3,4,1,3
Person12,F,1,2,2,3,3,2,3,4,1,4
Person13,F,2,2,1,4,3,2,3,4,1,1

Iteman Manual 5
Data Matrix File: Fixed-Width
The Fixed-Width approach is a text file where all columns must be aligned exactly. This
hearkens back to the days of DOS. It still has the advantage of being able to store data far
more efficiently than a CSV file or Microsoft Excel spreadsheet.
An example of this is shown in Figure 2.3 for 10 items and 5 examinees. In this file, there
are 9 columns of ID (the last two are blank) and 10 columns of responses.
Figure 2.3: Example of an Input Data File (No Ignored Columns)
Additional columns can be ignored, so it is not necessary to delete any data if your data
file has information other than ID and responses. For example, your file might contain
exam dates, locations, education level, or sensitive personal data that you do not want
included in the output. An example of this is shown in Figure 2.4; you might want to
include examinee ID numbers (the first six columns) in your output but not names.
Chapter 3: Running the Program describes how to skip these columns.
Figure 2.4: Example of an Input Data File (Columns to Ignore)
Data Matrix File: Iteman 3 Data Format Iteman 4 permits the analysis of a Data Matrix File in the format used with Iteman 3 (and
other programs in the 1990s Item and Test Analysis package) , which includes four header
lines of control information in the data file rather than in a separate control file. If the
Iteman 3 header is included in the Data Matrix File, then the user should specify this with
the checkbox on the “Files” tab of Iteman 4. This approach has the advantage of using
only one input file, but the disadvantage that it does not include Item IDs or domains. See
Appendix A for a description of the Iteman 3 header.
Person1 4213323412
Person2 1213323410
Person3 3323123413
Person4 1223323414
Person5 2214323411
6153425 John Doe M 4213323412
5947824 Jane Doe F 1213323410
5976281 Jack Hall M 3323123413
1359687 Jim Hill M 1223323414
9778236 Jen Smith F 2214323411

Iteman Manual 6
The Item Control File The previous version of Iteman required that the specifications for the test be provided on
the first four lines of the data file, with all the data itself moved down to line 5. Iteman 4
provides the specifications as a separate Item Control File. This makes it easier to produce,
as well as allows for the handling of a greater amount of information. This file is tab-
delimited or comma-delimited, which means that you can construct it in a spreadsheet
program and then “Save As” a tab-delimited text file or CSV.
There are six columns of information in the control file for each item. Begin each item on a
new line.
1. Item ID: cannot contain a tab character, but length can vary across items.
2. Key(s):
Correct answer(s) as A,B,C,D or 1,2,3,4 for standard multiple choice
questions. Multiple correct answers should be entered without a comma.
Example: AB
1 if items are scored dichotomous.
For polytomous items: + if positively scored or – if negatively or reverse
scored.
3. Number of alternatives (maximum is 15). For multiple-choice data that are
already scored (converted to 0 or 1), the number of options is 2. However, we
recommend recoding so that 1=correct and 2=incorrect, as starting at 0 is
typically reserved for partial credit items.
4. Domain or content area (unique domain label, maximum is 50).
5. Inclusion status:
Y = Yes (included in the analysis)
N = No (not included)
P = Pretest
6. Item type:
M = Multiple-choice items with responses that begin at 1 or A. For scored
multiple-choice data (0/1), see P below.
R = Rating scale items: polytomous items with responses that begin at 1 or
A).
P = Partial credit items with numeric responses that begin at 0 (e.g., 0, 1, 2,
3). This includes multiple-category partial credit items, and dichotomously
scored multiple-choice items (scored 0 or 1).
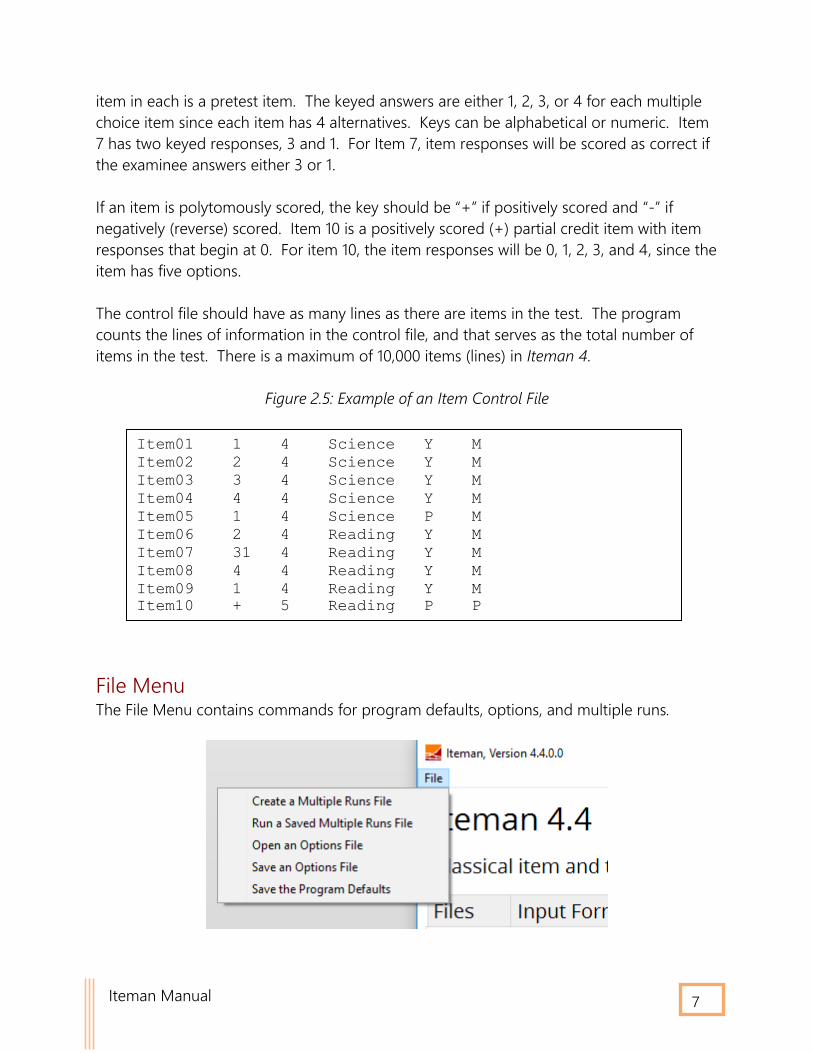
An example of the control file is shown in Figure 2.5. There are ten items, with nine
multiple choice items and one partial credit item. The first five are in Domain 1, while the
latter five are in Domain 2. The first four items in each domain are scored, while the fifth
Iteman Manual 7
item in each is a pretest item. The keyed answers are either 1, 2, 3, or 4 for each multiple
choice item since each item has 4 alternatives. Keys can be alphabetical or numeric. Item
7 has two keyed responses, 3 and 1. For Item 7, item responses will be scored as correct if
the examinee answers either 3 or 1.
If an item is polytomously scored, the key should be “+” if positively scored and “-” if
negatively (reverse) scored. Item 10 is a positively scored (+) partial credit item with item
responses that begin at 0. For item 10, the item responses will be 0, 1, 2, 3, and 4, since the
item has five options.
The control file should have as many lines as there are items in the test. The program
counts the lines of information in the control file, and that serves as the total number of
items in the test. There is a maximum of 10,000 items (lines) in Iteman 4.
Figure 2.5: Example of an Item Control File
File Menu The File Menu contains commands for program defaults, options, and multiple runs.
Item01 1 4 Science Y M
Item02 2 4 Science Y M
Item03 3 4 Science Y M
Item04 4 4 Science Y M
Item05 1 4 Science P M
Item06 2 4 Reading Y M
Item07 31 4 Reading Y M
Item08 4 4 Reading Y M
Item09 1 4 Reading Y M
Item10 + 5 Reading P P

Iteman Manual 8
Create/Run Multiple Runs File
If you would like to interactively create a Multiple Runs File (MRF) you can do so by clicking
opening the File menu and selecting Create a Multiple Runs File. In addition, you can run
a previously saved MRF by clicking “Run a Saved Multiple Runs File”.
Open an Options Files
This open allows you to open a previously saved Options File. The selected Options File
will automatically override the current program defaults when opened. The Options File is
equivalent to a Program Defaults file, and contains the options requested in the user
interface.
Save an Options File
To save the current GUI settings to an external file of your choice, you can do so by
selecting that option on the Files menu. The Options File is necessary for a Multiple Runs
File where the program settings are read in from an external file and not selected using the
GUI.
Save the Program Defaults
This will overwrite the existing program defaults with the changes made during the current
run of the program. These changes will appear the next time the program is loaded. For
more information on the Program Defaults File see Appendix D.

Iteman Manual 9
3. Running the Program
Iteman’s interface is divided into four tabs.
The Files tab specifies the files to be used: Data Matrix, Item Control, Output, and an
optional external score file.
The Input Format tab tells Iteman what to expect in your input. For fixed-width, it
specifies the columns of the Data Matrix File for IDs and item responses and permits
you to specify the character code used in the Data Matrix to indicate
omitted/skipped and not administered items. In addition, this tab is where you can
request and set up a DIF analysis.
The Scoring Options tab enables you to perform scaled scoring and to perform
dichotomous classification.
The Output Options tab specifies options for the output.
The Files Tab
To specify the files on the Files tab (Figure 3.1), click on the speed button
for each file. This will activate a standard dialog window to specify the path and name of
each file.
If the Data Matrix File has an Iteman 3 (ITAP) header, be sure to check this box:
The Item Control file box will be disabled when the Iteman 3 Header box is checked, as will
the options on the Input Format tab.
Name your output file in the third box. The output file must have a .docx extension.
The fourth box allows you to name your Run. This will appear on the title page of the
report output.
The final box is used if you have a file containing examinee scores that have been
produced by some method other than number-correct that you wish to use as the basis
for your statistics (for example, a scaled score reported by your testing vendor). The
scores in this file, one line per examinee, must be in the same order as those in the
examinee data file.

Iteman Manual 10
Figure 3.1: The Files Tab
The Input Format Tab The Input Format tab (Figure 3.2) tells Iteman what to expect in your data file. First, select
your approach: Fixed Width or Delimited.
If you are using the fixed width approach, specify the number of columns devoted to
examinee ID information that you want to capture for your score output, then specify the
column in which the IDs begin. Next, specify the column in which item responses begin.
This column number can be increased to skip unwanted columns.

Iteman Manual 11
Figure 3.2: The Input Format Tab
If the Data Matrix File is delimited, specify so by clicking on the “Data matrix is delimited by
a:” checkbox. Next specify whether the data file is delimited by a tab character or a
comma. Selecting that the data matrix file is delimited will disable the “Data matrix file
includes an Iteman 3 Header” box and the three fixed width column boxes. If the delimited
response matrix does not include examinee ID in the first column, make sure that the
“Response matrix includes examinee ID” box is not checked.
If you have a special character in your data representing omitted/skipped responses or
not-administered items, these are specified next. These responses will be treated
separately, with frequencies provided in the output. If all items were answered by all
examinees, you can leave these characters as the default value, and of course no
examinees will be noted as having such characters. Empty cells are treated as omits by
default.
Iteman Manual 12
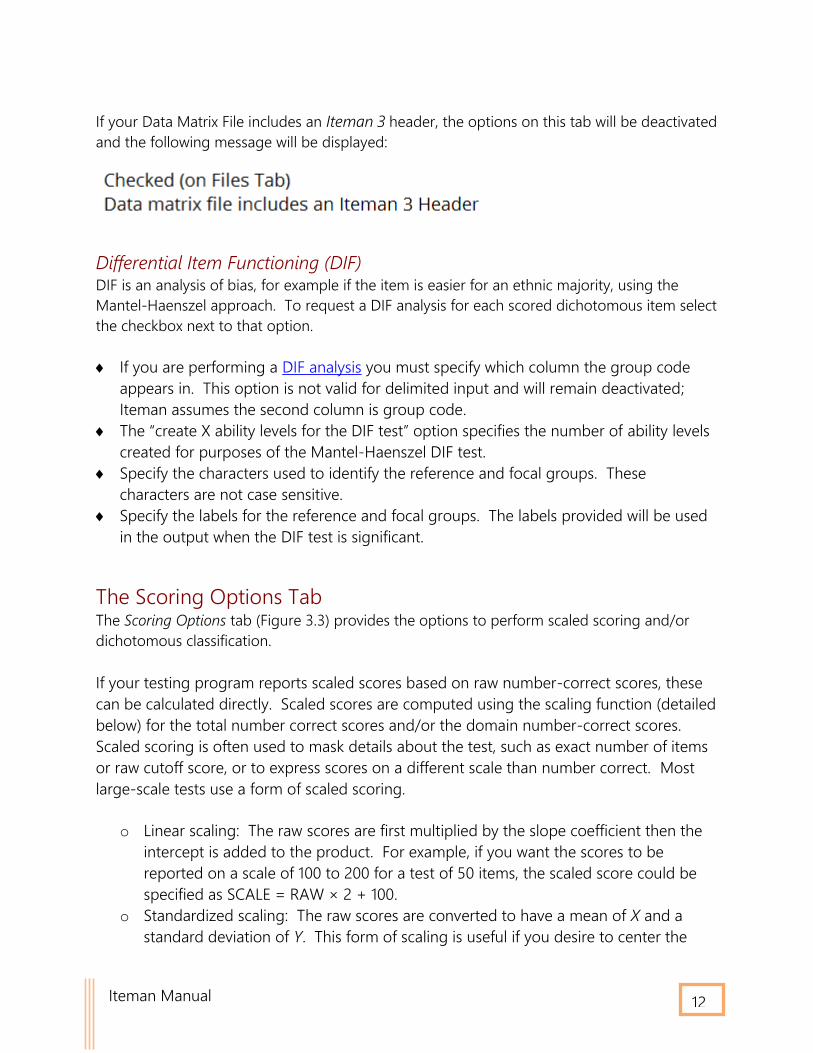
If your Data Matrix File includes an Iteman 3 header, the options on this tab will be deactivated
and the following message will be displayed:
Differential Item Functioning (DIF) DIF is an analysis of bias, for example if the item is easier for an ethnic majority, using the
Mantel-Haenszel approach. To request a DIF analysis for each scored dichotomous item select
the checkbox next to that option.
If you are performing a DIF analysis you must specify which column the group code
appears in. This option is not valid for delimited input and will remain deactivated;
Iteman assumes the second column is group code.
The “create X ability levels for the DIF test” option specifies the number of ability levels
created for purposes of the Mantel-Haenszel DIF test.
Specify the characters used to identify the reference and focal groups. These
characters are not case sensitive.
Specify the labels for the reference and focal groups. The labels provided will be used
in the output when the DIF test is significant.
The Scoring Options Tab The Scoring Options tab (Figure 3.3) provides the options to perform scaled scoring and/or
dichotomous classification.
If your testing program reports scaled scores based on raw number-correct scores, these
can be calculated directly. Scaled scores are computed using the scaling function (detailed
below) for the total number correct scores and/or the domain number-correct scores.
Scaled scoring is often used to mask details about the test, such as exact number of items
or raw cutoff score, or to express scores on a different scale than number correct. Most
large-scale tests use a form of scaled scoring.
o Linear scaling: The raw scores are first multiplied by the slope coefficient then the
intercept is added to the product. For example, if you want the scores to be
reported on a scale of 100 to 200 for a test of 50 items, the scaled score could be
specified as SCALE = RAW × 2 + 100.
o Standardized scaling: The raw scores are converted to have a mean of X and a
standard deviation of Y. This form of scaling is useful if you desire to center the

Iteman Manual 13
mean of the test around a constant value for use in a report. For example, the
classic IQ scale with mean=100 and SD=15.
Figure 3.3: The Scoring Options Tab
If you want to perform dichotomous classification of examinees, such as pass/fail, click the
box next to that statement. It is possible to classify based on either total number-correct
or the scaled total number-correct scores.
o Cutscore: The cutscore, aka passing score or cutpoint, is the value at which scores
are classified as in the high group. Scores below the cutscore are classified as being
in the low group.
o Low group label: Label used in the Scores output file for those in the low group.
o High group label: Label used in the Scores output file for those in the high group.
Iteman Manual 14
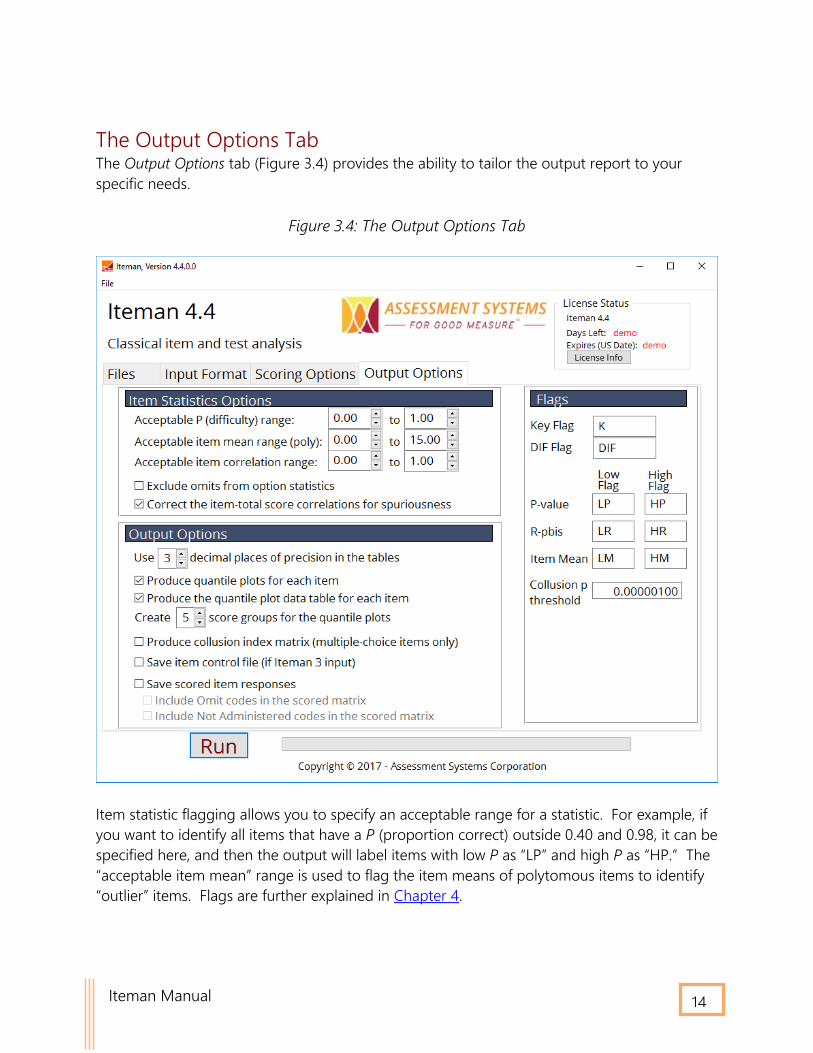
The Output Options Tab The Output Options tab (Figure 3.4) provides the ability to tailor the output report to your
specific needs.
Figure 3.4: The Output Options Tab
Item statistic flagging allows you to specify an acceptable range for a statistic. For example, if
you want to identify all items that have a P (proportion correct) outside 0.40 and 0.98, it can be
specified here, and then the output will label items with low P as “LP” and high P as “HP.” The
“acceptable item mean” range is used to flag the item means of polytomous items to identify
“outlier” items. Flags are further explained in Chapter 4.

Iteman Manual 15
Selecting the “Exclude omits from option statistics” box will prevent omits from having the full
complement of option statistics computed for them. The default of scoring omits as incorrect
affects the reliability coefficients, and provides the full complement of option statistics for
omits. For polytomous items, omits are automatically excluded from the option statistics.
If you want to have the point-biserial and biserial correlations corrected for spuriousness,
click the check box next to that statement. Spuriousness refers to the fact that an item’s
scores are included in the total score, so correlating an item with the total score implies
that it is being correlated with itself to some extent. This effect is negligible if there are a
large number of items on the test (e.g., more than 30), but Iteman 4 provides the option to
correct for this issue, which should be utilized for tests of 30 items or less.
Produce quantile plots for each item is one of the most important options in the interface.
Checking this will produce a graphical plot of the specified number of subgroups (up to 7)
for each item; interpretation of these plots is discussed in Chapter 4: Interpretation of the
Output. The quantile plot will be produced for only the first 9 alternatives for an item.
Click the check box for this option if you wish to produce quantile plots for each item, with
every page of the output containing the plot and the statistics table for a given item.
Produce the quantile plot data table will provide a table for each item that contains the
proportions in each subgroup that are shown graphically in the quantile plot. The quantile
plot data table will present the subgroup proportions for up to 15 alternatives plus the
omit and not administered codes.
Create X groups for the quantile plots allows you to increase or decrease the number X of
examinee groups used for constructing the quantile plots. This number can range from 2
to 7. Larger numbers of points are recommended only for large sample sizes of at least
1,000 examinees.
Produce collusion index matrix (multiple-choice item only) will provide a data forensics
(cheating) analysis using the response similarity approach of Bellezza and Bellezza (1989).
The full matrix is saved in a separate BBO-matrix.csv file. The analysis involves
comparisons between all possible pairs of examinees to see if their responses might be
similar. Pairs of responses are considered as “suspect” i.e., flagged, if the index value is
below the threshold you specify on the right. This should be very low, such as 0.000001, as
this approach can easily produce false positives, especially without a correction like
Bonferroni. Iteman produces the response similarity analysis only for scored multiple-
choice items.
If you need to convert multiple-choice (ABCD) data into dichotomously-scored (0/1) data,
Iteman 4 provides an option for this.

Iteman Manual 16
Save item control file (if Iteman 3 input) will create a Control File for you in the Iteman 4
format. The control file will also be saved with the same name as the output file, but with
‘Control.txt’ appended to the end of the filename.
Include omit codes in the data matrix and Include not administered codes in the data
matrix determines whether omit/not administered codes are kept in the scored matrix or
scored as incorrect (0). Omit/not administered codes are automatically left in the data
matrix for polytomous items.
The Flags panel on the right allows you to specify the text you want to use for key flag, low
and high flags for P-value, point-biserial correlation, item mean, and DIF flag. For
example, you might want to change LP (low P) to LowDiff.
Using Multiple Runs Files
Creating a Multiple Runs File
If you would like to perform multiple item analyses with a single run of the program, then
you should create a Multiple Runs File (MRF). For example, if you work with school
assessments and at the end of the year you are presented with 80 different tests to analyze
but they are all formatted similarly, you can run Iteman once rather than 80 times.
To interactively create an MRF, select the “Create a multiple runs file” button on the
Settings tab. This will open the window shown in Figure 3.5 that allows the interactive setup
of the multiple runs file. Note that the options are grayed out because no path has been
selected. This interactive window contains the MRF text editor window which shows the
files/options selected for the multiple runs file.
To create an MRF:
1. Select the folder where the files used for the analysis are stored. Click “Add Path” to
add the Path to the MRF. (You must complete steps 2, 3, and 4 to perform an
analysis.)
2. Select the Options File:
a. If you saved the program options to an external file, open this file and select
“Add Options”. The Options file will be added to the MRF.
b. If you wish to use the program defaults, select “Use Defaults.” The Keyword
“DEFAULTS” will appear in the MRF text editor next to OPTS.
3. Select the item control file (the data file(s) must follow the item control keyword):

Iteman Manual 17
a. If you are using an Item Control File, use the file open icon to select the then
select “Add Control”. The name of the control file will appear in the MRF box
next to CTRL.
b. If the data matrix includes an Iteman 3 Header then select the “Skip Control”
box. A blank space will appear next to the CTRL statement in the MRF box.
4. Select the data file(s) and click “Add Data”.
Figure 3.5: The Multiple Runs File Window
Note that if you enter a file name that does not exist in the selected folder, and select
“Add”, the program will not add the file to the MRF. It is important to note that the
options*, control**, and data files for a specific analysis all must reside within the same
folder.
*Unless the defaults are used
**Unless an Iteman 3 Header is used

Iteman Manual 18
You may delete entries in the MRF text editor by clicking on the line and hitting “Delete” or
“Backspace”. However the following file sequence must be observed for the MRF to work
correctly:
1. The first PATH keyword must be followed by the OPTS, CTRL, and DATA lines
2. If you wish to use a different OPTS file, that file must appear after the PATH
statement.
3. The CTRL statement must be followed by the DATA line(s).
To Save the text in the MRF editor box to an external file, select the “Save MRF” button.
This will allow you to save the MRF to a folder of your choosing.
An example of a completed MRF file is shown below.
To Run the MRF select the “RUN MRF” box. Note that the text in the MRF editor box will
automatically be saved to an external file when you run the MRF. The saved MRF text file
will have the word ‘MRF’ appended to the end of the filename of the last selected data file.
The following output files will be generated for each DATA file in the MRF
1. DATA.rtf The main rich text output file that includes the graphics and tables
2. DATA.csv The comma-separated values output file
3. DATA Scores.csv The scores saved as a comma-separated values file
The following output files are optional and will be generated for each DATA file in the MRF
if requested in the Options File:
4. DATA Matrix.txt The scored data matrix file
5. DATA Control.txt The item control file if the original data matrix file used an Iteman
3 Header and a scored data matrix was requested
Opening a Multiple Runs File A previously saved multiple runs file can be opened using the File menu. To do so select the
file and click “Open.” Iteman 4 will automatically run the opened multiple runs file. The file
can be one saved from the interactive window described above or one created in a text editor.
The format of the MRF file is as follows:
1. Keyword “PATH” separated by a tab followed by the Windows path
2. Keyword “OPTS” separated by a tab followed by the options file name (if an external
options file is used) or DEFAULTS if the program defaults are to be used
3. Keyword “CTRL” separated by a tab followed by the item control file name (if an item
control file is used) or Iteman 3 if the data matrix includes an Iteman 3 Header.
4. Keyword “DATA” separated by a tab followed by the data file name.
Iteman Manual 19
MRFs may also be created or edited in a test editor. They must, however, be saved as pure
text (not word professing) files.
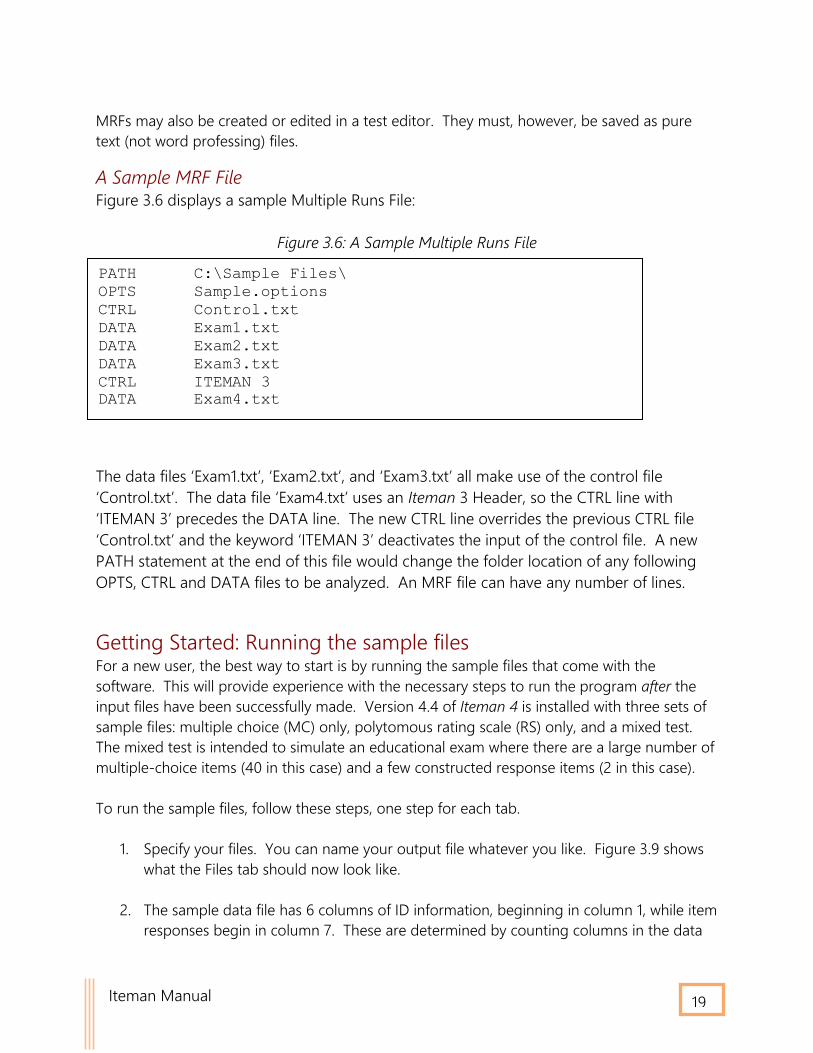
A Sample MRF File Figure 3.6 displays a sample Multiple Runs File:
Figure 3.6: A Sample Multiple Runs File
The data files ‘Exam1.txt’, ‘Exam2.txt’, and ‘Exam3.txt’ all make use of the control file
‘Control.txt’. The data file ‘Exam4.txt’ uses an Iteman 3 Header, so the CTRL line with
‘ITEMAN 3’ precedes the DATA line. The new CTRL line overrides the previous CTRL file
‘Control.txt’ and the keyword ‘ITEMAN 3’ deactivates the input of the control file. A new
PATH statement at the end of this file would change the folder location of any following
OPTS, CTRL and DATA files to be analyzed. An MRF file can have any number of lines.
Getting Started: Running the sample files For a new user, the best way to start is by running the sample files that come with the
software. This will provide experience with the necessary steps to run the program after the
input files have been successfully made. Version 4.4 of Iteman 4 is installed with three sets of
sample files: multiple choice (MC) only, polytomous rating scale (RS) only, and a mixed test.
The mixed test is intended to simulate an educational exam where there are a large number of
multiple-choice items (40 in this case) and a few constructed response items (2 in this case).
To run the sample files, follow these steps, one step for each tab.
1. Specify your files. You can name your output file whatever you like. Figure 3.9 shows
what the Files tab should now look like.
2. The sample data file has 6 columns of ID information, beginning in column 1, while item
responses begin in column 7. These are determined by counting columns in the data
PATH C:\Sample Files\
OPTS Sample.options
CTRL Control.txt
DATA Exam1.txt
DATA Exam2.txt
DATA Exam3.txt
CTRL ITEMAN 3
DATA Exam4.txt

Iteman Manual 20
file (advanced text editors can count this for you, such as Notepad++). Specify these
numbers on the Input Format Tab. There is no missing data in the sample file, so you
do not have to be concerned with the Omit or Not Administered characters.
3. Specify any Scoring Options and Output Options you wish. The program will run
successfully if you do not make any changes on the third and fourth tabs.
Once the program has successfully run, you will be shown a message to tell you that the run is
complete, and where to find the output file. Clicking “Yes” will open the relevant directory.
Iteman Manual 21
4. What’s in the Report?
Iteman 4 provides three default output files: (1) a DOCX report, (2) a CSV file of item
statistics and (3) a CSV file of examinee scores. In addition, there is the optional output of
scored item responses. The CSV file of test and item statistics includes the same statistics
as are in the DOCX report, but in CSV form so you can manipulate the data in a
spreadsheet or easily upload it into item banking software such as FastTest.
Output: Introduction Section The primary output, the DOCX report, is presented as a formal report that can be provided
to test developers or subject matter experts (SMEs). It begins with a title page which is
followed by summary information of the input specifications. This is important for
historical purposes; if the report is read a few years from now, it will be evident how
Iteman 4 was set up to produce the report. If more than 250 items are analyzed, the item-
level report will be divided into separate files. The test-level output and the item-level
output for the first 250 items will be saved in the first file. The second file will be
comprised of the item-level output for items 251-500. Additional item-level files will be
created for all k items with each file containing the output for up to 250 items.
Test-Level Output: Summary Statistics Next, the report provides test-level summary statistics based on raw number-correct
scores (or external scores if utilized). This is done for the total score (all items) as well as
the actual score (scored items only), pretest items only, and all domains or content areas.
The following are definitions of the columns in this table.
Label Explanation
Score which portion of the test that the row is describing
Items number of items in that portion of the test
Mean average number correct
SD standard deviation, a measure of dispersion (a range of ±
two SDs from the mean includes approximately 95% of the
examinees, if their number-correct scores are normally
distributed)
Min score the minimum number of items an examinee answered
correctly
Max score the maximum number of items an examinee answered
correctly
Iteman Manual 22
Mean P average item difficulty statistic for that portion; also the
average proportion-correct score if there are no omitted
responses (not reported if there are no multiple choice items)
Item Mean average of the item means for polytomous items (not
reported if there are no polytomous items)
Mean R average item-total correlation for that portion of the test
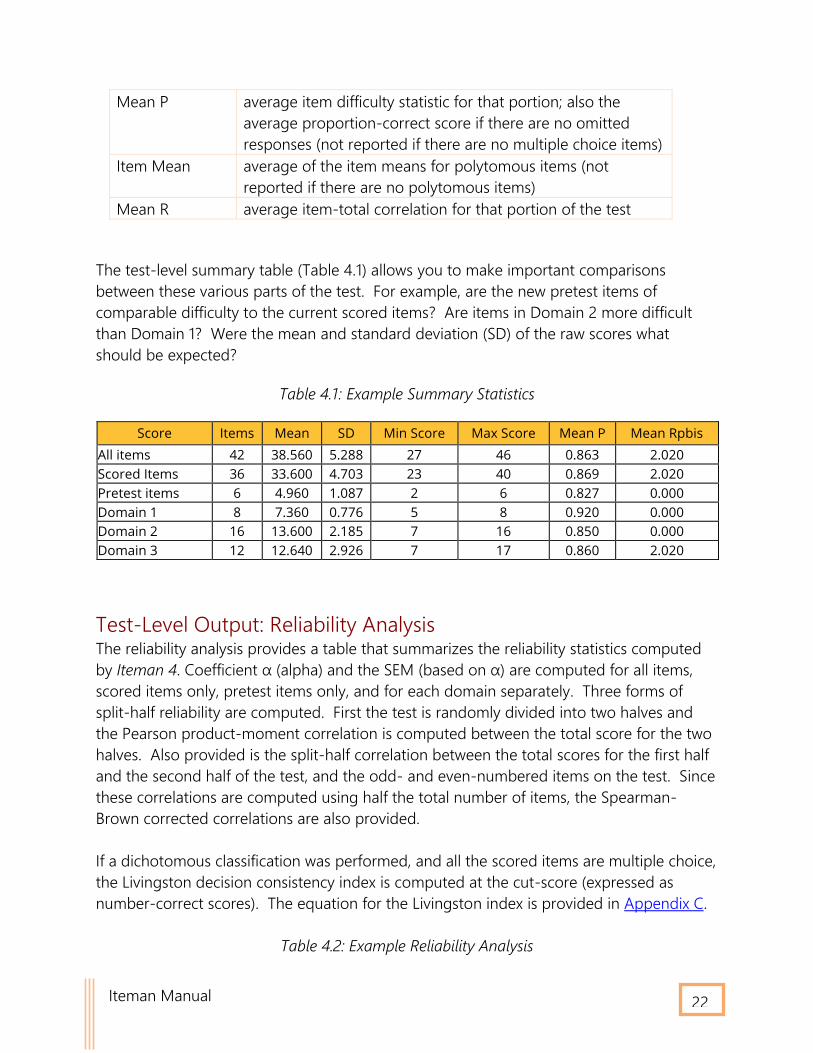
The test-level summary table (Table 4.1) allows you to make important comparisons
between these various parts of the test. For example, are the new pretest items of
comparable difficulty to the current scored items? Are items in Domain 2 more difficult
than Domain 1? Were the mean and standard deviation (SD) of the raw scores what
should be expected?
Table 4.1: Example Summary Statistics
Score Items Mean SD Min Score Max Score Mean P Mean Rpbis
All items 42 38.560 5.288 27 46 0.863 2.020
Scored Items 36 33.600 4.703 23 40 0.869 2.020
Pretest items 6 4.960 1.087 2 6 0.827 0.000
Domain 1 8 7.360 0.776 5 8 0.920 0.000
Domain 2 16 13.600 2.185 7 16 0.850 0.000
Domain 3 12 12.640 2.926 7 17 0.860 2.020
Test-Level Output: Reliability Analysis The reliability analysis provides a table that summarizes the reliability statistics computed
by Iteman 4. Coefficient α (alpha) and the SEM (based on α) are computed for all items,
scored items only, pretest items only, and for each domain separately. Three forms of
split-half reliability are computed. First the test is randomly divided into two halves and
the Pearson product-moment correlation is computed between the total score for the two
halves. Also provided is the split-half correlation between the total scores for the first half
and the second half of the test, and the odd- and even-numbered items on the test. Since
these correlations are computed using half the total number of items, the Spearman-
Brown corrected correlations are also provided.
If a dichotomous classification was performed, and all the scored items are multiple choice,
the Livingston decision consistency index is computed at the cut-score (expressed as
number-correct scores). The equation for the Livingston index is provided in Appendix C.
Table 4.2: Example Reliability Analysis

Iteman Manual 23
Score Alpha SEM Split-Half
(Random)
Split-Half
(First-Last)
Split-Half
(Odd-Even)
S-B
Random
S-B First-
Last
S-B Odd-
Even
All items 0.765 2.561 0.537 0.473 0.707 0.699 0.643 0.829
Scored
items
0.731 2.439 0.462 0.434 0.682 0.632 0.605 0.811
Pretest
items
0.519 0.754 - - - -
Domain 1 0.073 0.747 0.014 0.182 -0.008 0.028 0.308 -0.016
Domain 2 0.642 1.307 0.607 0.380 0.328 0.755 0.551 0.494
Domain 3 0.590 1.874 0.209 0.149 0.600 0.345 0.259 0.750
Test-Level Output: Graphics After the test-level statistical table, a grouped frequency distribution figure is presented,
showing the distribution of number-correct scores for the scored items, as seen in Figure
4.1. Similar graphs are produced for each domain, if you have more than one domain.
Figure 4.1: Example Score Distribution
After the histograms for the scored items, histograms for the item statistics are provided,
each followed by a table of numerical values corresponding to the histograms. If there
were scored multiple-choice items, the histogram for the item P values and Rpbis
correlations are provided. If there were scored polytomous items then the histogram for
the item means and the Pearson r correlations are provided.
Iteman Manual 24
Next, scatterplots are provided of the P value by Rpbis if there are scored multiple-choice
items, and of the item mean by Pearson’s r if there are scored polytomous items.
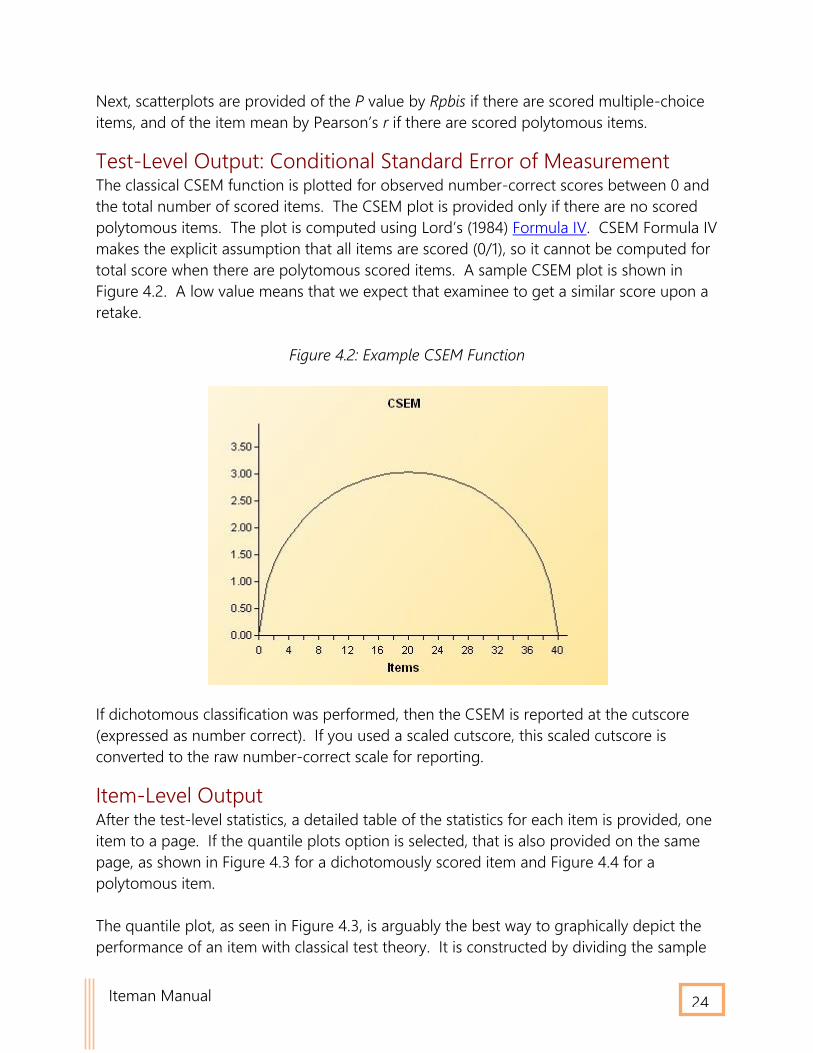
Test-Level Output: Conditional Standard Error of Measurement The classical CSEM function is plotted for observed number-correct scores between 0 and
the total number of scored items. The CSEM plot is provided only if there are no scored
polytomous items. The plot is computed using Lord’s (1984) Formula IV. CSEM Formula IV
makes the explicit assumption that all items are scored (0/1), so it cannot be computed for
total score when there are polytomous scored items. A sample CSEM plot is shown in
Figure 4.2. A low value means that we expect that examinee to get a similar score upon a
retake.
Figure 4.2: Example CSEM Function
If dichotomous classification was performed, then the CSEM is reported at the cutscore
(expressed as number correct). If you used a scaled cutscore, this scaled cutscore is
converted to the raw number-correct scale for reporting.
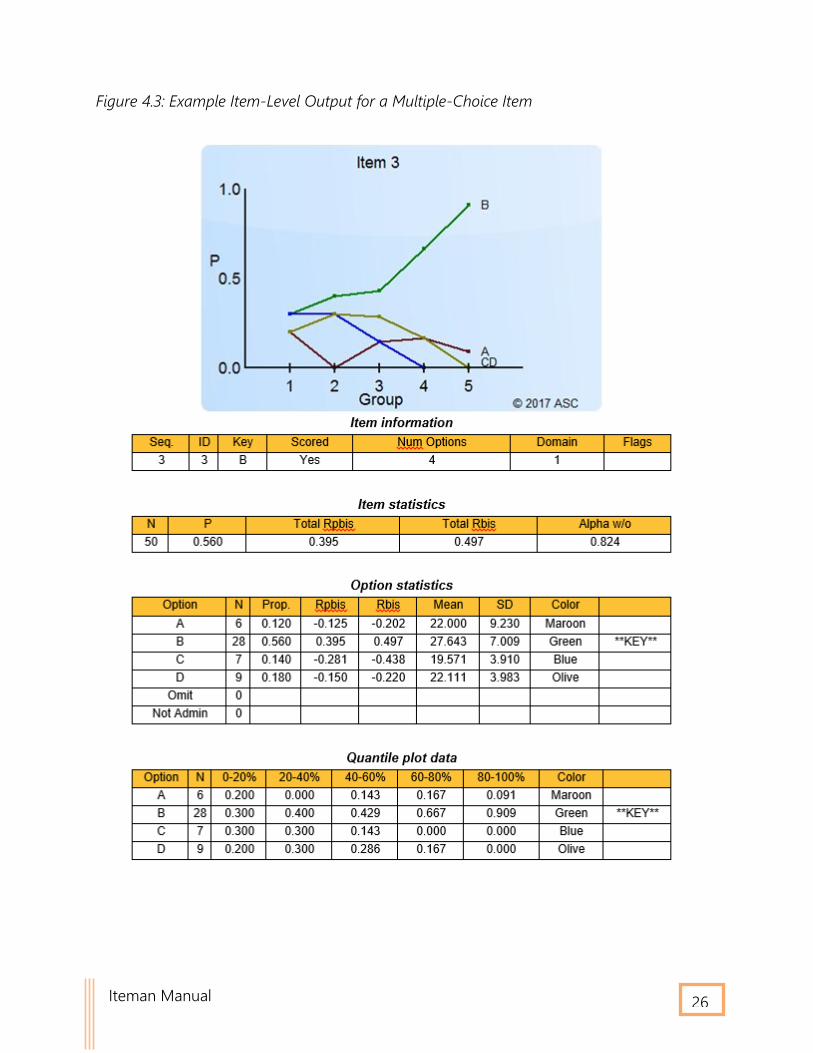
Item-Level Output After the test-level statistics, a detailed table of the statistics for each item is provided, one
item to a page. If the quantile plots option is selected, that is also provided on the same
page, as shown in Figure 4.3 for a dichotomously scored item and Figure 4.4 for a
polytomous item.
The quantile plot, as seen in Figure 4.3, is arguably the best way to graphically depict the
performance of an item with classical test theory. It is constructed by dividing the sample

Iteman Manual 25
into X groups based on overall number-correct score, or an external score if used, and
then calculating the proportion of each group that selected each option. For a four-option
multiple-choice item with three score groups as in the example, there are 12 data points.
The 3 points for a given option are connected by a colored line. A good item will typically
have a positive slope on the line for the correct/keyed answer, while the slope for the
incorrect options should be negative.
Iteman Manual 26
Figure 4.3: Example Item-Level Output for a Multiple-Choice Item
Iteman Manual 27
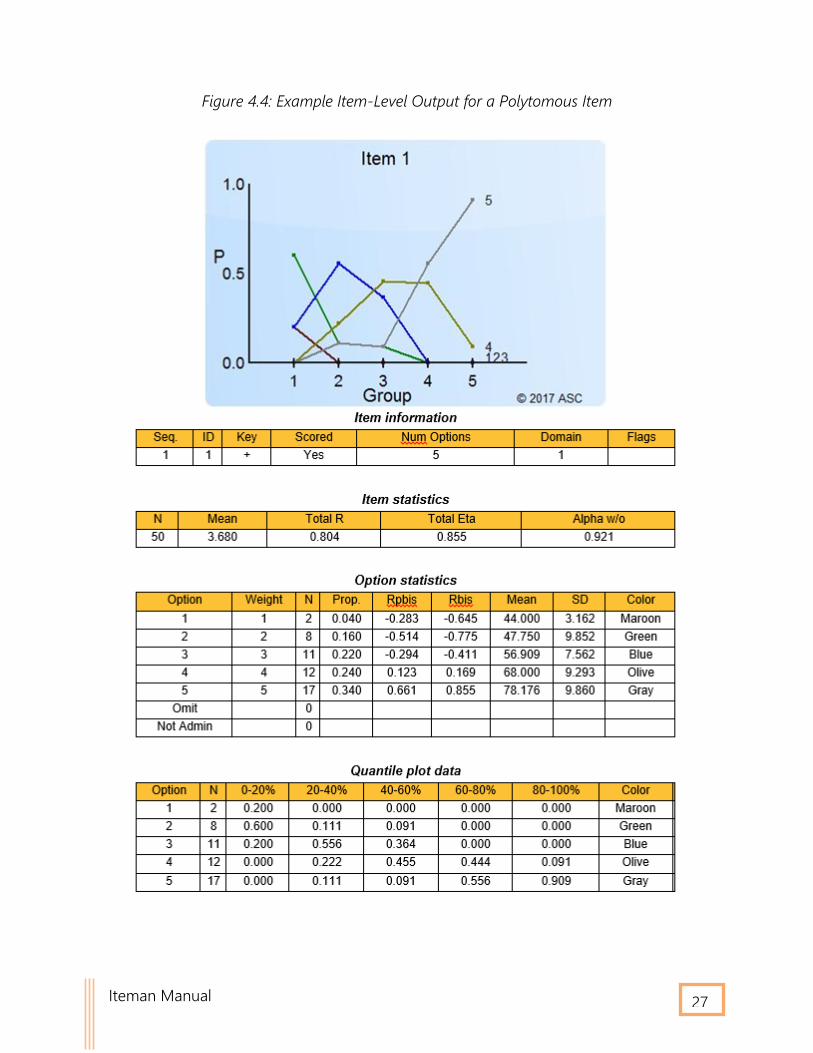
Figure 4.4: Example Item-Level Output for a Polytomous Item

Iteman Manual 28
The item information table in Figures 4.3 and 4.4 provides the item sequence number,
item ID, keyed response, number of options, and the domain the item is in. The item
statistics table provides item-level statistics and is described separately for multiple-choice
and polytomous items.
Multiple-Choice Items
Label Explanation
N Number of examinees that responded to the item
P Proportion correct
Domain Rpbis* Point-biserial correlation of keyed response with domain
score
Domain Rbis* Biserial correlation of keyed response with domain score
Total Rpbis Point-biserial correlation of keyed response with total score
Total Rbis Biserial correlation of keyed response with total score
Alpha w/o The coefficient alpha of the test if the item was removed
Flags Any flags, given the bounds provided; LP = Low P, HP = High
P, LR = Low rpbis , HR = High rpbis , K = Key error (rpbis for a
distractor is higher than rpbis for key), DIF for any item with a
significant DIF test result
Polytomous Items
Label Explanation
N Number of examinees that responded to the item
Mean Average score for the item
Domain r* Correlation of item (Pearson’s r) with domain score
Domain Eta*+ Coefficient eta from an ANOVA using item and domain
scores
Total r Correlation of item (Pearson’s r ) with total score
Total Eta+ Coefficient eta from an ANOVA using item and total scores
Alpha w/o The coefficient alpha of the test if the item was removed
Flags Any flags, given the bounds provided; same as dichotomous
except that mean score instead of P
*Output provided if there are 2+ domains. +Eta is reported if the item has 3+ categories, otherwise the biserial correlation will be
reported.
If requested, the DIF test results also appear in the classical statistics table and are defined
below.

Iteman Manual 29
Label Explanation
M-H The Mantel-Haenszel DIF statistic
p p-value associated with M-H test statistic
Bias Against If p is less than 0.05, the group the item is biased against
The following table provides explanations for option-level information in the third table
seen in Figures 4.3 and 4.4, “Option statistics.”
Label Explanation
Option Letter/Number of the option
Weight Scoring weight for polytomous items
N Number of examinees that selected the option
Prop. Proportion of examinees that selected the option
Rpbis Point-biserial correlation (rpbis) of option with total score
Rbis Biserial correlation of option with total score
Mean Average score of examinees that selected the option
Color Color of the option on the quantile plot
(key) The keyed answer will be denoted by **KEY** for multiple
choice items
The final table in Figures 4.3 and 4.4 presents the calculations for the quantile plots. The
number of columns in this table will match the number of score groups you specified on
the Output Options tab.
Iteman 4 was designed to produce DOCX output instead of
PDF output to allow you to make additions/modifications to
the report. A very useful addition would be to paste item text
and comments below the plot/table for each item (Figures 4.3
and 4.4). The report can then be delivered to content experts
with an easy-to-read plot, detailed tables, and the item text
neatly arranged on each page, one page for each item.
Iteman Manual 30
5. How do I interpret the output? At a higher level, the use of Iteman 4 output has two steps: first, to identify which items
perform poorly, and secondly to diagnose the problems present in those items. The
following are some definitions of, and considerations for, item statistics.
Item Difficulty
The P value (Multiple Choice)
The P value is the proportion of examinees that answered an item correctly (or in the
keyed direction). It ranges from 0.0 to 1.0. A high value means that the item is easy, and a
low value means that the item is difficult.
The minimum P value bound represents what you consider the cut point for an item being
too difficult. For a relatively easy test, you might specify 0.50 as a minimum, which means
that 50% of the examinees have answered the item correctly. For a test where we expect
examinees to do poorly, the minimum might be lowered to 0.4 or even 0.3. The minimum
should take into account the possibility of guessing; if the item is multiple-choice with four
options, there is a 25% chance of randomly guessing the answer, so the minimum should
probably not be 0.20.
The maximum P value represents the cut point for what you consider to be an item that is
too easy. The primary consideration here is that if an item is so easy that nearly everyone
gets it correct, it is not providing much information about the examinees. In fact, items
with a P of 0.95 or higher typically have very poor point-biserial correlations.
The Item Mean (Polytomous) The item mean is the average of the item responses converted to numeric values across all
examinees. The range of the item mean is dependent on the number of categories and
whether the item responses begin at 0. The interpretation of the item mean depends on
the type of item (rating scale or partial credit). A good rating scale item will have an item
mean close to ½ of the maximum, as this means that on average, examinees are not
endorsing categories near the extremes of the continuum.
The minimum item mean bound represents what you consider the cut point for the item
mean being too low.
The maximum item mean bound represents what you consider the cut point for the item
mean being too high. The number of categories for the items must be considered when

Iteman Manual 31
setting the bounds of the minimum/maximum values. This is important as all items of a
certain type (e.g., 3-category) might be flagged.
Item Discrimination
Multiple Choice Items
The item point-biserial (r-pbis) correlation. The Pearson point-biserial correlation (r-pbis) is
a measure of the discrimination, or differentiating strength, of the item. It ranges from .0
to 1.0. A good item is able to differentiate between examinees of high and low ability, and
will have a higher point-biserial, but rarely above 0.50. A negative point-biserial is
indicative of a very poor item, because then the high-ability examinees are answering
incorrectly, while the low examinees are answering it correctly. A point-biserial of 0.0
provides no differentiation between low-scoring and high-scoring examinees, essentially
random “noise.”
The minimum item-total correlation bound represents the lowest discrimination you are
willing to accept. This is typically a small positive number, like 0.10 or 0.20. If your sample
size is small, it could possibly be reduced.
The maximum item-total correlation bound is almost always 1.0, because it is typically
desired that the r-pbis be as high as possible.
The item biserial (r-bis) correlation. The biserial correlation is also a measure of the
discrimination, or differentiating strength, of the item. It ranges from 1.0 to 1.0. The
biserial correlation is computed between the item and total score as if the item was a
continuous measure of the trait. Since the biserial is an estimate of Pearson’s r it will be
larger in absolute magnitude than the corresponding point-biserial. The biserial makes the
stricter assumption that the score distribution is normal. The biserial correlation is not
recommended for traits where the score distribution is known to be non-normal (e.g.,
pathology).
Polytomous Items
Pearson’s r correlation. The Pearson’s r correlation is the product-moment correlation
between the item responses (as numeric values) and total score. It ranges from 1.0 to 1.0.
The r correlation indexes the linear relationship between item score and total score and
assumes that the item responses for an item form a continuous variable. The r correlation
and the r-pbis are equivalent for a 2-category item.

Iteman Manual 32
The minimum item-total correlation bound represents the lowest discrimination you are
willing to accept. Since the typical r correlation (0.5) will be larger than the typical rpbis (0.3)
correlation, you may wish to set the lower bound higher for a test with polytomous items
(0.2 to 0.3). If your sample size is small, it could possibly be reduced.
The maximum item-total correlation bound is almost always 1.0, because it is typically
desired that the r-pbis be as high as possible.
Eta coefficient. The eta coefficient is computed using an analysis of variance with the item
response as the independent variable and total score as the dependent variable. The eta
coefficient is the ratio of the between groups sum of squares to the total sum of squares
and has a range of 0 to 1. The eta coefficient does not assume that the item responses are
continuous and also does not assume a linear relationship between the item response and
total score. As a result, the eta coefficient will always be equal or greater than Pearson’s r.
Note that the biserial correlation will be reported if the item has only 2 categories.
DIF Statistics Differential item functioning (DIF) occurs when the performance of an item differs across
groups of examinees. These groups are typically called the reference (usually majority)
and focal (usually minority) groups. The goal of this analysis is to flag items that are
potentially biased against one group.
There are a number of ways to evaluate DIF. The current version of Iteman utilizes the
Mantel-Haenszel statistic, where each group is split into several ability levels, and the
probability of a correct response compared between the focal and reference groups for
each level. See Appendix C for the equations. Results of this analysis are added into both
the CSV and RTF output files.
Mantel-Haenszel
The Mantel-Haenszel (M-H) coefficient is reported for each item as an odds ratio. The
coefficient is a weighted average of the odds ratios for each θ level. If the odds ratio is less
than 1.0, then the item is more likely to be correctly endorsed by the reference group than
the focal group. Likewise, odds ratios greater than 1.0 indicate that the focal group was
more likely to correctly endorse the item than the focal group. The RTF file contains the
overall M-H coefficient for an item; the CSV output file also includes the odds ratios for
each θ level. These ratios can be used to determine if the DIF present was constant for all
abilities (uniform DIF) or varied conditional on θ (crossing DIF). The M-H coefficient is not
sensitive to crossing DIF, so null results should be checked to confirm that there wasn’t
crossing DIF present.

Iteman Manual 33
z-test Statistic
The negative of the natural logarithm of the M-H odds ratio was divided by its standard
error to obtain the z-test statistic used to test the significance of the M-H against a null of
zero DIF (odds ratio of 1.0). This test statistic is provided in the CSV output file.
p
The two tailed p value associated with the z test for DIF. Items with p values less than .05
will be flagged as having significant DIF.
Bias Against
The group the item is biased against when the p value is less than .05. In the context of
the M-H test for DIF, the group that the item is biased against has a lower probability of a
correct response than the other group, controlling for ability level.
Option statistics Each option has a P value and an r-pbis. The values for the keyed response serve as the
statistics for the item as a whole, but it is the values for the incorrect options (the
distractors) that provide the opportunity to diagnose issues with the item. A high P for a
distractor means that many examinees are choosing that distractor; a high positive r-pbis
means that many high-ability examinees are choosing that distractor. Such a situation
identifies a distractor that is too attractive, and could possibly be argued as correct.
Scores Output File The CSV score output file provides the scores for each examinee, separated by item type.
Figure 4.5 displays the scores for 10 examinees. The columns in this file are as follows:
1. Sequence – The row number of the examinee in the data file.
2. ID – Examinee ID from the data file.
3. Scored items – The total number-correct (raw) score for all scored items across all
domains.
4. All items – The total number-correct score for all scored items across all domains plus
all of the pretest items included in the test.
5. Pretest items – Provides the number-correct scores for the pretest items only.
6. Scored Proportion Correct – The proportion of scored items correct across all domains.
This value is only output if there are no scored polytomous items.
7. Rank – The rank of the examinee’s score, from 1 to N, which is calculated as the number
of examinees with total scores for the scored items (column 1) greater than or equal to
the given examinee. Examinees that are tied with the same score receive the lowest

Iteman Manual 34
rank available (e.g., Examinees 4 and 8 have ranks of 4,167). Examinee(s) with the
highest score will receive a rank of 1.
8. Percentile – The percentage of examinees whose total score falls below the given score.
9. Group – The score group an examinee is classified into is based on total score for all the
scored items. The number of score groups is determined by the value set in the
“Create X score groups for the quantile plots / summary table” box on the Output
Options tab.
10. Domain X – The final column(s) in the scores output file contain the domain scores
separately for each domain. If more than one domain was specified in the Item Control
File, then the total number-correct scores calculated separately for each domain would
be found after the “Group” column. If the test has only one domain, this will not be
included, as it will be the same as the “Scored items” column.
12. Scaled Total Score – If scaled scores were computed for total score these will appear.
12. Scaled Domain Score X – If scaled scores were requested for each domain – and there
is more than one domain – these will be provided.
13. Classification – If dichotomous classification was performed the results of the
classification will be provided. Classification can be performed with the raw total
number-correct scores or the scaled total number correct score.
14. CSEM III – The conditional standard error of measurement Formula III from Lord (1984)
if there are no scored polytomous items.
15. CSEM IV – The conditional standard error of measurement formula IV from Lord (1984)
if there are no scored polytomous items. Across all observed scores, this formula is
most comparable to the classical SEM found in Table 4.2.
Figure 4.5: Sample Examinee Scores Output
Iteman Manual 35
Collusion Index (Bellezza & Bellezza, 1989) The Bellezza and Bellezza (1989) collusion index evaluates error similarity analysis (ESA) by
calculating the probability that a given pair of examinees would have the same exact errors
in common (EEIC), given the total number of errors they have in common (EIC) and the
aggregated probability P of selecting the same distractor (see Appendix C for equations).
The ESA index is calculated for all possible pairs of examinees. Iteman then counts the
number of times an examinee is flagged for having an index probability below the cutoff
(i.e., 0.0001). This is useful in data forensics to find groups of examinees engaging in
possible collusion; if a certain location has 40 examinees and 30 examinees have 20 or
more flags, this would certainly be worth some investigation. The full matrix of paired
comparisons is output as a CSV file to more closely evaluate the pairs.
The software program Scrutiny! also calculates this ESA index. However, it utilizes a
normal approximation rather than exact calculations to determine the significance of
response similarity, and details are not given regarding the calculation of P, so its results
might not agree exactly with Iteman.

Iteman Manual 36
References
Bellezza, F. S., & Bellezza, S. F. (1989). Detection of cheating on multiple-choice tests by
using error-similarity analysis. Teaching of Psychology, 16, 151-155.
Lord, F. M. (1984). Standard errors of measurement at different ability levels. Journal of
Educational Measurement, 21(3), 239–243.
Iteman Manual 37
Appendix A: The Iteman 3 Header
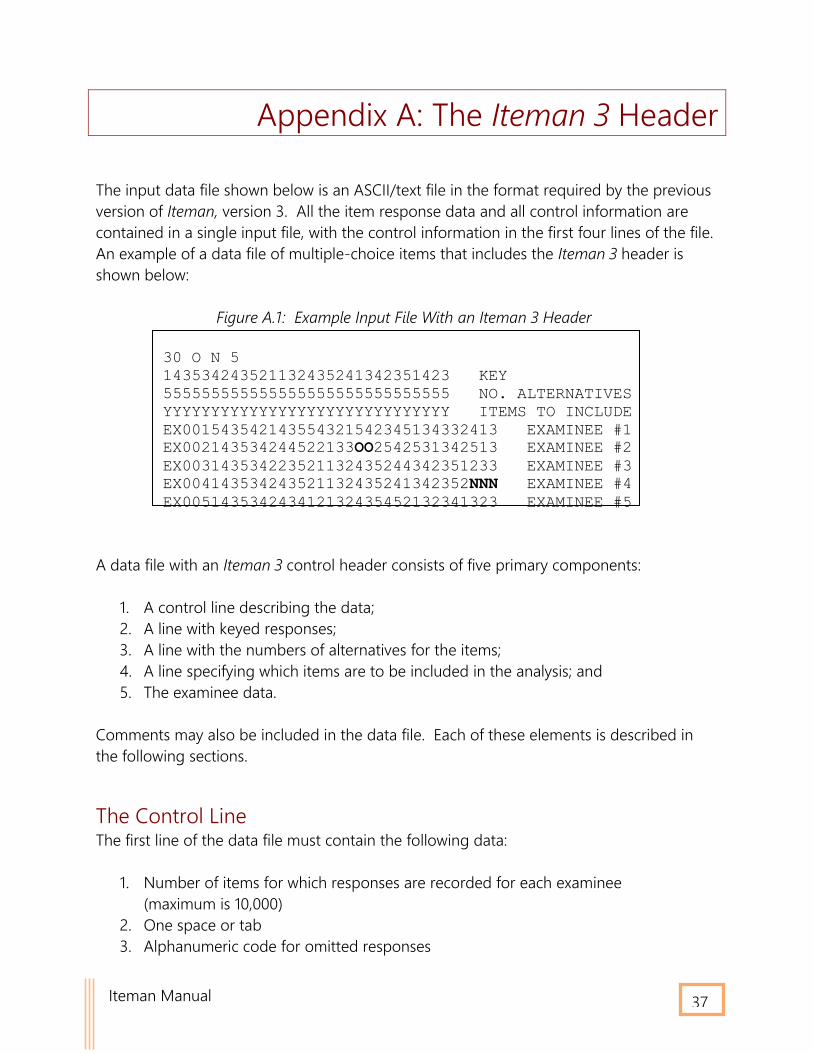
The input data file shown below is an ASCII/text file in the format required by the previous
version of Iteman, version 3. All the item response data and all control information are
contained in a single input file, with the control information in the first four lines of the file.
An example of a data file of multiple-choice items that includes the Iteman 3 header is
shown below:
Figure A.1: Example Input File With an Iteman 3 Header
30 O N 5
143534243521132435241342351423 KEY
555555555555555555555555555555 NO. ALTERNATIVES
YYYYYYYYYYYYYYYYYYYYYYYYYYYYYY ITEMS TO INCLUDE
EX001543542143554321542345134332413 EXAMINEE #1
EX002143534244522133OO2542531342513 EXAMINEE #2
EX003143534223521132435244342351233 EXAMINEE #3
EX004143534243521132435241342352NNN EXAMINEE #4
EX005143534243412132435452132341323 EXAMINEE #5
A data file with an Iteman 3 control header consists of five primary components:
1. A control line describing the data;
2. A line with keyed responses;
3. A line with the numbers of alternatives for the items;
4. A line specifying which items are to be included in the analysis; and
5. The examinee data.
Comments may also be included in the data file. Each of these elements is described in
the following sections.
The Control Line The first line of the data file must contain the following data:
1. Number of items for which responses are recorded for each examinee
(maximum is 10,000)
2. One space or tab
3. Alphanumeric code for omitted responses
Iteman Manual 38
4. One space or tab
5. Alphanumeric code for items not reached by the examinee
6. One space or tab
7. Number of characters of identification data recorded for each examinee.
The first entry in the Iteman 3 header file specifies the number of items to be scored.
Unlike Iteman 3, Iteman 4 does not require that this number be located in a fixed position
on the first line. A space or tab must separate the number of items from the next
character, the omit code.
The column immediately following the space/tab must contain the alphanumeric code for
items that the examinee has omitted. This may be a digit larger than the number of
alternatives, a letter, or some other character, including a “blank.” For example, it might be
“9” for a five-alternative item, an “O” for omitted, or a period. Following the omit character
must be a space or tab. Immediately following the space/tab must be the alphanumeric
code for items that the examinee did not reach and therefore did not have a chance to
answer. Like the omission code, it may be a digit larger than the number of alternatives or
any other character. In Figure A.1, the letter “O” indicates an omitted item, and “N”
indicates a not-reached item.
A space or tab must separate the not-reached code from the number of ID columns. In
Iteman 4 this value can now range from 0 to 1,000 columns of examinee identification. A
zero must be placed on the control line when there is no examinee ID information
provided. The example in Figure A.1 indicates that there are 5 characters of identification
for each examinee; in the data lines (beginning on line 5 of the input file in Figure A.1),
you will note that examinees are identified by characters “EX001” through “EX005.”
The Keyed Responses The second line of the file contains the keyed response for each item in the data file. The
code in column 1 corresponds to the key for item 1, and so forth. The entire key must be
contained on a single line. Thus, for the example in Figure A.1, Item 1 is keyed “1,” Item 2 is
keyed “4,” and the last item (Item 30) is keyed “3”. Note also the optional comment on the
key line following item 30, which identifies the data on that line. For polytomous (e.g.,
rating scale) items, the entry on this line is a “+” if item scores in the data portion of the file
are not to be reversed and a “-“ if they are to be reverse scored.
The Number of Alternatives The third line of the file must specify the number of alternatives for each item. For
dichotomously scored items, this must be equal to the number of choices allowed for the

Iteman Manual 39
item. In the example in Figure A.1, each of the items has five alternatives. In Iteman 4, the
number of alternatives is used in computing the response-alternative statistics.
The Scale Inclusion Codes The fourth line contains scale inclusion codes, which indicate whether an item should be
included in the analysis. Items coded “Y” are included in the analysis; those coded “N” are
not. In the example shown in Figure A.1, all of the items will be included in the analysis.
The scoring status on the inclusion line can be specified as follows: Y = scored, N = not
scored, and P = pretest. All scored items are assumed to belong to a single domain. If
scoring for more than one domain is desired, the header should be converted to an Item
Control File which permits domain scoring.
Iteman Manual 40
Appendix B: Troubleshooting
The following section documents the different error messages you might encounter when
you use Iteman 4.
Please check the data file format specifications You will receive this error message shown when the program reached the end of the line
before reading in the item responses for the first examinee. If you received this error you
should check the following:
1. The number of items in the Item Control File versus the Data Matrix File.
2. The column in the data matrix where item responses begin versus the value in the
”Item response begins in column” box.
3. Whether the Data Matrix File includes an Iteman 3 header. You should remove the
Iteman 3 header from the Data Matrix File if you are using an Item Control File. This
is because the four lines that make up the Iteman 3 header would be scored as the
first four examinees.
Please check the number of items or number of ID columns
specified in the Iteman 3 Header You will receive this error message when the program reached the end of the line before
reading in the item responses for the first examinee, and you are using the Iteman 3
header rather than a control file. If you received this error you should check the following:
1. The number of items specified in the Iteman 3 header versus the Data Matrix File
2. The column in the data matrix where item responses begin versus the value found
on the first line of the Iteman 3 header.
Please select an input file with an Iteman 3 Header If you received this error message you should check the following:
1. If the ”Data matrix file includes an Iteman 3 Header” box is checked and you are not
using an Iteman 3 header format. If so, then make sure the box is not checked
before running the program again.
2. The Data Matrix File to see if the Iteman 3 header is included or formatted properly.
Iteman Manual 41
Valid item responses of 0 were identified. The Iteman 3 Header
does not support item responses that begin at 0. If you received this error message you should check the following:
1. The omit and not reached characters.
2. The number of examinee id characters. If too few examinee ID characters were
specified, then you might receive this error as ID characters can often include ‘0’.
You need to create an item control file if you wish to analyze item responses that begin at
0. The item control file provides additional flexibility and permits mixed-format tests with
items that begin at both 0 and 1.
At least one valid item response of 0 was identified. If you received this error message you should check the following:
1. The omit and not reached characters.
2. The item control file. If you have item responses of ‘0’ for an item then you must
set the item type in the item control file to “P” for partial credit.
3. The column where item responses begin. If too few examinee ID characters were
specified, then you might receive this error as ID characters can often include ‘0’.
At least one unidentified response character was identified and will
be scored as incorrect. If you received this error message you should check the following:
1. The omit and not reached characters.
2. The format of the item responses. Item responses must be numbers from 0 to 9 or
letters from “A” to “I”. Any letters that occur later in the alphabet than “I” should not
be used in the data matrix as item responses. Letters after “I” or non-alphanumeric
characters such as “#” can cause this error message.
3. The column where item responses begin. If too few examinee ID characters were
specified, then you might receive this error as ID characters are often not valid item
responses (e.g., spaces, letters after “I”).
Iteman Manual 42
If you are using different characters for the omitted responses in a single data set, then
you should consider consolidating them for use in Iteman 4. Unidentified responses will be
scored as incorrect, but will not have any option statistics calculated for them.
Check the data matrix file, examinee XXX did not respond to all XXX
items You will receive this error when Iteman 4 reaches the end of the line before all of the item
responses are read in for any examinee other than the first one. If you received this error
you should check the following:
1. Whether one or more examinees have an incomplete identification record.
2. Whether one or more examinees are missing item responses (or did not respond to
all of the items on the test and responses were not coded as “not reached”).
It should be noted that the examinee number reported in the dialog box is only the last
examinee in the data matrix to have an incomplete record. It is possible that multiple
examinees did not have a complete record.

Iteman Manual 43
Appendix C: Formulas
Conditional Standard Error of Measurement Formulas
( )
( 1)
x n xCSEM III
n
(C.1)
where : x = number-correct score
n = number of items
2
(1 )CSEM IV K CSEM III (C.2)
where : 2
2 2
( 1)
( ) ( )
P
x P
n n sK
x n x s n s
(C.3)
and 2
Ps = variance of the proportion correct
x = mean of the number correct scores
2
xs = variance of the number correct scores
Livingston Classification Consistency Index
2 2
2 2
( )
( )
x c
x c
s x npL
s x np
(C.4)
where : = Cronbach’s alpha
pc = proportion correct at the cutscore
Note: L equals α when the cutscore is at the mean of the number-correct scores.
Differential Item Functioning
The Mantel-Haenszel odds ratio for score group k is defined as

Iteman Manual 44
,k k
k k
R F
k
F R
C I
C I
(C.5)
where
C and I denote correct and incorrect responses to the item, respectively,
R is the reference group,
F is the focal group.
The Mantel-Haenszel DIF coefficient is a weighted average of the score group odds ratios
and is defined as
ˆ ,
k k
k k
F R
k
k
F R
k
C I
N
C I
N
(C.6)
where N is the number of examinees in score group k.
Item Collusion Index In Bellezza and Bellezza (1989), the probability that a given pair of examinees would have
the same exact errors in common (EEIC), given the total number of errors they have in
common (EIC) and the aggregated probability P of selecting the same distractor is defined
as
( )!(1 ) ,
!( )!
nk n k
i k
nP P
k n k
(C.7)
where
k denotes the number of EEIC,
n is the number of EIC.
Note that it is summed from k to N to estimate the probability of having k or more EEIC
out of EIC.
The calculation of P is left to the researcher to some extent. Published resources on the
topic note that if examinees always selected randomly among distractors, the probability
of an examinee selecting a given distractor is 1/d, where d is the number of incorrect
answers, usually one less than the total number of possible responses. Two examinees
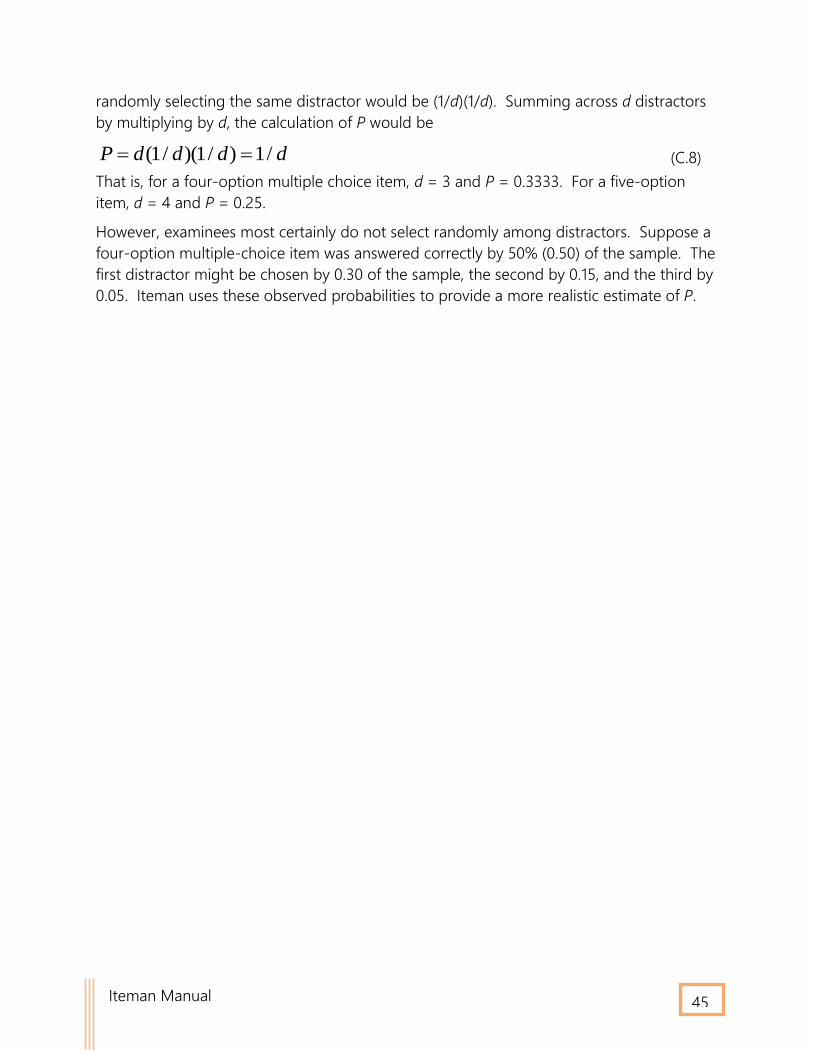
Iteman Manual 45
randomly selecting the same distractor would be (1/d)(1/d). Summing across d distractors
by multiplying by d, the calculation of P would be
(1/ )(1/ ) 1/P d d d d (C.8)
That is, for a four-option multiple choice item, d = 3 and P = 0.3333. For a five-option
item, d = 4 and P = 0.25.
However, examinees most certainly do not select randomly among distractors. Suppose a
four-option multiple-choice item was answered correctly by 50% (0.50) of the sample. The
first distractor might be chosen by 0.30 of the sample, the second by 0.15, and the third by
0.05. Iteman uses these observed probabilities to provide a more realistic estimate of P.

Iteman Manual 46
Appendix D: Program Defaults File
Default values for the program’s specifications are stored in the file Defaults.options. This
configuration file can be opened and edited with a text editor (not a word processor).
Figure D.1 shows the contents of this file.
Figure D.1: The Defaults File for Iteman 4.2
The defaults file allows you to change the values for the components of Iteman 4 listed
below. The lines of the default file include the following information (this information is
case sensitive). All entries must be separated by a single space unless otherwise indicated.
Note that there must be an entry for each option even if the option is not relevant to a
given run.
Line 1. The file internal identifier, which is the following string: Iteman 4.4
Line 2. Run title
Line 3. The following options control the specifications found on the Files tab and must be
separated by a single space:
a) Dataset includes an Iteman 3 header (Y or N)
b) External score file (Y or N)
Line 4. The following options control the starting values found on the Input Format tab:
a) Number of examinee ID columns
b) Column where examinee IDs begin
c) Column where item responses begin
d) Omit character
ITEMAN 4.4
My Sample Test
N N
6 1 7 O N N N N
N 0 6 1 2 Reference Focal
N N N 1.000 0.000 N 0.000 1.000 Y N N 1.000 Pass Fail
0.00 1.00 0.00 15.00 0.00 1.00 N Y 3 Y Y 5 N N N N N
K LP HP LR HR LM HM DIF
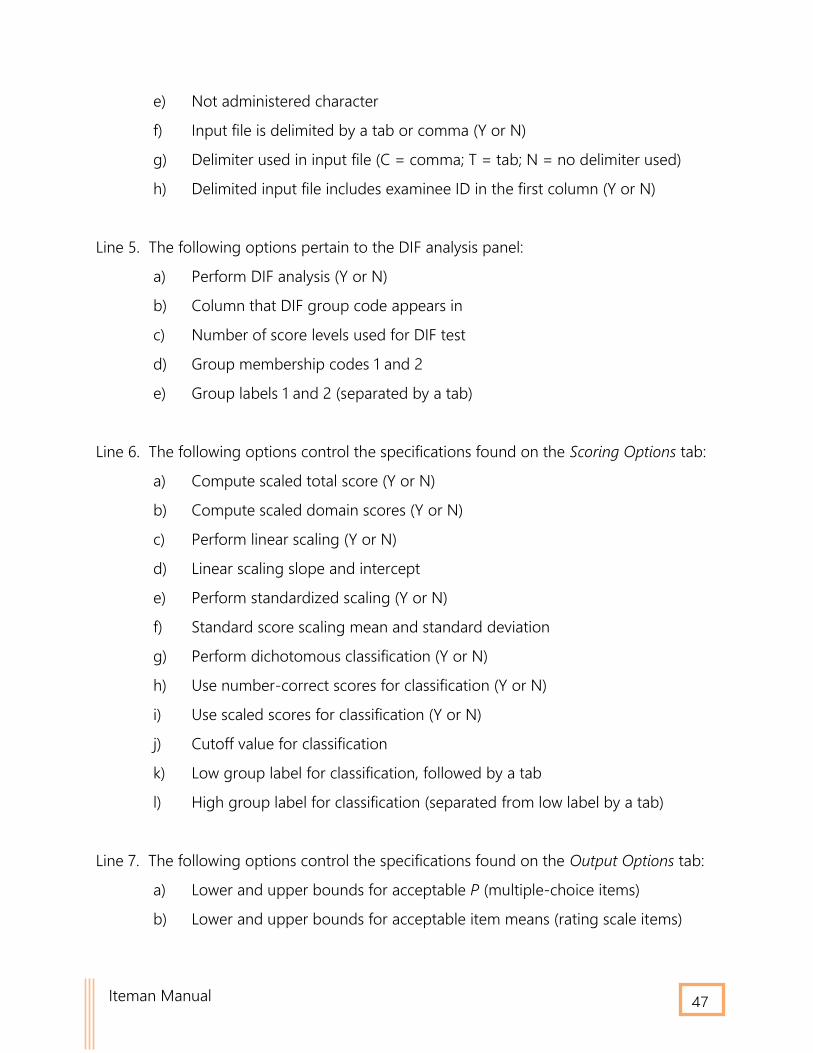
Iteman Manual 47
e) Not administered character
f) Input file is delimited by a tab or comma (Y or N)
g) Delimiter used in input file (C = comma; T = tab; N = no delimiter used)
h) Delimited input file includes examinee ID in the first column (Y or N)
Line 5. The following options pertain to the DIF analysis panel:
a) Perform DIF analysis (Y or N)
b) Column that DIF group code appears in
c) Number of score levels used for DIF test
d) Group membership codes 1 and 2
e) Group labels 1 and 2 (separated by a tab)
Line 6. The following options control the specifications found on the Scoring Options tab:
a) Compute scaled total score (Y or N)
b) Compute scaled domain scores (Y or N)
c) Perform linear scaling (Y or N)
d) Linear scaling slope and intercept
e) Perform standardized scaling (Y or N)
f) Standard score scaling mean and standard deviation
g) Perform dichotomous classification (Y or N)
h) Use number-correct scores for classification (Y or N)
i) Use scaled scores for classification (Y or N)
j) Cutoff value for classification
k) Low group label for classification, followed by a tab
l) High group label for classification (separated from low label by a tab)
Line 7. The following options control the specifications found on the Output Options tab:
a) Lower and upper bounds for acceptable P (multiple-choice items)
b) Lower and upper bounds for acceptable item means (rating scale items)

Iteman Manual 48
c) Lower and upper bounds for acceptable r (item-total correlation)
d) Exclude omits from the option statistics (Y or N)
e) Correct for spuriousness (Y or N)
f) Number of digits of precision
g) Produce quantile plots for each item (Y or N)
h) Produce quantile plot data tables for each item (Y or N)
i) Number of score groups
j) Produce collusion index matrix (Y or N)
k) Save the scored item responses (Y or N)
l) Save the item control file (Y or N)
m) Include the Omit codes in the scored matrix (Y or N)
n) Include the Not Administered codes in the scored matrix (Y or N);
Line 8. The following flag characters must each be separated by a tab character:
a) Key flag, followed by a tab
b) Low and high flags for P value, separated by a tab
c) Low and high flags for r-pbis, separated by a tab
d) Low and high flags for Item Mean, separated by a tab
e) DIF flag
All of the program options, can be saved to the defaults file by making changes to the
options in the GUI and clicking “Save the Program Defaults” under the pull-down menu
from the File tab. You will be notified that the defaults file is missing upon start-up of
Iteman 4 if you move, rename, or destroy the file. If the defaults file is missing you can
easily save a new one by clicking on the “Save an Options File” option on the File Menu.