itc - company update-jan-18-edel -...
TRANSCRIPT
Edelweiss Research is also available on www.edelresearch.com, Bloomberg EDEL <GO>, Thomson First Call, Reuters and Factset. Edelweiss Securities Limited
Predicting budget outcomes is, more often than not, a futile exercise, generally leading to more misses than hits. Yet, we see higher probability (70%) to Budget 2018 being kinder to ITC as: (i) government’s monthly compensation cess collection (>INR75bn run rate) over July‐November 2017, if extrapolated for full year, indicates healthy ~INR675bn kitty versus INR500bn estimate; (ii) government is sharpening focus on tax collection from other tobacco products (including illegal cigarettes); and (iii) historical trend indicates a soft‐to‐moderate budget post a harsh budget in the preceding year (though FY17 budget was moderate, GST rate was harsh resulting in ~16‐17% tax hike in a year). Improving prospects of ITC’s other businesses and the P/E gap between HUL & ITC (at ~50%, multi year) lend valuation comfort. Hence, though we maintain ‘HOLD’, at CMP, risk‐ reward looks favourable.
Healthy compensation cess kitty bolsters soft budget hope
Against expectation of ~INR40‐45bn monthly compensation cess collection, the July–
November number stands at >INR75bn p.m., which is encouraging. Since the
compensation cess is a non‐lapsable fund, it cannot be used to fund fiscal deficit. This
indicates higher probability of a soft‐to‐moderate tax hike during Union Budget 2018.
Other businesses gaining scale
Over the past decade, contribution of cigarettes to ITC’s overall revenue has
plummeted and it is expected to accentuate as other businesses mature and attain
size & scale. While stock prices of other listed FMCG, hotels and paper stocks have
risen ~35‐140%, street is yet to re‐rate ITC’s other businesses.
Outlook and valuations: All eyes on budget; maintain ‘HOLD’
With per capita consumption 1/18th of China’s, cigarette opportunity in India remains
attractive over the long term. However, with cigarette still contributing ~85% to EBIT,
reliance on regulated business continues to remain high. Hence, we maintain
‘HOLD/SP’ and value ITC on SOTP on FY20E to arrive at TP of INR307. At CMP, stock is
trading at 25.9x FY19E EPS.
COMPANY UPDATE
ITC All eyes on budget; valuation comfort
EDELWEISS 4D RATINGS
Absolute Rating HOLD
Rating Relative to Sector Performer
Risk Rating Relative to Sector Medium
Sector Relative to Market Underweight
MARKET DATA (R: ITC.BO, B: ITC IN)
CMP : INR 269
Target Price : INR 307
52‐week range (INR) : 368 / 243
Share in issue (mn) : 12,190.5
M cap (INR bn/USD mn) : 3,284 / 51,568
Avg. Daily Vol.BSE/NSE(‘000) : 12,873.0 SHARE HOLDING PATTERN (%)
Current Q2FY18 Q1FY18
Promoters *
‐ ‐ 57.4
MF's, FI's & BK’s 36.3 36.3 8.2
FII's 19.1 19.1 27.0
Others 44.6 44.6 7.5
* Promoters pledged shares (% of share in issue)
: NIL
PRICE PERFORMANCE (%)
Stock Nifty
EW FMCG Index
1 month 2.7 3.6 2.5
3 months 1.2 6.1 7.3
12 months 8.2 28.3 30.4
Abneesh Roy +91 22 6620 3141
Alok Shah +91 22 6620 3040
Rajiv Berlia +91 22 6623 3377
India Equity Research| Consumer Goods
January 11, 2018
Financials
Year to March FY16 FY17 FY18E FY19E
Revenues (INR mn) 388,042 423,600 439,943 488,648
EBITDA (INR mn) 144,509 154,359 160,659 182,583
Adjusted Profit (INR mn) 95,009 104,772 111,908 126,737
Adjusted Diluted EPS (INR) 7.8 8.6 9.2 10.4
EPS growth (%) (1.9) 9.6 7.1 13.3
Diluted P/E (x) 34.4 31.4 29.3 25.9
EV/EBITDA (x) 21.6 20.4 19.5 17.0
ROAE (%) 25.3 23.4 23.0 24.0
Consumer Goods
2 Edelweiss Securities Limited
Healthy compensation cess kitty bolsters moderate tax hike hope
We expect a soft‐to‐moderate tax hike in Budget 2018 and assign 70% probability to it.
Pivotal to our thesis is monthly compensation cess collection data. When the 4‐tier tax
structure under GST was introduced, the Ministry of Finance had guided for INR500bn p.a.
(~INR40‐45bn p.m.) collection under compensation cess to compensate states for loss of
revenue. Against the expectation, collection p.m. from July–November has been healthy—
>INR75bn.
Moreover, collections under compensation cess are credited to a non‐lapsable fund as
part of the Public Account of India. As per law, at the end of the GST transition period of
five years, the balance lying in the compensation cess account will be equally split
between the Centre and states. Thus, funds lying in the kitty will not be fungible and,
hence, cannot be used by the central government for other purposes such as funding fiscal
deficit. This bolsters our conviction of soft‐to‐moderate tax hikes in Budget 2018.
Focusing on enhancing tax collection from other forms of tobacco
Over the past 2 years, the government is focussing on improving tax collection from other
forms of tobacco products as well. Proposed moves such as licensing of non‐cigarette
tobacco products will help create a level‐playing field across different tobacco products.
On the tax front as well, the government has adopted a stronger stance than earlier against
other forms of tobacco—increased basic excise duty on hand‐made bidis by 33% and on
machine‐made bidis by ~2.7x and hiked additional excise duty on pan masala, gutka and
khaini by 3%, 6% and 6%, respectively, in Budget 2017. These coupled with increasing raids
on illegal cigarettes amply reflect government’s attempt to garner incremental tax
collections from other forms of tobacco products.
Plus, the government is cognizant that ~22% of cigarettes consumed in India are illegal. An
estimated 68% of tobacco consumed in the country remains outside the tax net on account
of tax evasion. Legal cigarettes account for only ~11% of total tobacco consumption in the
country and they contribute more than 87% to tax revenue from the tobacco sector. This
further strengthens our belief that the government will not hike tax rate significantly for the
cigarette industry.
Trend hints at soft‐to‐moderate tax hike As shown in the table below, a harsh budget is usually followed by a soft‐to‐moderate one.
We believe, post harsh budgets in FY13‐16 followed by hike in cess in GST era, the
government is likely to soften tax hikes in Budget 2018.

ITC
3 Edelweiss Securities Limited
Table 1: Hike in taxation over the years in cigarettes
Source:
Other businesses gaining scale
ITC is amongst top players in all the businesses it operates in—in FMCG, ITC Foods is one of
the fastest growing player, in hotels too, it is one of the largest and fastest‐growing
hospitality chains in India, in agri it is pioneer in rural transformation via ITC e‐choupal and
in paperboards & packaging ITC is the market leader in revenue and profit.
While at this juncture the cigarette segment contributes ~85% to ITC’s overall EBIT, going
forward rising profitability of other segments is envisaged to wane cigarette’s contribution.
As non cigarette segment starts generating EBIT, the valuation assigned for those segments
will increase. Today, while some of the stocks present in those sectors (Hotels, papers) have
risen manifold (refer below table), ITC stock in CY17 has rised tad 9.2% ‐ giving room for
increase when peers valuations are assigned to ITC’s non cigarette businesees.
FY18 ~16‐17% (6% in Budget and ~11% in GST) Harsh
FY17 10% Moderate
FY16 13% weighted average (25% on 64mm; 15% on other size) HarshFY15 21% weighted average (11‐72% range) Harsh
FY14 18% (applicable on above 64mm size) Harsh
FY13 20% Harsh
FY12 No change in duty Soft
FY11 15% Harsh
FY10 No change in duty Soft
FY09 Increased tax on non fi lter cig by 200% Moderate
FY08 Specific rates of duty on cigarettes increased by 5% Soft
FY07 5% Soft
FY06 10% Moderate
FY05 No change in duty Soft
FY04 No change in duty Soft
FY03 No change in duty Soft
FY02 15% Harsh
FY01 5% Soft
FY00 No change in duty Soft
Budget yearNature of excise hike in
the BudgetExcise Duty Hike (%)

Consumer Goods
4 Edelweiss Securities Limited
Table 2: Stock price performance of other hotel, paper and cigarette companies
Source: Company, Edelweiss research
Outlook and valuations: All eyes on budget; maintain ‘HOLD’
The increase in overall tax under the new GST regime had come as a surprise versus the
benefit estimated under the previous GST rate. The increase in GST rate along with ~6% hike
in Union Budget 2017 resulted in overall tax hike of ~16‐17% for FY18—ITC’s cigarette
volumes had come under tremendous pressure during FY13‐16 when the government had
increased excise duty on cigarettes by ~18% on an average (volumes were down 20% during
the period). This, along with Supreme Court’s stay order to keep pictorial warnings to 85%,
may sentimentally affect consumption to limited extent.
However, we believe, a steep hike of ~16‐17% in a single year followed by a harsh budget
will also in turn affect government’s tax collection. This, coupled with the government’s
healthy compensation cess kitty currently, provides Government some room to go for a
soft‐to‐moderate tax hike.
We maintain ‘HOLD/ Sector Performer’ and value ITC on SOTP basis on FY19E to arrive at
target price of INR307. However, considering the valuation gap with HUL (~50%), at CMP
risk‐reward looks favourable.
CY17 stock price return (%)
FMCG companies
Hindustan Unilever 65.3
Dabur 26.9
Britannia 65.1
Hotel companies
Indian Hotels 29.7
EIH 53.1
Taj GVK 65.4
Paper companies
TNPL 35.4
JK Paper 62.4
West Coast paper 142.3
Cigarette companies
ITC 9.2
VST Industries 36.6
Godfrey Phill ips (1.6)

ITC
5 Edelweiss Securities Limited
Table 3: SOTP valuation
Source: Edelweiss research
Chart 1: Valuation difference between HUL and ITC at multi‐year high
Source: Edelweiss research
FY19E Methodology
Target
multiple
Per share
contribution
Cigs EPS 8.6 P/E 27x 232
FMCG Sales/Share 9.6 P/S 4x 39
Hotels EBITDA/Share 0.3 EV/EBITDA 15x 5
Agri EBITDA/Share 1.0 EV/EBITDA 10x 10
Paper EBITDA/Share 1.1 EV/EBITDA 10x 11
Net cash 11
307Value of share
10.0
20.0
30.0
40.0
50.0
60.0
Jan‐12
Jul‐12
Jan‐13
Jul‐13
Jan‐14
Jul‐14
Jan‐15
Jul‐15
Jan‐16
Jul‐16
Jan‐17
Jul‐17
Jan‐18
(% diff)
HUL P/E band ITC P/E band

Consumer Goods
6 Edelweiss Securities Limited
Company Description
ITC is one of the largest consumer companies in India with businesses spanning cigarettes,
hotels, paper and agri‐commodities. Its branded foods division with products such as
staples, confectionery, noodle, snacks and biscuits is doing well and gaining strong market
share across many categories. ITC has been successful in foods and constantly expanding its
personal product portfolio (soaps, shampoos, deo, talc). Though the cigarettes division is
still the major source of revenue, other businesses (agri, paper, hotel) have grown over the
years. Recently ITC has entered the nicotine gum space with the launch of Kwiknic. Investment Theme
ITC has sustained its market leadership in the cigarettes space and delivered robust
performance (both topline and profitability) amidst heavy taxation burden (three
consecutive years of steep excise hike on cigarettes in Union Budget) and regulations with
constant focus on innovation and distribution. The e‐Choupal network established by ITC
gives it a phenomenal sourcing edge, which has helped it transform into a consumer giant.
ITC’s FMCG business is likely to maintain operating profitability. Paper business helps
address ackaging needs of FMCG business with consistent quality and comparatively lower
costs. Agri business has seen robust performance aided by tobacco leaf and traded
commodities exports; provides strategic sourcing support to the company’s cigarette and
branded packaged foods businesses by ensuring high quality supplies. We expect ITC’s
cigarette EBIT growth to remain resilient and FMCG’s profitability surge to sustain. With a
new business‐friendly government at the Centre, we expect hotel, paper and FMCG growth
rates to improve over ensuing years.
Key Risks
High incidence of taxation and strict regulatory norms on cigarette usage in public and
packaging poses threat to cigarette volume growth.
Growing contraband market of cigarettes also poses significant threat for the cigarettes
business.
Slowdown in macro‐economic environment is a major threat to hotels business.
SUUTI stake sale is a likely overhang on the stock.
7 Edelweiss Securities Limited
ITC
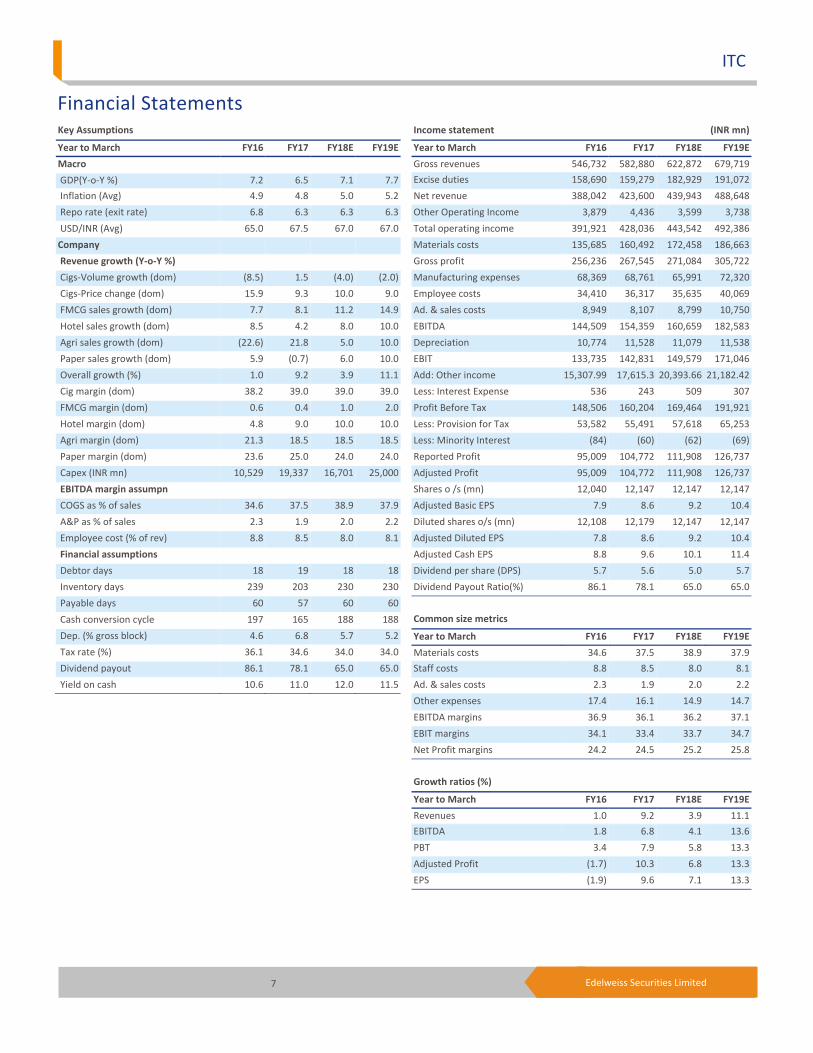
Financial Statements
Income statement (INR mn)
Year to March FY16 FY17 FY18E FY19E
Gross revenues 546,732 582,880 622,872 679,719
Excise duties 158,690 159,279 182,929 191,072
Net revenue 388,042 423,600 439,943 488,648
Other Operating Income 3,879 4,436 3,599 3,738
Total operating income 391,921 428,036 443,542 492,386
Materials costs 135,685 160,492 172,458 186,663
Gross profit 256,236 267,545 271,084 305,722
Manufacturing expenses 68,369 68,761 65,991 72,320
Employee costs 34,410 36,317 35,635 40,069
Ad. & sales costs 8,949 8,107 8,799 10,750
EBITDA 144,509 154,359 160,659 182,583
Depreciation 10,774 11,528 11,079 11,538
EBIT 133,735 142,831 149,579 171,046
Add: Other income 15,307.99 17,615.3 20,393.66 21,182.42
Less: Interest Expense 536 243 509 307
Profit Before Tax 148,506 160,204 169,464 191,921
Less: Provision for Tax 53,582 55,491 57,618 65,253
Less: Minority Interest (84) (60) (62) (69)
Reported Profit 95,009 104,772 111,908 126,737
Adjusted Profit 95,009 104,772 111,908 126,737
Shares o /s (mn) 12,040 12,147 12,147 12,147
Adjusted Basic EPS 7.9 8.6 9.2 10.4
Diluted shares o/s (mn) 12,108 12,179 12,147 12,147
Adjusted Diluted EPS 7.8 8.6 9.2 10.4
Adjusted Cash EPS 8.8 9.6 10.1 11.4
Dividend per share (DPS) 5.7 5.6 5.0 5.7
Dividend Payout Ratio(%) 86.1 78.1 65.0 65.0
Common size metrics
Year to March FY16 FY17 FY18E FY19E
Materials costs 34.6 37.5 38.9 37.9
Staff costs 8.8 8.5 8.0 8.1
Ad. & sales costs 2.3 1.9 2.0 2.2
Other expenses 17.4 16.1 14.9 14.7
EBITDA margins 36.9 36.1 36.2 37.1
EBIT margins 34.1 33.4 33.7 34.7
Net Profit margins 24.2 24.5 25.2 25.8
Growth ratios (%)
Year to March FY16 FY17 FY18E FY19E
Revenues 1.0 9.2 3.9 11.1
EBITDA 1.8 6.8 4.1 13.6
PBT 3.4 7.9 5.8 13.3
Adjusted Profit (1.7) 10.3 6.8 13.3
EPS (1.9) 9.6 7.1 13.3
Key Assumptions
Year to March FY16 FY17 FY18E FY19E
Macro
GDP(Y‐o‐Y %) 7.2 6.5 7.1 7.7
Inflation (Avg) 4.9 4.8 5.0 5.2
Repo rate (exit rate) 6.8 6.3 6.3 6.3
USD/INR (Avg) 65.0 67.5 67.0 67.0
Company
Revenue growth (Y‐o‐Y %)
Cigs‐Volume growth (dom) (8.5) 1.5 (4.0) (2.0)
Cigs‐Price change (dom) 15.9 9.3 10.0 9.0
FMCG sales growth (dom) 7.7 8.1 11.2 14.9
Hotel sales growth (dom) 8.5 4.2 8.0 10.0
Agri sales growth (dom) (22.6) 21.8 5.0 10.0
Paper sales growth (dom) 5.9 (0.7) 6.0 10.0
Overall growth (%) 1.0 9.2 3.9 11.1
Cig margin (dom) 38.2 39.0 39.0 39.0
FMCG margin (dom) 0.6 0.4 1.0 2.0
Hotel margin (dom) 4.8 9.0 10.0 10.0
Agri margin (dom) 21.3 18.5 18.5 18.5
Paper margin (dom) 23.6 25.0 24.0 24.0
Capex (INR mn) 10,529 19,337 16,701 25,000
EBITDA margin assumpn
COGS as % of sales 34.6 37.5 38.9 37.9
A&P as % of sales 2.3 1.9 2.0 2.2
Employee cost (% of rev) 8.8 8.5 8.0 8.1
Financial assumptions
Debtor days 18 19 18 18
Inventory days 239 203 230 230
Payable days 60 57 60 60
Cash conversion cycle 197 165 188 188
Dep. (% gross block) 4.6 6.8 5.7 5.2
Tax rate (%) 36.1 34.6 34.0 34.0
Dividend payout 86.1 78.1 65.0 65.0
Yield on cash 10.6 11.0 12.0 11.5
8 Edelweiss Securities Limited
Consumer Goods
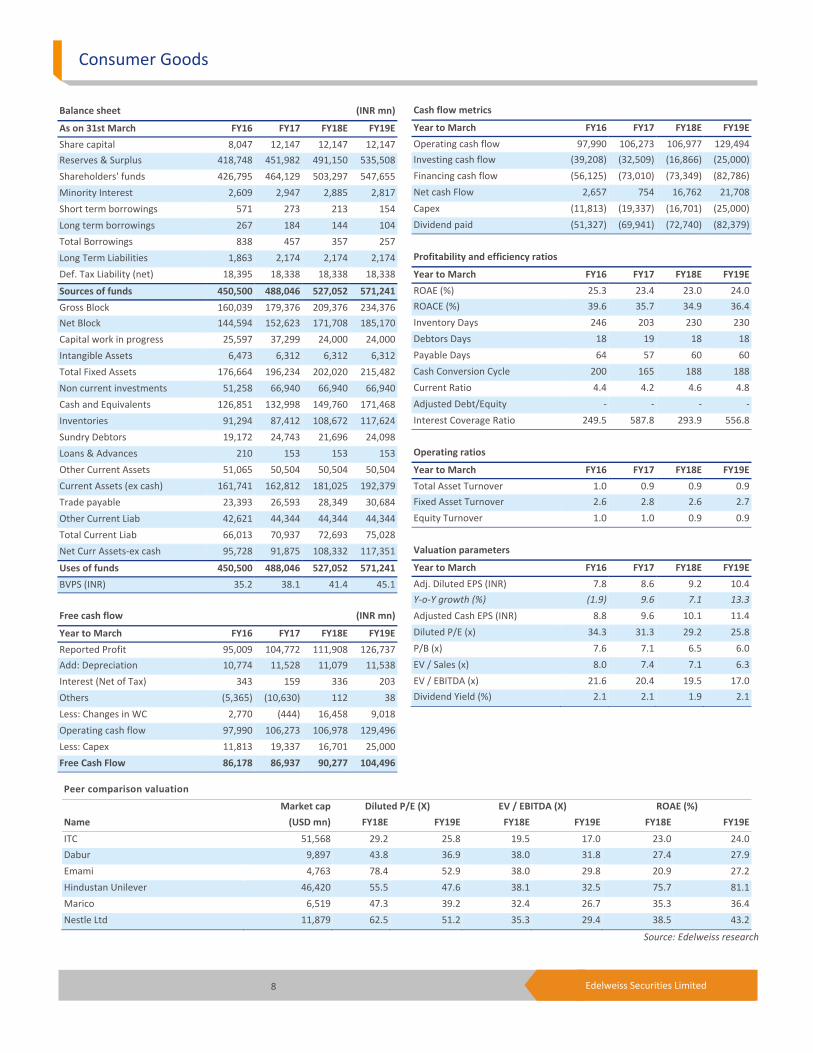
Peer comparison valuation
Market cap Diluted P/E (X) EV / EBITDA (X) ROAE (%)
Name (USD mn) FY18E FY19E FY18E FY19E FY18E FY19E
ITC 51,568 29.2 25.8 19.5 17.0 23.0 24.0
Dabur 9,897 43.8 36.9 38.0 31.8 27.4 27.9
Emami 4,763 78.4 52.9 38.0 29.8 20.9 27.2
Hindustan Unilever 46,420 55.5 47.6 38.1 32.5 75.7 81.1
Marico 6,519 47.3 39.2 32.4 26.7 35.3 36.4
Nestle Ltd 11,879 62.5 51.2 35.3 29.4 38.5 43.2
Source: Edelweiss research
Cash flow metrics
Year to March FY16 FY17 FY18E FY19E
Operating cash flow 97,990 106,273 106,977 129,494
Investing cash flow (39,208) (32,509) (16,866) (25,000)
Financing cash flow (56,125) (73,010) (73,349) (82,786)
Net cash Flow 2,657 754 16,762 21,708
Capex (11,813) (19,337) (16,701) (25,000)
Dividend paid (51,327) (69,941) (72,740) (82,379)
Profitability and efficiency ratios
Year to March FY16 FY17 FY18E FY19E
ROAE (%) 25.3 23.4 23.0 24.0
ROACE (%) 39.6 35.7 34.9 36.4
Inventory Days 246 203 230 230
Debtors Days 18 19 18 18
Payable Days 64 57 60 60
Cash Conversion Cycle 200 165 188 188
Current Ratio 4.4 4.2 4.6 4.8
Adjusted Debt/Equity ‐ ‐ ‐ ‐
Interest Coverage Ratio 249.5 587.8 293.9 556.8
Operating ratios
Year to March FY16 FY17 FY18E FY19E
Total Asset Turnover 1.0 0.9 0.9 0.9
Fixed Asset Turnover 2.6 2.8 2.6 2.7
Equity Turnover 1.0 1.0 0.9 0.9
Valuation parameters
Year to March FY16 FY17 FY18E FY19E
Adj. Diluted EPS (INR) 7.8 8.6 9.2 10.4
Y‐o‐Y growth (%) (1.9) 9.6 7.1 13.3
Adjusted Cash EPS (INR) 8.8 9.6 10.1 11.4
Diluted P/E (x) 34.3 31.3 29.2 25.8
P/B (x) 7.6 7.1 6.5 6.0
EV / Sales (x) 8.0 7.4 7.1 6.3
EV / EBITDA (x) 21.6 20.4 19.5 17.0
Dividend Yield (%) 2.1 2.1 1.9 2.1
Balance sheet (INR mn)
As on 31st March FY16 FY17 FY18E FY19E
Share capital 8,047 12,147 12,147 12,147
Reserves & Surplus 418,748 451,982 491,150 535,508
Shareholders' funds 426,795 464,129 503,297 547,655
Minority Interest 2,609 2,947 2,885 2,817
Short term borrowings 571 273 213 154
Long term borrowings 267 184 144 104
Total Borrowings 838 457 357 257
Long Term Liabilities 1,863 2,174 2,174 2,174
Def. Tax Liability (net) 18,395 18,338 18,338 18,338
Sources of funds 450,500 488,046 527,052 571,241
Gross Block 160,039 179,376 209,376 234,376
Net Block 144,594 152,623 171,708 185,170
Capital work in progress 25,597 37,299 24,000 24,000
Intangible Assets 6,473 6,312 6,312 6,312
Total Fixed Assets 176,664 196,234 202,020 215,482
Non current investments 51,258 66,940 66,940 66,940
Cash and Equivalents 126,851 132,998 149,760 171,468
Inventories 91,294 87,412 108,672 117,624
Sundry Debtors 19,172 24,743 21,696 24,098
Loans & Advances 210 153 153 153
Other Current Assets 51,065 50,504 50,504 50,504
Current Assets (ex cash) 161,741 162,812 181,025 192,379
Trade payable 23,393 26,593 28,349 30,684
Other Current Liab 42,621 44,344 44,344 44,344
Total Current Liab 66,013 70,937 72,693 75,028
Net Curr Assets‐ex cash 95,728 91,875 108,332 117,351
Uses of funds 450,500 488,046 527,052 571,241
BVPS (INR) 35.2 38.1 41.4 45.1
Free cash flow (INR mn)
Year to March FY16 FY17 FY18E FY19E
Reported Profit 95,009 104,772 111,908 126,737
Add: Depreciation 10,774 11,528 11,079 11,538
Interest (Net of Tax) 343 159 336 203
Others (5,365) (10,630) 112 38
Less: Changes in WC 2,770 (444) 16,458 9,018
Operating cash flow 97,990 106,273 106,978 129,496
Less: Capex 11,813 19,337 16,701 25,000
Free Cash Flow 86,178 86,937 90,277 104,496
9 Edelweiss Securities Limited
ITC
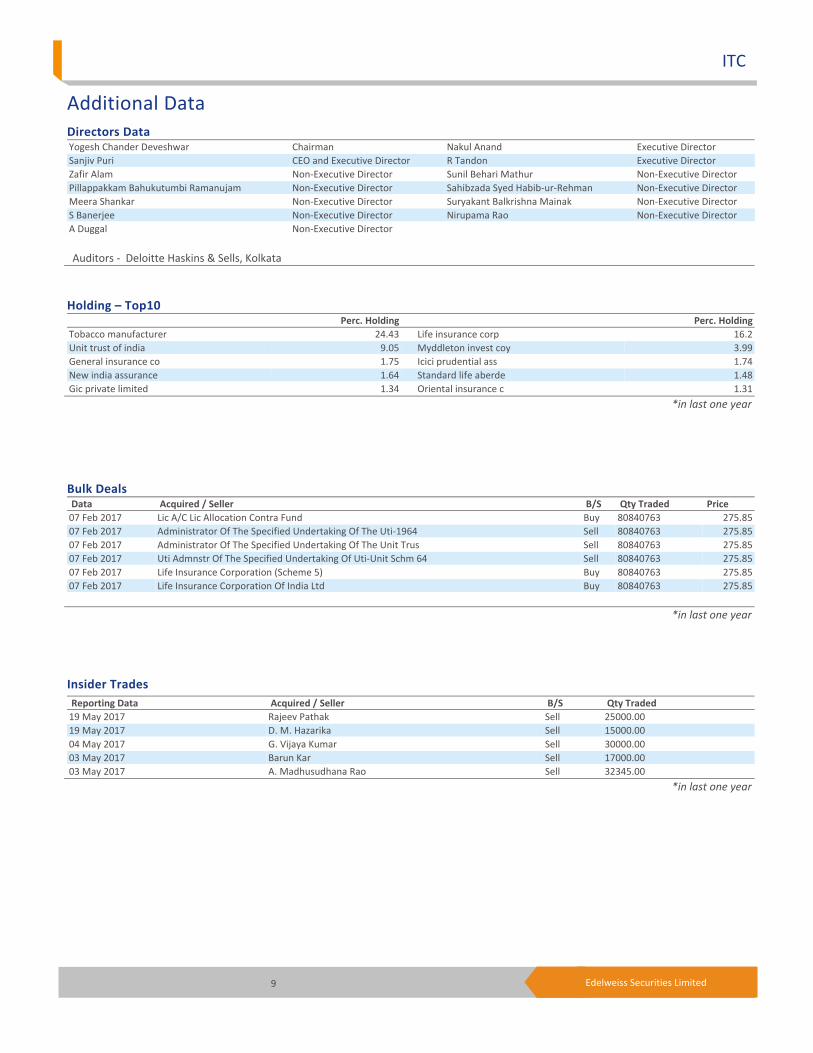
Insider Trades Reporting Data Acquired / Seller B/S Qty Traded
19 May 2017 Rajeev Pathak Sell 25000.00
19 May 2017 D. M. Hazarika Sell 15000.00
04 May 2017 G. Vijaya Kumar Sell 30000.00
03 May 2017 Barun Kar Sell 17000.00
03 May 2017 A. Madhusudhana Rao Sell 32345.00
*in last one year
Bulk Deals Data Acquired / Seller B/S Qty Traded Price
07 Feb 2017 Lic A/C Lic Allocation Contra Fund Buy 80840763 275.85
07 Feb 2017 Administrator Of The Specified Undertaking Of The Uti‐1964 Sell 80840763 275.85
07 Feb 2017 Administrator Of The Specified Undertaking Of The Unit Trus Sell 80840763 275.85
07 Feb 2017 Uti Admnstr Of The Specified Undertaking Of Uti‐Unit Schm 64 Sell 80840763 275.85
07 Feb 2017 Life Insurance Corporation (Scheme 5) Buy 80840763 275.85
07 Feb 2017 Life Insurance Corporation Of India Ltd Buy 80840763 275.85
*in last one year
Holding – Top10 Perc. Holding Perc. Holding
Tobacco manufacturer 24.43 Life insurance corp 16.2
Unit trust of india 9.05 Myddleton invest coy 3.99
General insurance co 1.75 Icici prudential ass 1.74
New india assurance 1.64 Standard life aberde 1.48
Gic private limited 1.34 Oriental insurance c 1.31
*in last one year
Additional Data
Directors Data Yogesh Chander Deveshwar Chairman Nakul Anand Executive Director
Sanjiv Puri CEO and Executive Director R Tandon Executive Director
Zafir Alam Non‐Executive Director Sunil Behari Mathur Non‐Executive Director
Pillappakkam Bahukutumbi Ramanujam Non‐Executive Director Sahibzada Syed Habib‐ur‐Rehman Non‐Executive Director
Meera Shankar Non‐Executive Director Suryakant Balkrishna Mainak Non‐Executive Director
S Banerjee Non‐Executive Director Nirupama Rao Non‐Executive Director
A Duggal Non‐Executive Director
Auditors ‐ Deloitte Haskins & Sells, Kolkata

10 Edelweiss Securities Limited
Company Absolute
reco Relative
reco Relative
risk
Company Absolute
reco
Relative
reco
Relative
Risk
Asian Paints BUY SO M Bajaj Corp HOLD SU H
Berger Paints BUY SO L Britannia Industries BUY SO L
Colgate HOLD SP M Dabur BUY SO M
Emami BUY SO H GlaxoSmithKline Consumer
Healthcare
HOLD SU M
Godrej Consumer BUY SO H Hindustan Unilever HOLD SP L
ITC HOLD SP M Marico BUY SO M
Nestle Ltd HOLD SP L Pidilite Industries BUY SO M
United Spirits BUY SP H
RATING & INTERPRETATION
ABSOLUTE RATING
Ratings Expected absolute returns over 12 months
Buy More than 15%
Hold Between 15% and - 5%
Reduce Less than -5%
RELATIVE RETURNS RATING
Ratings Criteria
Sector Outperformer (SO) Stock return > 1.25 x Sector return
Sector Performer (SP) Stock return > 0.75 x Sector return
Stock return < 1.25 x Sector return
Sector Underperformer (SU) Stock return < 0.75 x Sector return
Sector return is market cap weighted average return for the coverage universe within the sector
RELATIVE RISK RATING
Ratings Criteria
Low (L) Bottom 1/3rd percentile in the sector
Medium (M) Middle 1/3rd percentile in the sector
High (H) Top 1/3rd percentile in the sector
Risk ratings are based on Edelweiss risk model
SECTOR RATING
Ratings Criteria
Overweight (OW) Sector return > 1.25 x Nifty return
Equalweight (EW) Sector return > 0.75 x Nifty return
Sector return < 1.25 x Nifty return
Underweight (UW) Sector return < 0.75 x Nifty return
11 Edelweiss Securities Limited
ITC
Edelweiss Securities Limited, Edelweiss House, off C.S.T. Road, Kalina, Mumbai – 400 098.
Board: (91‐22) 4009 4400, Email: [email protected]
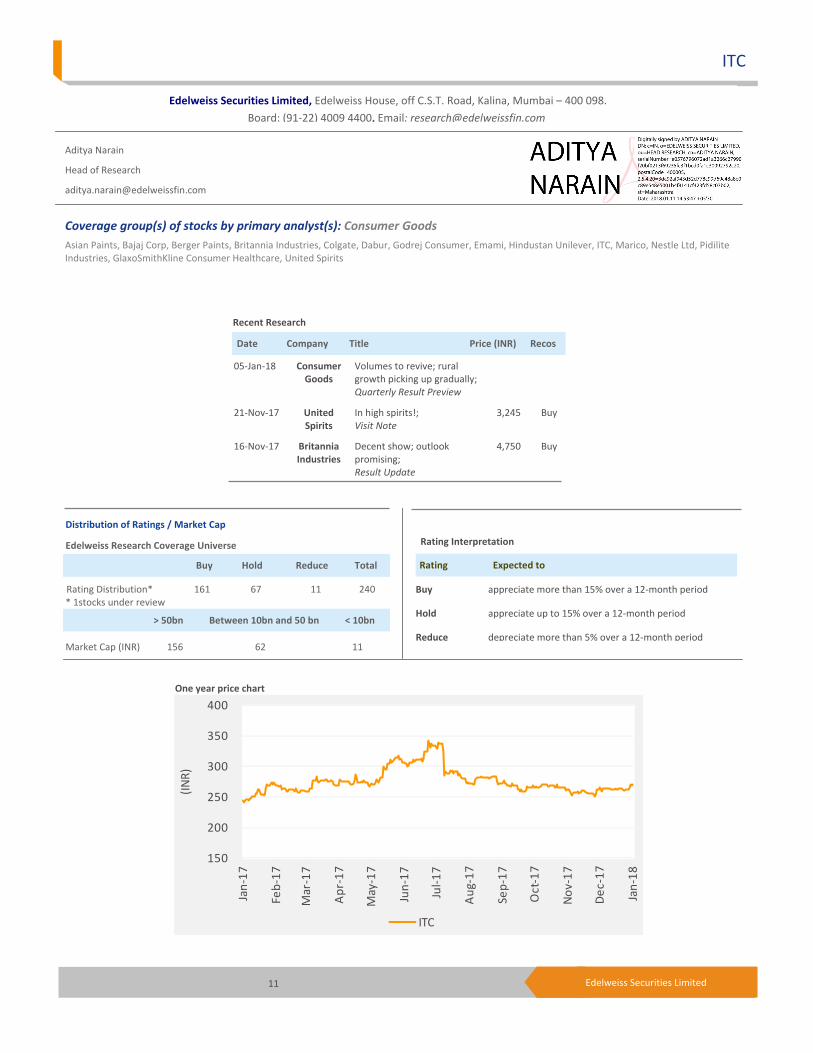
Aditya Narain
Head of Research
Coverage group(s) of stocks by primary analyst(s): Consumer Goods
Asian Paints, Bajaj Corp, Berger Paints, Britannia Industries, Colgate, Dabur, Godrej Consumer, Emami, Hindustan Unilever, ITC, Marico, Nestle Ltd, Pidilite Industries, GlaxoSmithKline Consumer Healthcare, United Spirits
Distribution of Ratings / Market Cap
Edelweiss Research Coverage Universe
Rating Distribution* 161 67 11 240* 1stocks under review
Market Cap (INR) 156 62 11
Date Company Title Price (INR) Recos
Recent Research
05‐Jan‐18 Consumer Goods
Volumes to revive; rural growth picking up gradually; Quarterly Result Preview
21‐Nov‐17 UnitedSpirits
In high spirits!; Visit Note
3,245 Buy
16‐Nov‐17 Britannia Industries
Decent show; outlook promising; Result Update
4,750 Buy
> 50bn Between 10bn and 50 bn < 10bn
Buy Hold Reduce Total
Rating Interpretation
Buy appreciate more than 15% over a 12‐month period
Hold appreciate up to 15% over a 12‐month period
Reduce depreciate more than 5% over a 12‐month period
Rating Expected to
One year price chart
150
200
250
300
350
400
Jan‐17
Feb‐17
Mar‐17
Apr‐17
May‐17
Jun‐17
Jul‐17
Aug‐17
Sep‐17
Oct‐17
Nov‐17
Dec‐17
Jan‐18
(INR)
ITC
12 Edelweiss Securities Limited
Consumer Goods
DISCLAIMER
Edelweiss Securities Limited (“ESL” or “Research Entity”) is regulated by the Securities and Exchange Board of India (“SEBI”) and is licensed to carry on the business of broking, depository services and related activities. The business of ESL and its Associates (list available on www.edelweissfin.com) are organized around five broad business groups – Credit including Housing and SME Finance, Commodities, Financial Markets, Asset Management and Life Insurance.
This Report has been prepared by Edelweiss Securities Limited in the capacity of a Research Analyst having SEBI Registration No.INH200000121 and distributed as per SEBI (Research Analysts) Regulations 2014. This report does not constitute an offer or solicitation for the purchase or sale of any financial instrument or as an official confirmation of any transaction. Securities as defined in clause (h) of section 2 of the Securities Contracts (Regulation) Act, 1956 includes Financial Instruments and Currency Derivatives. The information contained herein is from publicly available data or other sources believed to be reliable. This report is provided for assistance only and is not intended to be and must not alone be taken as the basis for an investment decision. The user assumes the entire risk of any use made of this information. Each recipient of this report should make such investigation as it deems necessary to arrive at an independent evaluation of an investment in Securities referred to in this document (including the merits and risks involved), and should consult his own advisors to determine the merits and risks of such investment. The investment discussed or views expressed may not be suitable for all investors.
This information is strictly confidential and is being furnished to you solely for your information. This information should not be reproduced or redistributed or passed on directly or indirectly in any form to any other person or published, copied, in whole or in part, for any purpose. This report is not directed or intended for distribution to, or use by, any person or entity who is a citizen or resident of or located in any locality, state, country or other jurisdiction, where such distribution, publication, availability or use would be contrary to law, regulation or which would subject ESL and associates / group companies to any registration or licensing requirements within such jurisdiction. The distribution of this report in certain jurisdictions may be restricted by law, and persons in whose possession this report comes, should observe, any such restrictions. The information given in this report is as of the date of this report and there can be no assurance that future results or events will be consistent with this information. This information is subject to change without any prior notice. ESL reserves the right to make modifications and alterations to this statement as may be required from time to time. ESL or any of its associates / group companies shall not be in any way responsible for any loss or damage that may arise to any person from any inadvertent error in the information contained in this report. ESL is committed to providing independent and transparent recommendation to its clients. Neither ESL nor any of its associates, group companies, directors, employees, agents or representatives shall be liable for any damages whether direct, indirect, special or consequential including loss of revenue or lost profits that may arise from or in connection with the use of the information. Our proprietary trading and investment businesses may make investment decisions that are inconsistent with the recommendations expressed herein. Past performance is not necessarily a guide to future performance .The disclosures of interest statements incorporated in this report are provided solely to enhance the transparency and should not be treated as endorsement of the views expressed in the report. The information provided in these reports remains, unless otherwise stated, the copyright of ESL. All layout, design, original artwork, concepts and other Intellectual Properties, remains the property and copyright of ESL and may not be used in any form or for any purpose whatsoever by any party without the express written permission of the copyright holders.
ESL shall not be liable for any delay or any other interruption which may occur in presenting the data due to any reason including network (Internet) reasons or snags in the system, break down of the system or any other equipment, server breakdown, maintenance shutdown, breakdown of communication services or inability of the ESL to present the data. In no event shall ESL be liable for any damages, including without limitation direct or indirect, special, incidental, or consequential damages, losses or expenses arising in connection with the data presented by the ESL through this report.
We offer our research services to clients as well as our prospects. Though this report is disseminated to all the customers simultaneously, not all customers may receive this report at the same time. We will not treat recipients as customers by virtue of their receiving this report.
ESL and its associates, officer, directors, and employees, research analyst (including relatives) worldwide may: (a) from time to time, have long or short positions in, and buy or sell the Securities, mentioned herein or (b) be engaged in any other transaction involving such Securities and earn brokerage or other compensation or act as a market maker in the financial instruments of the subject company/company(ies) discussed herein or act as advisor or lender/borrower to such company(ies) or have other potential/material conflict of interest with respect to any recommendation and related information and opinions at the time of publication of research report or at the time of public appearance. ESL may have proprietary long/short position in the above mentioned scrip(s) and therefore should be considered as interested. The views provided herein are general in nature and do not consider risk appetite or investment objective of any particular investor; readers are requested to take independent professional advice before investing. This should not be construed as invitation or solicitation to do business with ESL.
13 Edelweiss Securities Limited
ITC
ESL or its associates may have received compensation from the subject company in the past 12 months. ESL or its associates may have managed or co‐managed public offering of securities for the subject company in the past 12 months. ESL or its associates may have received compensation for investment banking or merchant banking or brokerage services from the subject company in the past 12 months. ESL or its associates may have received any compensation for products or services other than investment banking or merchant banking or brokerage services from the subject company in the past 12 months. ESL or its associates have not received any compensation or other benefits from the Subject Company or third party in connection with the research report. Research analyst or his/her relative or ESL’s associates may have financial interest in the subject company. ESL and/or its Group Companies, their Directors, affiliates and/or employees may have interests/ positions, financial or otherwise in the Securities/Currencies and other investment products mentioned in this report. ESL, its associates, research analyst and his/her relative may have other potential/material conflict of interest with respect to any recommendation and related information and opinions at the time of publication of research report or at the time of public appearance.
Participants in foreign exchange transactions may incur risks arising from several factors, including the following: ( i) exchange rates can be volatile and are subject to large fluctuations; ( ii) the value of currencies may be affected by numerous market factors, including world and national economic, political and regulatory events, events in equity and debt markets and changes in interest rates; and (iii) currencies may be subject to devaluation or government imposed exchange controls which could affect the value of the currency. Investors in securities such as ADRs and Currency Derivatives, whose values are affected by the currency of an underlying security, effectively assume currency risk.
Research analyst has served as an officer, director or employee of subject Company: No
ESL has financial interest in the subject companies: No
ESL’s Associates may have actual / beneficial ownership of 1% or more securities of the subject company at the end of the month immediately preceding the date of publication of research report.
Research analyst or his/her relative has actual/beneficial ownership of 1% or more securities of the subject company at the end of the month immediately preceding the date of publication of research report: No
ESL has actual/beneficial ownership of 1% or more securities of the subject company at the end of the month immediately preceding the date of publication of research report: No
Subject company may have been client during twelve months preceding the date of distribution of the research report.
There were no instances of non‐compliance by ESL on any matter related to the capital markets, resulting in significant and material disciplinary action during the last three years except that ESL had submitted an offer of settlement with Securities and Exchange commission, USA (SEC) and the same has been accepted by SEC without admitting or denying the findings in relation to their charges of non registration as a broker dealer.
A graph of daily closing prices of the securities is also available at www.nseindia.com
Analyst Certification:
The analyst for this report certifies that all of the views expressed in this report accurately reflect his or her personal views about the subject company or companies and its or their securities, and no part of his or her compensation was, is or will be, directly or indirectly related to specific recommendations or views expressed in this report.
Additional Disclaimers
Disclaimer for U.S. Persons
This research report is a product of Edelweiss Securities Limited, which is the employer of the research analyst(s) who has prepared the research report. The research analyst(s) preparing the research report is/are resident outside the United States (U.S.) and are not associated persons of any U.S. regulated broker‐dealer and therefore the analyst(s) is/are not subject to supervision by a U.S. broker‐dealer, and is/are not required to satisfy the regulatory licensing requirements of FINRA or required to otherwise comply with U.S. rules or regulations regarding, among other things, communications with a subject company, public appearances and trading securities held by a research analyst account.
This report is intended for distribution by Edelweiss Securities Limited only to "Major Institutional Investors" as defined by Rule 15a‐6(b)(4) of the U.S. Securities and Exchange Act, 1934 (the Exchange Act) and interpretations thereof by U.S. Securities and Exchange Commission (SEC) in reliance on Rule 15a 6(a)(2). If the recipient of this report is not a Major Institutional Investor as specified above, then it should not act upon this report and return the same to the sender. Further, this report may not be copied, duplicated and/or transmitted onward to any U.S. person, which is not the Major Institutional Investor.
14 Edelweiss Securities Limited
Consumer Goods
Access the entire repository of Edelweiss Research on www.edelresearch.com
In reliance on the exemption from registration provided by Rule 15a‐6 of the Exchange Act and interpretations thereof by the SEC in order to conduct certain business with Major Institutional Investors, Edelweiss Securities Limited has entered into an agreement with a U.S. registered broker‐dealer, Edelweiss Financial Services Inc. ("EFSI"). Transactions in securities discussed in this research report should be effected through Edelweiss Financial Services Inc. Disclaimer for U.K. Persons
The contents of this research report have not been approved by an authorised person within the meaning of the Financial Services and Markets Act 2000 ("FSMA"). In the United Kingdom, this research report is being distributed only to and is directed only at (a) persons who have professional experience in matters relating to investments falling within Article 19(5) of the FSMA (Financial Promotion) Order 2005 (the “Order”); (b) persons falling within Article 49(2)(a) to (d) of the Order (including high net worth companies and unincorporated associations); and (c) any other persons to whom it may otherwise lawfully be communicated (all such persons together being referred to as “relevant persons”). This research report must not be acted on or relied on by persons who are not relevant persons. Any investment or investment activity to which this research report relates is available only to relevant persons and will be engaged in only with relevant persons. Any person who is not a relevant person should not act or rely on this research report or any of its contents. This research report must not be distributed, published, reproduced or disclosed (in whole or in part) by recipients to any other person. Disclaimer for Canadian Persons
This research report is a product of Edelweiss Securities Limited ("ESL"), which is the employer of the research analysts who have prepared the research report. The research analysts preparing the research report are resident outside the Canada and are not associated persons of any Canadian registered adviser and/or dealer and, therefore, the analysts are not subject to supervision by a Canadian registered adviser and/or dealer, and are not required to satisfy the regulatory licensing requirements of the Ontario Securities Commission, other Canadian provincial securities regulators, the Investment Industry Regulatory Organization of Canada and are not required to otherwise comply with Canadian rules or regulations regarding, among other things, the research analysts' business or relationship with a subject company or trading of securities by a research analyst. This report is intended for distribution by ESL only to "Permitted Clients" (as defined in National Instrument 31‐103 ("NI 31‐103")) who are resident in the Province of Ontario, Canada (an "Ontario Permitted Client"). If the recipient of this report is not an Ontario Permitted Client, as specified above, then the recipient should not act upon this report and should return the report to the sender. Further, this report may not be copied, duplicated and/or transmitted onward to any Canadian person. ESL is relying on an exemption from the adviser and/or dealer registration requirements under NI 31‐103 available to certain international advisers and/or dealers. Please be advised that (i) ESL is not registered in the Province of Ontario to trade in securities nor is it registered in the Province of Ontario to provide advice with respect to securities; (ii) ESL's head office or principal place of business is located in India; (iii) all or substantially all of ESL's assets may be situated outside of Canada; (iv) there may be difficulty enforcing legal rights against ESL because of the above; and (v) the name and address of the ESL's agent for service of process in the Province of Ontario is: Bamac Services Inc., 181 Bay Street, Suite 2100, Toronto, Ontario M5J 2T3 Canada. Disclaimer for Singapore Persons
In Singapore, this report is being distributed by Edelweiss Investment Advisors Private Limited ("EIAPL") (Co. Reg. No. 201016306H) which is a holder of a capital markets services license and an exempt financial adviser in Singapore and (ii) solely to persons who qualify as "institutional investors" or "accredited investors" as defined in section 4A(1) of the Securities and Futures Act, Chapter 289 of Singapore ("the SFA"). Pursuant to regulations 33, 34, 35 and 36 of the Financial Advisers Regulations ("FAR"), sections 25, 27 and 36 of the Financial Advisers Act, Chapter 110 of Singapore shall not apply to EIAPL when providing any financial advisory services to an accredited investor (as defined in regulation 36 of the FAR. Persons in Singapore should contact EIAPL in respect of any matter arising from, or in connection with this publication/communication. This report is not suitable for private investors.
Copyright 2009 Edelweiss Research (Edelweiss Securities Ltd). All rights reserved