it services sector - phillipcapitalbackoffice.phillipcapital.in/backoffice/research... · it...
TRANSCRIPT

Please refer to Disclosures and Disclaimers at the end of the Research Report
IT Services Sector CONQUERING EUROPE – THE NEXT FRONTIER
SECTOR UPDATE 25 February 2014
PhillipCapital (India) Pvt. Ltd.
Industry inputs suggest that European companies, which were previously reluctant to outsource their IT operations, are now opening up to the idea. Faced with a declining demand environment, input cost pressures and regulatory challenges, these companies are expected to seek newer avenues of cutting costs – outsourcing IT being one – leading to newer growth avenues for Indian IT companies and making Europe the next frontier to be conquered.
Over 70% of top 143 companies yet to offshore – US$ 52bn potential opportunity Our analysis of 143 companies in the EU region – comprising top 10‐12 by capex spend in each country across 20 countries and 6 verticals – revealed that 33 companies or 23% have never outsourced their IT operations. Of the remaining 110 companies, 66 (46% of the total) have outsourced, but not offshored. Put together, 99 companies (70% of the total) have not outsourced or offshored their IT operations – presenting a HUGE opportunity for Indian IT vendors.
We estimate the IT capex for these 143 companies at around US$ 85bn. Of this, we see the capex of the “Never Outsourced” category at US$ 18bn and the “Never Offshored” at US$ 34bn. Put together, these companies present a US$ 52bn opportunity for Indian IT vendors.
Biggest opportunity: Germany, France. Massively underpenetrated: Italy, CEE Our analysis revealed that Italy and CEE (Central & Eastern Europe) remain the most underpenetrated — with none of the companies having outsourced/offshored their IT operations; in the bigger economies of Germany, France and UK the number stands at 74%, 72% and 50%, respectively.
Germany and France represent the largest IT opportunity at US$ 11bn and US$ 10bn. Italy and Spain come in next at US$ 9.5bn and US$ 5.5bn. Although largely penetrated, UK and Switzerland still present significant opportunity at US$ 5bn and US$ 3bn.
Biggest opportunity: Retail‐CPG; BFSI still offers huge potential Retail‐CPG and healthcare remain the most underpenetrated verticals, with 88% and 65% of companies having never outsourced/offshored. While we see retail‐CPG offering a mammoth US$ 17bn opportunity, telecom offers US$ 9bn. But the healthcare opportunity remains small at US$ 0.5bn. While BFSI remains the most penetrated with over 40% companies having already outsourced, it still represents an opportunity of US$ 11bn.
TCS, HCL Tech and Tech Mahindra to benefit the most EU comprises almost a third of the revenues of the top‐5 Indian IT vendors. While Tech Mahindra has been growing at CQGR of 7% in the region (excluding BT), Wipro has been the laggard (2.6% CQGR). TCS has grabbed the maximum number of large deals over the last three years. In almost all the countries we looked at, HCL Tech remains the second‐most active player (after TCS), apart from Spain, Benelux and CEE – where Infosys has made much deeper inroads.
We expect TCS, HCL Tech and Tech Mahindra to benefit most from the opening up of the EU region to outsourcing as they have built strong relationships and delivery capabilities in the region and are expanding aggressively. We see them outperforming the other two (Infosys and Wipro) over the next two years. We maintain our BUY ratings on Tech Mahindra (top pick), HCL Tech and TCS and remain NEUTRAL on Infosys and Wipro.
Companies Covered Tata Consultancy Services CMP Rs2178Reco BUYTarget Price Rs2600Upside 19% HCL Technologies CMP Rs1531Reco BUYTarget Price Rs1680Upside 10% Infosys CMP Rs3751Reco NEUTRALTarget Price Rs3460Downside ‐8% Wipro CMP Rs578Reco NEUTRALTarget Price Rs540Upside ‐6% Tech Mahindra CMP Rs1830Reco BUYTarget Price Rs2300Upside 26% Relative Positioning (FY15E)
Vibhor Singhal (+ 9122 6667 9949) [email protected] Varun Vijayan (+ 9122 6667 9992) [email protected]
TCS
Infy
HCL
Wipro
TechM
12
13
14
15
16
17
18
19
10 15 20 25 30
P/E (X)
EPS grwth (%)

2 of 48
25 February 2014 / INDIA EQUITY RESEARCH / IT SERVICES SECTOR UPDATE
Key Charts in the report
Key Verticals – Opportunity and companies with strong presence
Key Geographies – Opportunity and companies with strong presence
Relative positioning in the EU region
Source: PhillipCapital India Research
0
5
10
15
20
25
30
35
Telecom Mfg BFSI Retail, TTL E&U HC & LS
$, bn
Fully outsourcedNot offshoredNever outsourced
$8.9b$7.4b
$11b$16.9b
$7.6b
$0.5b
&CPG
TECM, TCS, Wipro HCLT, INFY,
TCS
TCS, INFY
TCS, TECM, HCLT
Wipro, TCS
HCLT, TCS
8.4 6.2 5.93.1 1.2
4.7 3.60
5
10
15
20
25
30
UK
Germany
France
Italy
Scandinavi
a
Spain &
Portugal
Switzerlan
d
Bene
lux
C&E
Europe
$, bn
Fully outsourcedNot offshoredNever outsourced
$1.4b$5.7b $2.9b $4.4b
$1.5b
$9.6b
$10.6b$11.3b
$4.7b
ALL TOP‐5
TCS, HCLT
TCS, HCLT TCS,
HCLT, TECM
TCS, INFY
INFYALLTOP‐5
TECM, INFY, TCS
INFY, TCS
$1.4b$5.7b $2.9b $4.4b
$1.5b
$9.6b
$10.6b$11.3b
$4.7b
TCS
HCL TechInfosys
Wipro
Tech M
0
5
10
15
20
25
30
35
40
45
50
4 5 6 7 8 9 10 11 12 13
Strength in
term
s of d
eals won
‐‐>
Strength in terms of presence in Europe‐‐>

3 of 48
25 February 2014 / INDIA EQUITY RESEARCH / IT SERVICES SECTOR UPDATE
Table of Contents The Next Frontier – Ready to be conquered ∙∙∙∙∙∙∙∙∙∙∙∙∙∙∙∙∙∙∙∙∙∙∙∙∙∙∙∙∙∙∙∙∙∙∙∙∙∙∙∙∙∙∙∙∙∙∙∙∙∙∙∙∙∙∙∙∙∙∙∙∙ 4
Deal flow remains strong ∙∙∙∙∙∙∙∙∙∙∙∙∙∙∙∙∙∙∙∙∙∙∙∙∙∙∙∙∙∙∙∙∙∙∙∙∙∙∙∙∙∙∙∙∙∙∙∙∙∙∙∙∙∙∙∙∙∙∙∙∙∙∙∙∙∙∙∙∙∙∙∙∙∙∙∙∙∙∙∙∙∙∙∙∙∙∙∙∙ 7
Need to transform legacy systems ‐ Imminent ∙∙∙∙∙∙∙∙∙∙∙∙∙∙∙∙∙∙∙∙∙∙∙∙∙∙∙∙∙∙∙∙∙∙∙∙∙∙∙∙∙∙∙∙∙∙∙∙∙∙∙∙∙∙∙∙∙∙ 9
Advent of new technologies (SMAC) ∙∙∙∙∙∙∙∙∙∙∙∙∙∙∙∙∙∙∙∙∙∙∙∙∙∙∙∙∙∙∙∙∙∙∙∙∙∙∙∙∙∙∙∙∙∙∙∙∙∙∙∙∙∙∙∙∙∙∙∙∙∙∙∙∙∙∙∙∙∙∙∙∙ 10
Early bird advantage – TCS, HCL tech, Tech Mahindra ∙∙∙∙∙∙∙∙∙∙∙∙∙∙∙∙∙∙∙∙∙∙∙∙∙∙∙∙∙∙∙∙∙∙∙∙∙∙∙∙∙∙∙∙∙∙∙ 29
Country Section United Kingdom – Well penetrated ∙∙∙∙∙∙∙∙∙∙∙∙∙∙∙∙∙∙∙∙∙∙∙∙∙∙∙∙∙∙∙∙∙∙∙∙∙∙∙∙∙∙∙∙∙∙∙∙∙∙∙∙∙∙∙∙∙∙∙∙∙∙∙∙∙∙∙∙∙∙∙∙∙∙∙ 11
Germany – There’s more left on the table ∙∙∙∙∙∙∙∙∙∙∙∙∙∙∙∙∙∙∙∙∙∙∙∙∙∙∙∙∙∙∙∙∙∙∙∙∙∙∙∙∙∙∙∙∙∙∙∙∙∙∙∙∙∙∙∙∙∙∙∙∙∙∙∙ 13
France – Mammoth opportunity ∙∙∙∙∙∙∙∙∙∙∙∙∙∙∙∙∙∙∙∙∙∙∙∙∙∙∙∙∙∙∙∙∙∙∙∙∙∙∙∙∙∙∙∙∙∙∙∙∙∙∙∙∙∙∙∙∙∙∙∙∙∙∙∙∙∙∙∙∙∙∙∙∙∙∙∙∙∙∙ 15
Switzerland – Well penetrated ∙∙∙∙∙∙∙∙∙∙∙∙∙∙∙∙∙∙∙∙∙∙∙∙∙∙∙∙∙∙∙∙∙∙∙∙∙∙∙∙∙∙∙∙∙∙∙∙∙∙∙∙∙∙∙∙∙∙∙∙∙∙∙∙∙∙∙∙∙∙∙∙∙∙∙∙∙∙∙∙∙∙ 17
Scandinavia – Catching up fast ∙∙∙∙∙∙∙∙∙∙∙∙∙∙∙∙∙∙∙∙∙∙∙∙∙∙∙∙∙∙∙∙∙∙∙∙∙∙∙∙∙∙∙∙∙∙∙∙∙∙∙∙∙∙∙∙∙∙∙∙∙∙∙∙∙∙∙∙∙∙∙∙∙∙∙∙∙∙∙∙∙∙ 19
Benelux – Small, yet big ∙∙∙∙∙∙∙∙∙∙∙∙∙∙∙∙∙∙∙∙∙∙∙∙∙∙∙∙∙∙∙∙∙∙∙∙∙∙∙∙∙∙∙∙∙∙∙∙∙∙∙∙∙∙∙∙∙∙∙∙∙∙∙∙∙∙∙∙∙∙∙∙∙∙∙∙∙∙∙∙∙∙∙∙∙∙∙∙∙∙∙∙ 21
Italy – Highly underpenetrated ∙∙∙∙∙∙∙∙∙∙∙∙∙∙∙∙∙∙∙∙∙∙∙∙∙∙∙∙∙∙∙∙∙∙∙∙∙∙∙∙∙∙∙∙∙∙∙∙∙∙∙∙∙∙∙∙∙∙∙∙∙∙∙∙∙∙∙∙∙∙∙∙∙∙∙∙∙∙∙∙∙∙ 23
Spain & Portugal – Immense potential ∙∙∙∙∙∙∙∙∙∙∙∙∙∙∙∙∙∙∙∙∙∙∙∙∙∙∙∙∙∙∙∙∙∙∙∙∙∙∙∙∙∙∙∙∙∙∙∙∙∙∙∙∙∙∙∙∙∙∙∙∙∙∙∙∙∙∙∙∙∙ 25
Central & Eastern Europe (CEE) – The dark horse ∙∙∙∙∙∙∙∙∙∙∙∙∙∙∙∙∙∙∙∙∙∙∙∙∙∙∙∙∙∙∙∙∙∙∙∙∙∙∙∙∙∙∙∙∙∙∙∙∙∙∙∙∙ 27
Companies Section Tata Consultancy Services ∙∙∙∙∙∙∙∙∙∙∙∙∙∙∙∙∙∙∙∙∙∙∙∙∙∙∙∙∙∙∙∙∙∙∙∙∙∙∙∙∙∙∙∙∙∙∙∙∙∙∙∙∙∙∙∙∙∙∙∙∙∙∙∙∙∙∙∙∙∙∙∙∙∙∙∙∙∙∙∙∙∙∙∙∙∙∙∙∙ 32
HCL Technologies ∙∙∙∙∙∙∙∙∙∙∙∙∙∙∙∙∙∙∙∙∙∙∙∙∙∙∙∙∙∙∙∙∙∙∙∙∙∙∙∙∙∙∙∙∙∙∙∙∙∙∙∙∙∙∙∙∙∙∙∙∙∙∙∙∙∙∙∙∙∙∙∙∙∙∙∙∙∙∙∙∙∙∙∙∙∙∙∙∙∙∙∙∙∙∙∙∙∙∙∙∙∙ 35
Infosys ∙∙∙∙∙∙∙∙∙∙∙∙∙∙∙∙∙∙∙∙∙∙∙∙∙∙∙∙∙∙∙∙∙∙∙∙∙∙∙∙∙∙∙∙∙∙∙∙∙∙∙∙∙∙∙∙∙∙∙∙∙∙∙∙∙∙∙∙∙∙∙∙∙∙∙∙∙∙∙∙∙∙∙∙∙∙∙∙∙∙∙∙∙∙∙∙∙∙∙∙∙∙∙∙∙∙∙∙∙∙∙∙∙∙∙∙∙∙ 38
Wipro ∙∙∙∙∙∙∙∙∙∙∙∙∙∙∙∙∙∙∙∙∙∙∙∙∙∙∙∙∙∙∙∙∙∙∙∙∙∙∙∙∙∙∙∙∙∙∙∙∙∙∙∙∙∙∙∙∙∙∙∙∙∙∙∙∙∙∙∙∙∙∙∙∙∙∙∙∙∙∙∙∙∙∙∙∙∙∙∙∙∙∙∙∙∙∙∙∙∙∙∙∙∙∙∙∙∙∙∙∙∙∙∙∙∙∙∙∙∙∙∙∙ 41
Tech Mahindra ∙∙∙∙∙∙∙∙∙∙∙∙∙∙∙∙∙∙∙∙∙∙∙∙∙∙∙∙∙∙∙∙∙∙∙∙∙∙∙∙∙∙∙∙∙∙∙∙∙∙∙∙∙∙∙∙∙∙∙∙∙∙∙∙∙∙∙∙∙∙∙∙∙∙∙∙∙∙∙∙∙∙∙∙∙∙∙∙∙∙∙∙∙∙∙∙∙∙∙∙∙∙∙∙∙∙∙ 44

4 of 48
25 February 2014 / INDIA EQUITY RESEARCH / IT SERVICES SECTOR UPDATE
The Next Frontier – Ready to be conquered According to various IT companies, consultants and experts, European companies, which were formerly reluctant about outsourcing, are now opening up to the idea. Faced with a declining demand environment, input cost pressures and regulatory challenges, the companies are seeking newer avenues of cutting costs – outsourcing IT being one of them. Not only are new companies expected to join the outsourcing bandwagon, but companies that have already outsourced their IT operations are expected to step it up and diversify their vendor base. All this is expected to bring forth the EU region as a new frontier for Indian IT companies. Powered by their lower cost models and superior delivery capabilities, we see Indian IT vendors grabbing market share from their MNC peers (especially from local vendors such as Cap‐Gemini and Atos Origin). Over 70% of companies we analysed yet to offshore from the region Our analysis of 143 companies in the EU region – across 20 countries and 6 verticals – reveals that 33 of these companies (23% of the total) have never outsourced their IT operations. Of the remaining 110 companies, 66 (46% of the total) have outsourced, but not offshored their IT operations and development work. Put together, 99 companies (70% of the total) have not outsourced/offshored their IT operations – presenting HUGE opportunity for the Indian IT vendors. Quantifying the opportunity, we find that the total capex outlay for the 143 companies stands at US$ 508bn for CY14, out of which we conservatively expect the IT capex to be US$ 85bn. Of this, we estimate IT capex for the “Never Outsourced” category at US$ 18bn and for the “Never Offshored” companies at US$ 34bn. Thus, in our opinion, these companies present a US$ 52bn IT opportunity for Indian IT vendors. Huge opportunity awaits Indian IT vendors
Source: PhillipCapital India Research Germany and France present the biggest opportunity; Italy and CEE massively underpenetrated We find that Italy and CEE (Central & Eastern Europe) remain the most underpenetrated countries, with none of the companies having outsourced/offshored their IT operations (12 and 10 top companies analysed in the regions, respectively). Amongst bigger economies, Germany, France and Spain have 74%, 72% and 92% companies falling in the same bracket (never outsourced/ offshored). As expected, UK, Switzerland and Scandinavia remain the most penetrated.
44
33.1
66
33.9
33
18.3
0 20 40 60 80 100 120 140 160
Number of companies
IT spend in the region ($bn)
Fully outsourcedNot offshoredNever outsourced
Over 70% of the 143 companies analysed are yet to outsource/offshore their IT operations – representing a huge US$52bn opportunity
The 143 companies that we looked at are the top 10‐12 by capex spend in each country and are all part of the EuroStoxx 600

5 of 48
25 February 2014 / INDIA EQUITY RESEARCH / IT SERVICES SECTOR UPDATE
No of companies yet to outsource in each country The potential IT opportunity in each country
Source: PhillipCapital India Research
Financially, we find that Germany and France represent the largest IT opportunity at US$ 11bn and US$ 10bn; Italy and Spain come next with a potential of US$ 9.5bn and US$ 5.5bn. UK and Switzerland – though largely penetrated – still present significant opportunity at US$ 5bn and US$ 3bn. Biggest opportunity: Retail‐CPG; BFSI still offers huge potential Among verticals, we find that Retail‐CPG (Consumer Packaged Goods) and healthcare are the most underpenetrated, with 88% and 65% of companies having never outsourced/offshored their IT operations. BFSI (Banking, Financial services and Insurance) remains the most penetrated with over 40% companies having already offshored their IT operations. Telecom, Manufacturing and E&U also represent a sizeable opportunity. Financially, Retail‐CPG represents a mammoth US$ 17bn opportunity, followed by US$ 9bn in Telecom. Although BFSI is already well penetrated, it still represents a large opportunity of US$ 11bn; conversely while healthcare is still very much underpenetrated, it represents only a small US$ 0.5bn opportunity for offshoring.
No of companies yet to outsource in each vertical The potential IT opportunity in each vertical
Source: PhillipCapital India Research
14
5 7 71
5 50
5
10
15
20
25
30
UK
Germany
France
Italy
Scandinavia
Spain & Portugal
Switzerland
Bene
lux
C&E Europe
Fully outsourced Not offshored Never outsourced14
14
18
126 11 7 7
10
8.46.2 5.9
3.11.2
4.7 3.6
0
2
4
6
8
10
12
14
16
18
20
UK
Germany
France
Italy
Scandinavia
Spain &
Portugal
Switzerland
Bene
lux
C&E Europe
$, bn
Fully outsourced Not offshored Never outsourced
$1.4b
$5.7b $2.9b $4.4b
$1.5b
$9.6b
$10.6b$11.3b
$4.7b
7 610
3
117
0
5
10
15
20
25
30
35
Telecom Mfg BFSI Retail, TTL E&U HC & LS
Fully outsourced Not offshored Never outsourced
15 1614 21
20
13
&CPG
0
5
10
15
20
25
Telecom Mfg BFSI Retail, TTL E&U HC & LS
$, bn
Fully outsourced Not offshored Never outsourced
$8.9b$7.4b
$11b
$16.9b
$7.6b
$0.5b
&CPG

6 of 48
25 February 2014 / INDIA EQUITY RESEARCH / IT SERVICES SECTOR UPDATE
The who’s who of potential targets in each country (descending order of capex) UK Germany France Italy Switzerland Vodafone Group PLC Volkswagen AG Societe Generale SA Exor SpA Nestle SA Lloyds Banking Group PLC Deutsche Telekom AG Orange SA Fiat SpA Glencore Xstrata PLC BP PLC Deutsche Post AG Christian Dior SA Telecom Italia SpA Credit Suisse Group AG RBS Group PLC Daimler AG Louis Vuitton SA Eni SpA Cie Financiere Richemont SA BT Group PLC Deutsche Lufthansa AG Total SA Enel SpA UBS AG ICA Group Siemens AG L'Oreal SA UniCredit SpA ABB Ltd Kingfisher PLC BMW AG Vivendi SA Luxottica Group SpA Swisscom AG Marks & Spencer Group PLC Allianz SE BNP Paribas SA Finmeccanica SpA Swatch Group AG/The Barclays PLC E.ON SE EADS Mediaset SpA Novartis AG CNH Industrial NV Henkel AG & Co KGaA Peugeot SA Saipem SpA Roche Holding AG BHP Billiton PLC Adidas AG Renault SA Snam SpA Galenica AG Firstgroup PLC Continental AG GDF Suez Terna Rete Elettrica Nazionale Actelion Ltd Spain & Portugal Scandinavia Benelux Central & Eastern Europe Telefonica SA Ericsson Telekom Royal Dutch Shell PLC Erste Group Bank AG Banco Santander SA Hennes & Mauritz AB Unilever NV OMV AG Banco Bilbao Vizcaya Argentaria Telenor ASA Delhaize Group SA OPAP SA Inditex SA Statoil ASA Heineken NV Telekom Austria AG Repsol SA TeliaSonera AB Koninklijke KPN NV Hellenic Telecom Organization Banco Espirito Santo SA DNB ASA KBC Groep NV Vienna Insurance Portugal Telecom SGPS SA Volvo AB ArcelorMittal Andritz AG Iberdrola SA Tele2 AB Belgacom SA Voestalpine AG Endesa SA Scania AB ING Groep NV CEZ AS Gas Natural SDG SA Novo Nordisk A/S SES SA Komercni Banka AS Galp Energia SGPS SA Vestas Wind Systems A/S Koninklijke Vopak NV Grifols SA Meda AB UCB SA Never Outsourced Not offshored
The who’s who of potential targets in each vertical (descending order of capex) Telecom Manufacturing BFSI Deutsche Telekom AG Volkswagen AG Exor SpA Telefonica SA Daimler AG Societe Generale SA Vodafone Group PLC Fiat SpA Lloyds Banking Group PLC Orange SA Siemens AG Banco Santander SA Ericsson BMW AG RBS Group PLC Telecom Italia SpA EADS BNP Paribas SA Vivendi SA Peugeot SA Allianz SE BT Group PLC Renault SA Credit Suisse Group AG Telenor ASA Continental AG UniCredit SpA Koninklijke KPN NV Volvo AB UBS AG TeliaSonera AB CNH Industrial NV KBC Groep NV Swisscom AG BAE Systems PLC DNB ASA Retail, TTL & CPG E&U Healthcare & Life Sciences Deutsche Post AG Royal Dutch Shell PLC Novartis AG Christian Dior SA BP PLC Bayer AG Louis Vuitton SA Glencore Xstrata PLC Roche Holding AG Deutsche Lufthansa AG Total SA Sanofi L'Oreal SA E.ON SE GlaxoSmithKline PLC ICA Group Eni SpA Celesio AG Inditex SA GDF Suez AstraZeneca PLC Henkel AG & Co KGaA Enel SpA Novo Nordisk A/S Nestle SA Electricite de France Merck KGaA Unilever NV Statoil ASA Shire PLC Delhaize Group SA RWE AG UCB SA Heineken NV BHP Billiton PLC Grifols SA Never Outsourced Not offshored Source: PhillipCapital India Research

7 of 48
25 February 2014 / INDIA EQUITY RESEARCH / IT SERVICES SECTOR UPDATE
Deal flow remains strong The past two years have seen a surge in outsourcing deals from Europe, with SMEs (small and medium enterprises) taking the lead. Given the recent economic downturn, we believe that the major drivers for the deals signed in 2011‐13 were cost optimization and regulatory challenges. ‘Interference’ of ‘disruptive’ technologies in the business model have also influenced the decision on spends for most of these companies.
European contract wins in the last 10 years.. ….. and last twelve quarters
Source: ISG
We believe that the change in the European companies’ stance towards outsourcing will lead to a potential windfall for those Indian IT vendors with strong offshoring capabilities. TCS already has a significant presence in all key geographies and is expanding aggressively across verticals. HCL Tech and Tech Mahindra have individually gained critical mass in their respective domains (IMS and telecom) in major European markets and continue to acquire large‐sized deals to expand their reach across the region.
Recent first time outsourcers from the EU region Date Companies Sector Country Outsourced to Major Service opted 19‐Dec‐13 Orange SA Telco France Igate IMS 3‐Oct‐13 KBC Group Bank Benelux Cognizant IMS 10‐Sep‐13 Continental CV Manufacturer Germany IBM Connected solutions 20‐Aug‐13 Finmeccanica Aerospace Italy Northgate Arinso HR & Payroll 29‐Jul‐13 Orion Pharma Scandinavia HP Managed Services+Cloud 5‐Jul‐13 OPAP SA Telco Greece Intralot IMS & ICT 10‐Jan‐13 Luxottica Retail Italy HP Datacenter Mgmt
Source: Company, PhillipCapital India Research Recent deal wins indicate an increased trend in outsourcing IT infrastructure, even as discretionary related application projects are yet to open up for RFPs (Request for Proposals). This places Infosys and Wipro on the back foot vs. peers in the region. Top‐5 Indian IT vendors won ~US$4.5bn TCV (total contract value) worth of large deals from Europe in 2013.
5.6 5.5 6.3 4.8 5.6 7.8 8.1 8.6 9.3 8.7 8.2
215 231 226256 247
337
431 432
525498
587
0
100
200
300
400
500
600
700
0
1
2
3
4
5
6
7
8
9
10
2003
CY04
CY05
CY06
CY07
CY08
CY09
CY10
CY11
CY12
CY13
Eur, bn
EMEA contract ‐ACVsNo of deals from EMEA
1.71.3 1.2
1.71.3 1.4 1.4 1.3
0.81.2
1.51.2
0.6
0.6
1.3
1.3
0.6 0.60.9
0.6
0.7
0.8
1.3
0.8
0.0
0.5
1.0
1.5
2.0
2.5
3.0
3.5
1Q'11
2Q'11
3Q'11
4Q'11
1Q'12
2Q'12
3Q'12
4Q'12
1Q'13
2Q'13
3Q'13
4Q'13
Eur, bn
New scope deals (ACV)
Restructuring deals (ACV)

8 of 48
25 February 2014 / INDIA EQUITY RESEARCH / IT SERVICES SECTOR UPDATE
Recent deal wins by Indian Top‐5 IT companies Date Companies Sector Country IT Vendor Major Service opted 31‐Dec‐13 Student Loan Co PU UK HCL Tech SI + IT services 26‐Nov‐13 DNB FS Norway HCL Tech Banking services 10‐Sep‐13 Anglo American PLC E&U UK HCL Tech IMS + Data center + Security 24‐Jun‐13 Vestas Wind Systems Manuf Denmark HCL Tech ADM + consulting 16‐May‐13 Husqvarna Group Manuf Sweden HCL Tech Managed Services 11‐Feb‐13 Saint Gobain Manuf France HCL Tech IMS 30‐Jan‐13 Cobham PLC Manuf UK HCL Tech ER&D services 13‐Feb‐14 Royal Philips Tech Netherlands Infosys F&A and procurement (BPO) 28‐Jan‐14 TNT express TTL Netherlands Infosys ADM Services 30‐Sep‐13 RBS FS UK Infosys ADM + Finacle 12‐Sep‐13 Akzo Nobel Retail Netherlands Infosys F&A processes 16‐Apr‐13 Queens University PU UK Infosys Security services 2‐Apr‐13 RWE Supply E&U Germany Infosys IT partner 14‐Mar‐13 BMW Manuf Germany Infosys IMS + BI 7‐Mar‐13 Accor Retail France Infosys CommercEdge 20‐Feb‐14 Diageo CPG UK TCS IMS 28‐Nov‐13 Npower ‐ RWE E&U UK TCS Customer services 26‐Nov‐13 Keler, CSD PU Hungary TCS TCS BaNCS 21‐Oct‐13 Bombardier Transportation TTL Germany TCS TCS BaNCS 10‐Sep‐13 Scandinavian Airlines TTL Scandinavia TCS Managed Services+Cloud 3‐Sep‐13 DNB FS Norway TCS ADM + Managed Services 25‐Mar‐13 Norway Post PU Norway TCS Strategic IT partner 17‐Jan‐13 Nokia Telco Finland TCS Global IT partner 27‐Jan‐14 Cambridge University Press Others UK Tech M SAP rollout + ES 13‐Sep‐13 Volvo Manuf Sweden Tech M ADM + PLM 5‐Aug‐13 BASE Company ‐ KPN Telco Belgium Tech M Managed Services 24‐Jul‐13 UBS Fund Services FS Luxembourg Tech M Managed Data services 6‐Jun‐13 Bridgestone Europe Manuf Belgium Tech M Managed Services + ES 3‐Sep‐13 Deutsche Bank FS Germany Wipro AMS
Source: BSE Archives, Company A large part of existing projects in Europe are expected to come up for renewal by the end of FY15. According to Ovum Research, ~US$ 47bn of existing outsourced contracts will come up for renewal in the first half of 2015: • Government projects TCV: ~US$ 12bn • Manufacturing: ~US$ 7.9bn • Services: ~US$5.2bn • Telecom: ~US$4.4bn We expect the Indian IT service vendors to capture large part of these contract renewal deals on the back of their lower cost structure and similar delivery capabilities (as compared to the existing MNC vendors).
9 of 48
25 February 2014 / INDIA EQUITY RESEARCH / IT SERVICES SECTOR UPDATE
Need to transform legacy systems – Imminent A survey conducted by market research firm International Data Corporation (IDC) noted that over 80% companies globally still have legacy systems/platforms employed for more than 10 years. In today’s fast‐changing technology landscape, companies are forced to change their IT model to match the needs of their shifting business models. To this end, legacy systems, which are complex to transform, are a major obstacle. We expect a surge in rebids for legacy transformation contracts in the US to be followed by those in Europe. After the European debt crisis, most industries are facing challenges in achieving cost efficiencies and meeting regulatory/compliance requirements. This pushes the need for intuitive and viable platforms that are simple in structure, easy to transform and lucrative. According to various IT vendors, so far, large companies that have spent huge money to build their legacy systems fear that the change needed in their IT infrastructure will be costlier than maintaining or customizing their existing systems. We believe that now that these companies are forced to prioritize cost efficiencies and adapt to changing business models, their outlook will change and they will be more open to transforming their legacy systems. Besides, it is becoming more cost effective to change the legacy system instead of going on pouring money into customizing outdated systems to meet fast‐changing IT needs. In a survey, Gartner suggests that transforming a legacy system to a new and simplified platform (preferably in Cloud/Cloud‐as‐a‐Service) would in fact effectively lower the operating and maintenance costs by close to 10% of a companies’ IT budget. Gartner & Forrester estimate that out of a company’s average IT spend ~75% is allocated to maintain/operate the existing legacy systems, making it costly for these companies to participate in R&D and innovations. Companies who have legacy systems face these major obstacles: • Technological inflexibility: Legacy systems have complex structures and coding,
which are hard to adapt to changing business models. • Business (un)intelligence: These systems are not able to consolidate/rationalize
transactional and operational data from ongoing processes in multiple systems. • Skill shortage: Very simply, it’s hard to find people who can work on these outdated
systems in today’s changing technological landscape and customizing the existing legacy systems becomes unprofitable too — a well‐trained IT skill costs a minimum of US$ 90,000/annum and additional training costs about 1%‐2% of sales.
• Costly: Incremental phases in existing legacy systems (change in IT topology in tune to the change in business model) require additional mainframe support and even a mid‐sized mainframe costs more than US$ 5mn, thus increasing the total cost of ownership (TCO) of a migration project and reducing the RoI.
Most industries will have to opt for transforming their legacy systems as they are facing challenges in achieving cost efficiencies and meeting regulatory/compliance requirements

10 of 48
25 February 2014 / INDIA EQUITY RESEARCH / IT SERVICES SECTOR UPDATE
Advent of new technologies (SMAC) The advent of new technologies — SMAC — has created a strong wave of change in the basic business model and in the day‐to‐day operations of companies worldwide. SMEs all over the globe across industries have been more receptive to these technologies as their returns to IT spends are higher vs. the older ones (in terms of capex). These disruptive technologies enable companies to transition its business model from a product‐oriented approach to customer‐oriented sales and marketing. We note that SMAC services are lucrative and easily scalable in‐line with the needs of each company, promising optimum level of utilizations for investments on these services. The SMAC factor – Huge growth opportunity
Source: Gartner, Forrester, IDC estimates Recent market study by research firms such as Gartner, Forrester and IDC, indicate that SMAC technologies would replace the existing traditional business model, bringing in more outcome‐based lucrative deals to the table. Globally addressable quantum of IT spends for Indian IT vendors on SMAC would reach ~US$ 225bn by 2020. Also, we note that the regulators in these countries are now becoming more flexible and amenable to new technologies. Recently, the financial regulator of Holland gave the financial institutions of the country approval to explore ‘external cloud’ as an option to migrate their legacy platforms. We expect similar initiatives by regulatory bodies across the region in coming years and the Indian IT vendors should benefit from this.
37
150
53140
2 2572
700
0
200
400
600
800
1000
2013 2020E 2013 2020E 2013 2020E 2013 2020E
($ bn)
Social Media Mobility Big Data Cloud

11 of 48
25 February 2014 / INDIA EQUITY RESEARCH / IT SERVICES SECTOR UPDATE
United Kingdom – Well penetrated GDP: US$ 2,489.7bn Population: 63.8mn Top companies that have never outsourced: CNH Industrial, Ryanair, BTG plc Top companies that have not offshored: Lloyds Banking, Kingfisher, BHP Billiton Indian IT Companies with strong presence: All Top‐5 Main sectors that can outsource: Retail, manufacturing Trivia: UK is the largest outsourcer from the EU region UK is the second largest economy in Europe (GDP of US$ 2.5trn) and is a fairly distributed market for all industries from services to manufacturing. Top spenders in this region have opted for outsourcing and more than 50% of the companies have fully outsourced as well as offshored their mission‐critical business processes. The top‐5 spenders in the region who are fully outsourced/offshored are Vodafone, BP, RBS, BT Group and British Airways (ICA).
Deals awarded to top‐5 Indian companies in the last 12 months Date Companies Sector Country Outsourced to Major Service opted 20‐Feb‐14 Diageo CPG UK TCS IMS 27‐Jan‐14 Cambridge University Press Others UK Tech M SAP rollout + ES 31‐Dec‐13 Student Loan Co PU UK HCL Tech SI + IT services 28‐Nov‐13 Npower ‐ RWE E&U UK TCS Customer services 30‐Sep‐13 RBS FS UK Infosys ADM + Finacle 10‐Sep‐13 Anglo American PLC E&U UK HCL Tech IMS + Data center + Security 16‐Apr‐13 Queens University PU UK Infosys Security services 30‐Jan‐13 Cobham PLC Manuf UK HCL Tech ER&D services
Source: Company, PhillipCapital India Research The potential opportunity from the region
Source: PhillipCapital India Research Analysing the outsourcing pattern in the region, we found that verticals such as telecom, E&U (energy and utilities), and banks have been fairly open to outsourcing and offshoring their IT operations, while verticals such as manufacturing, retail, TTL (transport, travel, and logistics), and healthcare are reluctant to offshore, and some are yet to even outsource their IT needs.
14
8.4
10
4.2
4
0.6
0 5 10 15 20 25 30
Number of companies
IT spend in the region ($bn)
Fully outsourced
Not offshored
Never outsourced
Even though UK largely penetrated, we see a further potential of almost US$ 5bn from this region from its top spenders

12 of 48
25 February 2014 / INDIA EQUITY RESEARCH / IT SERVICES SECTOR UPDATE
The who’s who of the potential target from the region Companies CAPEX IT Capex Sector Vodafone Group PLC 14,221 2,204 Telecom Lloyds Banking Group PLC 4,797 1,919 Banks BP PLC 24,687 1,690 Oil&Gas Royal Bank of Scotland Group PLC 2,371 948 Banks BT Group PLC 4,041 892 Telecom International Consolidated Airlines Group 2,633 820 Airlines Kingfisher PLC 594 564 Retail Marks & Spencer Group PLC 899 530 Retail Barclays PLC 965 386 Banks CNH Industrial NV 1,631 366 Machinery‐Diversified BHP Billiton PLC 13,330 358 Mining Firstgroup PLC 649 317 Transportation Source: PhillipCapital India Research According to our analysis, top‐5 Indian IT vendors have a strong presence in the UK. Within Europe, UK companies were the first to open up to offshoring, and Indian IT companies won large deals even while competing with MNCs. Companies such as Tech Mahindra and Infosys were codependent on BT (British Telecom) contracts for their growth in the telecom space from Europe in the last decade. TCS was the first to be selected for offshoring by UK’s government/public owned utilities (large deals close to US$ 300mn TCV) and continues to build a strong brand value among UK’s PSUs. The overall addressable potential from this region is close to ~US$ 4.7bn in revenues among the top spenders.
Deal share in the region (Top‐5) Vertical‐wise spread of the deals awarded
Source: PhillipCapital India Research; #Note that we have taken 52 deals for analysing the deal share pie.
TCS, 34%
Infosys, 16%HCL Tech,
21%
Wipro, 15%
Tech M, 13%UK FS, 10%
E&U, 18%
Retail + TTL, 14%
PU, 10%Manuf, 10%
Telco, 14%
HC & LS, 16%
Others, 10%UK
Never outsourced Not offshored
TCS continues to build a strong brand value among UK’s PSUs

13 of 48
25 February 2014 / INDIA EQUITY RESEARCH / IT SERVICES SECTOR UPDATE
Germany – There’s more left on the table GDP: US$ 3,593.2bn Population: 81.8mn Top companies that have never outsourced: Deutsche Telekom, Telefonica Top companies that have not offshored: Deutsche Post, Lufthansa, Siemens, Adidas Indian IT Companies with strong presence: TCS, HCL Tech Main sectors that can outsource: Telecom, Manufacturing Trivia: Manufacturing hub; auto sector is huge, but already exploited Germany is the largest economy in Europe with a GDP of US$ 3.6trn – a hub for banking, manufacturing (mainly automobiles and aerospace), and capital goods engineering. While a fair portion of the top spenders in this region have outsourced their mission‐critical business processes, they remain reluctant to offshore. Companies such as TCS, Wipro and Infosys remain strong in the region with large‐sized deals and long‐term relationships. The top‐5 spenders in Germany who are fully outsourced and offshored are Volkswagen, Daimler, BMW, RWE and Bayer – mostly automobile OEMs.
Deals awarded to top‐5 Indian IT companies in last 12 months Date Companies Sector Country Outsourced to Major Service opted 21‐Oct‐13 Bombardier Transportation TTL Germany TCS TCS BaNCS 3‐Sep‐13 Deutsche Bank FS Germany Wipro AMS 2‐Apr‐13 RWE Supply E&U Germany Infosys IT partner 14‐Mar‐13 BMW Manuf Germany Infosys IMS + BI
Source: Company, PhillipCapital India Research The potential opportunity from the region
Source: PhillipCapital India Research We found that the manufacturing vertical remains fairly outsourced and offshored ‐ relating to engineering solutions and ADM. Also healthcare companies are bidding for outsourcing a sizeable part of their critical patient‐data related operations to large vendors. Verticals such as E&U, TTL, retail and BFSI have preferred MNCs (not offshoring) or local vendors for managing their IT. Also, telecom companies own large IT subsidiaries and remain reluctant to outsource/offshore their operations.
5
6.2
12
8.7
2
2.7
0 5 10 15 20
Number of companies
IT spend in the region ($bn)
Fully outsourced Not offshored Never outsourced
We see the overall addressable potential from this region at close to ~US$ 11.3bn of revenues

14 of 48
25 February 2014 / INDIA EQUITY RESEARCH / IT SERVICES SECTOR UPDATE
The who’s who of the potential target from the region Companies CAPEX IT Capex Sector Volkswagen AG 21,084 2,799 Auto Manufacturers Deutsche Telekom AG 12,528 2,476 Telecom Deutsche Post AG 2,130 2,367 Transportation Daimler AG 9,374 1,713 Auto Manufacturers Deutsche Lufthansa AG 3,842 1,283 Airlines Siemens AG 3,332 1,099 Cap Goods Bayerische Motoren Werke AG 7,309 1,096 Auto Manufacturers Allianz SE 2,142 857 Insurance E.ON SE 6,521 807 Electric Henkel AG & Co KGaA 620 707 Household Products/Wares Adidas AG 673 634 Apparel Continental AG 2,845 485 Auto Parts&Equipment
Source: PhillipCapital India Research According to our analysis, top‐5 Indian IT vendors have reached a critical mass in Germany. Companies like Wipro and Infosys were chosen for ADM services, which is mainly discretionary in nature. TCS remains a preferred IT partner for verticals such as TTL and banks in the region – for both IT services and products. The overall addressable potential revenue from this region is close to ~US$ 11.3bn among the top spenders.
Deal share in the region (Top‐5) Vertical‐wise spread of the deals awarded
Source: PhillipCapital India Research; #Note that we have taken 11 deals for analysing the deal share pie.
TCS, 36%
Infosys, 18%
HCL Tech, 18%
Wipro, 18%
Tech M, 9%Germany
FS, 36%
E&U, 18%Retail + TTL,
9%
Manuf, 18%
Telco, 9%
Others, 9%Germany
Never outsourced Not offshored

15 of 48
25 February 2014 / INDIA EQUITY RESEARCH / IT SERVICES SECTOR UPDATE
France – Mammoth opportunity GDP: US$ 2,738.7bn Population: 63.7mn Top companies that have never outsourced: Christian Dior, Vivendi, Safran Top companies that have not offshored: Total, L’Oreal, EADS, Renault Indian IT Companies with strong presence: TCS, Infosys, HCL Main sectors that can outsource: Retail, Manufacturing Trivia: Home to world’s largest retail and CPG companies France remains a large market for banks, retail, manufacturing, and E&U in Europe with a GDP of US$ 2.7trn. For the IT outsourcing industry, this market is the second largest in terms of potential IT spending (after Germany). Indian top‐5 IT vendors have fairly established their presence in the region through partnerships or acquisitions, which helped them mitigate cultural as well as language barriers. The top‐5 spenders in France that have fully outsourced and offshored their IT operations are Societe Generale, Orange, BNP Paribas, EDF and Alstom.
Deals awarded to Top5 in last 12 months Date Companies Sector Country Outsourced to Major Service opted 11‐Feb‐13 Saint Gobain Manufacturing France HCL Tech IMS
Source: Company, PhillipCapital India Research The potential opportunity from the region
Source: PhillipCapital India Research
We found that BFSI and E&U giants have been fairly inclined towards outsourcing as well as offshoring. However, verticals such as retail, TTL and healthcare are reluctant to offshore, but are partnered with local vendors for outsourcing. Manufacturing and telecom remain largely averse to outsourcing.
7
5.9
9
5.5
9
5.1
0 5 10 15 20 25
Number of companies
IT spend in the region ($bn)
Fully outsourcedNot offshoredNever outsourced
We see the potential from this region at around US$ 11bn

16 of 48
25 February 2014 / INDIA EQUITY RESEARCH / IT SERVICES SECTOR UPDATE
The who’s who of the potential target from the region Companies CAPEX IT Capex Sector
Societe Generale SA 5,366 2,147 Banks Orange SA 7,689 1,640 Telecom Christian Dior SA 3,105 1,472 Apparel LVMH Moet Hennessy Louis Vuitton SA 2,567 1,318 Apparel Total SA 27,627 1,230 Oil&Gas L'Oreal SA 1,400 989 Cosmetics/Personal Care Vivendi SA 3,512 935 Telecom BNP Paribas SA 2,174 870 Banks EADS 3,636 832 Aerospace/Defense Peugeot SA 3,826 763 Auto Manufacturers Renault SA 3,813 582 Auto Manufacturers GDF Suez 10,043 560 Electric
Source: PhillipCapital India Research Tech Mahindra, TCS and Wipro will have major opportunities once their focus domains are unlocked and large deals are afloat for outsourcing as well as offshoring. Currently, Tech Mahindra has a very low presence in this market. Infosys’ BPO remains strong. With robust domain expertise in IMS, HCL Tech holds large market share in retail, TTL and healthcare in France and is competing against large MNCs such as Accenture and IBM. We believe that the change in the outsourcing trend would bring up huge opportunities for the top‐5 Indian companies, with TCS and HCL Tech being major beneficiaries. We see the overall addressable potential from the top spenders of this region at close to ~US$10.6bn worth of revenues.
Deal share in the region (Top‐5) Vertical‐wise spread of the deals awarded
Source: PhillipCapital India Research; #Note that we have taken 10 deals for analysing the deal share pie.
TCS, 50%
Infosys, 30%
HCL Tech, 20%
FranceFS, 20%
E&U, 50%
Retail + TTL, 10%
Manuf, 10%
Others, 10%France
Never outsourced Not offshored
17 of 48
25 February 2014 / INDIA EQUITY RESEARCH / IT SERVICES SECTOR UPDATE
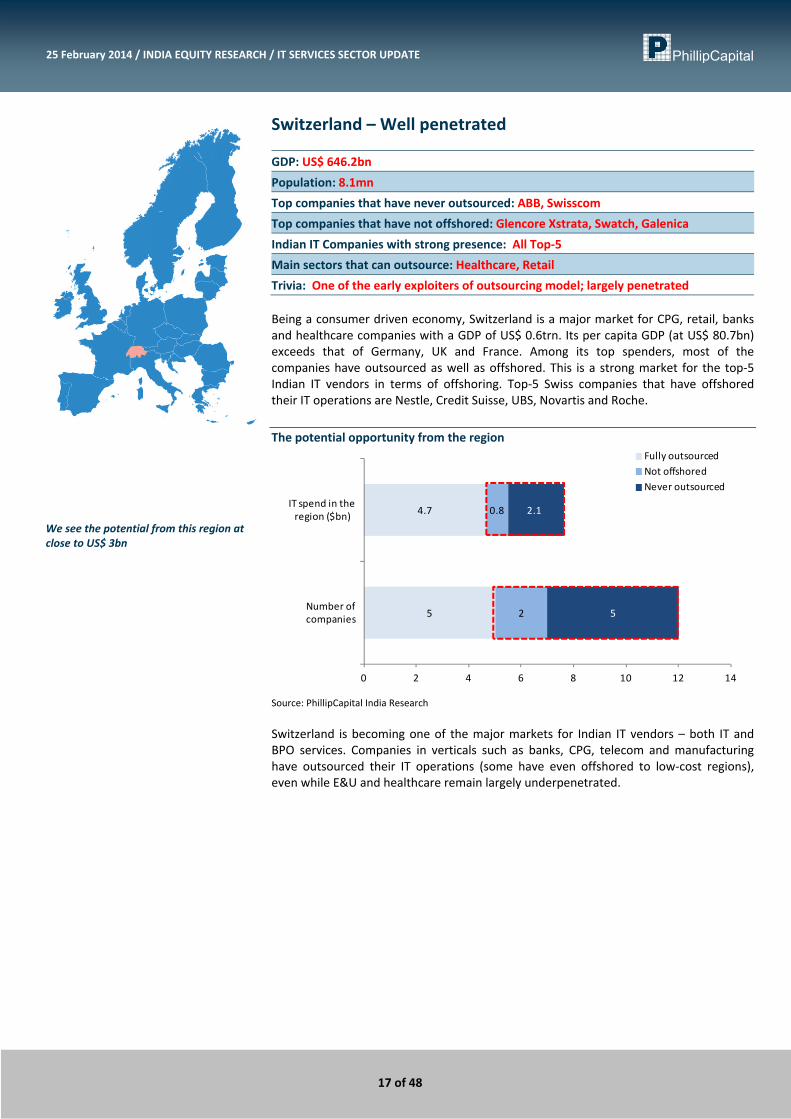
Switzerland – Well penetrated GDP: US$ 646.2bn Population: 8.1mn Top companies that have never outsourced: ABB, Swisscom Top companies that have not offshored: Glencore Xstrata, Swatch, Galenica Indian IT Companies with strong presence: All Top‐5 Main sectors that can outsource: Healthcare, Retail Trivia: One of the early exploiters of outsourcing model; largely penetrated Being a consumer driven economy, Switzerland is a major market for CPG, retail, banks and healthcare companies with a GDP of US$ 0.6trn. Its per capita GDP (at US$ 80.7bn) exceeds that of Germany, UK and France. Among its top spenders, most of the companies have outsourced as well as offshored. This is a strong market for the top‐5 Indian IT vendors in terms of offshoring. Top‐5 Swiss companies that have offshored their IT operations are Nestle, Credit Suisse, UBS, Novartis and Roche. The potential opportunity from the region
Source: PhillipCapital India Research Switzerland is becoming one of the major markets for Indian IT vendors – both IT and BPO services. Companies in verticals such as banks, CPG, telecom and manufacturing have outsourced their IT operations (some have even offshored to low‐cost regions), even while E&U and healthcare remain largely underpenetrated.
5
4.7
2
0.8
5
2.1
0 2 4 6 8 10 12 14
Number of companies
IT spend in the region ($bn)
Fully outsourcedNot offshoredNever outsourced
We see the potential from this region at close to US$ 3bn

18 of 48
25 February 2014 / INDIA EQUITY RESEARCH / IT SERVICES SECTOR UPDATE
The who’s who of the potential target from the region Companies CAPEX IT Capex Sector Nestle SA 5,468 3,210 CPG Glencore Xstrata PLC 8,249 1,313 Mining Credit Suisse Group AG 1,339 536 Banks Cie Financiere Richemont SA 980 483 Retail UBS AG 1,205 482 Banks ABB Ltd 1,206 436 Cap Goods Swisscom AG 2,612 381 Telecom Swatch Group AG/The 564 313 Retail Novartis AG 2,617 236 Pharma & HC Roche Holding AG 2,564 215 Pharma & HC Galenica AG 74 16 Pharma & HC Actelion Ltd 44 8 Pharma & HC
Source: PhillipCapital India Research We note that the top‐5 Indian vendors have a strong presence in Switzerland. HCL Tech, TCS and Wipro remain the strongest in the region. With the acquisition of Lodestone, Infosys has also gained a strong foothold in the country. Tech Mahindra has a great existing relationship with Nestle through Satyam, both in terms of enterprise solutions as well as back‐office outsourcing. We see the overall addressable potential among top spenders from this region at close to US$2.9bn worth of revenues.
Deal share in the region (Top‐5) Vertical‐wise spread of the deals awarded
Source: PhillipCapital India Research; #Note that we have taken 10 deals for analysing the deal share pie.
TCS, 30%
Infosys, 20%
HCL Tech, 30%
Wipro, 10%
Tech M, 10%SwitzerlandFS, 25%
Retail + TTL, 13%
PU, 25%
HC & LS, 25%
Others, 13%Switzerland
Never outsourced Not offshored

19 of 48
25 February 2014 / INDIA EQUITY RESEARCH / IT SERVICES SECTOR UPDATE
Scandinavian countries – Catching up fast (Sweden, Norway, Finland and Denmark) GDP: US$ 1,651.8bn Population: 25.8mn Top companies that have never outsourced: Henens & Mauritz, Meda Top companies that have not offshored: TeliaSonera, Scania, Orion Indian IT Companies with strong presence: TCS, HCL Tech, Tech Mahindra Main sectors that can outsource: Telecom, healthcare Trivia: Extremely rich but conservative region, largely exploited Scandinavia has a more diversified landscape in terms of verticals, with the major ones being telecom, manufacturing and E&U. More than 50% of the companies in the region have already outsourced their IT operations. Many have opted for offshoring too, along with the SMEs in the region. Most of them have opted for digital transformation of their existing IT infrastructure. The top‐5 spenders from this region who have fully outsourced as well as offshored their IT operations are Ericsson, Telenor, Statoil, DNB and Volvo.
Deals awarded to top‐5 Indian IT companies in last 12 months Date Companies Sector Country Outsourced to Major Service opted 24‐Jun‐13 Vestas Wind Systems Manuf Denmark HCL Tech ADM + consulting 17‐Jan‐13 Nokia Telco Finland TCS Global IT partner 26‐Nov‐13 DNB FS Norway HCL Tech Banking services 3‐Sep‐13 DNB FS Norway TCS ADM + Managed Services 25‐Mar‐13 Norway Post PU Norway TCS Strategic IT partner 10‐Sep‐13 Scandinavian Airlines TTL Scandinavia TCS Managed Services+Cloud 13‐Sep‐13 Volvo Manuf Sweden Tech M ADM + PLM 16‐May‐13 Husqvarna Group Manuf Sweden HCL Tech Managed Services
Source: Company, PhillipCapital India Research The potential opportunity from the region
Source: PhillipCapital India Research We found that a large portion of companies have outsourced as well as initiated RFPs for offshoring contracts. Among the top spenders, telecom, banks, manufacturing and E&U companies have outsourced their IT operations. The contracts from this region tend to be long‐term partnerships with large TCVs.
7
3.1
4
0.7
2
0.7
0 2 4 6 8 10 12 14
Number of companies
IT spend in the region ($bn)
Fully outsourcedNot offshoredNever outsourced
We see the potential from this region at close to ~US$ 1.4bn

20 of 48
25 February 2014 / INDIA EQUITY RESEARCH / IT SERVICES SECTOR UPDATE
The who’s who of the potential target from the region Companies CAPEX IT Capex Sector Telefonaktiebolaget LM Ericsson 841 1,050 Telecom Hennes & Mauritz AB 1,238 648 Retail Telenor ASA 2,424 519 Telecom Statoil ASA 19,277 519 Oil&Gas TeliaSonera AB 2,089 460 Telecom DNB ASA 1,095 438 Banks Volvo AB 1,943 428 Auto Manufacturers Tele2 AB 653 139 Telecom Scania AB 645 134 Machinery‐Diversified Novo Nordisk A/S 662 65 Pharma & HC Vestas Wind Systems A/S 315 43 Energy Alternate Sources Meda AB 57 8 Pharma & HC
Source: PhillipCapital India Research It is evident from the recent deal wins that the companies in this region are investing on improving/migrating their technology to achieve cost efficiency and business competencies. TCS, HCL Tech and Tech Mahindra hold a strong footprint in Scandinavian countries – mainly in Norway and Denmark. Infosys and Wipro are yet to gain market share in this region. We see the addressable potential from this region at close to ~US$ 1.4bn in revenues (among the top spenders).
Deal share in the region (Top‐5) Vertical‐wise spread of the deals awarded
Source: PhillipCapital India Research; #Note that we have taken 23 deals for analysing the deal share pie.
TCS, 43%
Infosys, 9%
HCL Tech, 30%
Wipro, 4%
Tech M, 13%ScandinaviaFS, 22%
E&U, 9%
Retail + TTL, 4%
PU, 4%
Manuf, 22%
Telco, 30%
HC & LS, 4%
Others, 4%Scandinavia
Never outsourced Not offshored

21 of 48
25 February 2014 / INDIA EQUITY RESEARCH / IT SERVICES SECTOR UPDATE
Benelux – Small, yet big (Belgium, Netherlands and Luxembourg) GDP: US$ 1,368.5bn Population: 28.5mn Top companies that have never outsourced: SES Top companies that have not offshored: Unilever NV, Heineken, KBC Indian IT Company with strong presence: Tech Mahindra, Infosys, TCS Main sectors that can outsource: CPG/Retail Trivia: Economically strong region with one of the highest GDP per capita Benelux regions include the richest countries (on per capita GDP) in the Eurozone, with E&U, CPG and technology being the major industries. Almost 90% of the top‐spender companies have outsourced their IT operations, while ~50% remain reluctant to offshore. The top‐5 spenders from this region who have fully outsourced as well as offshored their IT operations are Shell, KPN, ArcelorMittal, Belgacom and ING group.
Deals awarded to Top5 in last 12 months Date Companies Sector Country Outsourced to Major Service opted 5‐Aug‐13 BASE Company ‐ KPN Telco Belgium Tech M Managed Services 6‐Jun‐13 Bridgestone Europe Manuf Belgium Tech M Managed Services + ES 24‐Jul‐13 UBS Fund Services FS Luxembourg Tech M Managed Data services 28‐Jan‐14 TNT express TTL Netherlands Infosys ADM Services 12‐Sep‐13 Akzo Nobel Retail Netherlands Infosys F&A processes
Source: Company, PhillipCapital India Research The potential opportunity from the region
Source: PhillipCapital India Research Among the top spenders, majority of telecom and E&U companies have fully outsourced as well as offshored their IT operations. Manufacturing, retail and CPG have opted for outsourcing but have not offshored.
5
3.6
6
4.3
1
0.1
0 2 4 6 8 10 12 14
Number of companies
IT spend in the region ($bn)
Fully outsourcedNot offshoredNever outsourced
We see the potential from this region at US$ 4.4bn

22 of 48
25 February 2014 / INDIA EQUITY RESEARCH / IT SERVICES SECTOR UPDATE
The who’s who of the potential target from the region Companies CAPEX IT Capex Sector Royal Dutch Shell PLC 35,441 2,261 Oil&Gas Unilever NV 2,852 2,085 CPG Delhaize Group SA 908 883 CPG Heineken NV 1,854 813 CPG Koninklijke KPN NV 2,513 468 Telecom KBC Groep NV 1,097 439 Banks ArcelorMittal 3,798 419 E&U Belgacom SA 1,110 257 Telecom ING Groep NV 564 226 Insurance SES SA 702 81 Telecom Koninklijke Vopak NV 553 55 Transportation UCB SA 220 20 Pharma & HC
Source: PhillipCapital India Research Indian top‐5 vendors have gained large contracts from the top spenders in the region recently as against the MNC giants – IBM and Accenture. Infosys and Tech Mahindra have a strong footprint in Benelux – mainly in Netherlands and Belgium. HCL Tech falls a bit short of the others. TCS, focused on energy and utilities, has a strong domain presence in these regions. The remaining addressable potential from this region is close to ~US$ 4.4bn in revenues (among the top spenders).
Deal share in the region (Top‐5) Vertical‐wise spread of the deals awarded
Source: PhillipCapital India Research; #Note that we have taken 18 deals for analysing the deal share pie.
TCS, 22%
Infosys, 28%HCL Tech,
11%
Wipro, 11%
Tech M, 28%
Benelux
FS, 38%
E&U, 14%Retail + TTL, 10%
Manuf, 5%
Telco, 14%
Others, 19%Benelux
Never outsourced Not offshored

23 of 48
25 February 2014 / INDIA EQUITY RESEARCH / IT SERVICES SECTOR UPDATE
Italy – Highly underpenetrated GDP: US$ 2,068.4bn Population: 61mn Top companies that have never outsourced: Exor, Eni, Snam Top companies that have not offshored: Fiat, Telecom Italia, Unicredit, Luxottica Indian IT Companies with strong presence: TCS, HCL Main sectors that can outsource: Manufacturing, BFSI, telecom Trivia: Highly underpenetrated market; language barrier an impediment Italy has the largest accumulation of utilities and retail in Europe, including public‐ owned utilities relating to water and other resources. A fair portion of the top spenders in this region have outsourced their mission‐critical business processes, but they remain reluctant to offshore. We believe that a large portion of the companies are yet to opt for outsourcing. Among the top‐12 spenders, none have fully offshored. Indian top‐5 vendors have a strong presence in manufacturing, retail and TTL verticals in Italy. The potential opportunity from the region
Source: PhillipCapital India Research Among the top spenders from the region, telecom, manufacturing, retail and healthcare have outsourced their IT operations. On the other hand, almost 50% of E&U (largest industry) companies are yet to opt for outsourcing, implying that there remains a large scope for Indian top‐5 companies to gain offshoring contracts.
9
4.1
3
5.6
0 2 4 6 8 10 12 14
Number of companies
IT spend in the region ($bn)
Fully outsourcedNot offshoredNever outsourced
We see the potential from this region at close to US$ 9.6bn

24 of 48
25 February 2014 / INDIA EQUITY RESEARCH / IT SERVICES SECTOR UPDATE
The who’s who of the potential target from the region Companies CAPEX IT Capex Sector Exor SpA 11,952 4,781 Investment Companies Fiat SpA 11,580 1,248 Auto Manufacturers Telecom Italia SpA 6,130 994 Telecom Eni SpA 18,785 771 Oil&Gas Enel SpA 7,733 548 Electric UniCredit SpA 1,237 495 Banks Luxottica Group SpA 492 321 Healthcare Products Finmeccanica SpA 1,056 223 Aerospace/Defense Mediaset SpA 1,288 146 Telecom Saipem SpA 925 85 Oil&Gas Services Snam SpA 2,089 25 Oil&Gas Services Terna Rete Elettrica Nazionale SpA 1,282 13 Electric
Source: PhillipCapital India Research TCS and HCL Tech have a strong presence in Italy, while Infosys, Wipro and Tech Mahindra are yet to foray into this region. We also note that a large portion of SMEs in this economy are from the retail vertical – fashion apparels and products. According to industry experts, companies from these verticals are also opting for digital transformation due to a change in their business model from open retail to online retail. The overall addressable potential from this region is close to ~US$ 9.6bn in revenues (among the top spenders).
Deal share in the region (Top‐5) Vertical‐wise spread of the deals awarded
Source: PhillipCapital India Research; #Note that we have taken only 2 deals for analysing the deal share pie.
Note: The company share and vertical share in this region might be misleading, as we have data for only 2 large deals announced in the last 36 months, from the region.
TCS, 50%
HCL Tech, 50%
ItalyRetail + TTL,
50%
Manuf, 50%
Italy
Never outsourced Not offshored
TCS and HCL Tech have a strong presence in Italy
25 of 48
25 February 2014 / INDIA EQUITY RESEARCH / IT SERVICES SECTOR UPDATE
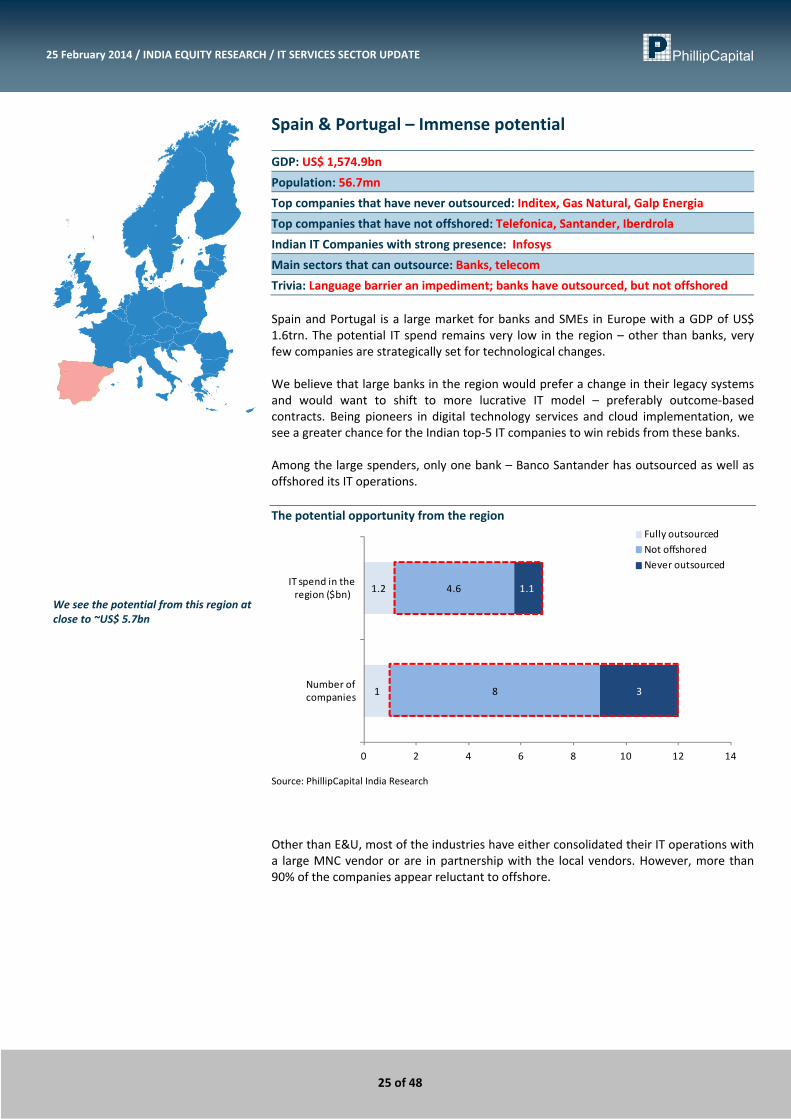
Spain & Portugal – Immense potential GDP: US$ 1,574.9bn Population: 56.7mn Top companies that have never outsourced: Inditex, Gas Natural, Galp Energia Top companies that have not offshored: Telefonica, Santander, Iberdrola Indian IT Companies with strong presence: Infosys Main sectors that can outsource: Banks, telecom Trivia: Language barrier an impediment; banks have outsourced, but not offshored Spain and Portugal is a large market for banks and SMEs in Europe with a GDP of US$ 1.6trn. The potential IT spend remains very low in the region – other than banks, very few companies are strategically set for technological changes. We believe that large banks in the region would prefer a change in their legacy systems and would want to shift to more lucrative IT model – preferably outcome‐based contracts. Being pioneers in digital technology services and cloud implementation, we see a greater chance for the Indian top‐5 IT companies to win rebids from these banks. Among the large spenders, only one bank – Banco Santander has outsourced as well as offshored its IT operations. The potential opportunity from the region
Source: PhillipCapital India Research Other than E&U, most of the industries have either consolidated their IT operations with a large MNC vendor or are in partnership with the local vendors. However, more than 90% of the companies appear reluctant to offshore.
1
1.2
8
4.6
3
1.1
0 2 4 6 8 10 12 14
Number of companies
IT spend in the region ($bn)
Fully outsourcedNot offshoredNever outsourced
We see the potential from this region at close to ~US$ 5.7bn

26 of 48
25 February 2014 / INDIA EQUITY RESEARCH / IT SERVICES SECTOR UPDATE
The who’s who of the potential target from the region Companies CAPEX IT Capex Sector Telefonica SA 11,050 2,281 Telecom Banco Santander SA 2,880 1,152 Banks Banco Bilbao Vizcaya Argentaria SA 2,275 910 Banks Inditex SA 1,795 762 Retail Repsol SA 5,243 401 Oil&Gas Banco Espirito Santo SA 710 284 Banks Portugal Telecom SGPS SA 1,432 242 Telecom Iberdrola SA 4,356 230 Electric Endesa SA 2,765 225 Electric Gas Natural SDG SA 2,195 172 Oil&Gas Galp Energia SGPS SA 1,823 148 Oil&Gas Grifols SA 185 17 Pharma & HC
Source: PhillipCapital India Research Out of the top‐5 Indian IT vendors, only Infosys has a strong foothold in the region, mainly in the BFSI vertical, while the others are yet to form a critical mass for large deal wins. Telecom giants such as Telefonica and Portugal Telecom are yet to outsource their networking and IT infrastructure; however both have outsourced their BPO operations. This creates a strong opportunity for Tech Mahindra to get an entry into these regions. The overall addressable potential from this region is close to ~US$ 5.7bn revenues (among the top spenders).
Deal share in the region (Top‐5) Vertical‐wise spread of the deals awarded
Source: PhillipCapital India Research; #Note that only a single large deal has been won by Top 5.
Note: The company share and vertical share in this region might be misleading, as we have data for only 1 large deal announced in the last 36 months, from the region.
Infosys, 100%
Spain & Portugal
FS, 100%
Spain & Portugal
Never outsourced Not offshored

27 of 48
25 February 2014 / INDIA EQUITY RESEARCH / IT SERVICES SECTOR UPDATE
Central & Eastern Europe (CEE) – The dark horse (Poland, Greece, Czech Republic, Hungary, Austria and Croatia) GDP: US$ 1,563bn Population: 83.1mn Top companies that have never outsourced: Komercni Banka, Andritz, Telekom AustriaTop companies that have not offshored: Erste Bank, Vienna Ins, OMV, OPAP Indian IT Companies with strong presence: Infosys, TCS Main sectors that can outsource: BFSI, telecom, manufacturing Trivia: Conservative region, potential small, highly underpenetrated market Central and Eastern Europe presents a new opportunity for the Indian IT vendors. Within CEE, Austria, Czech and Hungary form the largest chunk of GDP. More than 40% of the companies in the region have never outsourced, while none have offshored their IT operations. The diversity in culture as well as language remains a strong impediment for IT outsourcing penetration in these regions. We believe that these economically small regions would be the biggest challenge for the Indian IT companies.
Deals awarded to Top5 in last 12 months Date Companies Sector Country Outsourced to Major Service opted 26‐Nov‐13 Keler, CSD PU Hungary TCS TCS BaNCS
Source: Company, PhillipCapital India Research The potential opportunity from the region
Source: PhillipCapital India Research For the Indian top‐5, the current addressable verticals would be BFSI and public utilities as the rest are not yet strategically set for technological changes.
6
1.1
4
0.4
0 2 4 6 8 10 12
Number of companies
IT spend in the region ($bn)
Fully outsourcedNot offshoredNever outsourced
We see the potential from this region at US$ 1.5bn

28 of 48
25 February 2014 / INDIA EQUITY RESEARCH / IT SERVICES SECTOR UPDATE
The who’s who of the potential target from the region Central & Eastern Europe CAPEX IT Capex Sector Erste Group Bank AG 969 388 Banks OMV AG 4,703 278 Oil&Gas OPAP SA 172 182 Telecom Telekom Austria AG 925 168 Telecom Hellenic Telecommunications Organization 716 159 Telecom Vienna Insurance 232 93 Insurance Andritz AG 159 83 Machinery‐Diversified Voestalpine AG 1,212 81 E&U CEZ AS 2,446 51 Electric Komercni Banka AS 92 37 Banks
Source: PhillipCapital India Research Among the top‐5 Indian vendors, Infosys has a strong presence in these regions followed by TCS, while the others are yet to make their presence felt. The estimated value of addressable potential revenues from CEE is close to ~US$ 1.5bn in revenues (among top spenders).
Deal share in the region (Top‐5) Vertical‐wise spread of the deals awarded
Source: PhillipCapital India Research; #Note that we have taken 5 deals for analysing the deal share pie.
TCS, 18%
Infosys, 82%
C&E Europe
FS, 83%
PU, 17%C&E Europe
Never outsourced Not offshored

29 of 48
25 February 2014 / INDIA EQUITY RESEARCH / IT SERVICES SECTOR UPDATE
Early bird advantage – TCS, TechM and HCL Europe accounts for close to 30% of revenues for the top‐5 Indian IT vendors (except Infosys at 25%). They all have been trying to get a foothold in the region and are playing to their strength and USPs to make inroads into what appears to be the next frontier for the IT industry. Our countrywise analysis leads us to the following conclusions: • All companies have a significant presence in UK and Germany • Infosys, TCS and HCL have made major inroads into France • TCS, HCL and TechM are relatively strong in Scandinavia • TechM, Infosys and Wipro have a better presence in Benelux • Infosys is the only company with critical business mass in CEE
Share of deals won from each region, over the last three years
Source: Company, PhillipCapital India Research
Geographical contribution to revenues European revenue CQGR in the past 7 years
Source: Company, PhillipCapital India Research
18%
22%
43%
50%
30%
50%
36%
34%
82%
28%
9%
100%
20%
30%
18%
16%
11%
30%
50%
30%
20%
18%
21%
11%
4%
10%
18%
15%
28%
13%
10%
9%
13%
C&E Europe
Benelux
Scandinavia
Spain & Portugal
Italy
Swiss
France
Germany
UK
TCS Infosys HCL Tech Wipro Tech Mahindra
Americas, 53%
Europe, 29%
RoW, 18%
Americas, 57%
Europe, 31%
RoW, 12%
Americas, 47%
Europe, 31%
RoW,22%
Americas, 60%
Europe, 25%
RoW, 15%
Americas, 50%
Europe, 30%
RoW, 21%
TCS
HCL Tech
Tech M
Infosys
Wipro
3.2
7.0
5.5
5.7
5.4
2.6
2.6
‐0.9
TechM
TechM ex BT
TCS
Infosys
HCL Tech
Wipro
IBM
Capgemini

30 of 48
25 February 2014 / INDIA EQUITY RESEARCH / IT SERVICES SECTOR UPDATE
TCS – with its near‐shore and offshore delivery centers, it has established a strong footprint in Europe. It has reported superior growth, and captured the largest share of deals over the last three years. Its acquisition of Alti (France) clearly demonstrates the management’s earnestness in breaking the language barrier (wherever present).
HCL Tech with its strong domain expertise in IMS, is competing with the likes of IBM and Accenture for large contracts while gaining a strong market share in the business. In almost all geographies in EU, it comes a close second to TCS in terms of deal wins. Additionally, the consulting expertise of Axon has multiplied the potential of combined services – 3x large deal wins over the past few years (according to the management).
Tech Mahindra has been the most aggressive in the EU region and has seen a 7% CQGR (excluding BT) over the last seven quarters. We expect TechM to benefit from increased spending by telecom companies (which are constantly losing revenue share to internet‐based service providers (Whatsapp, VoIP, etc.) and bundling of network solutions with other enterprise services.
Infosys has clearly made more inroads in specific regions (Spain, Benelux and CEE), while remaining strong in key geographies like UK and Germany. Apart from these strengths, Infosys’ BPO has a strong established brand image and competes with Genpact BPO and WNS in the region. However, its deal‐wins share from the region remains inferior to both TCS and HCL Tech.
Wipro remains the clear laggard in the geography, with inferior growth rate, deal‐win share and weak presence in most regions. Because of decision cycles for discretionary spending for most industries in the EU lengthening, and Wipro’s higher dependence on it, it is getting further away from gaining incremental market share in Europe.
Relative positioning in the EU region
Source: PhillipCapital India Research
Valuation Table CMP MCAP _______ROE (%)_______ _______PE (x)_______ _______PB (x)_______ ____EV/EBITDA (x)____ Companies Rs bn FY14E FY15E FY16E FY14E FY15E FY16E FY14E FY15E FY16E FY14E FY15E FY16ETCS 2,178 4,266 36.3 34.6 33.1 22.5 18.3 15.4 8.2 6.3 5.1 16.8 14.0 11.8Infosys 3,751 2,143 23.1 22.7 21.7 20.3 17.3 15.3 4.7 3.9 3.3 13.9 11.3 9.6Wipro 578 1,423 23.7 23.4 22.3 18.5 16.0 14.3 4.4 3.7 3.2 13.5 11.7 10.3HCL Tech 1,531 1,082 32.7 30.2 28.6 17.5 14.9 12.6 5.7 4.5 3.6 11.8 10.1 8.3Tech Mahindra 1,830 425 28.6 23.7 21.9 13.8 12.9 11.1 3.9 3.1 2.4 9.4 7.7 6.4
Source: PhillipCapital India Research Estimates
TCS
HCL TechInfosys
Wipro
Tech M
0
5
10
15
20
25
30
35
40
45
50
4 5 6 7 8 9 10 11 12 13
Strength in
term
s of d
eals won
‐‐>
Strength in terms of presence in Europe‐‐>
31 of 48
25 February 2014 / INDIA EQUITY RESEARCH / IT SERVICES SECTOR UPDATE
Compa
nies Sectio
n

– 32 of 48 –
TCS On a different plane altogether…
Company Update 25 February 2014
PhillipCapital (India) Pvt. Ltd.
Superior performance all across, to continue going forward TCS has consistently outperformed all its peers across almost all parameters – it has posted dollar revenue CAGR of 17.8% over the last 5 years with a 300bps margin expansion. We expect this growth momentum to continue — its well‐diversified revenue profile (across verticals, horizontals and geographies) will help deliver growth ahead of peers and industry average. We also find TCS much ahead in its ability to capitalize on a pick up in discretionary spend in the US and other geographies. TCS – Strong presence in Europe TCS has a much stronger presence in the EU region than most of its peers. Over 29% of its revenues come from here and have posted a CQGR of 5.5% over the last seven quarters. It remains in a leading position in all big economies (UK, Germany, France, Switzerland) and has also penetrated economies like Scandinavia, Italy and Benelux, which are opening up to outsourcing. TCS also has a strong presence in countries such as France and Germany where language barrier has remained a major impediment for other companies trying to make inroads. Its acquisition of Alti (France‐based consulting services company) to gain a foothold in the region shows its earnestness in capitalizing the EU opportunity. Much ahead of peers in adopting new technology and delivery models TCS was one of the first few companies to realize the potential of the CAMS domain and has already invested heavily in this segment. Also, it has been the most active IT services company to migrate from linear T&M to non‐linear delivery models. Non‐linear revenues contribute ~50% of its total revenues – much ahead of peers again. Valuations appear expensive, but are justified TCS is currently trading at 18x FY15 and 15x FY16 earnings. The stock has given handsome returns in the first half of FY14 (25%), but has lagged its peers over the last six months (20%) on valuation concerns and skepticism about its ability to meet high expectations. We find these fears overdone, and expect the company to continue to ‘meet’ expectations and outperform the industry and peers. From the longer term perspective, we expect its higher investment in S&M (~19% of sales) to drive deal wins. Its strong presence in the EU region should boost incremental revenues from there. Its early investment in the digital space places it well ahead of peers in capitalizing on the next big revolution of the IT industry. We remain positive on the stock and view it as an attractive investment at current levels. We continue to value the stock at 20x average of FY15‐16 earnings giving us a price target of Rs 2,600, representing a 19% upside from current levels. We maintain BUY.
BUY TCS IN | CMP RS 2178 TARGET RS 2600 (+19%) Company Data O/S SHARES (MN) : 1959MARKET CAP (RSBN) : 4848MARKET CAP (USDBN) : 68.552 ‐ WK HI/LO (RS) : 2384 / 1364LIQUIDITY 3M (USDMN) : 44.8FACE VALUE (RS) : 1
Share Holding Pattern, % PROMOTERS : 73.9FII / NRI : 16.3FI / MF : 5.3NON PROMOTER CORP. HOLDINGS : 0.4PUBLIC & OTHERS : 4.1
Price Performance, % 1mth 3mth 1yrABS ‐3.1 8.9 49.8REL TO BSE ‐1.6 5.9 42.0
Price Vs. Sensex (Rebased values)
Source: Bloomberg, Phillip Capital Research
Key Ratios Rs bn FY14E FY15E FY16ENet Sales 822.6 984.3 1,167.1EBIDTA 253.1 302.7 356.9Net Profit 189.1 232.5 276.5EPS, Rs 96.5 118.7 141.1PER, x 22.6 18.3 15.4EV/EBIDTA, x 16.8 14.0 11.8P/BV, x 8.2 6.3 5.1ROE, % 36.2 34.6 33.1Source: Phillip Capital India Research Vibhor Singhal (+ 9122 6667 9949) [email protected] Varun Vijayan (+ 9122 6667 9992) [email protected]
70
120
170
220
270
320
Apr‐10 Apr‐11 Apr‐12 Apr‐13
TCS BSE Sensex

– 33 of 48 –
25 February 2014 / INDIA EQUITY RESEARCH / TATA CONSULTANCY COMPANY UPDATE
European revenues and QoQ growth %
Source: Company, PhillipCapital India Research Recent deal wins from Europe Date Companies Sector Country Major Service opted 20‐Feb‐14 Diageo CPG UK IMS 28‐Nov‐13 Npower ‐ RWE E&U UK Customer services 26‐Nov‐13 Keler, CSD PU Hungary TCS BaNCS 21‐Oct‐13 Bombardier Transportation TTL Germany TCS BaNCS 10‐Sep‐13 Scandinavian Airlines TTL Scandinavia Managed Services+Cloud 3‐Sep‐13 DNB FS Norway ADM + Managed Services 25‐Mar‐13 Norway Post PU Norway Strategic IT partner 17‐Jan‐13 Nokia Telco Finland Global IT partner
Source: BSE Archives Deal win share in Europe – regionwise & verticalwise
Source: PhillipCapital India Research
9.6%
4.6% 4.5%
0.4%
6.9%
11.7%
5.2%
0%
2%
4%
6%
8%
10%
12%
14%
0
200
400
600
800
1,000
1,200
1QFY13 2QFY13 3QFY13 4QFY13 1QFY14 2QFY14 3QFY14
$, mn
European revenues QoQ growth % (rhs)
Telco, 10% BFSI, 30% Retail, TTL,
15%E&U, 10% Others, 35%
UK, 25%
Germany, 10%
France, 10%
Switzerland, 10%
Scandinavia, 30% Benelux, 10%
Others, 5%
Verticalwise
Geo‐wise

– 34 of 48 –
25 February 2014 / INDIA EQUITY RESEARCH / TATA CONSULTANCY COMPANY UPDATE
Financials
Income Statement Y/E Mar, Rs mn FY13 FY14E FY15E FY16ENet sales 629,895 822,565 984,301 1,167,115Growth, % 29 31 20 19Employee expenses ‐332,545 ‐421,791 ‐504,595 ‐599,539Other Operating expenses ‐116,480 ‐147,648 ‐176,988 ‐210,667EBITDA (Core) 180,870 253,126 302,718 356,909Growth, % 25.5 39.9 19.6 17.9Margin, % 28.7 30.8 30.8 30.6Depreciation ‐10,791 ‐13,256 ‐16,188 ‐18,402EBIT 170,079 239,870 286,530 338,507Growth, % 25.9 41.0 19.5 18.1Margin, % 27.0 29.2 29.1 29.0Interest paid 0 0 0 0Other Non‐Operating Income 11,175 11,296 17,561 22,688Pre‐tax profit 181,254 250,875 304,091 361,195Tax provided ‐40,344 ‐59,827 ‐69,941 ‐83,075Profit after tax 140,910 191,048 234,151 278,120Others (Minorities, Associates) ‐1,494 ‐1,981 ‐1,648 ‐1,648Net Profit 139,416 189,067 232,503 276,472Growth, % 31.1 35.6 23.0 18.9Net Profit (adjusted) 139,416 189,067 232,503 276,472Wtd avg shares (m) 1,957 1,959 1,959 1,959 FY13 FY14E FY15E FY16EUS$ Revenue (US$ mn) 11,569 13,488 15,876 18,824Growth, % 13.7 16.6 17.7 18.6Re / US$ (rate) 54.4 61.0 62.0 62.0 Balance Sheet Y/E Mar, Rs mn FY13 FY14E FY15E FY16ECash & bank 18,432 19,474 29,093 51,508Marketable securities at cost 0 0 0 0Debtors 140,766 183,218 228,257 276,463Inventory 0 0 0 0Other current assets 146,169 173,575 213,991 259,605Total current assets 305,367 376,267 471,340 587,576Investments 20,403 63,653 99,653 135,653Net fixed assets 194,965 229,288 281,444 331,340Non‐current assets 0 0 0 0Total assets 520,735 669,207 852,437 1,054,569 Total current liabilities 88,526 120,035 148,890 183,039Non‐current liabilities 16,088 20,685 22,515 25,588Total liabilities 104,614 140,720 171,404 208,627Paid‐up capital 1,957 1,957 1,957 1,957Reserves & surplus 407,603 519,699 670,596 833,857Minorities 6,561 6,831 8,479 10,127Shareholders’ equity 416,121 528,487 681,032 845,942Total equity & liabilities 520,735 669,207 852,437 1,054,569
Source: Company, PhillipCapital India Research Estimates
Cash Flow Y/E Mar, Rs mn FY13 FY14E FY15E FY16EPre‐tax profit 181,254 250,875 304,091 361,195Depreciation 10,791 13,256 16,188 18,402Chg in working capital ‐61,023 ‐33,649 ‐54,770 ‐56,598Total tax paid ‐40,344 ‐59,827 ‐69,941 ‐83,075Other operating activities 0 0 0 0Cash flow from operating activities 90,678 170,655 195,569 239,924Capital expenditure ‐31,207 ‐47,578 ‐68,344 ‐68,299Chg in investments ‐5,620 ‐43,250 ‐36,000 ‐36,000Chg in marketable securities 0 0 0 0Other investing activities 0 0 0 0Cash flow from investing activities ‐36,827 ‐90,828 ‐104,344 ‐104,299Free cash flow 59,471 123,077 127,224 171,626Equity raised/(repaid) 0 0 0 0Debt raised/(repaid) 156 ‐103 0 0Dividend (incl. tax) ‐50,379 ‐66,466 ‐81,605 ‐113,210Other financing activities ‐4,924 ‐10,505 ‐1 0Cash flow from financing activities ‐55,355 ‐78,785 ‐81,606 ‐113,211Net chg in cash ‐1,504 1,042 9,619 22,414 Valuation Ratios & Per Share Data FY13 FY14E FY15E FY16EPer Share data EPS (INR) 71.2 96.5 118.7 141.1Growth, % 31.1 35.5 23.0 18.9Book NAV/share (INR) 209.3 266.3 343.4 426.7CFPS (INR) 40.6 81.4 90.9 110.9DPS (INR) 22.0 29.0 35.6 49.4Return ratios Return on assets (%) 30.2 32.1 30.8 29.2Return on equity (%) 34.0 36.2 34.6 33.1Return on capital employed (%) 36.3 38.9 37.4 35.3Turnover ratios Asset turnover (x) 1.9 2.0 2.0 1.9Sales/Total assets (x) 1.4 1.4 1.3 1.2Sales/Net FA (x) 3.4 3.9 3.9 3.8Working capital/Sales (x) 0.3 0.3 0.3 0.3Receivable days 81.6 81.3 84.6 86.5Payable days 71.1 76.7 79.5 82.3Working capital days 115.0 105.1 108.8 110.4Liquidity ratios Current ratio (x) 3.4 3.1 3.2 3.2Quick ratio (x) 3.4 3.1 3.2 3.2Dividend cover (x) 3.2 3.3 3.3 2.9Total debt/Equity (%) 0.6 0.4 0.3 0.3Net debt/Equity (%) (3.9) (3.3) (4.0) (5.9)Valuation PER (x) 30.6 22.6 18.3 15.4PEG (x) ‐ y‐o‐y growth 1.0 0.6 0.8 0.8Price/Book (x) 10.4 8.2 6.3 5.1Yield (%) 1.0 1.3 1.6 2.3EV/Net sales (x) 6.7 5.2 4.3 3.6EV/EBITDA (x) 23.5 16.8 14.0 11.8EV/EBIT (x) 25.0 17.7 14.8 12.5

– 35 of 48 –
HCL Tech Continuously bridging the gap
Company Update 25 February 2014
PhillipCapital (India) Pvt. Ltd.
Bridging the gap with its peers continuously HCL Tech has consistently surprised the street with its continuous margin expansion (from 16.5% in FY11 to ~26% in FY14) and robust topline growth (3.4% CQGR over the last seven quarters). HCL Tech’s operating margins are now at ~26% (same as Infosys’) — it has bridged the 15% gap in the last 7 quarters (in 4QFY12 HCL’s were at 18% vs. Infosys’ 33%). Its return ratios are also far superior to all peers (except TCS). We expect HCL Tech to continue reporting strong results led by robust growth in IMS and from the European region. Significant presence in Europe, second only to TCS HCL has a much stronger presence in the EU region than most of its peers (inferior only to TCS). Over 31% of its revenues come from this geography, posting a CQGR of 5.4% over the last seven quarters. The company is in a strong position in the UK, Germany, Scandinavia and Switzerland, but is yet to win a large deal in Spain, Benelux and CEE. HCL Tech has benefitted immensely from its expertise in the IMS domain. The company has been able to beat the likes of IBM and Accenture in IMS contracts from EU and we expect it to bundle its enterprise services with IMS to expand its offerings and presence in the region. IMS continues to deliver for the company, concerns overdone The key driver behind HCL’s strong growth has been its superior performance in the IMS space. The company has captured a large market share in the domain, even from the likes of IBM; its IMS division has a CQGR of ~9% over the last seven quarters and accounts for 74% of incremental revenues. We find the concerns about HCL’s lopsided growth (driven only by IMS) largely overdone. During times when discretionary spend has been dismal, IMS has enabled the company to get multiple new clients. Its bundling of other services along with IMS has led to deeper client penetration and significant margin expansion. Its enterprise software business has also started picking up and is likely to hold the company in good stead if and when discretionary spend revives. Valuation gap not justified in our opinion, recommend BUY HCL currently trades at 15x FY15 and 12x FY16 earnings – at a significant discount to the top three. While its discount to TCS is justified, we believe it has delivered significantly better results than Infosys and Wipro (growth and margins) and warrants a higher multiple. We expect a significant re‐rating of the stock on the back of robust revenue growth driven by its dominant position in IMS and strong presence in the EU region. We now value the stock at 15x average of FY15‐16 earnings (at par with Infosys) giving us a price target of Rs 1,680, representing a 10% upside from current levels. We maintain BUY.
BUY HCLT IN | CMP RS 1531 TARGET RS 1680 (+10%) Company Data O/S SHARES (MN) : 699MARKET CAP (RSBN) : 1070MARKET CAP (USDBN) : 17.352 ‐ WK HI/LO (RS) : 1546 / 674LIQUIDITY 3M (USDMN) : 26.3FACE VALUE (RS) : 2
Share Holding Pattern, % PROMOTERS : 61.8FII / NRI : 29.2FI / MF : 4.2NON PROMOTER CORP. HOLDINGS : 2.1PUBLIC & OTHERS : 2.7
Price Performance, % 1mth 3mth 1yrABS 8.3 45.8 112.7REL TO BSE 9.8 42.8 104.9
Price Vs. Sensex (Rebased values)
Source: Bloomberg, Phillip Capital Research
Key Ratios Rs bn FY14E FY15E FY16ENet Sales 333.1 382.4 445.5EBIDTA 86.8 98.7 116.0Net Profit 61.8 72.6 86.2EPS, Rs 87.5 102.8 121.8PER, x 17.5 14.9 12.6EV/EBIDTA, x 11.8 10.1 8.3P/BV, x 5.7 4.5 3.6ROE, % 32.7 30.2 28.6Source: Phillip Capital India Research Vibhor Singhal (+ 9122 6667 9949) [email protected] Varun Vijayan (+ 9122 6667 9992) [email protected]
0
50
100
150
200
250
300
350
Apr‐10 Mar‐11 Feb‐12 Jan‐13HCL Tech BSE Sensex

– 36 of 48 –
25 February 2014 / INDIA EQUITY RESEARCH / HCL TECH COMPANY UPDATE
European revenues and QoQ growth %
Source: Company, PhillipCapital India Research Recent deal wins from Europe Date Companies Sector Country Major Service opted 31‐Dec‐13 Student Loan Co PU UK SI + IT services 26‐Nov‐13 DNB FS Norway Banking services 10‐Sep‐13 Anglo American PLC E&U UK IMS + Data center + Security24‐Jun‐13 Vestas Wind Systems Manuf Denmark ADM + consulting 16‐May‐13 Husqvarna Group Manuf Sweden Managed Services 11‐Feb‐13 Saint Gobain Manuf France IMS 30‐Jan‐13 Cobham PLC Manuf UK ER&D services
Source: BSE Archives Deal win share in Europe – regionwise & verticalwise
Source: PhillipCapital India Research
4.6%
2.8%
5.9%
4.6%
8.8%
2.5%
7.8%
0%
1%
2%
3%
4%
5%
6%
7%
8%
9%
10%
0
50
100
150
200
250
300
350
400
450
1QFY13 2QFY13 3QFY13 4QFY13 1QFY14 2QFY14 3QFY14
$, mn
European revenues QoQ growth % (rhs)
Mfg, 33% BFSI, 25% E&U, 17% HC & LS, 17%
Others, 8%
UK, 33%
Germany, 8%
France, 8%
Switzerland, 17% Scandinavia, 33%
Verticalwise
Geo‐wise

– 37 of 48 –
25 February 2014 / INDIA EQUITY RESEARCH / HCL TECH COMPANY UPDATE
Financials
Income Statement Y/E Jun, Rs mn FY13 FY14E FY15E FY16ENet sales 257,694 333,109 382,431 445,455Growth, % 23 29 15 16Employee expenses ‐165,787 ‐203,905 ‐236,254 ‐274,203Other Operating expenses ‐34,368 ‐42,451 ‐47,473 ‐55,209EBITDA (Core) 57,539 86,754 98,703 116,043Growth, % 46.1 50.8 13.8 17.6Margin, % 22.3 26.0 25.8 26.1Depreciation ‐6,738 ‐7,584 ‐8,369 ‐9,016EBIT 50,801 79,170 90,334 107,027Growth, % 50.5 55.8 14.1 18.5Margin, % 19.7 23.8 23.6 24.0Other Non‐Operating Income 1,772 3,355 4,611 5,592Forex Gains\ (Losses) ‐213 ‐3,089 0 0Pre‐tax profit 52,360 79,435 94,945 112,618Tax provided ‐12,218 ‐17,618 ‐22,312 ‐26,465Profit after tax 40,142 61,818 72,633 86,153Others (Minorities, Associates) 0 0 0 0Net Profit 40,142 61,818 72,633 86,153Growth, % 64.5 54.0 17.5 18.6Net Profit (adjusted) 40,142 61,818 72,633 86,153Wtd avg shares (m) 705 707 707 707 FY13 FY14E FY15E FY16EUS$ Revenue (US$ mn) 4,687 5,360 6,168 7,185Growth, % 12.9 14.4 15.1 16.5Re / US$ (rate) 55.0 62.1 62.0 62.0 Balance Sheet Y/E Jun, Rs mn FY13 FY14E FY15E FY16ECash & bank 7,321 12,133 22,917 39,532Marketable securities at cost 42,491 71,352 83,352 99,352Debtors 61,767 78,486 94,298 109,838Inventory 0 0 0 0Other current assets 19,071 20,949 26,173 31,592Total current assets 130,650 182,920 226,740 280,315Investments 577 587 1,087 2,087Net fixed assets 99,254 110,613 123,415 138,088Non‐current assets 0 0 0 0Total assets 230,481 294,120 351,242 420,490 Total current liabilities 65,423 81,003 90,618 99,915Non‐current liabilities 22,111 24,243 20,361 19,361Total liabilities 87,534 105,246 110,979 119,277Paid‐up capital 1,341 1,341 1,341 1,341Reserves & surplus 141,607 187,534 238,922 299,873Minorities 0 0 0 0Shareholders’ equity 142,947 188,874 240,262 301,213Total equity & liabilities 230,481 294,120 351,242 420,490
Source: Company, PhillipCapital India Research Estimates
Cash Flow Y/E Jun, Rs mn FY13 FY14E FY15E FY16EPre‐tax profit 52,360 79,435 94,945 112,618Depreciation 6,738 7,584 8,369 9,016Chg in working capital 3,843 ‐3,016 ‐11,422 ‐11,662Total tax paid ‐12,218 ‐17,618 ‐22,312 ‐26,465Other operating activities 0 0 0 0Cash flow from operating activities 50,723 66,386 69,581 83,507Capital expenditure ‐13,761 ‐18,943 ‐21,171 ‐23,690Chg in investments 2,366 ‐10 ‐500 ‐1,000Chg in marketable securities ‐23,714 ‐28,861 ‐12,000 ‐16,000Other investing activities 0 0 0 0Cash flow from investing activities ‐35,109 ‐47,814 ‐33,671 ‐40,690Free cash flow 36,962 47,442 48,410 59,817Equity raised/(repaid) 0 0 0 0Debt raised/(repaid) ‐10,457 2,132 ‐3,881 ‐1,000Dividend (incl. tax) ‐9,749 ‐18,092 ‐21,245 ‐25,202Other financing activities 5,240 2,201 0 0Cash flow from financing activities ‐14,966 ‐13,759 ‐25,126 ‐26,202Net chg in cash 648 4,812 10,784 16,615 Valuation Ratios & Per Share Data FY13 FY14E FY15E FY16EPer Share data EPS (INR) 56.9 87.5 102.8 121.8Growth, % 63.3 53.7 17.5 18.6Book NAV/share (INR) 202.7 267.3 339.9 426.0CFPS (INR) 69.4 89.2 91.9 110.2DPS (INR) 11.8 21.9 25.7 30.5Return ratios Return on assets (%) 19.1 23.6 22.5 22.3Return on equity (%) 28.1 32.7 30.2 28.6Return on capital employed (%) 26.3 32.7 30.7 29.6Turnover ratios Asset turnover (x) 2.3 2.7 2.7 2.7Sales/Total assets (x) 1.2 1.3 1.2 1.2Sales/Net FA (x) 2.7 3.2 3.3 3.4Working capital/Sales (x) 0.1 0.1 0.1 0.1Receivable days 87.5 86.0 90.0 90.0Working capital days 21.8 20.2 28.5 34.0Liquidity ratios Current ratio (x) 2.0 2.3 2.5 2.8Quick ratio (x) 2.0 2.3 2.5 2.8Dividend cover (x) 4.8 4.0 4.0 4.0Total debt/Equity (%) 15.5 12.8 8.5 6.4Net debt/Equity (%) 10.3 6.4 (1.1) (6.7)Valuation PER (x) 26.9 17.5 14.9 12.6PEG (x) ‐ y‐o‐y growth 0.4 0.3 0.9 0.7Price/Book (x) 7.6 5.7 4.5 3.6Yield (%) 0.8 1.4 1.7 2.0EV/Net sales (x) 4.1 3.1 2.6 2.2EV/EBITDA (x) 18.3 11.8 10.1 8.3EV/EBIT (x) 20.7 12.9 11.0 9.0

– 38 of 48 –
Infosys Structural issues remain …
Company Update 25 February 2014
PhillipCapital (India) Pvt. Ltd.
Decent performance in recent past After the return of Mr. N Murthy at the helm, Infosys has delivered in‐line or above expected results, making it one of the best performers amongst the top‐4 (stock up 25% in the last 6 months). While multiple levers like utilizaton, rupee depreciation and Mr. Murthy’s troika can lead to margin expansion over the next two years, we maintain that there are structural issues in its business model that might hamper its growth over next two years.
Decent presence in the EU, especially in some underpenetrated regions Infosys has a decent presence in EU (though inferior to TCS and HCL Tech). The region currently accounts for 25% of its revenues, which have seen a CQGR of 5.7% over the last seven quarters. While the company remains strong in UK, France and Switzerland, it has also made better inroads in relatively underpenetrated regions like Spain, Benelux and CEE. In fact, as per our analysis, Italy, Spain and CEE are the most underpenetrated regions with almost 100% of their top companies yet to offshore IT operations.
Structural issues in the business model Infosys has historically been the lowest spender on S&M activity (13% vs. 19% of TCS) amongst the top 4. This has led to its inability to win key deals and loss of wallet share from its existing clients. An attempt to correct this might lead to a contraction of already depleting operating margins.
The company has an inferior revenue mix vs. peers. Its revenue share of emerging services (IMS, consulting and analytics) remains the lowest amongst the top‐4 (25% vs. 37% at TCS) – so does its share of non‐linear delivery models (40% vs. 48% for TCS).
Exodus of key employees and new centralized structure not helping Over the last 18 months, a number of key high profile executives have left Infosys, joining rival companies for better salary, position, or profile. Increasing centralization of decision making after Mr. Murthy’s return has, in our opinion, led to frustration amongst senior employees – a possible reason for the exodus. We remain wary of the vacuum created by recent exits and expect it to hamper Infosys’ growth profile.
Risk‐reward profile looks unfavorable; recommend NEUTRAL Infosys currently trades at 17x FY15 and 15x FY16 earnings – still too high a multiple, in our opinion, considering the risk to future earnings and the inadequate gap in valuation versus its arch rival TCS (18x FY15 for TCS).
We remain negative on the stock and believe that the exodus of key employees, inferior business mix, and margin contraction expected on the back of higher S&M spend pose a significant risk to earnings. At the same time, we expect the company to benefit from its presence in the EU region. We now value the company at 15x average of FY15‐16 earnings (at par with HCL Tech) giving us a price target of Rs 3,460, representing a 8% downside from current levels. We maintain NEUTRAL.
NEUTRAL INFO IN | CMP RS 3751 TARGET RS 3460 (‐8%) Company Data O/S SHARES (MN) : 574MARKET CAP (RSBN) : 2154MARKET CAP (USDBN) : 34.752 ‐ WK HI/LO (RS) : 3799 / 2190LIQUIDITY 3M (USDMN) : 65.7FACE VALUE (RS) : 5
Share Holding Pattern, % PROMOTERS : 15.9FII / NRI : 57.3FI / MF : 15.4NON PROMOTER CORP. HOLDINGS : 0.5PUBLIC & OTHERS : 10.9
Price Performance, % 1mth 3mth 1yrABS ‐0.2 12.0 32.2REL TO BSE 1.3 9.0 24.5
Price Vs. Sensex (Rebased values)
Source: Bloomberg, Phillip Capital Research
Key Ratios Rs bn FY14E FY15E FY16ENet Sales 134.7 161.6 182.0EBIDTA 105.8 123.8 140.1Net Profit 185.1 216.7 245.2EPS, Rs 20.3 17.3 15.3PER, x 13.9 11.3 9.6EV/EBIDTA, x 4.7 3.9 3.3P/BV, x 23.1 22.7 21.7ROE, % 134.7 161.6 182.0Source: Phillip Capital India Research Vibhor Singhal (+ 9122 6667 9949) [email protected] Varun Vijayan (+ 9122 6667 9992) [email protected]
70
90
110
130
150
170
Apr‐10 Apr‐11 Apr‐12 Apr‐13
Infosys BSE Sensex

– 39 of 48 –
25 February 2014 / INDIA EQUITY RESEARCH / INFOSYS COMPANY UPDATE
European revenues and QoQ growth %
Source: Company, PhillipCapital India Research Recent deal wins from Europe Date Companies Sector Country Major Service opted 13‐Feb‐14 Royal Philips Tech Netherlands F&A and procurement (BPO)28‐Jan‐14 TNT express TTL Netherlands ADM Services 30‐Sep‐13 RBS FS UK ADM + Finacle 12‐Sep‐13 Akzo Nobel Retail Netherlands F&A processes 16‐Apr‐13 Queens University PU UK Security services 2‐Apr‐13 RWE Supply E&U Germany IT partner 14‐Mar‐13 BMW Manuf Germany IMS + BI 7‐Mar‐13 Accor Retail France CommercEdge
Source: BSE Archives Deal win share in Europe – regionwise & verticalwise
Source: PhillipCapital India Research
‐8.4%
5.0%
16.5%
5.6%
‐3.0%
5.5% 5.5%
‐10%
‐5%
0%
5%
10%
15%
20%
0
100
200
300
400
500
600
1QFY13 2QFY13 3QFY13 4QFY13 1QFY14 2QFY14 3QFY14
$, mn
European revenues QoQ growth % (rhs)
Mfg, 8% BFSI, 38% Retail, TTL, 23%
HC & LS, 8%
Others, 15%
UK, 23% Germany, 15%
France, 8%
Scandinavia, 8%
Benelux, 38%
Others, 8%
Verticalwise
Geo‐wise

– 40 of 48 –
25 February 2014 / INDIA EQUITY RESEARCH / INFOSYS COMPANY UPDATE
Financials
Income Statement Y/E Mar, Rs mn FY13 FY14E FY15E FY16ENet sales 403,520 504,922 579,331 658,040Growth, % 20 25 15 14Employee expenses ‐241,510 ‐309,610 ‐348,251 ‐398,378Other Operating expenses ‐46,430 ‐60,621 ‐69,520 ‐77,649EBITDA (Core) 115,580 134,690 161,560 182,013Growth, % 7.9 16.5 19.9 12.7Margin, % 28.6 26.7 27.9 27.7Depreciation ‐11,290 ‐13,739 ‐15,289 ‐16,454EBIT 104,290 120,951 146,271 165,560Growth, % 6.6 16.0 20.9 13.2Margin, % 25.8 24.0 25.2 25.2Forex gains/losses 2,580 1,077 0 0Other Non‐Operating Income 21,010 24,288 25,682 29,011Pre‐tax profit 127,880 146,316 171,954 194,571Tax provided ‐33,670 ‐40,548 ‐48,147 ‐54,480Profit after tax 94,210 105,768 123,807 140,091Others (Minorities, Associates) 0 0 0 0Net Profit 94,210 105,768 123,807 140,091Growth, % 13.3 12.3 17.1 13.2Net Profit (adjusted) 94,210 105,768 123,807 140,091Wtd avg shares (m) 571 571 571 571 FY13 FY14E FY15E FY16EUS$ Revenue (US$ mn) 7,398 8,292 9,344 10,614Growth, % 5.8 12.1 12.7 13.6Re / US$ (rate) 54.5 60.9 62.0 62.0 Balance Sheet Y/E Mar, Rs mn FY13 FY14E FY15E FY16ECash & bank 235,710 265,192 320,345 389,636Marketable securities at cost 0 0 0 0Debtors 70,830 94,068 107,930 124,397Inventory 0 0 0 0Loans & advances 46,590 55,583 69,507 82,591Other current assets 0 0 0 0Total current assets 353,130 414,843 497,782 596,624Investments 17,230 34,980 42,480 49,980Net fixed assets 88,120 100,251 109,462 117,008Non‐current assets 0 0 0 0Total assets 460,830 552,454 652,104 765,992 Total current liabilities 62,860 93,882 105,937 120,709Non‐current liabilities 0 0 0 0Total liabilities 62,860 93,882 105,937 120,709Paid‐up capital 2,860 2,860 2,860 2,860Reserves & surplus 395,110 455,713 543,307 642,424Minorities 0 0 0 0Shareholders’ equity 397,970 458,573 546,167 645,284Total equity & liabilities 460,830 552,454 652,104 765,992
Source: Company, PhillipCapital India Research Estimates
Cash Flow Y/E Mar, Rs mn FY13 FY14E FY15E FY16EPre‐tax profit 127,880 146,316 171,954 194,571Depreciation 11,290 13,739 15,289 16,454Chg in working capital ‐9,440 ‐1,209 ‐15,731 ‐14,778Total tax paid ‐34,070 ‐40,578 ‐48,147 ‐54,480Other operating activities 0 0 0 0Cash flow from operating activities 95,660 118,268 123,364 141,767Capital expenditure ‐33,660 ‐25,870 ‐24,500 ‐24,000Chg in investments ‐5,240 ‐17,750 ‐7,500 ‐7,500Chg in marketable securities 0 0 0 0Other investing activities 0 0 0 0Cash flow from investing activities ‐38,900 ‐43,620 ‐32,000 ‐31,500Free cash flow 62,000 92,398 98,864 117,767Equity raised/(repaid) 0 0 0 0Debt raised/(repaid) 0 0 0 0Dividend (incl. tax) ‐28,079 ‐30,936 ‐36,212 ‐40,975Other financing activities ‐2,771 ‐14,229 0 0Cash flow from financing activities ‐30,850 ‐45,166 ‐36,212 ‐40,975Net chg in cash 25,910 29,482 55,152 69,292 Valuation Ratios & Per Share Data FY13 FY14E FY15E FY16EPer Share data EPS (INR) 164.9 185.1 216.7 245.2Growth, % 13.3 12.3 17.1 13.2Book NAV/share (INR) 696.5 802.5 955.8 1,129.3CFPS (INR) 130.6 164.5 171.0 197.3DPS (INR) 42.0 46.3 54.2 61.3Return ratios Return on assets (%) 22.3 20.9 20.6 19.8Return on equity (%) 23.7 23.1 22.7 21.7Return on capital employed (%) 25.7 24.7 24.6 23.5Turnover ratios Asset turnover (x) 3.2 3.4 3.4 3.4Sales/Total assets (x) 1.0 1.0 1.0 0.9Sales/Net FA (x) 5.2 5.4 5.5 5.8Working capital/Sales (x) 0.1 0.1 0.1 0.1Receivable days 64.1 68.0 68.0 69.0Payable days 79.7 92.6 92.6 92.6Working capital days 49.4 40.3 45.0 47.9Liquidity ratios Current ratio (x) 5.6 4.4 4.7 4.9Quick ratio (x) 5.6 4.4 4.7 4.9Dividend cover (x) 3.9 4.0 4.0 4.0Net debt/Equity (%) (59.2) (57.8) (58.7) (60.4)Valuation PER (x) 22.8 20.3 17.3 15.3PEG (x) ‐ y‐o‐y growth 1.7 1.7 1.0 1.2Price/Book (x) 5.4 4.7 3.9 3.3Yield (%) 1.1 1.2 1.4 1.6EV/Net sales (x) 4.7 3.7 3.1 2.7EV/EBITDA (x) 16.5 13.9 11.3 9.6EV/EBIT (x) 18.3 15.5 12.5 10.6

– 41 of 48 –
Wipro Out of the woods?
Company Update 25 February 2014
PhillipCapital (India) Pvt. Ltd.
Management reshuffle leading to muted performance Wipro’s management has seen a constant reshuffle ever since Mr Kurien took over as CEO in February 2011. Changes in different chief positions from major departments in IT services and the consumer space have had a substantial adverse impact on its operations in the past two years and led to sub‐8% growth (in dollar terms) and flat margins over the last four years. Weak presence in Europe to hamper growth Wipro has a relatively weaker presence in the EU region compared with its peers. While the region currently accounts for 30% of its revenues, it has seen a CQGR of 2.6% over the last seven quarters – much lower than peers. Its deal‐win record from EU over the last eight quarters has been dismal and precludes the company benefitting from the region opening up. Amongst geographies, the company has a significant presence only in the UK, which would still be inferior to that of TCS and HCL Tech. In most of the other geographies, it has failed to penetrate or win a large deal over the last three years. Historically low S&M spend reflecting in poor results now Wipro, along with Infosys, has historically been the lowest spender on S&M (13% of sales vs. 19% for TCS). This has led to a loss of wallet share in key accounts and revenue‐per‐client growing by only 28% in the last five years. In the last two years, client mining has been even more dismal and so has its performance in terms of deal wins. We believe the company will find it difficult to turn this trend around in the near future and any increment in S&M activity will lead to a contraction in margins. Modest revenue guidance for 4QFY14 raises growth concerns Wipro’s management has provided a modest guidance of 2‐4% QoQ growth in topline (dollar terms) for 4QFY14, leading us to wonder if it will be able to catch up with peers. We see Wipro reporting significantly lower growth (+4.6% by our estimates in FY14) than the NASSCOM industry estimates (12‐14%). We also remain concerned about the lumpy revenues from its products business and the sustainability of margins at current levels. However, its utilizations at 74% provide significant headroom for margin expansion and its strong positioning in the IMS domain also helps.
For the stock to merit a rerating, the management needs to deliver more, and more importantly, deliver consistently. It currently trades at 16x FY15 P/E – higher than HCL Tech (15x FY15 P/E), which has consistently delivered higher growth and superior returns.
We continue to value the company at 14x average of FY15‐16 earnings (lower than 15x for Infosys and HCL Tech), on the back of its relatively weaker presence in the EU region and inferior return parameters. Our price target of Rs 540 represents a 6% downside from current levels. We maintain NEUTRAL.
NEUTRAL WPRO IN | CMP RS 578 TARGET RS 540 (‐6%) Company Data O/S SHARES (MN) : 2466MARKET CAP (RSBN) : 1425MARKET CAP (USDBN) : 23.052 ‐ WK HI/LO (RS) : 587/ 315LIQUIDITY 3M (USDMN) : 15.6FACE VALUE (RS) : 2
Share Holding Pattern, % PROMOTERS : 73.5FII / NRI : 13.1FI / MF : 3.8NON PROMOTER CORP. HOLDINGS : 3.7PUBLIC & OTHERS : 5.9
Price Performance, % 1mth 3mth 1yrABS 0.9 21.0 56.0REL TO BSE 2.4 18.0 48.2
Price Vs. Sensex (Rebased values)
Source: Bloomberg, Phillip Capital Research
Key Ratios Rs bn FY14E FY15E FY16ENet Sales 435.4 492.3 543.5EBIDTA 98.0 111.2 122.4Net Profit 76.9 89.1 99.6EPS, Rs 31.2 36.2 40.4PER, x 18.5 16.0 14.3EV/EBIDTA, x 13.5 11.7 10.3P/BV, x 4.4 3.7 3.2ROE, % 23.7 23.4 22.3Source: Phillip Capital India Research Vibhor Singhal (+ 9122 6667 9949) [email protected] Varun Vijayan (+ 9122 6667 9992) [email protected]
60
80
100
120
140
160
180
Apr‐10 Apr‐11 Apr‐12 Apr‐13
Wipro BSE Sensex

– 42 of 48 –
25 February 2014 / INDIA EQUITY RESEARCH / WIPRO COMPANY UPDATE
European revenues and QoQ growth %
Source: Company, PhillipCapital India Research Recent deal wins from Europe Date Companies Sector Country Major Service opted 3‐Sep‐13 Deutsche Bank FS Germany AMS
Source: BSE Archives Deal win share in Europe – regionwise & verticalwise
Source: PhillipCapital India Research
0.1%
2.1%
7.5%
‐3.2%
2.0%2.4%
5.3%
‐4%
‐2%
0%
2%
4%
6%
8%
380
400
420
440
460
480
500
520
1QFY13 2QFY13 3QFY13 4QFY13 1QFY14 2QFY14 3QFY14
$, mn
European revenues
QoQ growth % (rhs)
Telco, 17% Mfg, 17% BFSI, 33% Retail, TTL, 17%
HC & LS, 17%
UK, 67% Germany, 17%
Scandinavia, 17%
Verticalwise
Geo‐wise

– 43 of 48 –
25 February 2014 / INDIA EQUITY RESEARCH / WIPRO COMPANY UPDATE
Financials
Income Statement Y/E Mar, Rs mn FY13 FY14E FY15E FY16ENet sales 374,256 435,429 492,256 543,456Growth, % 17.4 16.3 13.1 10.4Employee expenses ‐250,808 ‐287,560 ‐325,855 ‐361,903Other Operating expenses ‐43,619 ‐49,853 ‐55,180 ‐59,112EBITDA (Core) 79,829 98,016 111,221 122,441Growth, % 16.2 22.8 13.5 10.1Margin, % 21.3 22.5 22.6 22.5Depreciation ‐9,857 ‐10,393 ‐10,588 ‐11,435EBIT 69,972 87,623 100,633 111,006Growth, % 16.8 25.2 14.8 10.3Margin, % 18.7 20.1 20.4 20.4Interest paid 0 0 0 0Other Non‐Operating Income 8,624 11,414 12,909 15,841Pre‐tax profit 83,608 99,037 113,542 126,847Tax provided ‐16,912 ‐21,726 ‐23,844 ‐26,638Profit after tax 66,696 77,310 89,699 100,209Others (Minorities, Associates) ‐337 ‐443 ‐553 ‐618Net Profit 66,359 76,867 89,145 99,591Growth, % 17.3 25.3 16.0 11.7Net Profit (adjusted) 61,347 76,867 89,145 99,591Wtd avg shares (m) 2,459 2,462 2,462 2,462 US$ mn FY13 FY14E FY15E FY16EUS$ Revenue (Consol) 6,935 7,247 7,940 8,765Growth, % 3.3 4.5 9.6 10.4Re /US$ (rate) 54.4 60.4 62.0 62.0 Balance Sheet Y/E Mar, Rs mn FY13 FY14E FY15E FY16ECash & bank 84,838 85,162 89,735 102,565Marketable securities at cost 69,171 84,128 99,128 119,128Debtors 76,635 88,279 99,800 111,669Inventory 3,263 3,102 3,506 3,871Other current assets 73,496 86,072 100,002 117,327Total current assets 307,403 346,742 392,171 454,560Investments 0 0 0 0Net fixed assets 106,995 116,611 126,323 135,788Non‐current assets 25,332 30,480 35,442 39,129Total assets 439,730 493,833 553,937 629,477 Total current liabilities 144,740 146,875 152,222 161,219Non‐current liabilities 10,007 21,785 18,133 19,424Total liabilities 154,747 168,660 170,355 180,643Paid‐up capital 4,926 4,931 4,931 4,931Reserves & surplus 278,886 318,811 376,666 441,301Minorities 1,171 1,431 1,984 2,602Shareholders’ equity 284,983 325,173 383,582 448,834Total equity & liabilities 439,730 493,833 553,937 629,477
Source: Company, PhillipCapital India Research Estimates
Cash Flow Y/E Mar, Rs mn FY13 FY14E FY15E FY16EPre‐tax profit 83,608 99,037 113,542 126,847Depreciation 9,857 10,393 10,588 11,435Chg in working capital 30,317 ‐27,072 ‐25,471 ‐24,248Total tax paid ‐16,912 ‐21,726 ‐23,844 ‐26,638Other operating activities ‐5,012 0 0 0Cash flow from operating activities 101,858 60,632 74,815 87,396Capital expenditure 14,302 ‐20,009 ‐20,300 ‐20,900Chg in investments 3,232 0 0 0Chg in marketable securities ‐27,210 ‐14,957 ‐15,000 ‐20,000Other investing activities 0 0 0 0Cash flow from investing activities ‐9,676 ‐34,966 ‐35,300 ‐40,900Free cash flow 116,160 40,623 54,515 66,496Equity raised/(repaid) ‐18,768 3,581 0 0Debt raised/(repaid) ‐22,146 11,778 ‐3,653 1,291Dividend (incl. tax) ‐20,141 ‐35,620 ‐31,290 ‐34,957Other financing activities ‐23,940 ‐4,898 0 0Cash flow from financing activities ‐85,010 ‐25,342 ‐34,943 ‐33,665Net chg in cash 7,172 324 4,573 12,831 Valuation Ratios & Per Share Data FY13 FY14E FY15E FY16EPer Share data EPS (INR) 24.9 31.2 36.2 40.4Growth, % 17.2 25.2 15.9 11.7Book NAV/share (INR) 115.4 131.5 155.0 181.2CFPS (INR) 28.0 28.6 27.6 31.0DPS (INR) 7.0 12.4 10.9 12.1Return ratios Return on assets (%) 15.2 16.6 17.1 16.9Return on equity (%) 21.6 23.7 23.4 22.3Return on capital employed (%) 21.7 24.1 24.0 23.0Turnover ratios Asset turnover (x) 2.0 2.3 2.4 2.3Sales/Total assets (x) 0.9 0.9 0.9 0.9Sales/Net FA (x) 3.1 3.9 4.1 4.1Receivable days 74.7 74.0 74.0 75.0Inventory days 3.2 2.6 2.6 2.6Payable days 59.6 59.2 57.4 57.6Working capital days 8.4 25.6 37.9 48.1Liquidity ratios Current ratio (x) 2.1 2.4 2.6 2.8Quick ratio (x) 2.1 2.3 2.6 2.8Dividend cover (x) 3.6 2.5 3.3 3.3Total debt/Equity (%) 25.7 21.2 16.8 14.4Net debt/Equity (%) (4.2) (5.1) (6.8) (8.6)Valuation PER (x) 23.2 18.5 16.0 14.3PEG (x) ‐ y‐o‐y growth 1.3 0.7 1.0 1.2Price/Book (x) 5.0 4.4 3.7 3.2Yield (%) 1.2 2.1 1.9 2.1EV/Net sales (x) 3.6 3.0 2.6 2.3EV/EBITDA (x) 16.8 13.5 11.7 10.3EV/EBIT (x) 19.2 15.1 12.9 11.4

– 44 of 48 –
Tech Mahindra All set to join the BIG LEAGUE
Company Update 25 February 2014
PhillipCapital (India) Pvt. Ltd.
Formidable force after Satyam integration, superior return profile After its integration with Satyam, TechM has transformed into a full‐range IT service provider, with significant presence in all key geographies and verticals. We expect the combined entity to benefit from TechM’s expertise in telecom and Satyam’s presence in manufacturing and retail. The combined entity has a strong presence in Europe, which we expect to be the next frontier for the Indian IT services sector. Strong presence in Europe to boost growth Tech Mahindra has a relatively much stronger presence in EU than most of its peers (along with TCS and HCL Tech). Over 31% of its revenues come from this geography with a CQGR of 3.2% over the last seven quarters (7% excluding BT). The company has a strong presence in Scandinavia, Germany and Benelux. Amongst verticals, the company has made significant inroads into telecom, manufacturing and retail – the last two being the key strengths of the acquired entity Satyam.
We expect TechM to benefit from its strong presence in the telecom domain as telecom companies from the EU region open up to outsourcing. Its bundling of Network solutions with Enterprise solutions should also lead to expansion of service offerings and a stronger presence in the region. Domain expertise in telecom to drive growth momentum TechM has always had a strong expertise in the telecom domain and is one of the preferred IT vendors for telecom companies today. It has also been able to add key clients (eg., AT&T, Verizon) to its portfolio. We expect TechM grabbing a good chunk of the of deals in the telecom space, which will see a higher momentum driven by regulatory changes and advent of new technology. Its strategy to bundle its Communications & Networking services with Enterprise Solutions should reap rich dividends (as it has for HCL Tech). Being over‐ambitious might pose a risk TechM management has set an internal target of $5bn topline by FY16 (while themselves calling it wishful ambition). This might lead to the company aggressively looking for inorganic avenues of growth, which might pose a significant risk to TechM’s earnings and its growth story. Attractive valuations – definite case for further re‐rating TechM is trading at 13x FY15 and 11x FY16 earnings. While the stock has run up significantly over the last six months (6m 34%, 12m 77%), it still trades at a significant discount to its peers (top 4). We expect further rerating now that it is a full‐range IT service provider. We believe it should get a multiple that is in‐line with the top‐4, especially Wipro and HCL Tech.
We now value the company at 15x average FY15‐16 earnings (in‐line with our multiple for Infosys and HCL Tech). That gives us a price target of Rs 2,300 representing an 26% upside from its current level. We maintain BUY and recommend it as our top pick from the sector.
BUY TECHM IN | CMP Rs 1830 TARGET Rs 2300 (+26%) Company Data O/S SHARES (MN) : 233MARKET CAP (RSBN) : 427MARKET CAP (USDBN) : 6.952 ‐ WK HI/LO (RS) : 1906 / 895LIQUIDITY 3M (USDMN) : 28.7FACE VALUE (RS) : 10
Share Holding Pattern, % PROMOTERS : 36.3FII / NRI : 41.5FI / MF : 8.9NON PROMOTER CORP. HOLDINGS : 1.3PUBLIC & OTHERS : 12.0
Price Performance, % 1mth 3mth 1yrABS 2.0 9.8 76.0REL TO BSE 3.5 6.9 68.2
Price Vs. Sensex (Rebased values)
Source: Bloomberg, Phillip Capital Research
Other Key Ratios Rs bn FY14E FY15E FY16ENet Sales 188.8 224.1 261.6EBIDTA 42.0 49.9 58.0Net Profit 28.0 33.8 39.4EPS, Rs 132.6 141.8 165.4Adj. EPS, Rs 118.0 141.8 165.4PER, x 13.8 12.9 11.1EV/EBIDTA, x 9.4 7.7 6.4P/BV, x 3.9 3.1 2.4ROE, % 25.4 23.7 21.9Source: Phillip Capital India Research Vibhor Singhal (+ 9122 6667 9949) [email protected] Varun Vijayan (+ 9122 6667 9992) [email protected]
60
100
140
180
220
260
Apr‐10 Apr‐11 Apr‐12 Apr‐13Tech MahindraBSE Sensex

– 45 of 48 –
25 February 2014 / INDIA EQUITY RESEARCH / TECH MAHINDRA COMPANY UPDATE
European revenues and QoQ growth %
Source: Company, PhillipCapital India Research Recent deal wins in Europe Date Companies Sector Country Major Service opted 27‐Jan‐14 Cambridge University Press Others UK SAP rollout + ES 13‐Sep‐13 Volvo Manuf Sweden ADM + PLM 5‐Aug‐13 BASE Company ‐ KPN Telco Belgium Managed Services 24‐Jul‐13 UBS Fund Services FS Luxembourg Managed Data services 6‐Jun‐13 Bridgestone Europe Manuf Belgium Managed Services + ES
Source: BSE archives Deal win share in Europe – regionwise & verticalwise
Source: PhillipCapital India Research
7.9% 7.8%
‐2.5%
0.6%
8.0%
‐2.0%
‐4%
‐2%
0%
2%
4%
6%
8%
10%
0
50
100
150
200
250
300
1QFY13 2QFY13 3QFY13 4QFY13 1QFY14 2QFY14 3QFY14
$, mn
European revenues QoQ growth % (rhs)
Telco, 33% Mfg, 33% BFSI, 17% Others, 17%
UK, 17% Scandinavia, 17% Benelux, 67%
Verticalwise
Geo‐wise

– 46 of 48 –
25 February 2014 / INDIA EQUITY RESEARCH / TECH MAHINDRA COMPANY UPDATE
Financials
Income Statement Y/E Mar, Rs mn FY13 FY14E FY15E FY16ENet sales 143,320 188,802 224,116 261,637Growth, % 22 32 19 17Employee expenses ‐90,007 ‐116,735 ‐138,696 ‐161,225Other Operating expenses ‐22,682 ‐30,032 ‐35,534 ‐42,398EBITDA (Core) 30,631 42,035 49,886 58,015Growth, % 56.9 37.2 18.7 16.3Margin, % 21.4 22.3 22.3 22.2Depreciation ‐3,896 ‐4,945 ‐5,762 ‐7,042EBIT 26,735 37,091 44,124 50,972Growth, % 63.7 38.7 19.0 15.5Margin, % 18.7 19.6 19.7 19.5Interest paid ‐922 ‐928 ‐718 ‐588Other Non‐Operating Income 2,121 2,519 2,791 3,518Pre‐tax profit 26,334 39,881 46,197 53,902Tax provided ‐6,479 ‐8,047 ‐12,011 ‐14,014Profit after tax 19,855 31,834 34,186 39,887Others (Minorities, Associates) ‐301 ‐337 ‐421 ‐491Net Profit 19,554 31,497 33,765 39,396Growth, % 17.1 32.5 20.5 16.7Net Profit (adjusted) 21,154 28,031 33,765 39,396Wtd avg shares (m) 237 238 238 238 Y/E Mar, US$ mn FY13 FY14E FY15E FY16EUS$ Revenue 2,633 3,097 3,615 4,220Growth, % 6.7 17.6 16.7 16.7Re / US$ (rate) 54.4 61.0 62.0 62.0 Balance Sheet Y/E Mar, Rs mn FY13 FY14E FY15E FY16ECash & bank 34,629 37,848 46,389 60,635Debtors 33,688 49,140 58,332 68,097Inventory 110 259 307 358Loans & advances 20,358 25,863 30,701 35,841Other current assets 6,537 8,794 10,745 12,903Total current assets 95,322 121,904 146,474 177,835Investments 14,393 18,893 23,893 28,893Gross fixed assets 36,017 45,017 55,017 65,017Less: Depreciation ‐13,699 ‐18,644 ‐24,406 ‐31,448Add: Capital WIP 2,595 2,595 2,595 2,595Net fixed assets 24,913 28,968 33,206 36,164Total assets 138,105 173,242 207,050 246,369 Current liabilities 28,951 35,180 37,999 39,754Provisions 16,203 16,955 16,753 17,060Total current liabilities 45,154 52,135 54,752 56,814Non‐current liabilities 10,768 9,268 7,768 6,768Total liabilities 55,922 61,403 62,520 63,582Paid‐up capital 2,316 2,316 2,316 2,316Reserves & surplus 78,523 107,842 140,112 177,877Minorities 1,344 1,681 2,102 2,593Shareholders’ equity 82,183 111,839 144,530 182,787Total equity & liabilities 138,105 173,242 207,050 246,369
Source: Company, PhillipCapital India Research Estimates
Cash Flow Y/E Mar, Rs mn FY13 FY14E FY15E FY16EPre‐tax profit 26,334 39,881 46,197 53,902Depreciation 3,896 4,945 5,762 7,042Chg in working capital ‐7,812 ‐17,133 ‐13,210 ‐15,359Total tax paid ‐7,534 ‐7,295 ‐12,213 ‐13,707Other operating activities 1,600 ‐1,200 0 0Cash flow from operating activities 16,484 19,197 26,535 31,877Capital expenditure ‐10,250 ‐9,000 ‐10,000 ‐10,000Chg in investments 293 ‐4,500 ‐5,000 ‐5,000Chg in marketable securities 0 0 0 0Other investing activities 0 0 0 0Cash flow from investing activities ‐9,957 ‐13,500 ‐15,000 ‐15,000Free cash flow 6,234 10,197 16,535 21,877Equity raised/(repaid) 12 ‐5 0 0Debt raised/(repaid) ‐2,974 ‐1,500 ‐1,500 ‐1,000Dividend (incl. tax) ‐750 ‐1,222 ‐1,495 ‐1,631Other financing activities ‐39 250 0 0Cash flow from financing activities ‐2,858 ‐2,478 ‐2,995 ‐2,631Net chg in cash 3,669 3,219 8,541 14,247 Valuation Ratios & Per Share Data FY13 FY14E FY15E FY16EPer Share data Adj. EPS (INR) 89.3 118.0 141.8 165.4Growth, % 9.2 32.0 20.2 16.7Book NAV/share (INR) 341.4 463.6 598.1 756.7CFPS (INR) 53.9 75.2 99.7 119.1DPS (INR) 2.7 4.4 5.4 5.9Return ratios Return on assets (%) 16.1 20.8 18.2 17.8Return on equity (%) 26.2 25.4 23.7 21.9Return on capital employed (%) 24.1 30.3 25.3 23.6Turnover ratios Asset turnover (x) 3.0 2.9 2.7 2.6Sales/Total assets (x) 1.1 1.2 1.2 1.2Sales/Net FA (x) 6.6 7.0 7.2 7.5Working capital/Sales (x) 0.1 0.2 0.2 0.2Receivable days 85.8 95.0 95.0 95.0Payable days 93.8 87.5 79.6 71.3Working capital days 39.6 61.7 73.8 84.2Liquidity ratios Current ratio (x) 2.1 2.3 2.7 3.1Quick ratio (x) 2.1 2.3 2.7 3.1Dividend cover (x) 33.0 26.8 26.4 28.3Total debt/Equity (%) 10.5 6.4 3.9 2.5Net debt/Equity (%) (32.3) (28.0) (28.7) (31.1)Valuation PER (x) 22.2 13.8 12.9 11.1PEG (x) ‐ y‐o‐y growth (20.3) 0.2 1.9 0.7Price/Book (x) 5.4 3.9 3.1 2.4Yield (%) 0.1 0.2 0.3 0.3EV/Net sales (x) 2.8 2.1 1.7 1.4EV/EBITDA (x) 13.0 9.4 7.7 6.4EV/EBIT (x) 14.9 10.6 8.7 7.2
– 47 of 48 –
25 February 2014 / INDIA EQUITY RESEARCH / IT SERVICES SECTOR UPDATE
Management (91 22) 2300 2999(91 22) 6667 9735
Research Engineering, Capital Goods Pharma
Deepak Jain (9122) 6667 9758 Ankur Sharma (9122) 6667 9759 Surya Patra (9122) 6667 9768Priya Ranjan (9122) 6667 9965 Aditya Bahety (9122) 6667 9986
Retail, Real EstateInfrastructure & IT Services Abhishek Ranganathan, CFA (9122) 6667 9952
Manish Agarwalla (9122) 6667 9962 Vibhor Singhal (9122) 6667 9949 Neha Garg (9122) 6667 9996Sachit Motwani, CFA, FRM (9122) 6667 9953 Varun Vijayan (9122) 6667 9992
TechnicalsMetals Subodh Gupta (9122) 6667 9762
Naveen Kulkarni, CFA, FRM (9122) 6667 9947 Dhawal Doshi (9122) 6667 9769Vivekanand Subbaraman (9122) 6667 9766 Dharmesh Shah (9122) 6667 9974 Database ManagerManish Pushkar (9122) 6667 9764 Vishal Randive (9122) 6667 9944
Oil&Gas, Agri InputsCement Gauri Anand (9122) 6667 9943 Sr. Manager – Equities SupportVaibhav Agarwal (9122) 6667 9967 Deepak Pareek (9122) 6667 9950 Rosie Ferns (9122) 6667 9971
Anjali Verma (9122) 6667 9969
Sales & Distribution Kinshuk Tiwari (9122) 6667 9946 Sales Trader ExecutionAshvin Patil (9122) 6667 9991 Dilesh Doshi (9122) 6667 9747 Mayur Shah (9122) 6667 9945Shubhangi Agrawal (9122) 6667 9964 Suniil Pandit (9122) 6667 9745Kishor Binwal (9122) 6667 9989Sidharth Agrawal (9122) 6667 9934Dipesh Sohani (9122) 6667 9756
Economics
Consumer, Media, Telecom
Vineet Bhatnagar (Managing Director)Jignesh Shah (Head – Equity Derivatives)
Automobiles
Banking, NBFCs
Contact Information (Regional Member Companies)
SINGAPORE
Phillip Securities Pte Ltd 250 North Bridge Road, #06‐00 Raffles City Tower,
Singapore 179101 Tel : (65) 6533 6001 Fax: (65) 6535 3834
www.phillip.com.sg
MALAYSIA Phillip Capital Management Sdn Bhd B‐3‐6 Block B Level 3, Megan Avenue II,
No. 12, Jalan Yap Kwan Seng, 50450 Kuala Lumpur Tel (60) 3 2162 8841 Fax (60) 3 2166 5099
www.poems.com.my
HONG KONG Phillip Securities (HK) Ltd
11/F United Centre 95 Queensway Hong Kong Tel (852) 2277 6600 Fax: (852) 2868 5307
www.phillip.com.hk
JAPAN Phillip Securities Japan, Ltd
4‐2 Nihonbashi Kabutocho, Chuo‐ku Tokyo 103‐0026
Tel: (81) 3 3666 2101 Fax: (81) 3 3664 0141 www.phillip.co.jp
INDONESIA PT Phillip Securities Indonesia
ANZ Tower Level 23B, Jl Jend Sudirman Kav 33A, Jakarta 10220, Indonesia
Tel (62) 21 5790 0800 Fax: (62) 21 5790 0809 www.phillip.co.id
CHINA Phillip Financial Advisory (Shanghai) Co. Ltd.
No 550 Yan An East Road, Ocean Tower Unit 2318 Shanghai 200 001
Tel (86) 21 5169 9200 Fax: (86) 21 6351 2940 www.phillip.com.cn
THAILAND Phillip Securities (Thailand) Public Co. Ltd.
15th Floor, Vorawat Building, 849 Silom Road, Silom, Bangrak, Bangkok 10500 Thailand
Tel (66) 2 2268 0999 Fax: (66) 2 2268 0921 www.phillip.co.th
FRANCE King & Shaxson Capital Ltd.
3rd Floor, 35 Rue de la Bienfaisance 75008 Paris France
Tel (33) 1 4563 3100 Fax : (33) 1 4563 6017 www.kingandshaxson.com
UNITED KINGDOM King & Shaxson Ltd.
6th Floor, Candlewick House, 120 Cannon Street London, EC4N 6AS
Tel (44) 20 7929 5300 Fax: (44) 20 7283 6835 www.kingandshaxson.com
UNITED STATES Phillip Futures Inc.
141 W Jackson Blvd Ste 3050 The Chicago Board of Trade Building
Chicago, IL 60604 USA Tel (1) 312 356 9000 Fax: (1) 312 356 9005
AUSTRALIA PhillipCapital Australia
Level 37, 530 Collins Street Melbourne, Victoria 3000, Australia
Tel: (61) 3 9629 8380 Fax: (61) 3 9614 8309 www.phillipcapital.com.au
SRI LANKA Asha Phillip Securities Limited
Level 4, Millennium House, 46/58 Navam Mawatha, Colombo 2, Sri Lanka
Tel: (94) 11 2429 100 Fax: (94) 11 2429 199 www.ashaphillip.net/home.htm
INDIA PhillipCapital (India) Private Limited
No. 1, C‐Block, 2nd Floor, Modern Center , Jacob Circle, K. K. Marg, Mahalaxmi Mumbai 400011 Tel: (9122) 2300 2999 Fax: (9122) 6667 9955 www.phillipcapital.in

– 48 of 48 –
25 February 2014 / INDIA EQUITY RESEARCH / IT SERVICES SECTOR UPDATE
Disclosures and Disclaimers PhillipCapital (India) Pvt. Ltd. has three independent equity research groups: Institutional Equities, Institutional Equity Derivatives and Private Client Group. This report has been prepared by Institutional Equities Group. The views and opinions expressed in this document may or may not match or may be contrary at times with the views, estimates, rating, target price of the other equity research groups of PhillipCapital (India) Pvt. Ltd. This report is issued by PhillipCapital (India) Pvt. Ltd. which is regulated by SEBI. PhillipCapital (India) Pvt. Ltd. is a subsidiary of Phillip (Mauritius) Pvt. Ltd. References to "PCIPL" in this report shall mean PhillipCapital (India) Pvt. Ltd unless otherwise stated. This report is prepared and distributed by PCIPL for information purposes only and neither the information contained herein nor any opinion expressed should be construed or deemed to be construed as solicitation or as offering advice for the purposes of the purchase or sale of any security, investment or derivatives. The information and opinions contained in the Report were considered by PCIPL to be valid when published. The report also contains information provided to PCIPL by third parties. The source of such information will usually be disclosed in the report. Whilst PCIPL has taken all reasonable steps to ensure that this information is correct, PCIPL does not offer any warranty as to the accuracy or completeness of such information. Any person placing reliance on the report to undertake trading does so entirely at his or her own risk and PCIPL does not accept any liability as a result. Securities and Derivatives markets may be subject to rapid and unexpected price movements and past performance is not necessarily an indication to future performance. This report does not have regard to the specific investment objectives, financial situation and the particular needs of any specific person who may receive this report. Investors must undertake independent analysis with their own legal, tax and financial advisors and reach their own regarding the appropriateness of investing in any securities or investment strategies discussed or recommended in this report and should understand that statements regarding future prospects may not be realized. In no circumstances it be used or considered as an offer to sell or a solicitation of any offer to buy or sell the Securities mentioned in it. The information contained in the research reports may have been taken from trade and statistical services and other sources, which we believe are reliable. PhillipCapital (India) Pvt. Ltd. or any of its group/associate/affiliate companies do not guarantee that such information is accurate or complete and it should not be relied upon as such. Any opinions expressed reflect judgments at this date and are subject to change without notice Important: These disclosures and disclaimers must be read in conjunction with the research report of which it forms part. Receipt and use of the research report is subject to all aspects of these disclosures and disclaimers. Additional information about the issuers and securities discussed in this research report is available on request. Certifications: The research analyst(s) who prepared this research report hereby certifies that the views expressed in this research report accurately reflect the research analyst’s personal views about all of the subject issuers and/or securities, that the analyst have no known conflict of interest and no part of the research analyst’s compensation was, is or will be, directly or indirectly, related to the specific views or recommendations contained in this research report. The Research Analyst certifies that he /she or his / her family members does not own the stock(s) covered in this research report. Independence: PhillipCapital (India) Pvt. Ltd. has not had an investment banking relationship with, and has not received any compensation for investment banking services from, the subject issuers in the past twelve (12) months, and PhillipCapital (India) Pvt. Ltd does not anticipate receiving or intend to seek compensation for investment banking services from the subject issuers in the next three (3) months. PhillipCapital (India) Pvt. Ltd is not a market maker in the securities mentioned in this research report, although it or its affiliates may hold either long or short positions in such securities. PhillipCapital (India) Pvt. Ltd does not hold more than 1% of the shares of the company(ies) covered in this report. Suitability and Risks: This research report is for informational purposes only and is not tailored to the specific investment objectives, financial situation or particular requirements of any individual recipient hereof. Certain securities may give rise to substantial risks and may not be suitable for certain investors. Each investor must make its own determination as to the appropriateness of any securities referred to in this research report based upon the legal, tax and accounting considerations applicable to such investor and its own investment objectives or strategy, its financial situation and its investing experience. The value of any security may be positively or adversely affected by changes in foreign exchange or interest rates, as well as by other financial, economic or political factors. Past performance is not necessarily indicative of future performance or results. Sources, Completeness and Accuracy: The material herein is based upon information obtained from sources that PCIPL and the research analyst believe to be reliable, but neither PCIPL nor the research analyst represents or guarantees that the information contained herein is accurate or complete and it should not be relied upon as such. Opinions expressed herein are current opinions as of the date appearing on this material and are subject to change without notice. Furthermore, PCIPL is under no obligation to update or keep the information current. Copyright: The copyright in this research report belongs exclusively to PCIPL. All rights are reserved. Any unauthorized use or disclosure is prohibited. No reprinting or reproduction, in whole or in part, is permitted without the PCIPL’s prior consent, except that a recipient may reprint it for internal circulation only and only if it is reprinted in its entirety. Caution: Risk of loss in trading in can be substantial. You should carefully consider whether trading is appropriate for you in light of your experience, objectives, financial resources and other relevant circumstances. For U.S. persons only: This research report is a product of PhillipCapital (India) Pvt Ltd. which is the employer of the research analyst(s) who has prepared the research report. The research analyst(s) preparing the research report is/are resident outside the United States (U.S.) and are not associated persons of any U.S. regulated broker‐dealer and therefore the analyst(s) is/are not subject to supervision by a U.S. broker‐dealer, and is/are not required to satisfy the regulatory licensing requirements of FINRA or required to otherwise comply with U.S. rules or regulations regarding, among other things, communications with a subject company, public appearances and trading securities held by a research analyst account. This report is intended for distribution by PhillipCapital (India) Pvt Ltd. only to "Major Institutional Investors" as defined by Rule 15a‐6(b)(4) of the U.S. Securities andExchange Act, 1934 (the Exchange Act) and interpretations thereof by U.S. Securities and Exchange Commission (SEC) in reliance on Rule 15a 6(a)(2). If the recipient of this report is not a Major Institutional Investor as specified above, then it should not act upon this report and return the same to the sender. Further, this report may not be copied, duplicated and/or transmitted onward to any U.S. person, which is not the Major Institutional Investor. In reliance on the exemption from registration provided by Rule 15a‐6 of the Exchange Act and interpretations thereof by the SEC in order to conduct certain business with Major Institutional Investors, PhillipCapital (India) Pvt Ltd. has entered into an agreement with a U.S. registered broker‐dealer, Marco Polo Securities Inc. ("Marco Polo").Transactions in securities discussed in this research report should be effected through Marco Polo or another U.S. registered broker dealer PhillipCapital (India) Pvt. Ltd. Registered office: 2nd Floor, C‐Block, Modern Centre, Mahalaxmi, Mumbai – 400011