it operations analytics benchmark · pdf filethe cloud environment lags far behind in terms of...
TRANSCRIPT
IT Operations Analytics Benchmark Survey Published by

© Continuity Software, 2013 2
Executive Summary
The goal of this benchmark survey is to provide IT executives with an understanding of how operational analytics are used by peer organizations to meet their performance goals. The results presented here are based on responses from 90 IT professionals from a range of industries and geographies collected through an online survey. Some of the survey’s key findings include:
Large organizations commonly use analytical tools to measure IT performance.
Over half (57%) of the large organizations surveyed use analytical tools to measure IT performance, compared to only 29% of the small companies surveyed.
The Cloud environment lags far behind in terms of monitoring and measurement.
Only 14% of the organizations surveyed track performance KPIs for their Cloud environment, compared to 49-71% in other parts of the IT infrastructure. Similarly, 43% of the organizations never analyze configuration consistency in the Cloud, compared to 13-17% in other areas of the IT infrastructure.
Using analytical tools to measure IT performance helps organizations transform their insights into operational improvements.
Of the organizations that are using analytical tools for measuring IT performance, 69% are able to transform all or most insights into improvements. That’s compared to 44% of the organizations that are not using analytical tools.
© Continuity Software, 2013 3
Frequently tracking configuration consistency across more areas of IT operations correlates to the extent that organizations are able to meet their KPI goals.
53% of the organizations that track configuration consistency on a daily basis across 5-6 IT operations areas are meeting or exceeding their goals, compared to 31-33% of the organizations that track only up to 4 areas.
Survey respondents recognize the importance of better IT measurement and analysis tools.
Using better analysis tools is the most commonly cited means for achieving operational excellence, mentioned by 40% of the respondents.

© Continuity Software, 2013 4
Table of Contents
Key Performance Indicators for IT Operations Excellence................................................................................................................... 5
Frequency of Tracking ...................................................................................................................................................................................................... 6
Most Difficult KPIs to Meet ............................................................................................................................................................................................ 7
Who Is Concerned with KPIs? ..................................................................................................................................................................................... 8
Achieving KPI Goals: The Reality .............................................................................................................................................................................. 9
Use of Tools to Measure IT Performance ......................................................................................................................................................... 10
Areas of IT Operations Monitored for KPIs .................................................................................................................................................... 11
KPIs Measured Across All or Most Domains .................................................................................................................................................. 12
Frequency of Analyzing Configuration Consistency across IT Operations Areas ............................................................. 13
Meeting KPI Goals vs. Frequency of Analyzing Configuration Consistency across IT Operations Areas ........ 14
Transforming Insights into Improvements .................................................................................................................................................... 15
Transforming Insights into Improvements by Using Analytical Tools ...................................................................................... 16
Incorporating Operational Analytics in Decision Making .................................................................................................................... 17
Means to Achieve Operations Excellence ......................................................................................................................................................... 18
Respondent Demographics ......................................................................................................................................................................................... 19
Respondent Demographics ......................................................................................................................................................................................... 20

© Continuity Software, 2013 5
Key Performance Indicators for IT Operations Excellence
Uptime / System Availability is the leading KPI for IT operations cited by 92% of the respondents, followed by Performance / Response Time (80%).
Other common KPIs for IT operations include Data Loss (56%), Number of Open Issues (52%), Average Time to Fix (51%), and Security Breaches (49%).
Figure 1: KPIs for IT operations excellence
(respondents could select multiple options)
38%
49%
51%
52%
56%
80%
92%
Mean Time Between Failures (MTBF)
Security Breaches
Average Time to Fix
Number of Open Issues
Data Loss
Performance / Response Time
Uptime / System Availability

© Continuity Software, 2013 6
Frequency of Tracking
The top 3 KPIs - uptime, performance and data loss are among the top 4 most frequently tracked with 43%, 28% and 24% respectively tracking it in real-time.
Security breaches are tracked second only to uptime with 33% tracking it at real-time.
Figure 2: Frequency of Tracking KPIs
43% 33% 28% 24%
11% 8%
17% 24%
17% 26%
35%
24%
11% 9%
9% 8% 16%
9%
24% 14%
20% 26%
28%
33%
1%
5%
2%
1%
1%
1%
8% 19%
10% 18%
0%
10%
20%
30%
40%
50%
60%
70%
80%
90%
100%
Uptime SecurityBreaches
Data Loss Performance Number ofOpen Issues
AverageTime to Fix
real-time daily weekly monthly annually never

© Continuity Software, 2013 7
Most Difficult KPIs to Meet
According to the survey respondents, Performance is the most difficult KPI to meet, cited by 29% of the most difficult to meet and by 74% of the respondents as one of the three most difficult.
It is followed by Uptime, cited by 17% as the most difficult to meet and by 48% as one of the three most difficult.
Figure 3: Most difficult KPIs to meet
29%
17% 15% 14% 7% 7%
28%
12% 11% 10%
12% 9%
17%
19%
5% 8% 18% 15%
0%
10%
20%
30%
40%
50%
60%
70%
80%
Performance Uptime Number ofOpen Issues
SecurityBreaches
Data Loss MTBF
Most difficult 2nd most difficult 3rd most difficult

© Continuity Software, 2013 8
Who Is Concerned with KPIs?
In 79% of the organizations surveyed the CIO is the one most concerned with IT Operations KPIs.
Corporate Auditing (48%), the CEO (36%) and the COO (30%) are also concerned with these KPIs.
Figure 4: Concerned with KPIs
(respondents could select multiple options)
79%
48%
36% 30%
26% 20% 20%
11%
CIO Audit CEO COO Other C-level
CFO Board ofDirectors
Other

© Continuity Software, 2013 9
Achieving KPI Goals: The Reality
Most organizations do a very good job meeting their KPI goals, with 36% of the respondents consistently meeting or exceeding their goals.
Just over a third of the respondents (34%) cited they met their KPI goals most of the time.
23% achieved some of their goals but not consistently, while 8% could not tell whether they met their goals or not.
Figure 5: Achieving KPI goals
7%
29%
34%
23%
8%
Exceeded ourgoals
Consistently metour goals
Met our goalsmost of the time
Met some of ourgoals but notconsistently
We don't reallyknow

© Continuity Software, 2013 10
Use of Tools to Measure IT Performance
Over half (57%) of the large organizations surveyed use analytical tools to measure IT performance, compared to only 29% of the small companies surveyed.
Figure 6: Use of tools to measure IT performance by company size
29%
57%
71%
43%
0%
10%
20%
30%
40%
50%
60%
70%
80%
90%
100%
<2,500 >2,500
No
Yes
Number of employees in the organization

© Continuity Software, 2013 11
Areas of IT Operations Monitored for KPIs
Close to three-quarters (71%) of the organizations surveyed monitor their Storage and Network for their KPIs.
Other areas of IT operations that are commonly monitored for KPIs are Applications (69%), Databases (66%) and Clusters (49%).
The Cloud environment is still not as commonly monitored as some of the other areas of the infrastructure (14%).
Figure 7: Areas where KPIs are monitored
(respondents could select multiple options)
71% 71% 69% 66%
49%
14% 10%

© Continuity Software, 2013 12
KPIs Measured Across All or Most Domains
As the leading KPI for IT operations excellence, Uptime is measured across all or most domains in 89% of the organizations surveyed.
Performance (66%) and Number of Open Issues (51%) are additional KPIs that are commonly measured across all or most domains.
Figure 8: KPIs measured across all or most domains
(respondents could select multiple options)
2%
25%
35%
43%
46%
51%
66%
89%
Other
MTBF
Data Loss
Average Time to Fix
Security Breaches
Number of Open Issues
Performance / Response Time
Uptime / System Availability

© Continuity Software, 2013 13
Frequency of Analyzing Configuration Consistency across IT Operations Areas
39% of the organizations surveyed analyze configuration consistency across their Network either in real-time (23%) or daily (16%).
At the same time, 43% of the organizations never analyze configuration consistency in the Cloud.
Figure 9: Frequency of analyzing configuration consistency
23% 19% 14% 14% 10% 13%
16% 16%
18% 16% 17% 7%
16% 14% 15% 20%
15%
6%
9% 13% 15% 9%
18%
13%
8% 16% 14% 14% 10%
7%
16% 14% 12%
10% 14%
10%
13% 9% 12% 17% 17%
43%
0%
10%
20%
30%
40%
50%
60%
70%
80%
90%
100%
Network Storage Databases Clusters Applications Cloud
real-time daily weekly monthly quarterly annually never
© Continuity Software, 2013 14
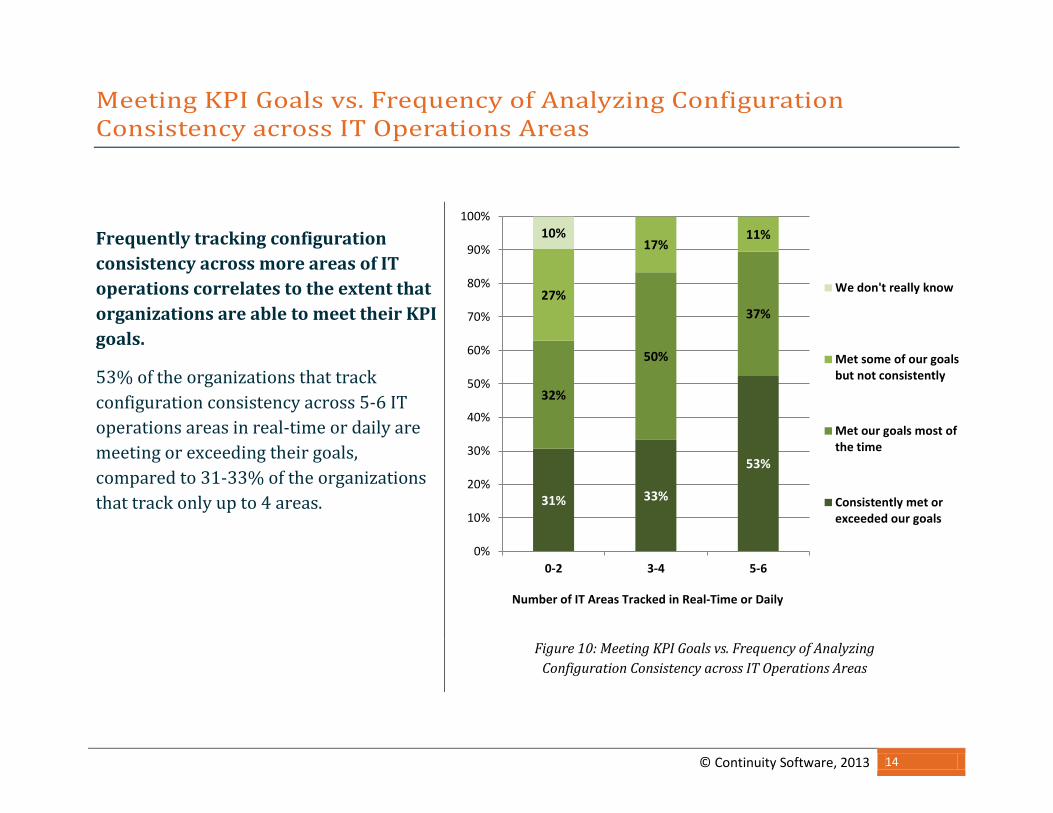
Meeting KPI Goals vs. Frequency of Analyzing Configuration Consistency across IT Operations Areas
Frequently tracking configuration consistency across more areas of IT operations correlates to the extent that organizations are able to meet their KPI goals.
53% of the organizations that track configuration consistency across 5-6 IT operations areas in real-time or daily are meeting or exceeding their goals, compared to 31-33% of the organizations that track only up to 4 areas.
Figure 10: Meeting KPI Goals vs. Frequency of Analyzing Configuration Consistency across IT Operations Areas
31% 33%
53%
32%
50%
37% 27%
17% 11% 10%
0%
10%
20%
30%
40%
50%
60%
70%
80%
90%
100%
0-2 3-4 5-6
We don't really know
Met some of our goalsbut not consistently
Met our goals most ofthe time
Consistently met orexceeded our goals
Number of IT Areas Tracked in Real-Time or Daily

© Continuity Software, 2013 15
Transforming Insights into Improvements
55% of the organizations surveyed are able to transform all or most of the relevant insights from IT analytics into actionable plans for improvement.
38% are able to translate only some of the relevant insights into improvements.
Figure 11: Transforming insights into improvements
7%
38%
43%
12%
Rarely do insights translate intoimprovements
Some relevant insights translate intoimprovements
Most relevant insights translate intoimprovements
Every relevant insight translates intoimprovement

© Continuity Software, 2013 16
Transforming Insights into Improvements by Using Analytical Tools
Of the organizations that are using analytical tools for measuring IT performance, 69% are able to transform all (22%) or most (47%) insights into improvements.
That’s compared to 44% of the organizations that are not using analytical tools.
Figure 12: Transforming insights into improvements by using analytical tools
22%
5%
47%
39%
28%
46%
3% 10%
0%
10%
20%
30%
40%
50%
60%
70%
80%
90%
100%
Using analytical tools Not using analyticaltools
Rarely do insights translateinto improvements
Some relevant insightstranslate intoimprovements
Most relevant insightstranslate intoimprovements
Every relevant insighttranslates intoimprovement

© Continuity Software, 2013 17
Incorporating Operational Analytics in Decision Making
48% of the organizations surveyed incorporate operational analytics in every (14%) or most (34%) critical decision.
In as many as 38% of the organization only some critical decisions are informed by operational analytics.
Figure 13: Incorporating operational analytics in decision making
14%
38%
34%
14%
Rarely do critical decisions informed byoperational analytics
Some critical decisions are informed byoperational analytics
Most critical decisions are informed byoperational analytics
Every critical decision is informed byoperational analytics

© Continuity Software, 2013 18
Means to Achieve Operations Excellence
Better measurement and analysis tools are the most common means for achieving operations excellence, cited by 40% of the respondents.
Tools to detect cross-domain IT configuration issues and tools to enforce IT best practices were mentioned by 22% and 19% of respondents respectively.
Figure 14: Means to achieve operations excellence
4%
14%
19%
22%
40%
Other
Automation of auditing/testing andquality assurance
Tools to enforce IT best practices
Tools to detect cross-domain ITconfiguration issues
Better measurement and analysis tools

© Continuity Software, 2013 19
Respondent Demographics
44% of the survey respondents come from organizations of 5,000 or more employees.
51% of the respondents have more than 500 servers in their datacenter and 25% have more than 2500 servers.
Figure 15: Number of employees
Figure 16: Number of servers
31%
18%
7%
44%
1-500 501-2,500 2,501-,5000 >5,000
19%
15% 14%
26% 25%
< 50 51-100 101-500 501-2,500 > 2500

© Continuity Software, 2013 20
Respondent Demographics 23% of the respondents represent financial services organizations, while 17% come from the business services sector and 11% are in manufacturing.
Figure 17: Respondent Industry
IT Infrastructure is the function most represented among survey respondents (24%), followed by Service Availability (15%), Applications (14%), and Business Continuity (10%).
Figure 18: Respondent Function in the Organization
23%
17%
11% 9%
7%
6%
6%
4%
19% Financial Services
Business Services
Manufacturing
Healthcare
Media
Public Sector
High Tech
Retail
Other
24%
15%
14% 10% 7%
6%
6%
6%
4% 3% 7%
Infrastructure
Service Availability
Applications
Business Continuity
Risk Management
Database
Disaster Recovery
Storage
Compliance
Cloud / Virtualization
Other

© Continuity Software, 2013 21
Table of Figures
Figure 1: KPIs for IT operations excellence ............................................................................................................................................... 5 Figure 2: Frequency of Tracking KPIs ....................................................................................................................................................... 6 Figure 3: Most difficult KPIs to meet ......................................................................................................................................................... 7 Figure 4: Concerned with KPIs .................................................................................................................................................................. 8 Figure 5: Achieving KPI goals .................................................................................................................................................................... 9 Figure 6: Use of tools to measure IT performance by comapnay size .................................................................................................... 10 Figure 7: Monitoring IT operations areas for KPIs ................................................................................................................................. 11 Figure 8: KPIs measured acrss all or most domains ............................................................................................................................... 12 Figure 9: Frequency of analyzing configuration consistency ................................................................................................................. 13 Figure 10: Meeting KPI Goals vs. Frequency of Analyzing Configuration Consistency across IT Operations Areas ........................... 14 Figure 11: Transforming insights into improvements ............................................................................................................................ 15 Figure 12: Transforming insights into improvements by using analytical tools................................................................................... 16 Figure 13: Incorporating operational analytics in decision making ..................................................................................................... 17 Figure 14: Means to achieve operations excellence ................................................................................................................................ 18 Figure 15: Number of employees ............................................................................................................................................................. 19 Figure 16: Number of servers .................................................................................................................................................................. 19 Figure 17: Respondent Industry .............................................................................................................................................................. 20 Figure 18: Respondent Function in the Organization ............................................................................................................................ 20
© Continuity Software, 2013 22
Sign up for a Service Availability Assessment About Continuity Software
Sign up for a Service Availability Assessment and find out how your IT organization can improve your ability to meet critical KPI goals: • Find hidden risks that can jeopardize your
datacenter • Test your environment against a database of
5,000+ documented availability risks • Get actionable recommendations that will help
you eliminate availability risks before they impact your business
100% of the companies that have performed the assessment uncovered vulnerabilities that were previously undetected! Sign up today
Continuity Software is a leading provider of Service Availability Management solutions, helping many of the world’s largest organizations avoid infrastructure outages and prevent service disruptions. By proactively detecting single-points-of-failure and deviations from vendor best-practices across all layers of the IT infrastructure, our software will help you ensure IT operations excellence and 24x7 availability. For more information Website: www.continuitysoftware.com Email: [email protected] Tel: 1-888-782-8170 or +1-646.216.8628