it comes down to this - annual reports
TRANSCRIPT

A R
it comes down to this
A R

Esterline brings one vision to theway we run our business, and to theway we develop, apply and marketour technologies. So that customersget more from a single source; sothat our operations and acquisitionsthrive by leveraging expertise andreaching new markets; so that ourbusiness continues to grow.

one way to work: a thousand ways
1999 2000
revenue per employee dollars in thousands 114 122
Some call it lean manufacturing. Others call it cell manufacturing. At Esterline, the resultis the same. Everyone is involved. Our people apply their own initiative to evaluate workprocess, procedures, techniques – everything that affects their ability to do the best possiblejob. Yielding the best, most efficient results for our company, our customers and our people.

implementation : New ideas are put to work. Theresults are monitored and evaluated and a feedback looptakes shape, bringing processes together with people andcustomer expectations for better results.
involvement : Lean manufacturing is a process thatoriginates with and touches every employee, from the floorto the office, through shipping, purchasing and planning.It ultimately integrates resources, ideas and abilities andfocuses our company on specific goals.
improvement : The outcome is continuous improvementin building a more competitive, more responsive company.Which in turn generates more new ideas, setting morenew goals.

highly engineeredone kind of product:
1999 2000
revenue from new products perc ent 13 23
The products we make share a number of important traits. Each one is highly engineered.Each one sets the standard for high-performance, durability and productivity. Each onesolves multiple problems for our customers. Each one is the result of our collective knowl-edge and experience.

develop : Our cumulative expertise makes it possible forEsterline to do much of the applied problem-solving andproduct development for many of our customers.
demand : Because our products solve unique problems,Esterline technology is often written into the specifications,becoming a permanent and integral element.
deploy : For new applications, retrofits andupgrades, Esterline products are deployed byhundreds of customers all over the world.

deepone level of service:
1999 2000
on-time delivery to aerospace/defense customers perc ent 92 95
The industry trend is clear and accelerating: major customers want to reduce the numberof vendors they deal with for specific reasons. They seek greater, more reliable system inte-gration, higher dependability, greater access to talent, streamlined purchasing and thebenefits of outsourcing. Esterline is built to provide all these advantages.

explore : Esterline provides the engineering talent tosolve the problems, develop the new solutions and systemson behalf of our customers, making us more a partner thanjust a supplier of parts.
export : We can move our technology from onediscipline and apply it to another. What customersget from Esterline is a deep and broad resourcecapable of crossbreeding technologies for new solutions.
expand : Virtually every product Esterline makes has theopportunity to add new features, new technology and newconnections to other systems: a comprehensive suite ofproducts, solutions and capabilities our customers seek.

multiply opportunitiesone strategy:
bolt-onproduct lines
stand-alonebusinesses
5 6acquisitions completed in five years
Esterline is as much a way of doing things as it is a company. It’s a way of cross-fertilizingtechnologies and markets through internal development and acquisition. A way of think-ing about problems that creates entirely new and unexpected solutions. A way of workingthat makes us a product manufacturer, a service organization and a leading innovator.
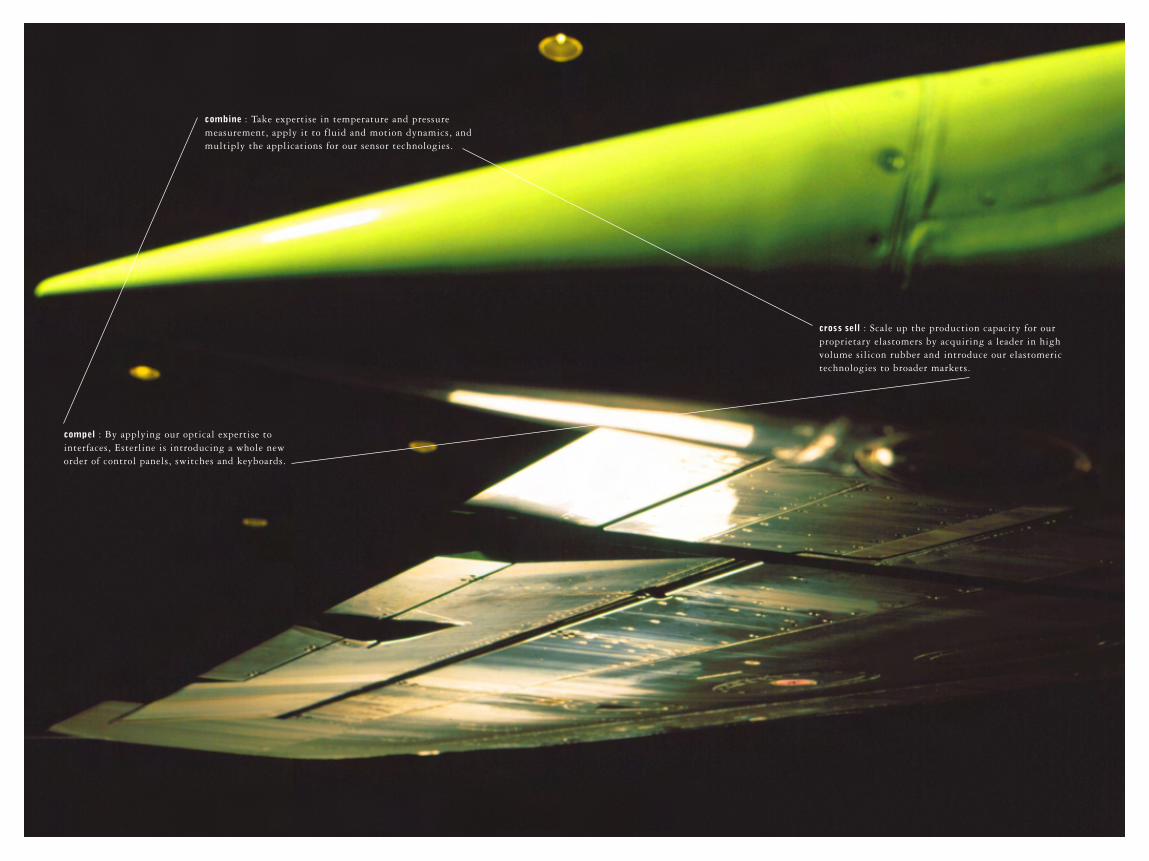
compel : By applying our optical expertise tointerfaces, Esterline is introducing a whole neworder of control panels, switches and keyboards.
cross sell : Scale up the production capacity for ourproprietary elastomers by acquiring a leader in highvolume silicon rubber and introduce our elastomerictechnologies to broader markets.
combine : Take expertise in temperature and pressuremeasurement, apply it to fluid and motion dynamics, andmultiply the applications for our sensor technologies.

growone message:
1999 2000
1.40 1.75earnings per share from operations dollars
The sum of all these initiatives continue to shape our business in a way that meets andexceeds the demands of our customers and the marketplace, that recognizes and rewardsour employees and our shareholders. Esterline will grow by seeking and creating newopportunities related to our core business, applying the benefits of lean manufacturing andstaying ahead of what the marketplace demands.

market share : As Esterline continues to becomemore of a single-source provider, our market opportunitiesexpand into new, but always related, areas.
bottomline : Esterline’s focus remains on results.Whenever the topline grows, it is because we knowthe bottomline will grow first.
topline : In acquiring new companies to expandour product offerings, we grow topline revenues,our product portfolios and the science we can bringto problem-solving.

We seek multiple results from eachindividual effort. So that one ofour technologies expands another;one market application leads toothers; one customer relationshipbuilds many more. Our operationswill be the best fit for our customers.As our customers change andgrow, so does Esterline.

Esterl ine 2000
a) financial highlights
b) letter to shareholders
c) financial charts
d) financial review
A R

ESL 2000 / page 1
Esterline Technologies is aspecialized manufacturing companyprincipally serving aerospace, defenseand electronic markets. Esterlineis headquartered in Bellevue,Washington, and is listed on theNew York Stock Exchange withthe trading symbol ESL.

ESL 2000 / page 2
financial highlights:

ESL 2000 / page 3
in thousands, except per share amounts
for fiscal years 2 0 0 0 1 9 9 9
Operating Results
Sales $ 490,966 $ 460,969Segment earnings 65,374 56,932Net earnings 32,587 29,862Net earnings per share – basic 1.88 1.72Net earnings per share – diluted 1.85 1.69
Weighted average shares outstanding – basic 17,375 17,337Weighted average shares outstanding – diluted 17,654 17,658
Financial Position
Total assets $ 474,339 $ 453,082Property, plant and equipment – net 87,410 89,339Working capital 121,621 140,908Shareholders’ equity 249,695 224,620
1999 2000
earnings per share from operations dollars 1.40 1.75

ESL 2000 / page 4
to our shareholders:

ESL 2000 / page 5
The first year of the new century turned out great forEsterline. The direction we’ve moved the company inrecent years certainly is paying off, most notably as webegin to feel the leverage of our strategic acquisitions.Simultaneously we’re beginning to benefit from improv-ing aerospace /defense markets, where about two-thirdsof our revenues are now generated.
Over the past several years, we have worked hard tobring sharper focus to the way we develop, apply andmarket our technologies. We have concentrated on ourcore competencies and strengthened already solid nichemarket positions.
One way to maintain this focus is to identify andstrengthen strategic growth platforms that addressspecific technical markets with high-performancecharacteristics and attractive growth potential. Thispotential stems not only from current market applica-tions but also from expansion into adjacent marketswith similar high-end requirements.
High performance where man meets machine
A primary growth platform is based on our long-termposition with Boeing to manufacture lighted cockpitswitches for commercial jets. In the last decade we haveexpanded this business to a wide array of customers, toinclude pilot control sticks and wheels, switch panelsand surrounds, and active matrix liquid crystal displays(AMLCD) for both commercial and defense applications.
1999 2000
earnings per share dollars 1.69 1.85
Let t e r t o Shareho lder s

ESL 2000 / page 6 Let t e r t o Shareho lder s
We now have good positions with Airbus and manyregional and executive jet manufacturers as well. Andwe have continued to benefit from our longstandingpresence on every new Boeing commercial jet built –a position that also leads to substantial aftermarketdemand from airlines.
In addition, as fleets of military aircraft and landvehicles are upgraded to state-of-the-art electronicsystems, demand for our specialized control grips andproprietary sunlight-readable/night-vision compatibleswitches and displays is growing steadily. Esterline isnow a major supplier of mission-critical cockpit controlcomponents for many of the world’s most modernweapons systems.
We are also pushing this technological competency toadditional high-end markets. Early in the fiscal year,we acquired a leading independent manufacturer ofcustom multifunction data input subsystems designedprincipally for medical equipment, high-end industrialand defense applications. The acquisition significantlyextended our overall market potential for commercialproducts, and added many highly qualified engineersto Esterline’s technical resource base.
Through a combination of new product development,market share gains, and strategic acquisitions, thisgrowth platform, which we call “high-performanceman/machine interfaces,” has grown in excess of 250%in the last five years.

ESL 2000 / page 7
1999 2000
sales to foreign customers perc ent 30 32
Let t e r t o Shareho lder s
Global aerospace expansion continues
Another growth platform is our high-performance sen-sors and controls business in Europe. Aviation marketscontinue to globalize, making this operation essential toour strategy. As with our cockpit components, we startedwith a strong position with a key customer – high-per-formance temperature sensors for the GE/Snecma jointventure CFM-56 jet engine. In 2000, this engine wasselected to power more than half of all 100+ seat aircraftdelivered, bringing the total number of engines eitherflying or on order to 14,000. The CFM-56 powers allBoeing 737s and most Airbus models, as well as anumber of military aircraft.
We have grown this platform in two ways. First, weextended our product offering, and second, expanded ourgeographic reach beyond Europe. Through a combina-tion of R&D and product line acquisitions, we broadenedour offering of temperature sensors. These products nowinclude airborne optical radiation pyrometers for turbineblade surface temperature measurement and thermo-couples for carbon disc brake monitoring. In a similarfashion, we developed a full line of high-performancepressure sensors.
Key to this geographic expansion was establishing amanufacturing base in the U.S., and another in the U.K.
in order to broaden access to major jet engine manufac-turers and their suppliers. We did this with a number ofacquisitions over the last several years. In the U.S., we
ESL 2000 / page 8 Let t e r t o Shareho lder s
purchased a manufacturer of fluid regulation componentsfor monitoring and controlling various flight systems.In the U.K., we purchased a manufacturer of micro-motors and motion control sensors. Here we gainedadditional positions with the British Ministry of Defenceand such prominent OEMs as TRW and BAE Systems.Possibly more important is our enhanced ability tosupport and cross-sell all of our product lines to keymanufacturers throughout Europe, the U.S. and the U.K.
Advanced materials focus on hostile environments
Our advanced materials platform evolved from special-ized clamps and other devices used in the installationof aircraft hydraulic and electrical systems – particularlyin and around the engine. As propulsion systems becamemore sophisticated, we designed components thatprotected critical systems from vibration and otherharsh conditions. This led to the development ofspecialized elastomers that would survive the hostileenvironment of a high-performance aircraft, includingextreme temperatures, caustic fluids, and high stress.
We built and acquired extensive manufacturing capabil-ity in late 1998, providing the critical mass and broadermarket reach to fully develop the opportunities foradvanced elastomer and polymer products. We are nowthe leading provider of this technology to the aerospace/defense industry, with solid positions on most airframes,jet and rocket engine programs, the space program, andmyriad other applications.
ESL 2000 / page 9
1999 2000
advanced materials segment sales from new products perc ent 8 14
Let t e r t o Shareho lder s
Related to this platform is our work with specializedordnance products, namely combustible propellant casesfor tank gun systems, artillery, and mortars. Esterlineis the U.S. Army’s sole supplier of these products. Theynot only act as rigid propellant containers, but alsoignite when fired, improving the performance of theammunition.
During the year, we received orders totaling $15 millionfor the first year’s requirement of a new type of combus-tible case for 155mm artillery rounds. The contract wasthe initial production order for the Army’s ModularArtillery Charge System (MACS). MACS is designed foruse with all 155mm artillery systems currently fieldedor under development, and optimized for the Army’s newCrusader extended range advanced field artillery system.
Automated PCB equipment business recovers
In our Automation segment, we are a leading manufac-turer of highly engineered automated machine toolsused in the fabrication of printed circuit boards (PCB)
and the cutting of plate steel. The PCB business postedsolid gains over last year as industry capacity require-ments grew from cyclical lows. Continued investmentduring the downcycle enabled us to introduce a numberof new products to a receptive market in 2000. Theseincluded lasers, to address micro hole sizes, and special-ized mechanical drilling equipment to accommodate thevery large “backplane” boards used in the internet andwireless communications infrastructure.

ESL 2000 / page 10 Let t e r t o Shareho lder s
Market conditions for our plate steel cutting equipmentare still at a cyclical bottom, as demand for our custom-ers’ products – principally heavy construction andagricultural equipment – remains soft. That said, ourlean manufacturing efforts have led to improved grossmargins compared with last year, despite lower sales,and we believe our new product development efforts willstand us in good stead when market conditions improve.
Outlook positive as efforts and markets align
As we enter 2001, I’m very encouraged about thedirection we’re taking Esterline. The overall marketenvironment is positive and our operations are well-positioned to benefit – particularly the 60+ percent ofour business that serves the aerospace/defense industry.
Increasing demand for air travel, and the need to replaceaging aircraft, supports long-term growth in commercialaerospace. In the near term, we’re encouraged by thesignificant increase in aircraft orders – from single-and dual-aisle commercial planes, to business jets andhelicopters.
On the defense side, the military’s continued focus onupgrades and modifications of existing weapons systems,and the increased use of electronics and technology ingeneral, are key trends we will continue to leverage.
We also anticipate that aftermarket sales – which in theaerospace and automation segments already account for

ESL 2000 / page 11
Robert W. Cremin
Chairman, Presidentand Chief Executive Officer
approximately a third of our total revenue – will be anincreasing portion of our business. And our new productdevelopment and acquisition efforts continue to playan important role in our growth.
Added to this is a dedication to driving efficiency.Here I want to emphasize that we are not concernedwith labels, but with results. Whether it’s called lean,one-piece flow, cell manufacturing or something else,our focus has always been to find new ways to improve.Many of our accomplishments over the years have beenthe result of keeping everyone involved. We haveworked hard to create the kind of environment whereall 4,000+ of our employees can participate first-handin making real, value-added contributions that resultin success for everyone associated with Esterline –our shareholders, our customers and our employees.

ESL 2000 / page 12
1996 – 2000:

ESL 2000 / page 13
99: 461.0
98: 453.9
97: 391.0
96: 352.8
2000
99: 29.9
98: 30.1
97: 25.3
96: 21.4
2000
99: 1.69
98: 1.70
97: 1.44
96: 1.31
2000
99: 183.2
98: 168.4
97: 154.1
96: 127.3
2000
99: 224.6
98: 196.4
97: 165.7
96: 142.3
2000
99: 65.1
98: 67.5
97: 56.7
96: 50.7
2000
shareholders’equityi
dollars in millionsi249.7
EBI TDAiearnings before interest, taxes,depreciation and amortizationi
dollars in millionsu75.1
backlogdollars in millions
228.3net earnings per share –
dilutedndollarsw
1.85
salesdollars in millions
491.0 net earningsdollars in millions
32.6

ESL 2000 / page 14
f inancial review:
ESL 2000 / page 15
Overview
Our strategic growth plan revolves around the development of three key technolo-gies – sensors and controls, specialized high-performance materials and illuminateddisplays. We are concentrating our efforts to selectively expand capabilities in thesemarkets. Our goal is to meet the evolving needs of our customers by providing abroad array of products and services through a single point of contact. We plan toaccomplish this through internal development and strategic acquisitions. Inter-nally, we are increasing our market presence by uniting sales forces, combiningmarketing opportunities and blending manufacturing knowledge and technologi-cal expertise.
Over the past several years we have focused on a selective acquisition and divest-iture program supporting our long-term strategy to be a leading supplier to aerospaceand defense customers throughout the world. Late in fiscal 1999, as a strategicaddition to our European aerospace operation, we purchased the aerospace group ofMuirhead Vactric and Norcroft Dynamics, Muirhead, a manufacturer of micro motorsand motion control components located in the United Kingdom. Also, late in fiscal1999, we divested Federal Products, an operation not aligned with our long-termdirection. In December 1999, we acquired a manufacturer of custom keyboardsand other multifunction data input subsystems, Advanced Input Devices Co., A.I.D.
This acquisition expanded our high-end illuminated displays and custom panelsoperations.
We view and operate our business in three different segments: Aerospace, Ad-vanced Materials and Automation. We primarily serve aerospace and defense customerswith manufactured products such as high-end components for avionics, propulsionand guidance systems, high-performance elastomers and other complex materialsin the Aerospace and Advanced Materials segments. The Automation segmentserves electronic equipment customers with printed circuit board, PCB, drillingequipment and heavy equipment manufacturers with automated machine tools forcutting and punching plate metal for heavy equipment applications.
Management’s Discussion and Analysis
MD&A

ESL 2000 / page 16
Results of Operations
Fiscal 2000 Compared with Fiscal 1999
Sales for fiscal 2000 grew 6.5% when compared with the prior year. Sales bysegment were as follows:
increas e (decrease)dollars in thousands from prior year 2 0 0 0 1 9 9 9
Aerospace 28.6% $ 236,269 $ 183,783Advanced Materials 1.1% 129,386 127,920Automation (16.0%) 125,311 149,266
Total $ 490,966 $ 460,969
Aerospace provided our key area of growth in fiscal 2000. Substantially all of thisgrowth was attributable to the acquisitions of Muirhead and A.I.D. Muirhead wasincluded for a full year in fiscal 2000 and only three months in the prior year. Inaddition, the timing of the A.I.D. acquisition resulted in the inclusion of approxi-mately three quarters of its sales in fiscal 2000. Sales growth in Advanced Materialswas affected by customer programs designed to rebalance inventory levels. Webelieve those inventory levels have been normalized. Order placement activity im-proved over the last two quarters of fiscal 2000.
The decrease in Automation sales was primarily a result of our October 1999divestiture of Federal Products. Excluding Federal Products on a comparativebasis, Automation sales increased 15.6% due to improved PCB manufacturingequipment business, driven largely by strong performance in the second half ofthe year. Performance in this area has been difficult to predict and current trendsindicate that the improvement may not continue through fiscal 2001. In addi-tion, equipment sales to the heavy equipment markets remained weak throughoutfiscal 2000 and are not expected to improve during fiscal 2001.
Sales to foreign customers, including export sales by domestic operations, to-taled $156.2 million and $137.3 million, and accounted for 31.8% and 29.8% ofour sales for fiscal 2000 and 1999, respectively.
Overall, gross margin as a percentage of sales was 36.6% and 37.9% for fiscal2000 and 1999, respectively. Gross margin by segment ranged from 35.0% to37.6% in fiscal 2000, compared with 33.7% to 40.4% in the prior year. Grossmargin ranges for fiscal 2000 were lower when compared to fiscal 1999 due to a
MD&A

ESL 2000 / page 17
combination of factors, including lower margins on some recent acquisitions inthe Aerospace segment; customer-related inventory rebalancing during the firstpart of fiscal 2000 in Advanced Materials; and a non-recurring inventory charge inAdvanced Materials.
Automation gross margin improved when compared with the prior year primarilydue to the PCB equipment revenue increases and cost cutting measures that havebeen implemented in the operations serving the heavy equipment markets.
Selling, general and administrative expenses (which include corporate expenses)decreased to $105.5 million in fiscal 2000 compared with $106.2 million in theprior year. As a percentage of sales, selling, general and administrative expenseswere 21.5% and 23.0% in fiscal 2000 and 1999, respectively. Overall sales vol-ume was weak throughout fiscal 1999 into the first quarter of fiscal 2000 and wefocused on tightening selling, general and administrative expenses. In the secondquarter of fiscal 2000, sales nearly matched the highest quarter in the prior yearand continued to improve throughout the rest of the year. We believe our effi-ciency improvements have facilitated the absorption of business without significantincreases in expenses. However, as an upward trend in sales continues, selling,general and administrative expenses will gradually increase. Long-term selling,general and administrative expense as a percentage of sales is unlikely to remain aslow as the 21.5% in fiscal 2000.
Research, development and related engineering spending was $20.8 million, or4.2% of sales, in fiscal 2000 compared with $24.0 million, or 5.2% of sales, in theprior year. During the year, several projects transitioned from prototype to pro-duction and accounted for the lower level of spending in the current fiscal year.
Segment earnings (excluding corporate expenses) increased 14.8% during fiscalyear 2000 to $65.4 million compared with $56.9 million in the prior year. Bysegment, Aerospace earnings increased 31.6% to $32.7 million for fiscal 2000 comparedwith $24.8 million in the prior year, primarily due to acquisitions. AdvancedMaterials earnings were $24.8 million for fiscal 2000 compared with $29.2 millionfor the prior year. The decrease in earnings for Advanced Materials was attribut-able to the customer-related inventory rebalancing and the write-down of inventory.Automation earnings improved to $7.9 million for fiscal 2000 compared with$2.9 million for the prior year. For fiscal 1999, Automation earnings were attrib-utable to Federal Products – sold at the end of that fiscal year. Excluding FederalProducts in a year-over-year comparison, the increase in Automation earnings wasprimarily related to improvements in business related to PCB markets.
MD&A

ESL 2000 / page 18
The $2.6 million gain on sale of business relates to the curtailment of retirementbenefits for certain Federal Products employees resulting from the October 28, 1999sale of that operation. This gain was reported during the third quarter when itwas first estimable. For purposes of the benefit calculations, credited service un-der the plan was frozen as of the date of sale. We do not anticipate any furtheradjustments related to the curtailment.
Interest income decreased to $2.2 million during fiscal 2000 compared with$2.9 million in the prior year. Interest expense decreased to $8.1 million duringfiscal 2000 compared with $9.0 million in the prior year.
The effective income tax rate for fiscal 2000 was 34.9% compared with fiscal1999 at 35.2%. Both years benefited from certain tax credits.
Net earnings in fiscal 2000 were $32.6 million, or $1.85 per share on a dilutedbasis, compared with $29.9 million, or $1.69 per share, in the prior year.
Orders received in fiscal 2000 increased 12.7% to $536.1 million from$475.7 million in the prior year. The increase is primarily attributable to Aero-space and Advanced Materials. Backlog at the end of fiscal 2000 was $228.3 millioncompared with $183.2 million at the end of the prior year. Approximately$46.1 million of backlog is scheduled to be delivered after fiscal 2001. Backlog issubject to cancellation until delivery.
Fiscal 1999 Compared with Fiscal 1998
Sales for fiscal 1999 grew 1.6% when compared with the prior year. Sales bysegment were as follows:
increas e (decrease)dollars in thousands from prior year 1 9 9 9 1 9 9 8
Aerospace 7.5% $ 183,783 $ 171,028Advanced Materials 39.8% 127,920 91,498Automation (22.0%) 149,266 191,376
Total $ 460,969 $ 453,902
Sales in Advanced Materials grew substantially in fiscal 1999. This growth wasprimarily attributable to Kirkhill Rubber Co., Kirkhill, acquired in August 1998.Kirkhill was included in Advanced Materials for a full year during fiscal 1999 andthree months in fiscal 1998. Aerospace continued to see improvements althoughat a slower rate than in the previous year. Sales in Aerospace were positively im-pacted by the acquisition of Muirhead. Revenues for this entity were included forthe last quarter of the year.
MD&A

ESL 2000 / page 19
Sales in Automation declined due to a variety of unfavorable market conditionsduring the year. These included continuing poor worldwide demand for PCB manufac-turing equipment as well as soft agriculture and automotive markets. The sale ofTulon Co., Tulon, in late fiscal 1998 also impacted Automation in the year-over-year comparison.
Sales to foreign customers, including export sales by domestic operations, totaled$137.3 million and $120.2 million, and accounted for 29.8% and 26.5% of oursales for fiscal 1999 and 1998, respectively.
Gross margin as a percentage of sales was 37.9% and 38.0% for fiscal 1999 and1998, respectively. Gross margins by segment ranged from 33.7% to 40.4% infiscal 1999 compared with 33.2% to 42.4% in the prior year. Gross margin inAerospace decreased slightly due to volumes that were lower than expected. Grossmargin for Advanced Materials decreased during the year due to volume decreasesand new business included for a full year, primarily Kirkhill. An increase in Auto-mation margin was related primarily to improvements at Federal Products relative tothe prior year, and the divestiture of Tulon late in fiscal 1998.
Selling, general and administrative expenses (which include corporate expenses)increased to $106.2 million in fiscal 1999 compared with $102.4 million in theprior year. As a percentage of sales, selling, general and administrative expenseswere 23.0% and 22.6% in fiscal 1999 and 1998, respectively.
Research, development and related engineering spending increased to $24.0 mil-lion in fiscal 1999 from $20.8 million in fiscal 1998, and as a percentage of saleswas 5.2% compared with 4.6% in the prior year. Developments continued in lasertechnology for Automation; sensors and controls for Aerospace; and fireproofingelastomer for Advanced Materials during fiscal 1999.
Segment earnings (excluding corporate expenses) decreased 5.3% during fiscal1999 to $56.9 million compared with $60.1 million in the prior year. Aerospaceearnings were essentially flat with the prior year. Advanced Materials posted earningsof $29.2 million in fiscal 1999 compared with $24.7 million in fiscal 1998. Theimprovement was primarily due to Kirkhill’s full year of earnings. Automationearnings decreased to $2.9 million in fiscal 1999 compared with $10.7 million inthe prior year. This reduction was primarily due to the continued effects of a de-pressed worldwide PCB equipment market and was compounded in the second halfof the year by a significant decline in the agriculture and heavy equipment sector.
Prior to the close of fiscal 1999, we completed the sale of Federal Products toMahr GmbH. Federal Products was our only measurement business and accountedfor less than ten percent of our sales during fiscal 1999. We recognized an $8.0million gain on the sale for fiscal 1999.
MD&A

ESL 2000 / page 20
Interest income increased to $2.9 million during fiscal 1999 compared with$1.6 million in the prior year. Interest expense increased to $9.0 million duringfiscal 1999 compared with $3.8 million in the prior year. In November 1998, wecompleted a $100.0 million private placement of senior notes (1999 Senior Notes).The proceeds of this placement were used to retire an outstanding bridge facilityarising from the Kirkhill acquisition. The remainder was invested and utilized tofund other internal expansion and acquisition activities.
The effective income tax rate decreased to 35.2% in fiscal 1999 from 35.9% infiscal 1998, primarily due to a one-time benefit related to state tax refunds.
Net earnings in fiscal 1999 were $29.9 million, or $1.69 per share on a dilutedbasis, compared with $30.1 million, or $1.70 per share, in the prior year.
Orders received in fiscal 1999 increased 6.1% to $475.7 million from$448.5 million in the prior year. Backlog at October 31, 1999 was $183.2 millioncompared with $168.4 million at the end of the prior year.
Liquidity and Capital Resources
Cash and cash equivalents at the end of fiscal 2000 totaled $50.9 million, adecrease of $4.2 million from the prior year. No short-term investments were heldat the end of fiscal 2000 compared with $25.9 million at the end of fiscal 1999.Net working capital decreased to $121.6 million at the end of fiscal 2000 from$140.9 million at the end of the prior year. These decreases were primarily attrib-utable to the acquisitions completed during late 1999.
Net accounts receivable were $83.3 million at the end of fiscal 2000 comparedwith $69.6 million at the end of the prior year. Sales increased $15.1 millionwhen compared with the prior year fourth quarter, resulting in a significant in-crease in net accounts receivable. Accounts payable were $25.0 million at the endof fiscal 2000 compared with $16.9 million at the end of the prior year. Theincrease was primarily due to the timing of payments in Automation. Net accountsreceivable and accounts payable were also higher due to the inclusion of A.I.D. forthe current year. Federal and foreign income taxes payable were $5.5 million atthe end of fiscal 2000 compared with $6.3 million at the end of fiscal 1999.
Net property, plant and equipment was $87.4 million at the end of fiscal 2000compared with $89.3 million at the end of the prior year. Goodwill increased to$138.0 million at the end of fiscal 2000 compared with $105.4 million at the endof the prior year, due to acquisitions completed during the year.
MD&A

ESL 2000 / page 21 MD&A
Capital expenditures for fiscal 2000 were $15.5 million (excluding acquisitions)and included machinery and equipment and enhancements to information tech-nology systems. Capital expenditures are anticipated to approximate $21.0 millionfor fiscal 2001. We will continue to support expansion through investments ininfrastructure including machinery, equipment, buildings and information systems.
Total debt decreased $12.0 million from the prior year to $117.4 million at theend of fiscal 2000, principally due to a reduction in outstanding short-term creditfacilities and repayment of debt. Total debt outstanding at the end of fiscal 2000consisted of $100.0 million under our 1999 Senior Notes, $11.4 million under our8.75% Senior Notes, and $6.0 million under various foreign currency debtagreements, including capital lease obligations. The 8.75% Senior Notes have ascheduled annual payment of $5.7 million, which will continue until maturity onJuly 30, 2002. The 1999 Senior Notes have maturities ranging from 5 to 10 yearsand interest rates from 6.00% to 6.77%. Management believes cash on hand, fundsgenerated from operations and other available debt facilities are sufficient to fundoperating cash requirements and capital expenditures through fiscal 2001.
Seasonality
The timing of our revenues is impacted by the purchasing patterns of our customersand as a result we do not generate revenues evenly throughout the year. Moreover,our first fiscal quarter, November through January, includes significant holidayvacation periods in both Europe and North America. This leads to decreased orderand shipment activity, consequently first quarter results are typically weaker thanother quarters and not necessarily indicative of our performance in subsequent quarters.
Market Risk Exposure
We have financial instruments that are subject to interest rate risk, principally debtobligations issued at a fixed rate. To the extent that sales are transacted in a foreigncurrency, we are also subject to foreign currency fluctuation risk. Furthermore,we have assets denominated in foreign currencies that are not offset by liabilitiesin such foreign currencies. Historically, we have not experienced material gains orlosses due to interest rate or foreign exchange fluctuations. We own a significantoperation in France. During the year, the foreign exchange rate for this countrydecreased significantly relative to the U.S. dollar, which resulted in an increase inaccumulated other comprehensive loss, as a result of the foreign currency transla-tion adjustment.
ESL 2000 / page 22 MD&A
Recent Accounting Pronouncements
In June 1998, the Financial Accounting Standards Board, FASB, issued Statementof Financial Accounting Standards, FAS, No. 133, “Accounting for DerivativeInstruments and Hedging Activities.” FAS No. 133 establishes standards for deriva-tive instruments and requires an entity to recognize all derivatives as either assetsor liabilities and measure those instruments at fair value. In June 1999, the FASB
issued FAS No. 137 which deferred the effective date of FAS No. 133. This stan-dard will be effective for us beginning in fiscal 2001. We utilize foreign currencyforward contracts primarily to reduce our exposure to fluctuations between theU.S. dollar and the French Franc. At the end of fiscal 2000, we held foreign cur-rency forward contracts totaling a notional amount of $8.5 million. If FAS No.133 was in effect at the end of fiscal 2000, this would have resulted in a gain ofapproximately $600,000. We anticipate that future similar foreign currency transac-tions will qualify for hedge accounting treatment under FAS No. 133.
In December 1999, the Securities and Exchange Commission issued StaffAccounting Bulletin No. 101, SAB No. 101, “Revenue Recognition in FinancialStatements.” In SAB No. 101, the Commission’s staff expressed its views regardingthe appropriate recognition of revenue with regard to a variety of circumstances.We will be required to adopt SAB No. 101 for the fourth quarter of fiscal 2001.We are currently evaluating SAB No. 101, however, we believe it will not have amaterial impact on our consolidated financial statements.
In March 2000, the FASB issued Interpretation No. 44, “Accounting for CertainTransactions Involving Stock Compensation,” an interpretation of Accounting PrinciplesBoard Opinion 25, “Stock Issued to Employees.” We adopted the Interpretationeffective July 1, 2000 and it did not have a material impact on the consolidatedfinancial statements.

ESL 2000 / page 23
for fiscal years 2 0 0 0 1 9 9 9 1 9 9 8 1 9 9 7 1 9 9 6
Operating Results
Sales $ 490,966 $ 460,969 $ 453,902 $ 390,958 $ 352,843Cost of sales 311,242 286,410 281,539 243,197 215,015Selling, general
and administrative 105,532 106,239 102,361 90,918 88,042Research, development
and engineering 20,839 24,022 20,846 17,556 15,373Gain on sale of business (2,591) (7,956) – – –Interest income (2,205) (2,859) (1,594) (2,397) (1,989)Interest expense 8,124 9,011 3,803 3,603 4,328Income tax expense 17,438 16,240 16,863 12,760 10,720Net earnings 32,587 29,862 30,084 25,321 21,354Net earnings
per share – diluted $ 1.85 $ 1.69 $ 1.70 $ 1.44 $ 1.31
Financial Structure
Total assets $ 474,339 $ 453,082 $ 387,179 $ 289,847 $ 276,646Long-term debt, net 108,172 116,966 74,043 27,218 29,007Shareholders’ equity 249,695 224,620 196,376 165,718 142,304
Weighted average sharesoutstanding – diluted 17,654 17,658 17,718 17,608 16,334
Selected Financial Datain thousands, except per share amounts
S e l e c t e d F i nan c i a l Da ta

ESL 2000 / page 24
Market Price of Esterline Common Stock
for fiscal years 2 0 0 0 1 9 9 9
High Low High Low
Quarter
First $ 14.00 $ 10.25 $ 24.13 $ 18.25Second 13.19 9.25 19.63 12.13Third 16.13 12.06 16.75 12.38Fourth 22.50 14.75 16.63 13.25
Principal Market – New York Stock Exchange
At the end of fiscal 2000, there were approximately 797 holders of record of theCompany’s common stock.
in dollars
Market Pri c e

ESL 2000 / page 25
Consolidated Statement of Operationsin thousands, except per share amounts
for each of the three fiscal yearsin the period ended October 27, 2000 2 0 0 0 1 9 9 9 1 9 9 8
Sales $ 490,966 $ 460,969 $ 453,902Cost of Sales 311,242 286,410 281,539
179,724 174,559 172,363Expenses
Selling, general andadministrative 105,532 106,239 102,361
Research, developmentand engineering 20,839 24,022 20,846
Total Expenses 126,371 130,261 123,207
Operating Earnings 53,353 44,298 49,156
Gain on sale of business (2,591) (7,956) –Interest income (2,205) (2,859) (1,594)Interest expense 8,124 9,011 3,803
Net Other (Income) Expense 3,328 (1,804) 2,209
Earnings Before Income Taxes 50,025 46,102 46,947Income Tax Expense 17,438 16,240 16,863
Net Earnings $ 32,587 $ 29,862 $ 30,084
Net Earnings Per Share – Basic $ 1.88 $ 1.72 $ 1.74
Net Earnings Per Share – Diluted $ 1.85 $ 1.69 $ 1.70
see notes to consolidated financial statements
Operat i ons

ESL 2000 / page 26
as of October 27, 2000 and October 31 , 1999 2 0 0 0 1 9 9 9
As sets
Current As sets
Cash and cash equivalents $ 50,888 $ 55,047Short-term investments – 25,933Accounts receivable, net of allowances
of $2,423 and $2,233 83,336 69,613Inventories 73,984 71,430Deferred income tax benefits 16,053 16,212Prepaid expenses 4,282 4,251
Total Current Assets 228,543 242,486
Property, Plant and Equipment
Land 12,950 13,159Buildings 64,007 62,561Machinery and equipment 123,611 117,555
200,568 193,275Accumulated depreciation 113,158 103,936
87,410 89,339
Other Non-Current Assets
Goodwill, net 137,952 105,383Intangibles, net and other assets 20,434 15,874
Total Assets $ 474,339 $ 453,082
see notes to consolidated financial statements
Consolidated Balance Sheetin thousands, except share and per share amounts
Balanc e She e t

ESL 2000 / page 27
as of October 27, 2000 and October 31 , 1999 2 0 0 0 1 9 9 9
Liabilities and Shareholders’ Equity
Current Liabilities
Accounts payable $ 25,014 $ 16,918Accrued liabilities 67,211 65,974Credit facilities 2,654 5,138Current maturities of long-term debt 6,525 7,249Federal and foreign income taxes 5,518 6,299
Total Current Liabilities 106,922 101,578
Long-Term Liabilities
Long-term debt, net of current maturities 108,172 116,966Deferred income taxes 9,550 9,918
Commitments and contingencies – –
Shareholders’ Equity
Common stock, par value $.20 per share,authorized 60,000,000 shares, issued andoutstanding 17,424,853 and 17,342,374 shares 3,485 3,468
Additional paid in capital 46,952 46,824Retained earnings 211,540 178,953Accumulated other comprehensive loss (12,282) (4,625)
Total Shareholders’ Equity 249,695 224,620
Total Liabilities and Shareholders’ Equity $ 474,339 $ 453,082
see notes to consolidated financial statements
Balanc e She e t

ESL 2000 / page 28
Consolidated Statement of Cash Flowsin thousands
Cash Flows
for each of the three fiscal yearsin the period ended October 27, 2000 2 0 0 0 1 9 9 9 1 9 9 8
Cash Flows Provided (Used)by Operating Activities
Net earnings $ 32,587 $ 29,862 $ 30,084Gain on sale of business (2,591) (7,956) –Depreciation and amortization 21,709 20,796 18,316Deferred income taxes 112 497 (447)Working capital changes,
net of effect of acquisitionsAccounts receivable (12,377) 4,778 (2,344)Inventories (1,394) (2,640) (4,920)Prepaid expenses (472) 98 (222)Accounts payable 6,773 (7,805) 167Accrued liabilities 275 (5,795) (1,557)Federal and foreign income taxes (701) 5,643 (1,542)
Other, net (3,114) 1,684 (2,420)
40,807 39,162 35,115
Cash Flows Provided (Used)by Investing Activities
Purchases of capital assets (15,489) (15,641) (29,773)Capital dispositions 1,618 28,995 9,421Sales (Purchases) of
short-term investments 25,933 (25,933) –Acquisitions of businesses,
net of cash acquired (45,998) (20,860) (113,304)
(33,936) (33,439) (133,656)

ESL 2000 / page 29
for each of the three fiscal yearsin the period ended October 27, 2000 2 0 0 0 1 9 9 9 1 9 9 8
Cash Flows Provided (Used)by Financing Activities
Net change in credit facilities $ (1,922) $ (3,649) $ 6,579Repayment of long-term obligations (8,655) (6,287) (5,079)Proceeds from sale of senior notes – 100,000 –Proceeds (Repayment)
of bridge facility – (50,000) 50,000
(10,577) 40,064 51,500
Effect of foreign exchangerates on cash (453) 363 (107)
Net increase (decrease) incash and cash equivalents (4,159) 46,150 (47,148)
Cash and cash equivalents –beginning of year 55,047 8,897 56,045
Cash and cash equivalents –end of year $ 50,888 $ 55,047 $ 8,897
Supplemental Cash Flow Information
Cash paid during the fiscal year forInterest $ 8,366 $ 6,805 $ 3,244Income taxes 17,521 8,779 17,517
see notes to consolidated financial statements
Cash Flows

ESL 2000 / page 30
Consolidated Statement of Shareholders’Equity and Comprehensive Incomein thousands, except per share amounts
Shareho lder s ’ Equi ty and Comprehens iv e Income
for each of the three fiscal yearsin the period ended October 27, 2000 2 0 0 0 1 9 9 9 1 9 9 8
Common Stock, Par Value $.20 Per Share
Beginning of year $ 3,468 $ 3,463 $ 3,457Shares issued under
stock option plans 17 5 6
End of year 3,485 3,468 3,463
Additional Paid-in Capital
Beginning of year 46,824 46,793 46,831Shares issued under
stock option plans 128 31 (38)
End of year 46,952 46,824 46,793
Retained Earnings
Beginning of year 178,953 149,091 119,007Net earnings 32,587 29,862 30,084
End of year 211,540 178,953 149,091
Accumulated Other Comprehensive Los s
Beginning of year (4,625) (2,971) (3,577)Foreign currency
translation adjustment (7,657) (1,654) 606
End of year (12,282) (4,625) (2,971)
Total Shareholders’ Equity $ 249,695 $ 224,620 $ 196,376
Comprehensive Income
Net earnings $ 32,587 $ 29,862 $ 30,084Foreign currency
translation adjustment (7,657) (1,654) 606
Comprehensive Income $ 24,930 $ 28,208 $ 30,690
see notes to consolidated financial statements

ESL 2000 / page 31
Notes to Consolidated Financial Statements
Accounting Policies
Nature of Operations
Esterline Technologies (the “Company”) designs, manufactures and markets highlyengineered products. The Company principally serves the aerospace and defenseindustry and electronic equipment manufacturers throughout the world, primarilyin the United States and Europe.
Principles of Consolidation and Basis of Presentation
The consolidated financial statements include the accounts of the Company and allsubsidiaries. All significant intercompany accounts and transactions have beeneliminated. Classifications have been changed for certain amounts in prior periodsto conform with the current year’s presentation.
The Company closes its books for reporting purposes on the last Friday ofOctober and has changed its fiscal year in 2000 to coincide with that date.
Management Estimates
To prepare financial statements in conformity with generally accepted accountingprinciples, management is required to make estimates and assumptions that affectthe reported amounts of assets and liabilities, disclosure of contingent assets andliabilities at the date of the financial statements, and the reported amounts ofrevenues and expenses during the reporting period. Actual results could differfrom those estimates.
Foreign Currency Translation
Foreign currency assets and liabilities are translated into their U.S. dollar equiva-lents based on year-end exchange rates. Revenue and expense accounts are generallytranslated at average exchange rates. Aggregate exchange gains and losses arisingfrom the translation of foreign assets and liabilities are included in shareholders’equity as a component of comprehensive loss. Foreign currency transaction gainsand losses are included in income and have not been significant in amount.
Cash Equivalents
Cash equivalents consist of highly liquid investments with maturities of threemonths or less at the date of purchase. Fair value of cash equivalents approximatescarrying value.
1
Note 1

ESL 2000 / page 32
Short-Term Investments
Short-term investments, consisting principally of local government obligations,are classified as available-for-sale. These investments are carried at amortized costwhich approximates the fair market value.
Inventories
Inventories are stated at the lower of cost or market. One subsidiary determinesthe cost of its inventories under the last-in, first-out (LIFO) method while the re-mainder use the first-in, first-out (FIFO) method. Inventory cost includes material,labor and factory overhead.
Property, Plant and Equipment, and Depreciation
Property, plant and equipment is carried at cost and includes expenditures formajor improvements. Depreciation is generally provided on the straight-line methodbased upon estimated useful lives ranging from 3 to 30 years. Depreciation ex-pense was $15,763,000, $16,297,000, and $15,126,000 for fiscal 2000, 1999, and1998, respectively.
Asset Valuation
The carrying amount of long-lived assets, including goodwill attributable to thoseassets, is reviewed periodically for impairment. An asset is considered impairedwhen estimated future cash flows are less than the carrying amount of the asset. Inthe event the carrying amount of such asset is not deemed recoverable, the asset isadjusted to its estimated fair value. Fair value is generally determined based upondiscounted future cash flow.
Goodwill and Intangibles
Intangible assets and the excess purchase price paid over the fair value of net assetsof businesses acquired are amortized on a straight-line basis over the period ofexpected benefit which ranges from 5 to 40 years. Accumulated amortization ofgoodwill and intangibles was $38,173,000 and $33,355,000, respectively, at theend of fiscal years 2000 and 1999.
Environmental
Environmental exposures are provided for at the time they are known to exist orare considered reasonably probable and estimable. No provision has been recordedfor environmental remediation costs which could result from changes in laws orother circumstances currently not contemplated by the Company. Costs providedfor future expenditures on environmental remediation are not discounted to presentvalue.
Note 1 c ont inued

ESL 2000 / page 33
Revenue Recognition
Sales are generally recorded at the time of shipment of products or performance ofservices and are presented net of sales returns and allowances.
Earnings Per Share
Basic earnings per share is computed on the basis of the weighted average numberof common shares outstanding during the year. Diluted earnings per share alsoincludes the dilutive effect of stock options. The weighted average number ofshares outstanding used to compute basic earnings per share were 17,375,000,17,337,000, and 17,290,000 for the fiscal years ending 2000, 1999, and 1998,respectively. The weighted average number of shares outstanding used to com-pute diluted earnings per share were 17,654,000, 17,658,000, and 17,718,000for the fiscal years ending 2000, 1999, and 1998, respectively.
Recent Accounting Pronouncements
In June 1998, the Financial Accounting Standards Board (“FASB”) issued State-ment of Financial Accounting Standards (“FAS”) No. 133, “Accounting for DerivativeInstruments and Hedging Activities.” FAS No. 133 establishes standards forderivative instruments and requires an entity to recognize all derivatives as eitherassets or liabilities and measure those instruments at fair value. In June 1999, theFASB issued FAS No. 137 which deferred the effective date of FAS No. 133. Thisstandard will be effective for the Company beginning in fiscal 2001. The Com-pany utilizes foreign currency forward contracts primarily to reduce its exposureto fluctuations between the U.S. dollar and the French Franc. At the end of fiscal2000, the Company held foreign currency forward contracts totaling a notionalamount of $8.5 million. If FAS No. 133 was in effect at the end of fiscal 2000, thiswould have resulted in a gain of approximately $600,000. The Company antici-pates that future similar foreign currency transactions will qualify for hedgeaccounting treatment under FAS No. 133.
In December 1999, the Securities and Exchange Commission (“SEC”) issuedStaff Accounting Bulletin (“SAB”) No. 101, “Revenue Recognition in FinancialStatements.” In SAB No. 101, the SEC staff expressed its views regarding theappropriate recognition of revenue with regard to a variety of circumstances. TheCompany will be required to adopt SAB No. 101 for the fourth quarter of fiscal2001. The Company is currently evaluating SAB No. 101, however, the Companybelieves that it will not have a material impact on the consolidated financialstatements.
In March 2000, the FASB issued Interpretation No. 44, “Accounting for Cer-tain Transactions Involving Stock Compensation,” an interpretation of AccountingPrinciples Board (“APB”) Opinion No. 25, “Stock Issued to Employees.” The In-terpretation was adopted by the Company effective July 1, 2000 and did not havea material impact on the consolidated financial statements.
Note 1 c ont inued

ESL 2000 / page 34
Inventories
Inventories at the end of the fiscal year consisted of the following:
in thousands 2 0 0 0 1 9 9 9
Raw materials and purchased parts $ 31,693 $ 30,014Work in process 27,264 27,803Finished goods 15,027 13,613
$ 73,984 $ 71,430
Inventories stated under the last-in, first-out method totaled $6,666,000 and $6,118,000at the end of fiscal 2000 and 1999, respectively. Had the first-in, first-out methodbeen used, these inventories would have been $421,000 and $524,000 higher thanreported at the end of fiscal 2000 and 1999, respectively.
Accrued Liabilities
Accrued liabilities at the end of the fiscal year consisted of the following:
in thousands 2 0 0 0 1 9 9 9
Payroll and other compensation $ 24,614 $ 21,135Casualty and medical 6,988 5,642Interest 3,204 3,446Warranties 7,946 7,440State and other tax accruals 9,785 9,396Other 14,674 18,915
$ 67,211 $ 65,974
2
3
Note 2, Not e 3
ESL 2000 / page 35
Retirement Benefits
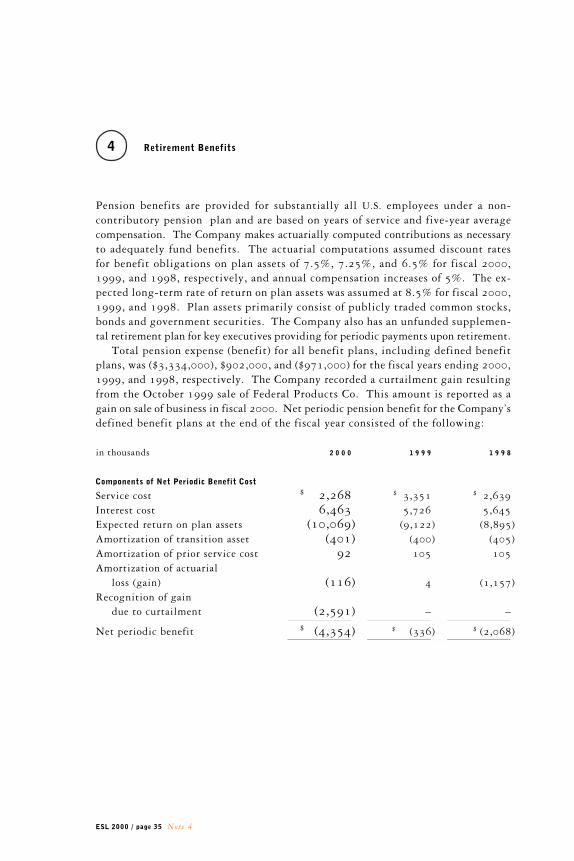
Pension benefits are provided for substantially all U.S. employees under a non-contributory pension plan and are based on years of service and five-year averagecompensation. The Company makes actuarially computed contributions as necessaryto adequately fund benefits. The actuarial computations assumed discount ratesfor benefit obligations on plan assets of 7.5%, 7.25%, and 6.5% for fiscal 2000,1999, and 1998, respectively, and annual compensation increases of 5%. The ex-pected long-term rate of return on plan assets was assumed at 8.5% for fiscal 2000,1999, and 1998. Plan assets primarily consist of publicly traded common stocks,bonds and government securities. The Company also has an unfunded supplemen-tal retirement plan for key executives providing for periodic payments upon retirement.
Total pension expense (benefit) for all benefit plans, including defined benefitplans, was ($3,334,000), $902,000, and ($971,000) for the fiscal years ending 2000,1999, and 1998, respectively. The Company recorded a curtailment gain resultingfrom the October 1999 sale of Federal Products Co. This amount is reported as again on sale of business in fiscal 2000. Net periodic pension benefit for the Company’sdefined benefit plans at the end of the fiscal year consisted of the following:
in thousands 2 0 0 0 1 9 9 9 1 9 9 8
Components of Net Periodic Benefit Cost
Service cost $ 2,268 $ 3,351 $ 2,639Interest cost 6,463 5,726 5,645Expected return on plan assets (10,069) (9,122) (8,895)Amortization of transition asset (401) (400) (405)Amortization of prior service cost 92 105 105Amortization of actuarial
loss (gain) (116) 4 (1,157)Recognition of gain
due to curtailment (2,591) – –
Net periodic benefit $ (4,354) $ (336) $ (2,068)
4
Note 4

ESL 2000 / page 36
The funded status of the defined benefit pension plan at the end of each fiscal yearwas as follows:
in thousands 2 0 0 0 1 9 9 9
Benefit Obligation
Beginning balance $ 84,161 $ 92,509Service cost 2,268 3,351Interest cost 6,463 5,726Curtailment gain (2,692) –Actuarial loss (gain) 7,713 (8,717)Benefits paid (5,552) (8,708)
Ending balance $ 92,361 $ 84,161
Plan As sets – Fair Value
Beginning balance $ 121,012 $ 109,663Actual return on plan assets 10,704 16,299Company contributions 981 3,758Benefits paid (5,552) (8,708)
Ending balance $ 127,145 $ 121,012
Reconciliation of Funded Status to Net Amount Recognized
Funded status – plan assets in excessof benefit obligation $ 34,784 $ 36,851
Unrecognized net actuarial gain (16,635) (23,830)Unrecognized prior service costs 680 874Unrecognized net transition obligations (assets) 239 (162)
Net amount recognized $ 19,068 $ 13,733
Amount Recognized in the Consolidated Balance Sheet
Prepaid benefit cost $ 19,231 $ 14,279Accrued benefit liability (163) (546)
Net amount recognized $ 19,068 $ 13,733
Note 4 c ont inued

ESL 2000 / page 37
5 Income Taxes
Income tax expense for each of the fiscal years consisted of:
in thousands 2 0 0 0 1 9 9 9 1 9 9 8
Current
U.S. Federal $ 14,011 $ 13,530 $ 14,799State 650 160 1,295Foreign 2,665 2,053 1,216
17,326 15,743 17,310
Deferred
U.S. Federal (564) 684 (429)State (48) 20 (18)Foreign 724 (207) –
112 497 (447)
Income tax expense $ 17,438 $ 16,240 $ 16,863
U.S. and foreign components of earnings before income taxes for each of the fiscalyears were:
in thousands 2 0 0 0 1 9 9 9 1 9 9 8
U.S. $ 42,794 $ 42,518 $ 45,608Foreign 7,231 3,584 1,339
Earnings before income taxes $ 50,025 $ 46,102 $ 46,947
Note 5

ESL 2000 / page 38
Primary components of the Company’s deferred tax assets (liabilities) at the end ofthe fiscal year resulted from temporary tax differences associated with the following:
in thousands 2 0 0 0 1 9 9 9
Reserves and liabilities $ 17,054 $ 17,339Employee benefits 5,494 4,425
Total deferred tax assets 22,548 21,764
Depreciation and amortization (8,378) (9,720)Retirement benefits (6,960) (5,013)Other (706) (737)
Total deferred tax liabilities (16,044) (15,470)
$ 6,504 $ 6,294
No valuation allowance was considered necessary on deferred tax assets.
A reconciliation of the U.S. federal statutory income tax rate to the effective incometax rate for each of the fiscal years was as follows:
2 0 0 0 1 9 9 9 1 9 9 8
U.S. statutory income tax rate 35.0% 35.0% 35.0%State income taxes 0.8 0.2 1.8Foreign taxes 1.2 1.2 1.3Foreign sales corporation (1.0) (1.1) (1.5)Tax exempt interest (0.6) (0.8) (0.3)Non-deductible goodwill 2.5 1.7 0.9Research & development credits (3.9) – –Other, net 0.9 (1.0) (1.3)
Effective income tax rate 34.9% 35.2% 35.9%
No provision for federal income taxes has been made on accumulated earnings offoreign subsidiaries, since such earnings were considered permanently reinvestedor would be substantially offset by foreign tax credits, if repatriated.
Note 5 c ont inued

ESL 2000 / page 39
6 Debt
Long-term debt at the end of the fiscal year consisted of the following:
in thousands 2 0 0 0 1 9 9 9
6.77% Senior Notes, due 2008 $ 40,000 $ 40,0006.40% Senior Notes, due 2005 30,000 30,0006.00% Senior Notes, due 2003 30,000 30,0008.75% Senior Notes, due 2002 11,428 17,143Other 3,269 7,072
114,697 124,215
Less current maturities 6,525 7,249
$ 108,172 $ 116,966
The 1999 Senior Notes are payable in full in 2003, 2005 and 2008 and requiresemi-annual interest payments in November and May of each year. The 8.75%Senior Notes are due in 2002, are payable in equal annual installments and interestis payable semi-annually in January and July. All Senior Notes are unsecured.
Maturities of long-term debt at the end of the fiscal year were as follows:
in thousands
2001 $ 6,5252002 6,2362003 30,3022004 2852005 30,2742006 and thereafter 41,075
$ 114,697
Note 6
ESL 2000 / page 40
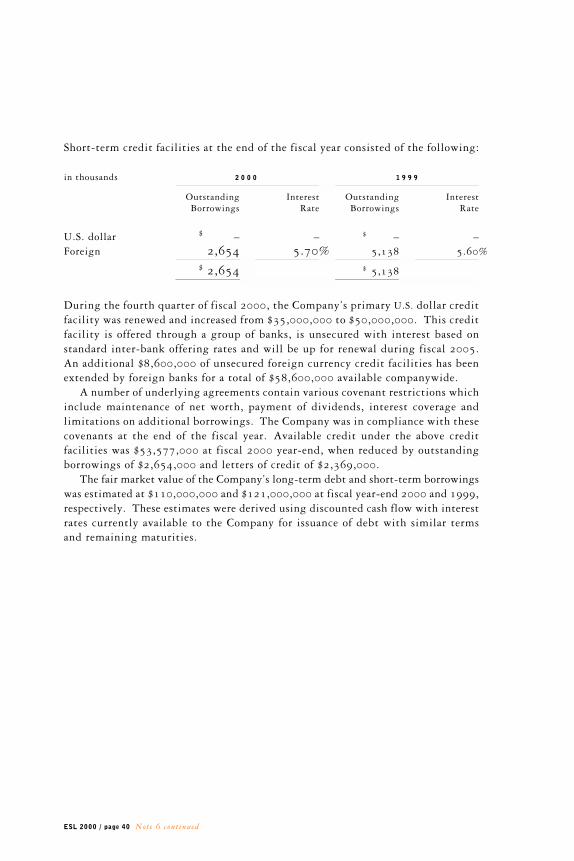
Short-term credit facilities at the end of the fiscal year consisted of the following:
in thousands 2 0 0 0 1 9 9 9
Outstanding Interest Outstanding InterestBorrowings Rate Borrowings Rate
U.S. dollar $ – – $ – –Foreign 2,654 5.70% 5,138 5.60%
$ 2,654 $ 5,138
During the fourth quarter of fiscal 2000, the Company’s primary U.S. dollar creditfacility was renewed and increased from $35,000,000 to $50,000,000. This creditfacility is offered through a group of banks, is unsecured with interest based onstandard inter-bank offering rates and will be up for renewal during fiscal 2005.An additional $8,600,000 of unsecured foreign currency credit facilities has beenextended by foreign banks for a total of $58,600,000 available companywide.
A number of underlying agreements contain various covenant restrictions whichinclude maintenance of net worth, payment of dividends, interest coverage andlimitations on additional borrowings. The Company was in compliance with thesecovenants at the end of the fiscal year. Available credit under the above creditfacilities was $53,577,000 at fiscal 2000 year-end, when reduced by outstandingborrowings of $2,654,000 and letters of credit of $2,369,000.
The fair market value of the Company’s long-term debt and short-term borrowingswas estimated at $110,000,000 and $121,000,000 at fiscal year-end 2000 and 1999,respectively. These estimates were derived using discounted cash flow with interestrates currently available to the Company for issuance of debt with similar termsand remaining maturities.
Note 6 c ont inued

ESL 2000 / page 41
7 Commitments and Contingencies
Rental expense for operating leases totaled $5,871,000, $4,647,000, and $4,628,000in fiscal 2000, 1999, and 1998, respectively.
At the end of the fiscal year, the Company’s rental commitments for noncancel-able operating leases with a duration in excess of one year were as follows:
in thousands
2001 $ 5,6962002 5,4142003 5,3372004 4,5352005 3,8732006 and thereafter 14,486
$ 39,341
The Company is a party to various lawsuits and claims, both as plaintiff and defen-dant, and has contingent liabilities arising from the conduct of business, none ofwhich, in the opinion of management, is expected to have a material effect on theCompany’s financial position or results of operations. The Company believes thatit has made appropriate and adequate provisions for contingent liabilities.
Note 7
ESL 2000 / page 42
8 Stock Option Plans
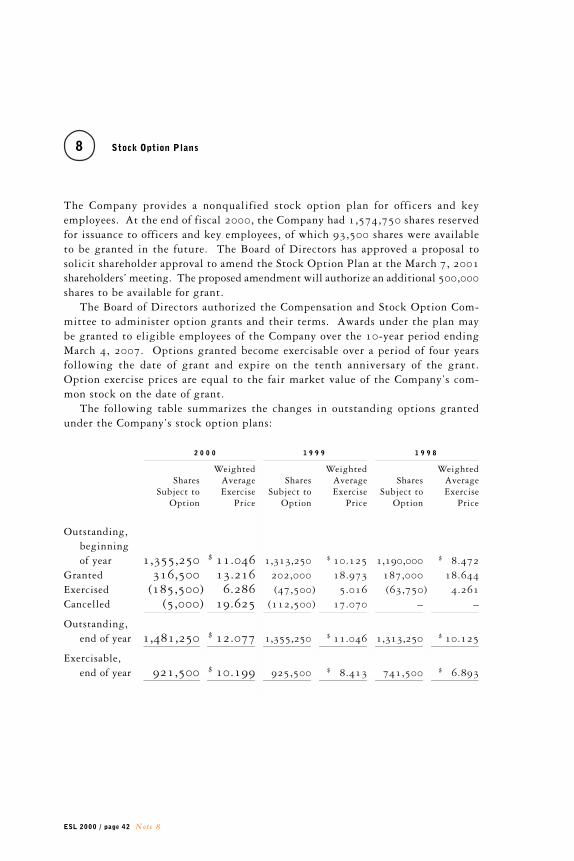
The Company provides a nonqualified stock option plan for officers and keyemployees. At the end of fiscal 2000, the Company had 1,574,750 shares reservedfor issuance to officers and key employees, of which 93,500 shares were availableto be granted in the future. The Board of Directors has approved a proposal tosolicit shareholder approval to amend the Stock Option Plan at the March 7, 2001shareholders’ meeting. The proposed amendment will authorize an additional 500,000shares to be available for grant.
The Board of Directors authorized the Compensation and Stock Option Com-mittee to administer option grants and their terms. Awards under the plan maybe granted to eligible employees of the Company over the 10-year period endingMarch 4, 2007. Options granted become exercisable over a period of four yearsfollowing the date of grant and expire on the tenth anniversary of the grant.Option exercise prices are equal to the fair market value of the Company’s com-mon stock on the date of grant.
The following table summarizes the changes in outstanding options grantedunder the Company’s stock option plans:
2 0 0 0 1 9 9 9 1 9 9 8
Weighted Weighted WeightedShares Average Shares Average Shares Average
Subject to Exercise Subject to Exercise Subject to Exercise Option Price Option Price Option Price
Outstanding,beginningof year 1,355,250 $ 11.046 1,313,250 $ 10.125 1,190,000 $ 8.472
Granted 316,500 13.216 202,000 18.973 187,000 18.644Exercised (185,500) 6.286 (47,500) 5.016 (63,750) 4.261Cancelled (5,000) 19.625 (112,500) 17.070 – –
Outstanding,end of year 1,481,250 $ 12.077 1,355,250 $ 11.046 1,313,250 $ 10.125
Exercisable,end of year 921,500 $ 10.199 925,500 $ 8.413 741,500 $ 6.893
Note 8

ESL 2000 / page 43
The Company accounts for its stock-based compensation plans in accordance withAccounting Principles Board Opinion No. 25. Additional disclosures as requiredunder FAS No. 123, “Accounting for Stock-Based Compensation,” are included below.The Black-Scholes option-pricing model was used to calculate the estimated com-pensation expense that would have been recognized under these guidelines.
If only options granted after fiscal 1995 were included, as prescribed by FAS
No. 123, pro forma net income would have been $31,573,000, $28,920,000, and$28,971,000 for fiscal 2000, 1999, and 1998, respectively. Basic earnings pershare for fiscal 2000, 1999, and 1998 would have been $1.82, $1.67, and $1.68,respectively. Diluted earnings per share for fiscal 2000, 1999, and 1998 wouldhave been $1.79, $1.64, and $1.64, respectively.
The pro forma disclosures presented below include the fair value compensationexpense for all options that would have been amortized during fiscal 2000, 1999,and 1998:
in thousands, except per share amounts 2 0 0 0 1 9 9 9 1 9 9 8
Net earnings as reported $ 32,587 $ 29,862 $ 30,084Pro forma net earnings 31,573 28,915 28,928
Basic earnings per share as reported $ 1.88 $ 1.72 $ 1.74Pro forma basic earnings per share $ 1.82 $ 1.67 $ 1.67
Diluted earnings per share as reported $ 1.85 $ 1.69 $ 1.70Pro forma diluted earnings per share $ 1.79 $ 1.63 $ 1.63
The weighted average Black-Scholes value of options granted during fiscal 2000,1999, and 1998 was $8.516, $12.109, and $10.870, respectively. The assump-tions used in the Black-Scholes option-pricing model for fiscal 2000, 1999, and1998 were as follows:
2 0 0 0 1 9 9 9 1 9 9 8
Volatility 62.3% 60.5% 55.3%Risk-free interest rate 5.75 – 5.83% 5.99 – 6.23% 4.10 – 4.57%Expected life (years) 5 – 8 5 – 8 5 – 8Dividends – – –
Note 8 c ont inued

ESL 2000 / page 44
The following table summarizes information for stock options outstanding atthe end of the fiscal year:
Options Outstanding Options Exercisable
WeightedAverage Weighted Weighted
Range of Remaining Average AverageExercise Prices Shares Life (years) Price Shares Price
$ 3.6875 – 4.1875 218,000 2.89 $ 4.0453 218,000 $ 4.04534.3750 – 11.1250 293,000 4.37 8.1113 283,000 8.0446
11.3750 – 11.6875 285,750 7.49 11.5021 116,250 11.687513.2500 – 14.7500 330,250 7.51 13.7920 159,000 13.350216.7500 – 20.6875 354,250 7.79 19.1647 145,250 18.9883
9 Capital Stock
The authorized capital stock of the Company consists of 500,000 shares of preferredstock, including 25,000 shares ($100 par value) and 475,000 shares ($1.00 parvalue) issuable in series, and 60,000,000 shares of common stock ($.20 par value).At the end of fiscal 2000, there were no shares of preferred stock outstanding.
The Company has a Shareholder Rights Plan providing for the distribution ofone Preferred Stock Purchase Right (“Right”) for each share of common stock held.Each Right entitles the holder to purchase one one-hundredth of a share of Series ASerial Preferred Stock at an exercise price of $56. The Rights expire December 23, 2002.
The Rights will be exercisable and transferable apart from the common stockonly if a person or group acquires beneficial ownership of 10% or more of theCompany’s common stock or commences a tender offer or exchange offer whichwould result in a person or group beneficially owning 10% or more of the Company’s
Note 8 c ont inued, Not e 9

ESL 2000 / page 45
common stock. The Rights will be redeemable by the Company for $.01 each atany time prior to the tenth day after an announcement that a person or groupbeneficially owns 10% or more of the common stock. Upon the occurrence ofcertain events, the holder of a Right can purchase, for the then current exerciseprice of the Right, shares of common stock of the Company (or under certain cir-cumstances, as determined by the Board of Directors, cash, other securities or property)having a value of twice the Right’s exercise price. Upon the occurrence of certainother events, the holder of each Right would be entitled to purchase, at the exer-cise price of the Right, shares of common stock of a corporation or other entityacquiring the Company or engaging in certain transactions involving the Com-pany, that has a market value of twice the Right’s exercise price.
Acquisitions
In December 1999, the Company purchased Advanced Input Devices Co. (“A.I.D.”).A.I.D. is a strategic purchase for the Company’s growth platform around high-endilluminated displays and custom panels. The total purchase price, including closingand other direct costs of the acquisition, was approximately $43,100,000. Theacquisition resulted in an excess of cost over identifiable tangible assets ofapproximately $37,100,000. This goodwill is being amortized over a 30-year period.
The Company also purchased Surftech Finishes Co., a small metal-finishingoperation, in April 2000. This acquisition resulted in an excess of cost over iden-tifiable tangible assets of approximately $2,100,000.
Both transactions were accounted for under the purchase method of accountingand funded with available cash. The results of operations were included from theeffective date of each acquisition.
10
Note 9 c ont inued, Not e 10

ESL 2000 / page 46
Business Segment Information
The Company’s businesses are organized and managed in three operating segments:Aerospace, Advanced Materials and Automation. Aerospace operations producehigh-precision components for avionics, propulsion and guidance systems. AdvancedMaterials operations formulate specialized materials such as high-temperatureelastomers, molded-fiber compounds and certain finishings and coatings. Bothsegments principally serve aerospace and defense markets. Automation operationsmanufacture products that enhance the fabrication efficiency of manufactured goods.Sales in all segments are worldwide, and include military, defense and commercialcustomers.
Geographic sales information is based on product origin. The Company evalu-ates these segments based on segment profits prior to net interest, other income/expense, corporate expenses and federal/foreign income taxes.
Details of the Company’s operations by business segment for the last threefiscal years were as follows:
in thousands 2 0 0 0 1 9 9 9 1 9 9 8
Sales
Aerospace $ 236,269 $ 183,783 $ 171,028Advanced Materials 129,386 127,920 91,498Automation 125,311 149,266 191,376
$ 490,966 $ 460,969 $ 453,902
Earnings Before Income Taxes
Aerospace $ 32,661 $ 24,822 $ 24,766Advanced Materials 24,819 29,186 24,683Automation 7,894 2,924 10,694
Segment Earnings 65,374 56,932 60,143
Corporate expense (12,021) (12,634) (10,987)Gain on sale of business 2,591 7,956 –Interest income 2,205 2,859 1,594Interest expense (8,124) (9,011) (3,803)
$ 50,025 $ 46,102 $ 46,947
11
Note 11

ESL 2000 / page 47
in thousands 2 0 0 0 1 9 9 9 1 9 9 8
Identifiable Assets
Aerospace $ 192,496 $ 144,836 $ 123,346Advanced Materials 140,028 135,907 142,902Automation 62,611 62,868 87,227Corporate1 79,204 109,471 33,704
$ 474,339 $ 453,082 $ 387,179
Capital Expenditures
Aerospace $ 8,368 $ 6,029 $ 9,103Advanced Materials 3,822 3,866 11,997Automation 2,758 5,518 7,748Corporate 541 228 925
$ 15,489 $ 15,641 $ 29,773
Depreciation and Amortization
Aerospace $ 10,305 $ 6,961 $ 6,065Advanced Materials 6,938 6,814 4,579Automation 3,686 6,270 7,084Corporate 780 751 588
$ 21,709 $ 20,796 $ 18,316
1 Primarily cash, prepaid pension expense (see Note 4) and deferred tax assets (see Note 5).
Note 11 cont inued

ESL 2000 / page 48
The Company’s operations by geographic area for the last three fiscal years were asfollows:
in thousands 2 0 0 0 1 9 9 9 1 9 9 8
Sales
Domest i cUnaffiliated customers – U.S. $ 334,768 $ 323,702 $ 333,678Unaffiliated customers – export 66,205 57,776 58,926Intercompany 5,591 8,670 11,042
406,564 390,148 403,646
FranceUnaffiliated customers 44,368 58,871 47,056Intercompany 6,494 10,694 9,552
50,862 69,565 56,608
All Other Fore ignUnaffiliated customers 45,625 20,620 14,242Intercompany 194 843 1,761
45,819 21,463 16,003
Eliminations (12,279) (20,207) (22,355)
$ 490,966 $ 460,969 $ 453,902
Segment Earnings1
Domestic $ 57,119 $ 52,585 $ 58,579France 6,701 5,233 2,485All other foreign 1,263 (625) (1,025)Eliminations 291 (261) 104
$ 65,374 $ 56,932 $ 60,143
Identifiable As sets2
Domestic $ 328,006 $ 269,860 $ 302,977France 32,165 35,758 39,343All other foreign 34,964 37,993 11,155
$ 395,135 $ 343,611 $ 353,475
1 Before corporate expense, shown on page 46.
2 Excludes corporate, shown on page 47.
Note 11 cont inued

ESL 2000 / page 49
The Company’s principal foreign operations consist of manufacturing facilities lo-cated in France, the United Kingdom and Spain, and include sales and serviceoperations located in Germany, Italy, Hong Kong and France. Intercompany salesare at prices comparable with sales to unaffiliated customers. Sales to any singlecustomer or government entity did not exceed 10% of consolidated sales.
Product lines contributing sales of 10% or more of total sales in any of the lastthree fiscal years were as follows:
2 0 0 0 1 9 9 9 1 9 9 8
Elastomeric products 13% 14% 5%Printed circuit board drilling equipment 16% 12% 16%Aerospace switches and indicators 9% 10% 13%Gauge products – 9% 10%
Note 11 cont inued
ESL 2000 / page 50
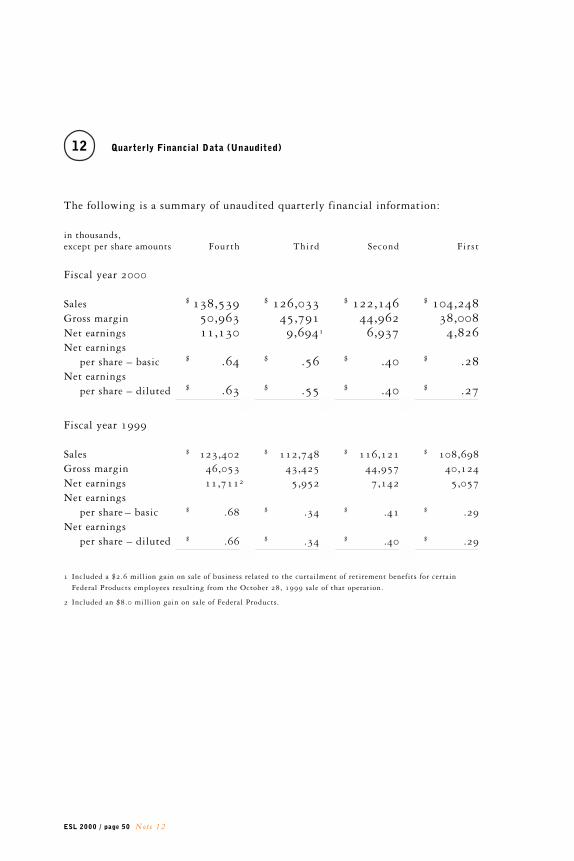
Quarterly Financial Data (Unaudited)
The following is a summary of unaudited quarterly financial information:
in thousands,except per share amounts Fourth Third Second First
Fiscal year 2000
Sales $ 138,539 $ 126,033 $ 122,146 $ 104,248Gross margin 50,963 45,791 44,962 38,008Net earnings 11,130 9,6941 6,937 4,826Net earnings
per share – basic $ .64 $ .56 $ .40 $ .28Net earnings
per share – diluted $ .63 $ .55 $ .40 $ .27
Fiscal year 1999
Sales $ 123,402 $ 112,748 $ 116,121 $ 108,698Gross margin 46,053 43,425 44,957 40,124Net earnings 11,7112 5,952 7,142 5,057Net earnings
per share – basic $ .68 $ .34 $ .41 $ .29Net earnings
per share – diluted $ .66 $ .34 $ .40 $ .29
1 Included a $2.6 million gain on sale of business related to the curtailment of retirement benefits for certain
Federal Products employees resulting from the October 28, 1999 sale of that operation.
2 Included an $8.0 million gain on sale of Federal Products.
12
Note 12

ESL 2000 / page 51
To the Shareholders and the Board of DirectorsEsterline Technologies CorporationBellevue, Washington
We have audited the accompanying consolidated balance sheet of Esterline Tech-nologies Corporation and subsidiaries as of October 27, 2000, and the related consolidatedstatements of operations, shareholders’ equity and comprehensive income, and cashflows for the fiscal year then ended. These financial statements are the responsi-bility of the Company’s management. Our responsibility is to express an opinionon these financial statements based on our audit. The financial statements of theCompany for the two fiscal years ended October 31, 1999, were audited by otherauditors whose report dated December 9, 1999, expressed an unqualified opinionon those statements.
We conducted our audit in accordance with auditing standards generallyaccepted in the United States. Those standards require that we plan and performthe audit to obtain reasonable assurance about whether the financial statementsare free of material misstatement. An audit includes examining, on a test basis,evidence supporting the amounts and disclosures in the financial statements. Anaudit also includes assessing the accounting principles used and significant esti-mates made by management, as well as evaluating the overall financial statementpresentation. We believe that our audit provides a reasonable basis for our opinion.
In our opinion, the fiscal 2000 financial statements referred to above presentfairly, in all material respects, the consolidated financial position of Esterline TechnologiesCorporation and subsidiaries at October 27, 2000 and the consolidated results oftheir operations and their cash flows for the fiscal year then ended in conformitywith accounting principles generally accepted in the United States.
Seattle, WashingtonDecember 6, 2000
Report of Independent Auditors
Repor t o f Independent Auditor s

ESL 2000 / page 52
Esterline Technologies Information
Dire c t or s and Of f i c e r s
Directors
Officers
Robert W. Cremin
Chairman, President andChief Executive OfficerEsterline Technologies
Richard R. Albrecht
Executive Vice President(Retired)Commercial Airplane GroupThe Boeing Company
Ros s J. Centanni
Chairman, President andChief Executive OfficerGardner Denver, Inc.
Robert W. Cremin
Chairman, President andChief Executive Officer
James J. Cich, Jr.
Group Vice President
John F. Clearman
Chief Financial OfficerMilliman & Robertson
Robert S. Cline
Chairman andChief Executive OfficerAirborne Freight Corporation
E. John Finn
Chairman (Retired)Dorr-Oliver Incorporated
Robert F. Goldhammer
ChairmanImClone Systems, Inc.;PresidentConcord InternationalInvestments Group L.L.P.
Robert D. George
Vice President andChief Financial Officer
Marcia J.M. Greenberg
Vice PresidentHuman Resources
Wendell P. Hurlbut
Chairman (Retired)Esterline Technologies
Jerry D. Leitman
President andChief Executive OfficerFuelCell Energy, Inc.
Paul G. Schloemer
President and Chief ExecutiveOfficer (Retired)Parker Hannifin Corporation
Larry A. Kring
Group Vice President
Stephen R. Larson
Vice PresidentStrategy and Technology

ESL 2000 / page 53 Inve s t or Information
Corporate Headquarters
10800 N.E. 8th StreetBellevue, WA 98004(425) [email protected]
Stock Exchange Listing
New York Stock ExchangeSymbol – ESL
www.esterline.com
Investor Information
Transfer Agent and Registrar
ChaseMellonShareholder Services L.L.C.www.chasemellon.com
Shareholder Relations(800) 522-6645
Outside of the U.S.(800) 329-8660
TDD Hearing Impaired(800) 231-5469
TDD Hearing ImpairedOutside of the U.S.(800) 329-8534
Shareholder CorrespondenceP.O. Box 3315South Hackensack, NJ 07606
Overnight Delivery85 Challenger RoadRidgefield Park, NJ 07660
Annual Meeting of Shareholders
The 2001 annual meetingof shareholders will be heldat the Hyatt Regency Hotel,900 Bellevue Way N.E.,Bellevue, Washington, onWednesday, March 7, 2001.The meeting will start at10:00 a.m.
10-K report
A copy of Esterline’s annualreport on Form 10-K filed withthe Securities and ExchangeCommission will be providedwithout charge upon writtenrequest to the corporate head-quarters, attention: Director,Corporate Communications orthrough our website.
Stock Held in Street Name
Esterline maintains a directmailing list to help ensure thatshareholders whose stock isheld in street name (broker orsimilar accounts) receive infor-mation on a timely basis. Ifyou would like your name addedto this list, please send yourrequest to the corporate head-quarters, attention: Director,Corporate Communications.

ESL 2000 / page 54
Esterline Operations and Locations
Operat i ons and Locat i ons
Auxitrol S.A.
office:168 Bureaux de la Colline92213 Saint-Cloud CedexFrance
plant:5, allée Charles Pathé18941 Bourges Cedex 9France
Fluid Regulators Co.313 Gillett StreetPainesville, OH 44077
Muirhead AerospaceOakfield RoadPenge, LondonSE20 8EWEngland
Korry Electronics Co.
901 Dexter Avenue NorthSeattle, WA 98109
Mason Electric Co.605 8th StreetSan Fernando, CA 91340
Memtron Technologies Co.530 North FranklinFrankenmuth, MI 48734
Advanced Input Devices
600 West Wilbur AvenueCoeur d’Alene, ID 83815
Midcon Cables Co.
2500 Davis BoulevardJoplin, MO 64804-3225
Aerospace
Kirkhill Rubber Co.
300 East Cypress StreetBrea, CA 92821
TA Mfg. Co.28065 Franklin Pkwy.Valencia, CA 91355-4117
TA Mfg., Ltd.39/41 St. Catherine StreetGloucester, GL1 2BSUnited Kingdom
Armtec Defense Products Co.
85-901 Avenue 53P.O. Box 848Coachella, CA 92236
Hytek Finishes Co.
8127 South 216th StreetKent, WA 98032
Everett Plant1515 75th Street S.W.Suite 100Everett, WA 98203
Surftech Finishes Co.22436 72nd Avenue S.Kent, WA 98032
Advanced Materials
Excellon Automation Co.
24751 Crenshaw BoulevardTorrance, CA 90505
Amtech9423 South 670 WestSandy, UT 84070
Excellon Europa GmbHJustus-von-Liebig-Strasse 1963128 DietzenbachGermany
W.A. Whitney Co.
650 Race StreetRockford, IL 61105
Equipment Sales Co.
34 School StreetSuite 209Foxboro, MA 02035
Automation
© 2
00
1 E
ster
lin
e T
ech
no l
o gie
s /
Lei
mer
Cro
ss D
esig
n C
o rp
o rat
ion
; S e
attl
e