it ain’t broke: the past, present, and future of venture...
TRANSCRIPT
It Ain’t Broke: The Past, Present, and Future of Venture Capital
by
Steven N. Kaplan* and Josh Lerner**
December 2009 Preliminary
Abstract This paper presents a selective history of the U.S. venture capital (VC) industry, a discussion of the current state of the market, and some predictions about where that market is going. There is no doubt that the U.S. venture capital industry has been very successful. The VC model efficiently solves a difficult problem. A large fraction of IPOs, including the most successful, are VC funded. The U.S. VC model has been copied around the world. We view with come skepticism claims that the VC model is broken. Historically, VC investments in companies represent a remarkably constant 0.15% of the total value of the stock market. Commitments to VC funds, while more variable, are consistently in the 0.10% to 0.20% range. These percentages have not changed in recent years. Returns to VC funds this decade do not appear to have been unusually low (or high) relative to the overall stock market. This is true despite the relatively low number of IPOs. VC investment and returns have been subject to a boom and bust cycle over time. Based on that record, the current historically low level of commitments to U.S. VC funds suggests that returns to the 2009 and (probably) 2010 vintage years will be relatively strong. Finally, a strong rationale for the future role of venture capital lies in the transformation of corporate research and development. *University of Chicago Booth School of Business and NBER. **Harvard Business School and NBER. Address correspondence to Steve Kaplan, University of Chicago Booth School of Business, [email protected] and Josh Lerner, Harvard Business School, [email protected]. Chris Allen and Jacek Rycko provided excellent research support. We thank Harvard Business School’s Division of Research and the Kauffman Foundation for financial support. All errors and omissions are our own.
1
I. Introduction The U.S. venture capital (VC) industry is currently subject to a great deal of uncertainty and controversy. Some observers and practitioners believe that the VC model is broken and that the U.S. VC industry needs to shrink.1 In this paper, we put the U.S. VC industry into its historical context, assess the current state of the VC market, and discuss the implications of that history and the current conditions for the future.
First, we begin by describing the problem that entrepreneurs face and VCs need
to solve in order to invest successfully. There is a great deal of evidence that the U.S. VC model solves the entrepreneurial finance problems efficiently – both in theory and in practice. And there is little doubt that the U.S. venture capital industry has been very successful. A large fraction of IPOs, including the most successful, are VC funded. And, where feasible, the U.S. VC model has been copied around the world.
Next, we look at the historical patterns of commitments to U.S. VC funds and
investments in companies by those funds. VC investments in companies represent a remarkably constant 0.15% of the total value of the stock market. Commitments to VC funds, while more variable, are consistently in the 0.10% to 0.20% range. These percentages have not changed in recent years.
We then consider the historical record on VC fund returns, paying particular
attention to returns of post-2000 vintages. Contrary to the popular impression, we do not find that returns to VC funds this decade have been unusually low (or high) relative to the overall stock market. This is true despite the relatively low number of IPOs. Overall, VC investment and returns have been subject to a boom and bust cycle over time.
Based on our historical analyses, we make some observations about the current
situation and consider what is likely to happen going forward. The level of commitments to and the investment pace of VC funds has been consistent with the historic averages since 2002. At the same time, returns relative to the overall stock market appear to have been roughly average. This does not suggest to us that there is too much money in U.S. VC, nor does it indicate to us that the VC model is broken. It seems to be the natural evolution of a relatively competitive market.
In fact, given the unusual and unexplained paucity of IPOs between 2004 and
2007, we argue there is more upside than downside for the VC vintages of 2001 to 2007. Sarbanes-Oxley is likely less costly and more manageable than it was in 2005 and 2006. There are more boutique investment banks with incentives to market IPOs. And, anecdotally, there is a larger pipeline of IPO candidates.
1 For example, see Kedrosky (2009) and Austin (2009).
2
We note that commitments to U.S. VC partnerships were historically low in 2009. This is likely to continue into 2010 and, possibly beyond. Based on the historical relationship between commitments and performance, the low level of commitments suggests that returns to the 2009 and 2010 vintage years are likely to be strong.
Finally, we consider some of the longer-term drivers of venture capital financing.
Corporate funding of innovation ahs increasingly moved from large, centralized research facilities to various “open innovation” models, including acquisitions and strategic alliances with smaller firms. This increased willingness to reach outside the organization, which reflects the difficulties of managing early-stage innovation within a large corporation, appears likely to create more opportunities for venture investors in the years to come. II. The Problem and Solution An important problem in a market economy, and the one the VC attempts to solve, occurs when an entrepreneur has a good idea, but no money, while investors have money, but no good ideas. The solution suggested by theoretical analysis and implemented by venture capitalists involves (at least) three activities.2
First, VCs spend a large amount of resources and time screening and selecting
deals. VCs systematically consider the attractiveness and risks of the opportunity: market size, strategy, technology, customer adoption, and competition; the management team; and the deal terms. The screening process is an intensive and disciplined one, which often takes place over several months. Kaplan and Strömberg (2004) provide a detailed description and analysis of VC screening.
Second, VCs engage in sophisticated contracting and structuring of their
investments. VC contracts are efficiently designed such that: the entrepreneur does very well if the entrepreneur performs; the VC does not get involved / exert control if the entrepreneur performs; but the VC takes control if the entrepreneur does not perform.
VCs implement this structure by carefully allocating cash flow rights (the equity upside that provides incentives to perform), control rights (the rights VCs have to intervene if the entrepreneur does not perform, liquidation rights (the senior payoff to VCs if the entrepreneur does not perform), and employment terms, particularly vesting (that give the entrepreneur incentives to perform / stay with firm). The various aspects of the contracts are related to the attractiveness and risks of the investment determined from the screening analysis. Kaplan and Strömberg (2003) provide a detailed description and analysis of VC contracts.
Third, VCs improve the outcomes of and add value to their portfolio companies by monitoring and aiding companies after they invest. Part of the added value is involves providing governance and monitoring. This often means replacing the
2 See Kaplan and Strömberg (2001) for a more detailed discussion.
3
entrepreneur when it becomes clear the entrepreneur is not up the task of growing the company. Part of the added value involves assisting the entrepreneur with strategy, hiring other executives, introductions to customers and other partners. Hellmann and Puri (2002), Kaplan and Strömberg (2004), and Lerner (1995) all document different aspects of this VC value-added. Sorensen (2007) seeks to assess the relative importance of deal screening and subsequent value-added and concludes that the two are of roughly equal importance for top VCs. III. Historical Impact It is generally believed that VC investing has been important for the U.S. economy. The real question is the magnitude of that importance. In this section, we provide several measures of that importance and success. It is worth beginning by pointing out how unusual VC funding is. The U.S. SBA (2009) reports that roughly 600,000 new businesses (that employ others) are started each year in the U.S. Venture Source reports that roughly 1,000 businesses receive their first VC funding each year. That means that only 1/6th of 1% of new businesses obtain VC funding. Using detailed Census data, Puri and Zarutskie (2009) obtain similar percentages for the 1996 to 2000 period.
While very few companies receive VC funding, a very large fraction of start-ups
that make it to the public company stage are venture capital-funded. To do this, we used Thomson Banker to identify all IPOs in the U.S. since 1995. We then attempted to eliminate IPOs that were not true start-ups – blank-check companies, corporate spin-outs or spin-offs, financial institutions, REITS, and reverse leveraged buyouts. This leaves us with a better measure of the true start-up population that goes public.
Figure 1 illustrates our results. Since 1999, over 60% of IPOs have been VC-
backed. This is an extraordinary percentage considering that only 1/6th of 1% of all companies are VC-backed. In only two years of these years, have fewer than 50% of IPOs been VC-backed. If anything, our numbers underestimate the percentage of start-ups that are VC-backed. Kaplan, Sensoy and Strömberg (2009) study 2004 IPOs in greater detail and find a somewhat higher percentage are VC-backed than the Thomson database indicates. In other words, it is highly unlikely that a company that does not take venture capital ends up going public.
Consistent with this success, venture capital has fueled many of the most
successful start-ups of the last thirty years. Four of the of twenty companies with the highest market capitalization in the U.S. – Microsoft, Apple, Google, Cisco – have been funded by venture capital. A large number of other highly valuable companies – Gilead, eBay, Amazon, Yahoo, Amgen, Adobe, Celgene, Starbucks, Genzyme, Juniper, Symantec, Stryker, Intuit – were VC-funded.
4
Also consistent with this success, Kaplan, Martel and Strömberg (2007) and Lerner and Schoar (2006) find that U.S. venture capital practices have been exported to rest of the world. There has been a proliferation of efforts by the public sector in many nations in recent years to encourage the formation of local venture clustered, albeit with mixed results.
Overall, then, the U.S. venture capital model appears to have been extremely
successful over the last thirty years. IV. Fundraising and Investment Those who believe that the venture model is broken call attention to the amount of capital in the venture industry and to the recent performance of the venture industry. In this section, we examine the amount of capital in the industry. In the following section, we analyze historical performance.
Figure 2 presents annual limited partner commitments to venture capital funds from 1980 to 2008 (using data from Private Equity Analyst) in nominal (or actual) dollars. The figure documents the huge run up in venture capital through the dot-com era and the subsequent decline. From 2005 to 2008, annual commitments to venture capital ran in the $25 to $33 billion range.
But these depictions do not take account of the fact that the size of the economy
and the stock market has increased markedly since 1980. In figure 3, we address this omission by scaling annual commitments by the total value of the U.S. stock market at the beginning of each year. This scaling, then, presents VC commitments as a fraction of the total market value of equity. Measured this way, VC commitments are much more stable. VC commitments have never gone below 0.05% of the total stock market. Except in the three years of the dotcom boom (1999 to 2001), commitments have not gone above 0.23%. Since 2002, commitments have run just slightly above the historical average (0.146% versus 0.139%).
Figure 4 presents the analogous analysis for venture capital investments in
portfolio companies. The left axis shows VC investments as a fraction of total stock market value at the beginning of each year. The right axis shows the number of VC investments. Similar to figure 3, figure 4 indicates that VC investment has been remarkably stable. On average, U.S. VCs have invested 0.164% of the value of the stock market each year in portfolio companies. Except in the three dotcom boom years, investment has not exceeded 0.203% of the stock market. Since 2002, investments have run slightly below the historical average (0.155% versus 0.164%).
Both figures 3 and 4, then, indicate that the U.S. VC market has been remarkably stable over the last 30 years relative to the overall stock market. And the recent pace of VC commitments and, particularly, investments is not historically high.
5
V. Performance What about the performance of VC funds? Figure 5 presents the average vintage year returns reported by Cambridge Associates (CA) and by Venture Economics (VE) as of December 2008. The two series track each other very closely, with CA being higher in the mid-90s vintages and lower in the most recent vintages. The figure illustrates the large variation in performance across different vintage years.
Figure 6 presents VE vintage year returns by quartile of fund performance. The figure illustrates the large differences in performance between funds in the top and bottom quartiles of the distribution.
The figures and most publicly available data do not, however, provide enough information to answer three important questions. First, how do VC returns really compare with public stock market returns? Second, do the same general partners (GPs) consistently outperform? And, third, how does fundraising affect subsequent performance?
Kaplan and Schoar (2005) attempted to answer these questions using detailed fund performance data from Venture Economics through the end of 2001. Subsequent work by others – Gottschalg and Phallipou (2007) and Hochberg et al. (2009) – is largely consistent with Kaplan and Schoar (2005) for U.S. VC funds. Of course, such measures must focus on funds which have been largely liquidated, which precludes a careful analysis of the post-2001 vintages.
A. VC Performance vs. Public Markets
Kaplan and Schoar (2005) focused on VC performance relative to the public stock market by calculating a public market equivalent (PME). The PME compares an investment in a VC fund to an investment in the S&P 500. They implement the PME calculation by investing (or discounting) all cash outflows of the fund at the total return to the S&P 500 and comparing the resulting value to the value of the cash inflows (net of fees) to the fund invested (discounted) using the total return to the S&P 500. A fund with a PME greater than one outperformed the S&P 500 (net of all fees). We think PME is a sensible measure for LPs as it reflects the return to VC investments relative to public equities.
For example, if a VC invested $10 million in March of 1997 and sold the
investment in March of 2000 for $20 million, the investment had an IRR of 26% gross of fees and earned a multiple of two times. During that period, however, $10 million invested in the S&P 500 would have grown to $20.7 million. As a result, the PME of the investment would have been only 0.97 (20 / 20.7) gross of fees. Net of a carry of $2 million, the PME would have been only 0.87 ( 18 / 20.7).
Kaplan and Schoar restrict their analysis largely to funds raised (or committed)
before 1997. Kaplan and Schoar find that the average VC fund in their sample, net of
6
fees and carry, has a PME of 0.96. This means that the average fund slightly underperformed the public stock market after the VCs’ share. Gross of fees, the average PME is estimated to be on the order of 1.25 or above, far exceeding 1.
When Kaplan and Schoar weight their sample by capital, they find an average
PME of 1.22 net of fees, indicating that the VC industry as a whole outperformed the public markets net of fees (as well as gross of fees).
The reason for the difference between average and capital-weighted average
has to do with timing. As figure 7 indicates, PMEs are higher for 1990s vintage years than for 1980s vintage years. More money was committed to VC in the 1990s, so the capital-weighted average weights the 1990s more than the 1980s while the equal-weighted average weights the 1990s and 1980s equally.
We believe there are several takeaways here. First, VC returns net of fees have
been quite competitive with public markets. Second, VC outperforms public markets gross of fees, but GPs capture a lot of the outperformance (on average). Third, there is a great deal of variation over time in whether VC returns outperform or underperform the public markets.
There are two caveats to these results, one positive and one negative. On the
negative side, the results do not include the dot-com bust. On the positive side, Cambridge Associates has a larger sample and higher returns, indicating that Kaplan and Schoar may understate VC performance.
What about more recent vintages? There are two problems in estimating the
performance of the more recent vintages. The first is a practical one: the cash flows to the individual funds are not readily available. Thus, we cannot undertake PME analyses, only a cruder assessment of overall performance. Second, because the investments remain largely in the portfolios of the venture groups, we do not know how much the more recent funds are really worth. Given the difficulty of valuing venture firms and the varying practices regarding marking-to-market portfolios, we cannot be sure of the underlying values. As a result, the analysis the follows is somewhat speculative.
That said, we compare the performance of recent vintages to that of the stock
market. We compare the average vintage year IRR (using Venture Economics returns) to the five-year IRR of the total stock market and to the five-year IRR of NASDAQ. (For the 2005 vintage, we use the four-year IRRs because five-years are not available.) Because of timing differences, this provides an imperfect measure of the net-of-market performance of these vintages. We arbitrarily stop at 2005 because more recent vintages likely have not had enough time to establish even an inexact estimate of their performance.
Figure 8 graphs the excess returns by vintage year. For the six vintages from
2000 to 2005, performance has been roughly equal to the total stock market. Two
7
vintages have IRRs below the total market return; two have IRRs roughly the same; and two have IRRs above. When compared to NASDAQ, four of the six vintages exceed NASDAQ. These results suggest that VC funds have held their own relative to public stock markets over this decade.
Figure 9 plots the PMEs from Kaplan and Schoar (2005) against the excess
returns we calculated relative to the total market. This graph indicates that the excess returns calculated this way correlated with PMEs. In particular, when excess returns are positive, PMEs tend to be greater than 1.
We confirmed this by estimating a regression of the PMEs against the excess
return measure. We obtained the following result:
PME = 1.1 + 0.05 x Excess Return % [0.01] where 0.01 is the standard error of the estimated relationship. This regression indicates a highly significant relationship. Given that recent vintages have returns comparable to the overall stock market, this regression suggests that the recent vintages will perform about as well as public markets when all is said and done.
As we noted earlier, this analysis assumes that the 2000 to 2005 vintages are correctly marked-to-market. To the extent that bad investments have not yet been written down, the funds are overvalued and the ultimate results will be worse than the public markets. To the extent that good investments have not yet been written up, the funds are undervalued and the ultimate results will be better than the public markets.
We suspect that, on average, those vintages are undervalued because most bad
investments have been written down as they have failed or needed additional financing (at lower valuations). On the other hand, many companies that are performing well, particularly in IT, have not been written up.
B. Persistence
The second question that Kaplan and Schoar address is persistence. It is widely believed that the best GPs in venture capital consistently outperform other GPs. This observation translates into a desire by LPs to invest in top quartile funds or GPs. Some LPs have taken the persistence a step further and believe that it does not make sense to invest in venture capital at all unless they can invest in top quartile or, even, top decile funds.
Consistent with wide differences in performance, Kaplan and Schoar find large
differences between the bottom and top quartiles. Funds in the top quartile have PMEs of 1.11 and above while those in the bottom quartile have PMEs of 0.67 and below. They also find strong evidence of persistence. Subsequent fund performance is significantly related to previous fund performance for the same GPs. They also find a
8
strongly significant relationship between the performance of funds that are two apart (e.g., funds III and V) and even three apart. This is important because those funds are less likely to have investments in common. Subsequent papers that revisit this question with updated data sets find similar results.
The academic findings of persistence for venture capital, therefore, are
substantially different from findings for other asset classes. Similar studies of mutual funds find no evidence of persistence among top performers. Studies of hedge funds have mixed results, but generally find limited evidence of persistence.
There are three other important comments to make about persistence.
Persistence is not concentrated in the top decile. Kaplan and Schoar divided funds into performance terciles. Funds in the top tercile typically had PME’s above 1, indicating outperformance of the public stock market net of fees. As with the overall persistence result, funds in the top tercile were significantly more likely to have successor funds in the top tercile than funds in the middle or bottom tercile.
That said, while persistence is statistically present, it is far from guaranteed. If
subsequent performance were random, roughly 33% of top tercile funds should repeat in the top tercile. If subsequent performance were perfectly persistent, 100% of top tercile funds would repeat in the top tercile. Kaplan and Schoar find the true persistence is 50%. This is strongly statistically significant, but far from 100%.
Finally, it is important to point out that fund size is the enemy of persistence.
GPs who have funds with good returns tend to get bigger. GPs of funds with poor returns either get smaller or are unable to raise additional funds.
Keeping the GP constant, Kaplan and Schoar find that greater fund size is
associated with worse performance. A 50% increase in fund size is associated with roughly a 0.07 decline in PME, or a 1.5% to 2% decline in fund IRR.
Across all GPs, there is a tradeoff. Lerner et al. (2011) study the relation of fund
IRRs to fund size. As shown in figure 10, they find that better GPs get larger which increases returns for a while. At some point, roughly a $200 million fund size, the negative effect of size kicks in and performance stops increasing with size. At fund sizes greater than $500 million, performance begins to decline.
Overall, then, we think the persistence results have two implications. First, it is
not the case that only top decile funds persist. Persistence is present even among the top tercile. Second, even though persistence exists, it is by no means a guarantee. Top quartile and top decile GPs do have bad funds, particularly if they raise too much capital.
C. Fund Raising and Future Performance
9
The last question of interest is the relation of fundraising and performance. It turns out that not only is individual GP fundraising related to performance, but so is overall industry fundraising. When performance is strong, LPs commit more capital to venture capital.
In turn, fundraising has an effect on future venture capital performance, but not in
a good way. When more capital is committed to or invested in venture capital, vintage year returns suffer. As a result, venture capital has a self-correcting mechanism: a period of poor returns leads to decreased inflows, which in turn leads to a recovery in returns. Thus, there has historically been a strong element of “mean reversion” in venture returns.
To explore these issues, we again estimate regressions. This time, we attempt
to predict vintage year returns using capital committed to venture capital. To better capture the amount of capital available, we use capital committed in the same vintage year and the previous vintage year. To make different time periods comparable, we measure capital committed as a fraction of the total stock market value. We report regressions that use Venture Economics and Cambridge Associates average vintage year returns: Venture Economics: IRR = 18% - 28.1 x Capital Committed last 2 years as % of mkt. [12.1] Cambridge Associates: IRR = 24% - 41.1 x Capital Committed last 2 years as % of mkt. [15.7] These results are strongly statistically significant. Figure 11 shows these relationships graphically.
We repeated the analysis using capital invested in venture capital companies
instead of capital committed. The results are similar.
Venture Economics: IRR = 18% - 24.4 x Capital Invested last 2 years as % of mkt. [9.5] Cambridge Associates: IRR = 26% - 36.4 x Capital Invested last 2 years as % of mkt. [12.7]
Thus, if as appears to be the case, we are in a period of disillusionment with the venture capital industry, and numerous investors thinking of terminating their commitments to this asset class, this is actually good news for venture investors. The reduced inflows are likely to translate into higher venture returns, based on the historical evidence.
10
VI. Going Forward The previous sections describe the past and present of venture capital. The more pressing question is what will happen going forward. In particular, is the traditional venture capital model broken? A. What are the Implications of the IPO Drought? One of the reasons that some believe the VC model is broken is the concern that it is more difficult take a company public than in the past. And, as figure 12 illustrates, that concern is not unfounded. Figure 12 graphs the number of venture backed IPOs in the U.S. since 1985. In all but one year of the 1990s, there were over 100 VC-backed IPOs. In five of the ten years, there were more than 150. Then, in the recession / bear market of 2001 to 2003, the number of VC-backed IPOs dropped below 50 each year. This was not so unusual for a down market. The same pattern had occurred in the recession / bear market from 1989 to 1991.
What was unusual and unexpected was the small number of VC-backed IPOs
from 2004 to 2007, averaging only slightly more than 50 per year, despite the robust stock market over that period and despite the large number of companies that had received VC funding over the previous five to ten years.
It is not yet clear why there were so few IPOs. Some blame the increased costs
imposed on companies by the Sarbanes-Oxley legislation. Some blame increased litigation risk and the concomitant increase in directors’ and officers’ and other insurance. Some blame inattention from investment banks that were able to make more money from other activities. And some blame the scarcity on the fact that too many similar companies were funded in the dotcom boom, competing so fiercely that consumers received most of the benefits. See Weild and Kim (2009) for a discussion of some of these and other potential explanations.
An IPO is not the only way for a VC to exit an investment. VCs also exit by
selling their portfolio companies. Figure 13 shows, however, that an increase in M&A exits did not offset the decline in IPOs. B. Is the VC Model Broken?
What does all this mean for the U.S. venture capital model? Is it broken? Does
it need to be appreciably smaller? Does it need to be appreciably different? We are skeptical of claims that the VC model is broken or needs to be radically
changed. As our historical analyses indicated, the level of commitments to and the investment pace of the U.S. VC industry since 2002 has been consistent with the historic averages. At the same time, returns to VC funds appear to have been roughly equal to those of the overall stock market. This does not suggest to us that there is too
11
much money in U.S. VC, nor does it indicate to us that the VC model is broken. It seems to be the natural evolution of a relatively competitive market.
In fact, given the unusual and unexplained paucity of IPOs (and overall exits)
between 2004 and 2007, we suspect there is more upside than downside for the VC vintages of 2001 to 2007. Anecdotally, Sarbanes-Oxley is likely less costly and more manageable than it was in 2005 and 2006. There are more boutique investment banks with incentives to market IPOs. And, anecdotally, there is a larger pipeline of IPO candidates. C. What will happen in the next several years?
As we write this, commitments to U.S. VC partnerships appear to be historically
low in 2009. Through November 2009, the Private Equity Analyst reports commitments of $9.8 B, which implies an annual rate of $10.7 B. This rate is historically low, less than 0.10% of the initial value of the stock market and about 0.08% of the year-end value of the stock market. All indications are that commitments are likely to continue to be low into 2010 and, possibly beyond. Based on the historical relationship between commitments and performance, the low level of commitments suggests that returns to the 2009 and 2010 vintage years are likely to be relatively strong.
Moreover, there are more qualitative reasons for optimism as well. The most
compelling of these is the transformation of the corporate research and development system. The central corporate R&D laboratory was a dominant feature of the innovation landscape in the U.S. for most of the 20th century. While the concept of the centralized laboratory originated in the German chemical industry, U.S. corporations adopted it with enthusiasm by mid century. These campus-like facilities employed many thousands of researchers, many of whom were free to pursue fundamental science with little direct commercial applicability, most notably Bell Laboratories (with 11 Nobel Laureates) and IBM Central Research (with 5).
Beginning in the early 1990s, however, American corporations began
fundamentally rethinking the role of these centralized research facilities (see, for example, the discussions in Rosenbloom and Spencer (1996) and Chesbrough (2003)). Reflecting both a perception of disappointing commercial returns and intensified competitive pressures, firms undertook a variety of changes to these facilities. These included both paring the size of central research facilities in favor of divisional laboratories and relying much more heavily on what has been termed “open innovation,” i.e., alliances with and acquisitions of smaller firms.
To economists, however, these changes are not surprising. On the one hand,
observers such as Jensen (1993) have contrasted the incentives within corporate research facilities unfavorably with those offered by venture capitalists. He suggests that had higher-powered incentives been offered, some of the poor performance of research-intensive firms would have been avoided. In a similar vein, Kortum and Lerner
12
(2000) find that venture-backed firms are approximately three times as efficient in generating innovations as corporate research.
This transformation suggests that the demand for venture-backed firms is likely
to increase in the medium and longer term. The model of growing companies for full or partial acquisition by larger firms—as has been practiced for many years in the computer networking business, for instance—is likely to be a growing segment of the venture activity in the years to come. And given the fact that corporate research spending, both in the U.S. and globally, is many times the magnitude of venture capital investment, the size of the opportunity is likely to be substantial.
VII. Conclusion
The U.S. VC model has been enormously successful over the last 30 years. Over that time period, the U.S. VC industry has consistently received commitments and invested at a pace of roughly 0.15% of the value of the overall U.S. stock market. Around that consistent pace, commitments, investments, and returns have varied with high returns attracting more capital. Greater capital puts downward pressure on returns. And downward pressure on returns leads to less capital. And less capital tends to lead to increased returns. We see little that makes us believe that the VC model has changed or is broken. As far as we can tell, we are leaving a period with slightly above average capital and slightly below average returns for a period of well below average capital. We would not be surprised to see this followed, perhaps quickly, by a period of above average returns.
13
References
Austin, S., 2009, “Majority of VCs in Survey Call Industry ‘Broken,’” Wall Street Journal Blog, June 29.
Chesbrough, H., 2003, Open Innovation: The New Imperative for Creating and Profiting
from Technology, Boston: Harvard Business School Press. Gottschalg, O., and L. Phalippou, 2009, “The Performance of Private Equity Funds,”
Review of Financial Studies 22, 1747-1776. Hellmann, T. and Puri, M., 2002, “Venture Capital and the Professionalization of Start-
Up Firms: Empirical Evidence” Journal of Finance 57, 169-197. Hochberg, Y., A. Ljungqvist ,and A. Vissing-Jørgensen, 2009, Informational Hold-up and
Performance Persistence in Venture Capital,” Working paper, Northwestern University.
Jensen, M., 1993, “The Modern Industrial Revolution, Exit, and the Failure of Internal Control Systems,” Journal of Finance 48, 831-880.
Kaplan, S., F. Martel, and P. Strömberg, 2007, “How Do Legal Differences and Learning
Affect Financial Contracts?” Journal of Financial Intermediation 16, 273-311. Kaplan, S., and A. Schoar, 2005, “Private Equity Performance: Returns, Persistence
and Capital Flows,” Journal of Finance 60, 1791-1823.
Kaplan, S., B. Sensoy and P. Strömberg, 2009, Should investors bet on the jockey or the horse? Evidence from the evolution of firms from early business plans to public companies, Journal of Finance 64, 75-115.
Kaplan, S. and P. Strömberg, 2001, “Venture Capitalists As Principals: Contracting,
Screening, and Monitoring,” American Economic Review 91, 426-430. Kaplan, S. and P. Strömberg, 2003, Financial Contracting Theory Meets the Real
World: Evidence from Venture Capital Contracts, Review of Economic Studies 70, 281-315.
Kaplan, S. and P. Strömberg, 2004, Characteristics, Contracts, and Actions: Evidence
From Venture Capitalist Analyses, Journal of Finance 59, 2177-2210. Kedrosky, Paul, 2009, “Right-Sizing The U.S. Venture Capital Industry,” Working paper,
Kauffman Foundation. Kortum, S., and J. Lerner, 2000, “Assessing the contribution of Venture Capital to
Innovation,” Rand Journal of Economics 31, 674-92.
14
Lerner, J., 1995, “Venture Capitalists and the Oversight of Private Firms,” Journal of Finance 50, 301-318.
Lerner, J., 2009, The Boulevard of Broken Dreams: Why Public Efforts to Boost
Entrepreneurship and Venture Capital Have Failed—and What to Do About It. Princeton: Princeton University Press.
Lerner, J., A. Leamon, and F. Hardymon, 2011, Private Equity, Venture Capital, and the
Financing of Entrepreneurship: The Power of Active Investing, New York: Wiley. Lerner J., and A. Schoar, 2005, “Does Legal Enforcement Affect Financial
Transactions?: The Contractual Channel in Private Equity,” Quarterly Journal of Economics, 120, 223-246.
Puri, M. and R. Zarutskie, 2009, “On the lifecycle dynamics of venture-capital- and non-
venture-capital-financed firms,” Working paper, Duke University. Sorensen, M., 2007, How Smart is Smart money? An Empirical Two-sided Matching
Model of Venture Capital, Journal of Finance 62, 2725 – 2762. U.S. Small Business Administration, 2009, The Small Business Economy, Washington:
U.S. Government Printing Office. Weild, David and Edward Kim, 2009, “Market structure is causing the IPO crisis,”
Working paper, Grant Thornton.
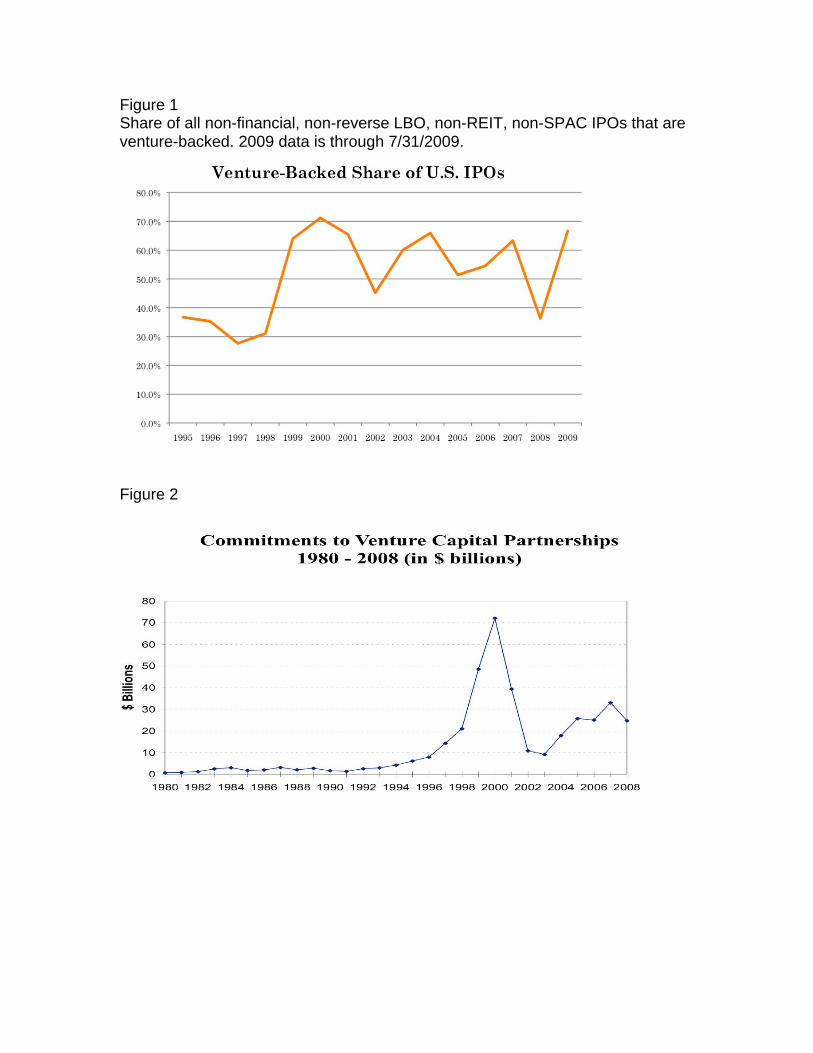
Figure 1 Share of all non-financial, non-reverse LBO, non-REIT, non-SPAC IPOs that are venture-backed. 2009 data is through 7/31/2009.
Figure 2

Figure 3
Figure 4
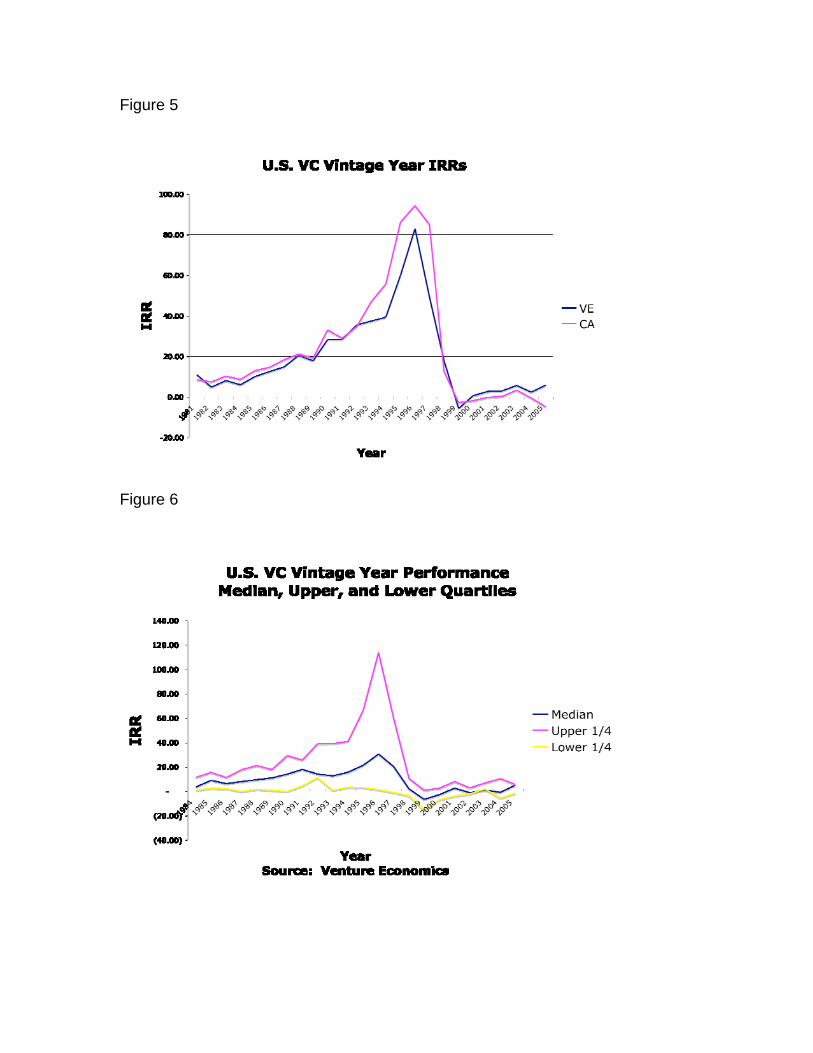
Figure 5
Figure 6
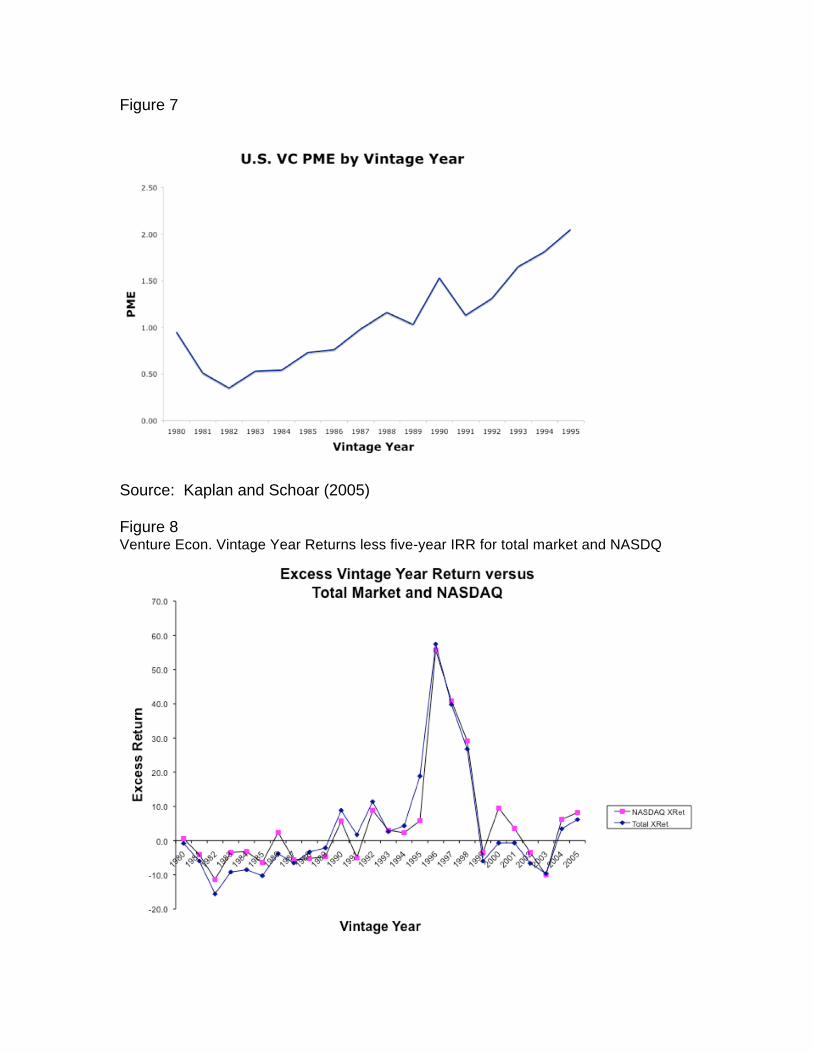
Figure 7
Source: Kaplan and Schoar (2005)
Figure 8 Venture Econ. Vintage Year Returns less five-year IRR for total market and NASDQ
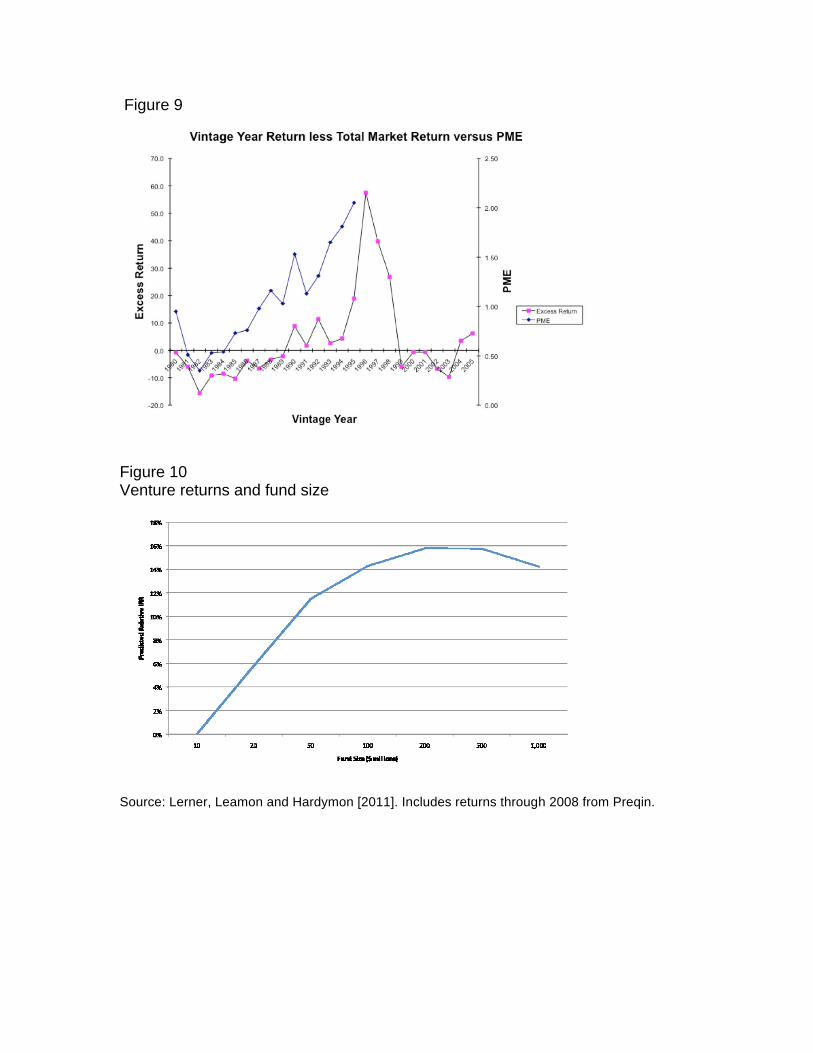
Figure 9
Figure 10 Venture returns and fund size
Source: Lerner, Leamon and Hardymon [2011]. Includes returns through 2008 from Preqin.
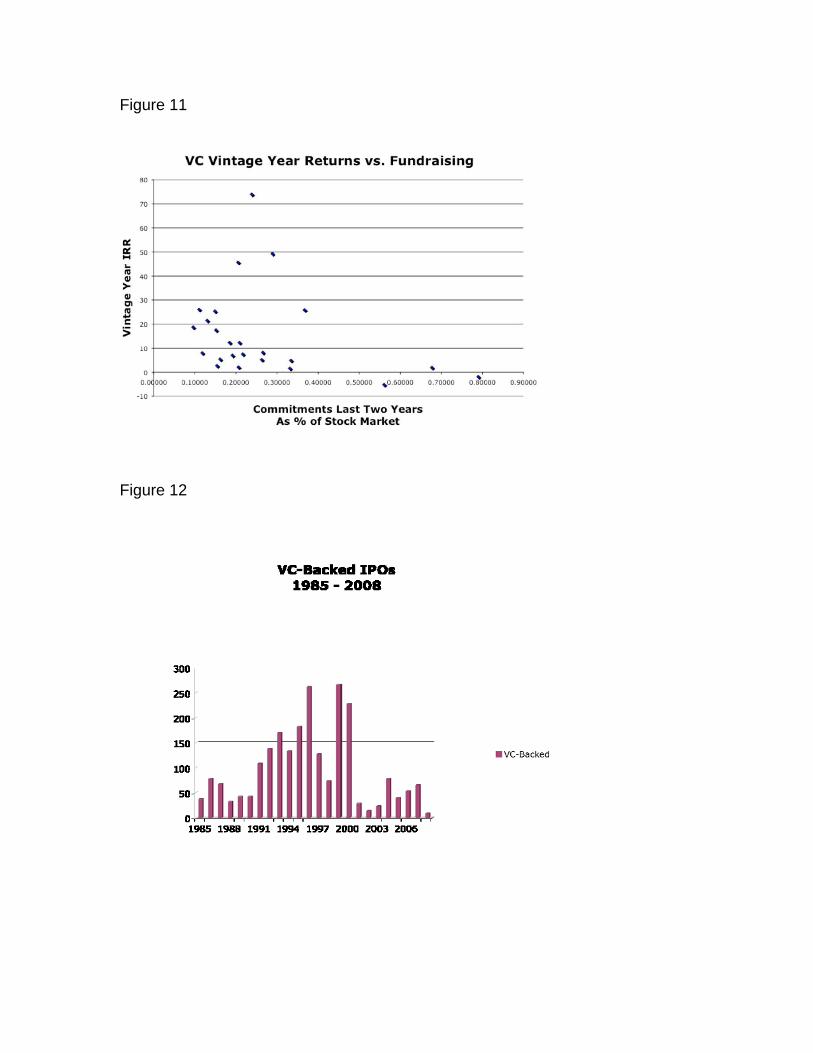
Figure 11
Figure 12
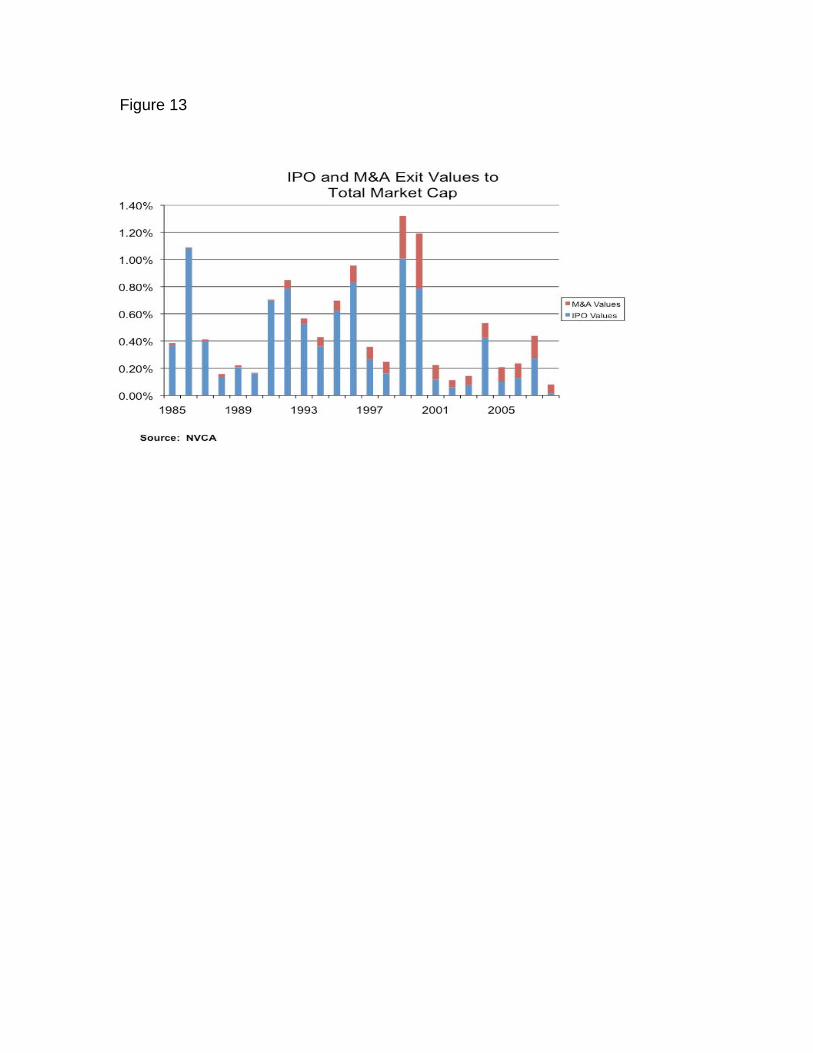
Figure 13