issues regarding the renewable fuel standard
TRANSCRIPT
Congressional Budget Office
Issues Regarding theRenewable Fuel Standard
March 27, 2015
This presentation provides information published in CBO’s The Renewable Fuel Standard: Issues for 2014 and Beyond (June 2014), www.cbo.gov/publication/45477.
Presentation at the Annual Meeting of the Midwest Economics Association
Ron GecanMicroeconomic Studies Division
With Terry Dinan and David Austin
1C O N G R E S S I O N A L B U D G E T O F F I C E
Overview
■ The Energy Security and Independence Act (EISA) sets rising requirements for including renewable fuels in the supply of transportation fuels
■ Full compliance with the Renewable Fuel Standard (RFS) mandates stated in EISA would be challenging
■ Food prices would be similar whether the RFS was continued or repealed
■ Meeting EISA requirements would have significant effects on the prices of transportation fuels
■ Reductions in greenhouse gas (GHG) emissions under EISA would be small in the near term but could be larger over the longer term depending on technology development
2C O N G R E S S I O N A L B U D G E T O F F I C E
RFS Requirements
■ The RFS was enacted in 2005 and expanded in 2007 under EISA
■ Stated goals include reducing dependence on foreign oil and reducing GHG emissions
■ EISA sets minimum volume requirements for amounts of renewable fuels that must be blended into transportation fuels
■ EISA sets minimum requirements for the amounts by which renewable fuels must reduce GHG emissions relative to the fuels they replace
3C O N G R E S S I O N A L B U D G E T O F F I C E
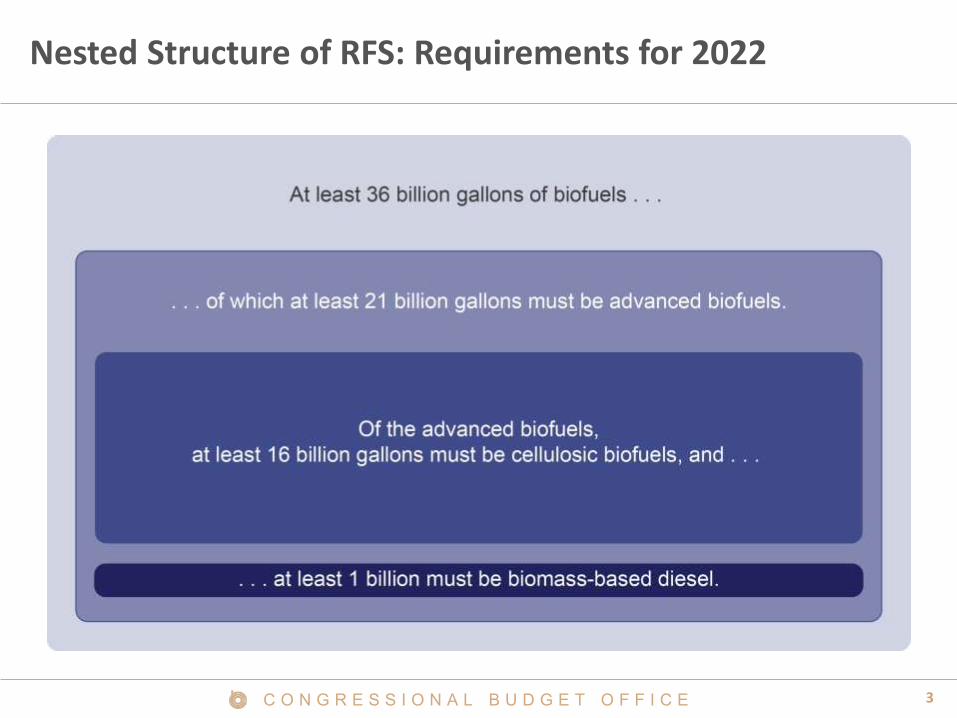
Nested Structure of RFS: Requirements for 2022
4C O N G R E S S I O N A L B U D G E T O F F I C E
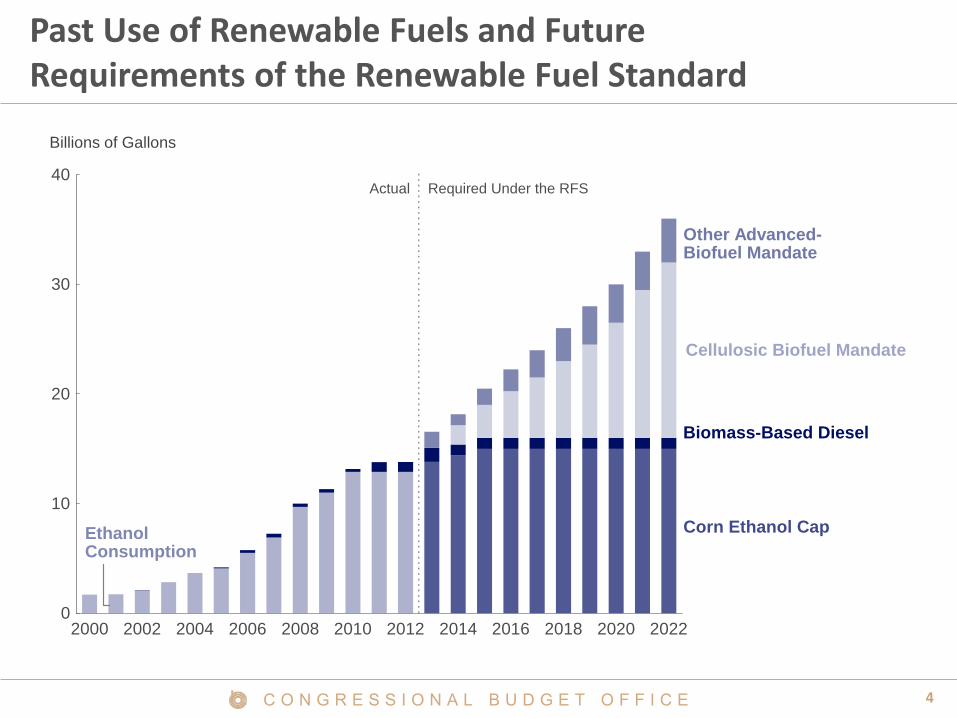
Past Use of Renewable Fuels and Future Requirements of the Renewable Fuel Standard
2000 2002 2004 2006 2008 2010 2012 2014 2016 2018 2020 20220
10
20
30
40
Other Advanced-Biofuel Mandate
EthanolConsumption
Biomass-Based Diesel
Corn Ethanol Cap
Cellulosic Biofuel Mandate
Actual Required Under the RFS
Billions of Gallons
5C O N G R E S S I O N A L B U D G E T O F F I C E
The Supply of Cellulosic Biofuels is Limited
■ EISA requirements for cellulosic biofuels began in 2010
■ First commercial production began in 2013 with two plants
■ More commercial production is expected, but far less than is required
■ Production is complex, entails logistical challenges, and is costly
6C O N G R E S S I O N A L B U D G E T O F F I C E
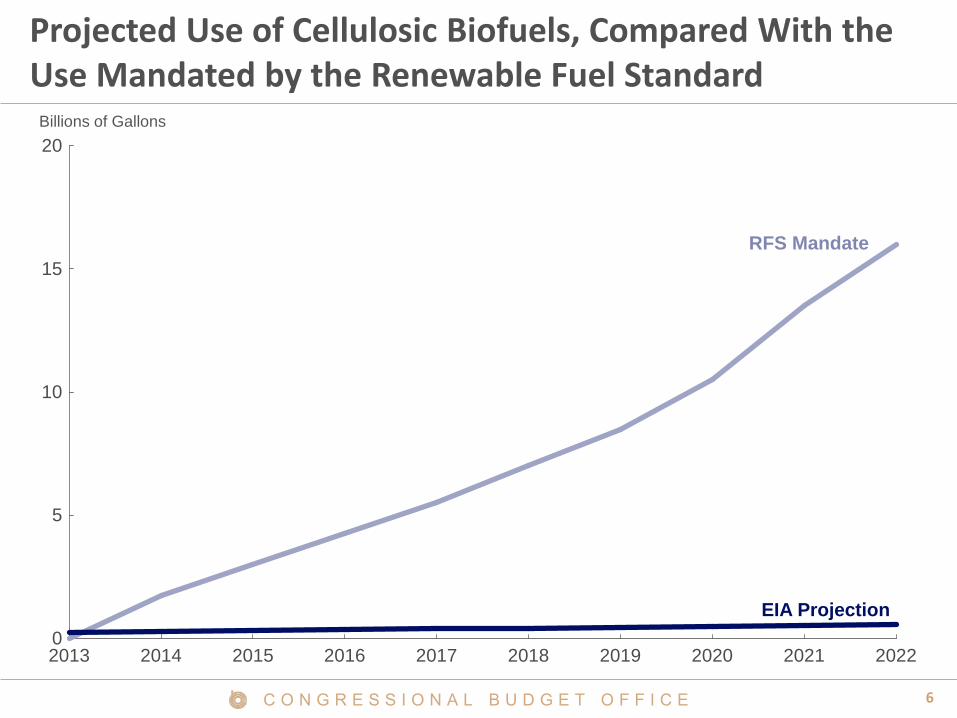
Projected Use of Cellulosic Biofuels, Compared With the Use Mandated by the Renewable Fuel Standard
Billions of Gallons
2013 2014 2015 2016 2017 2018 2019 2020 2021 20220
5
10
15
20
EIA Projection
RFS Mandate
7C O N G R E S S I O N A L B U D G E T O F F I C E
Using the Required Volume of Renewable Fuels Is Difficult
■ 10 percent is the maximum ethanol content for blended gasoline that can be used by most vehicles on the road
– Protects the engines and fuel systems of cars built before 2001
– Many states prohibit higher blends, except for in flex-fuel vehicles that are able to use fuels containing up to 85 percent ethanol
■ Increases in required volume will push ethanol content past the 10 percent “blend wall”
■ Challenges posed by the blend wall are exacerbated by a decrease in the consumption of blended gasoline
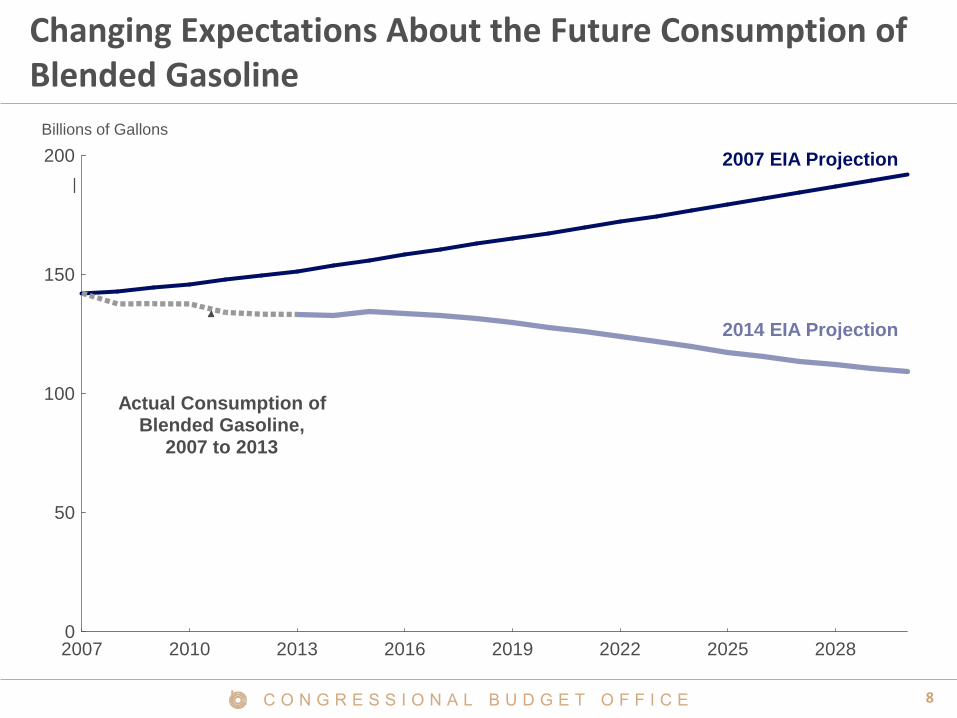
8C O N G R E S S I O N A L B U D G E T O F F I C E
Changing Expectations About the Future Consumption of Blended Gasoline
Billions of Gallons
2007 2010 2013 2016 2019 2022 2025 20280
50
100
150
200
2014 EIA Projection
2007 EIA Projection
Actual Consumption ofBlended Gasoline,
2007 to 2013
9C O N G R E S S I O N A L B U D G E T O F F I C E
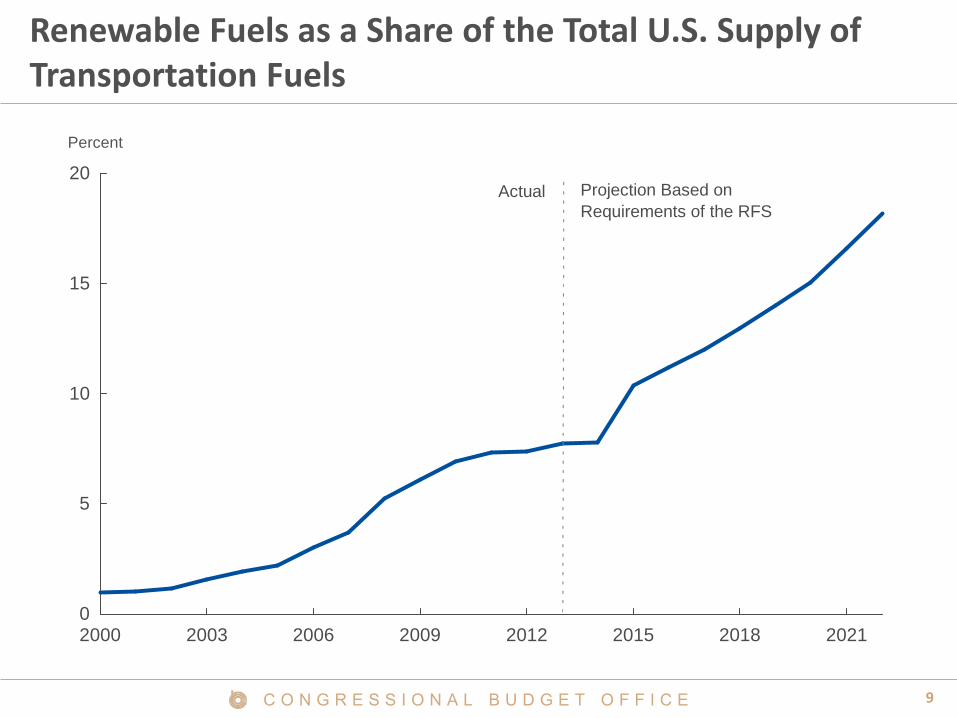
Renewable Fuels as a Share of the Total U.S. Supply of Transportation Fuels
Percent
2000 2003 2006 2009 2012 2015 2018 20210
5
10
15
20Actual Projection Based on
Requirements of the RFS
10C O N G R E S S I O N A L B U D G E T O F F I C E
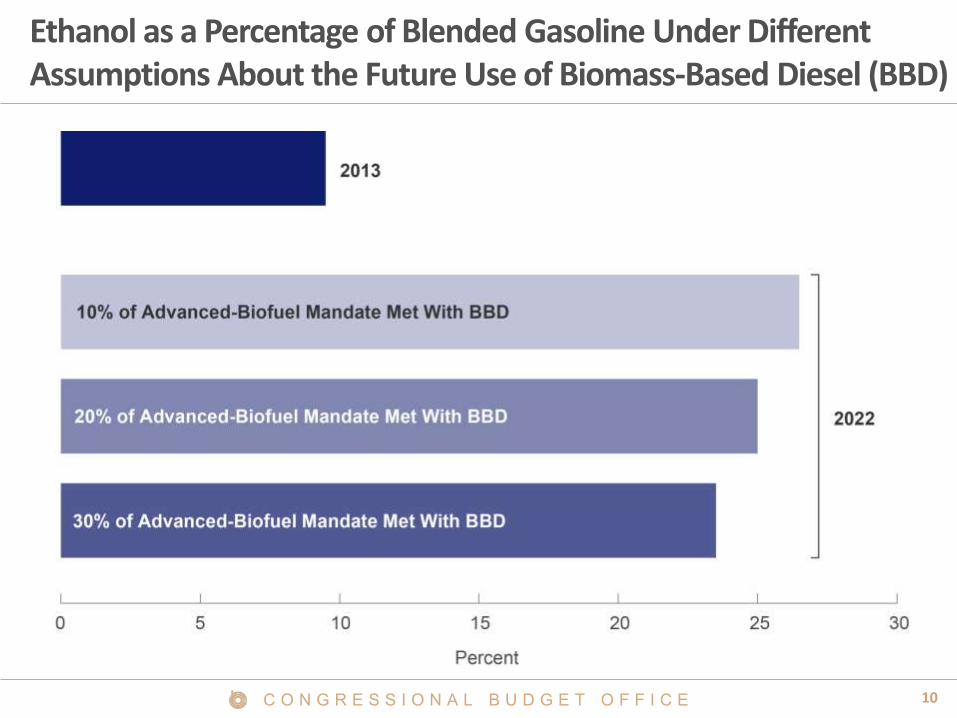
Ethanol as a Percentage of Blended Gasoline Under Different Assumptions About the Future Use of Biomass-Based Diesel (BBD)
11C O N G R E S S I O N A L B U D G E T O F F I C E
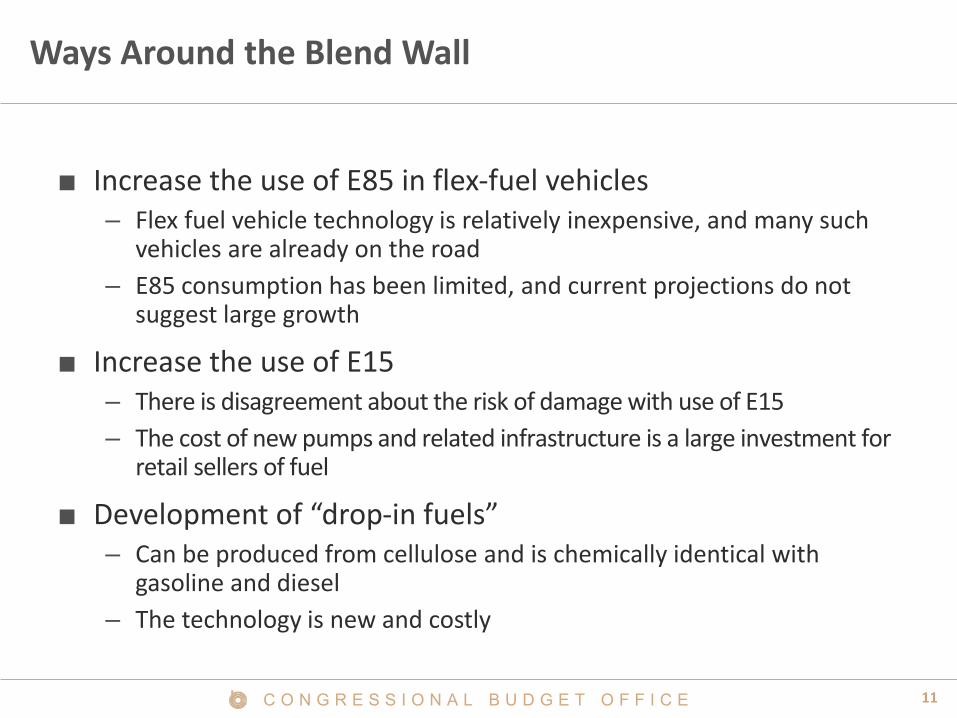
Ways Around the Blend Wall
■ Increase the use of E85 in flex-fuel vehicles– Flex fuel vehicle technology is relatively inexpensive, and many such
vehicles are already on the road
– E85 consumption has been limited, and current projections do not suggest large growth
■ Increase the use of E15– There is disagreement about the risk of damage with use of E15
– The cost of new pumps and related infrastructure is a large investment for retail sellers of fuel
■ Development of “drop-in fuels”– Can be produced from cellulose and is chemically identical with
gasoline and diesel
– The technology is new and costly
12C O N G R E S S I O N A L B U D G E T O F F I C E
The Effects of the RFS
■ CBO assessed the effects in 2017 of the RFS on the prices of food and transportation fuels as well as the effects on emissions
■ Effects are heavily dependent on decisions made by EPA
■ CBO considered three alternative scenarios
– ESIA Volumes Scenario: Requires compliance with total renewable fuel and advanced-fuel mandates and the corn-ethanol cap as stated in EISA
– 2014 Volumes Scenario: Holds volume requirements at levels proposed for 2014
– Repeal Scenario: No volume requirements
13C O N G R E S S I O N A L B U D G E T O F F I C E
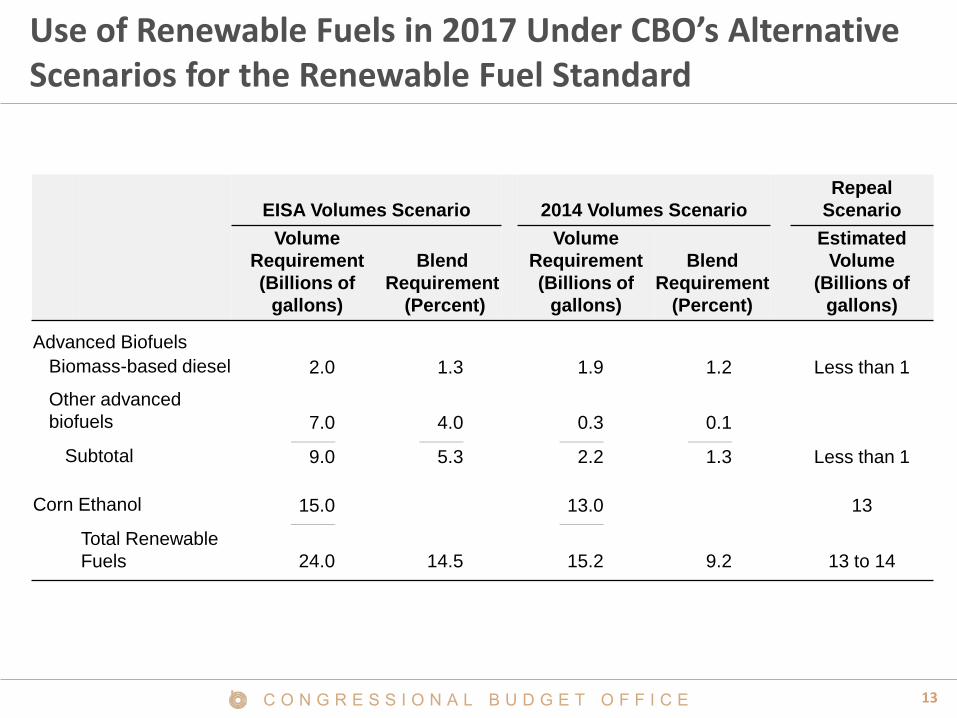
Use of Renewable Fuels in 2017 Under CBO’s Alternative Scenarios for the Renewable Fuel Standard
EISA Volumes Scenario 2014 Volumes Scenario
Repeal
Scenario
Volume
Requirement
(Billions of
gallons)
Blend
Requirement
(Percent)
Volume
Requirement
(Billions of
gallons)
Blend
Requirement
(Percent)
Estimated
Volume
(Billions of
gallons)
Advanced Biofuels
Biomass-based diesel 2.0 1.3 1.9 1.2 Less than 1
Other advanced
biofuels 7.0 4.0 0.3 0.1____________ ____________ ____________ ____________
Subtotal 9.0 5.3 2.2 1.3 Less than 1
Corn Ethanol 15.0 13.0 13____________ ____________
Total Renewable
Fuels 24.0 14.5 15.2 9.2 13 to 14
14C O N G R E S S I O N A L B U D G E T O F F I C E
Effects on Prices and Spending for Food: The 2014 Volumes Scenario vs. the Repeal Scenario
■ Ethanol use in 2017 is likely to be the same if mandates are held at 2014 levels or if the RFS is repealed
– Ethanol is expected to remain less costly than gasoline
– Octane and carbon monoxide advantages of using ethanol
■ Imposing 2014 mandates in 2017 would probably have little to no effect on food prices and spending
■ Repeal could lead to a larger decrease in corn ethanol use over the long run
15C O N G R E S S I O N A L B U D G E T O F F I C E
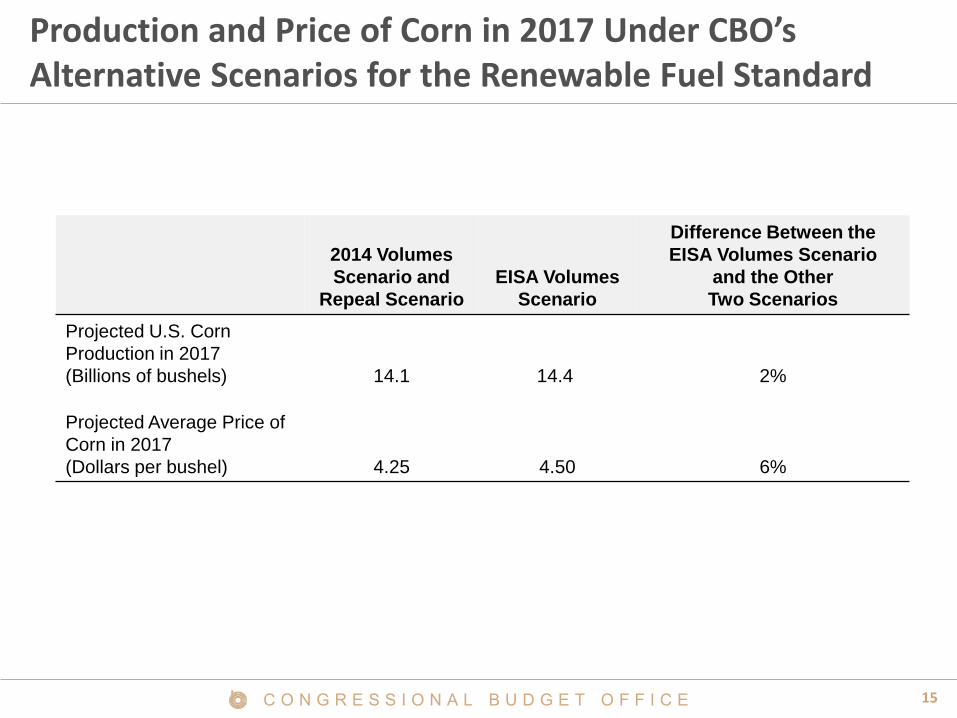
Production and Price of Corn in 2017 Under CBO’s Alternative Scenarios for the Renewable Fuel Standard
2014 Volumes
Scenario and
Repeal Scenario
EISA Volumes
Scenario
Difference Between the
EISA Volumes Scenario
and the Other
Two Scenarios
Projected U.S. Corn
Production in 2017
(Billions of bushels) 14.1 14.4 2%
Projected Average Price of
Corn in 2017
(Dollars per bushel) 4.25 4.50 6%
16C O N G R E S S I O N A L B U D G E T O F F I C E
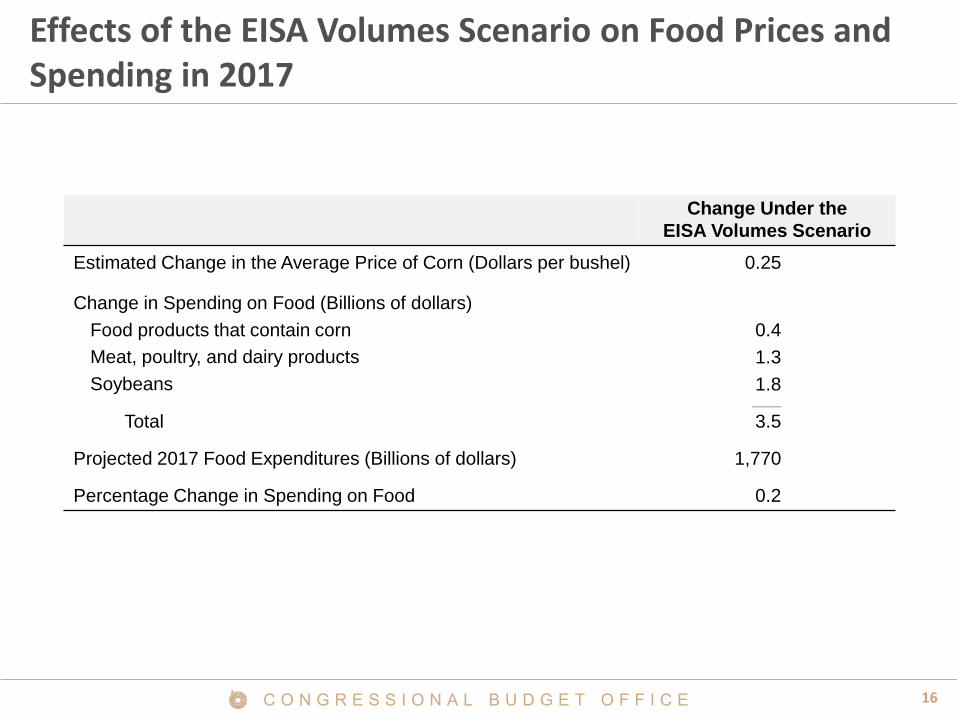
Effects of the EISA Volumes Scenario on Food Prices and Spending in 2017
Change Under the
EISA Volumes Scenario
Estimated Change in the Average Price of Corn (Dollars per bushel) 0.25
Change in Spending on Food (Billions of dollars)
Food products that contain corn 0.4
Meat, poultry, and dairy products 1.3
Soybeans 1.8_____
Total 3.5
Projected 2017 Food Expenditures (Billions of dollars) 1,770
Percentage Change in Spending on Food 0.2
17C O N G R E S S I O N A L B U D G E T O F F I C E
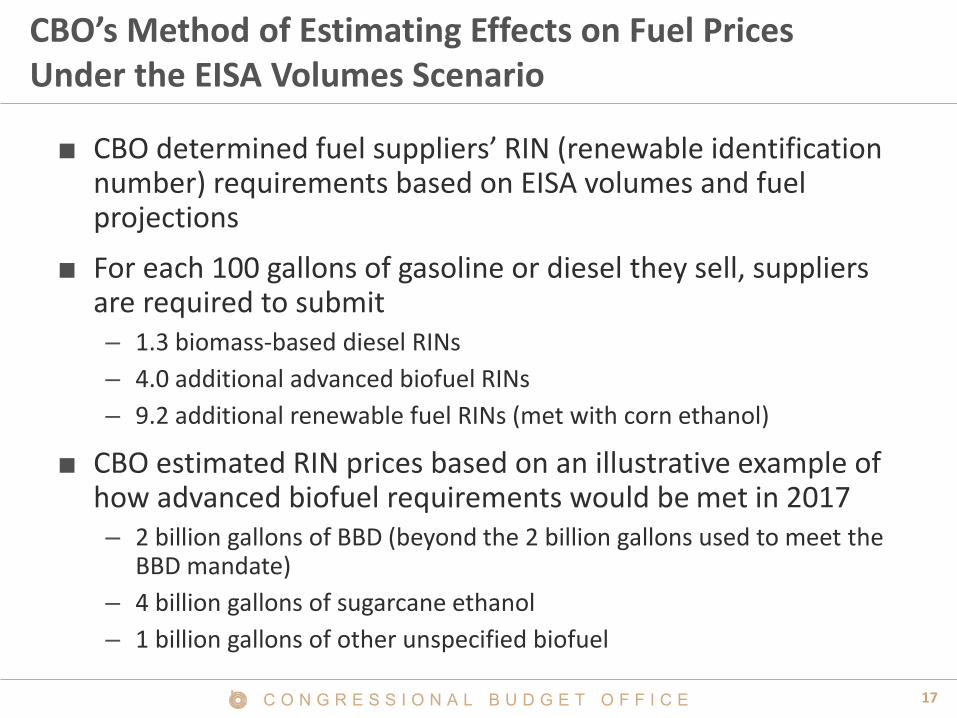
CBO’s Method of Estimating Effects on Fuel PricesUnder the EISA Volumes Scenario
■ CBO determined fuel suppliers’ RIN (renewable identification number) requirements based on EISA volumes and fuel projections
■ For each 100 gallons of gasoline or diesel they sell, suppliers are required to submit– 1.3 biomass-based diesel RINs
– 4.0 additional advanced biofuel RINs
– 9.2 additional renewable fuel RINs (met with corn ethanol)
■ CBO estimated RIN prices based on an illustrative example of how advanced biofuel requirements would be met in 2017– 2 billion gallons of BBD (beyond the 2 billion gallons used to meet the
BBD mandate)
– 4 billion gallons of sugarcane ethanol
– 1 billion gallons of other unspecified biofuel

18C O N G R E S S I O N A L B U D G E T O F F I C E
Compliance with RFS Requirements
■ EPA certifies qualifying fuels with a RIN attached to each gallon
■ Fuel suppliers must submit the required number of RINs based on their use of petroleum-based fuels
■ RINs can be banked or traded at a market price
19C O N G R E S S I O N A L B U D G E T O F F I C E
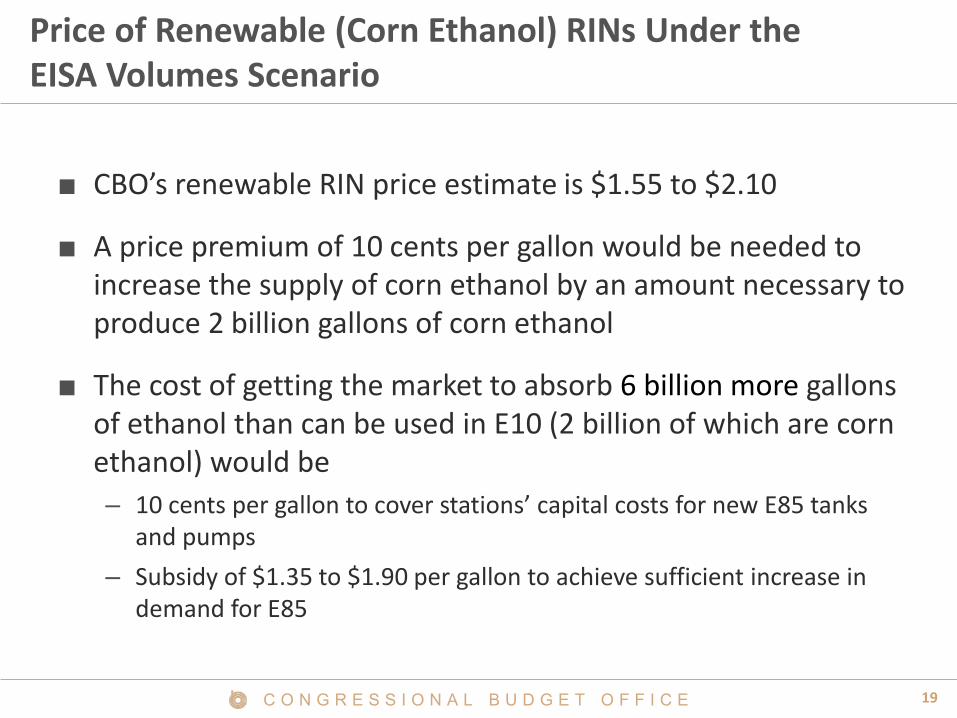
Price of Renewable (Corn Ethanol) RINs Under the EISA Volumes Scenario
■ CBO’s renewable RIN price estimate is $1.55 to $2.10
■ A price premium of 10 cents per gallon would be needed to increase the supply of corn ethanol by an amount necessary to produce 2 billion gallons of corn ethanol
■ The cost of getting the market to absorb 6 billion more gallons of ethanol than can be used in E10 (2 billion of which are corn ethanol) would be
– 10 cents per gallon to cover stations’ capital costs for new E85 tanks and pumps
– Subsidy of $1.35 to $1.90 per gallon to achieve sufficient increase in demand for E85
20C O N G R E S S I O N A L B U D G E T O F F I C E
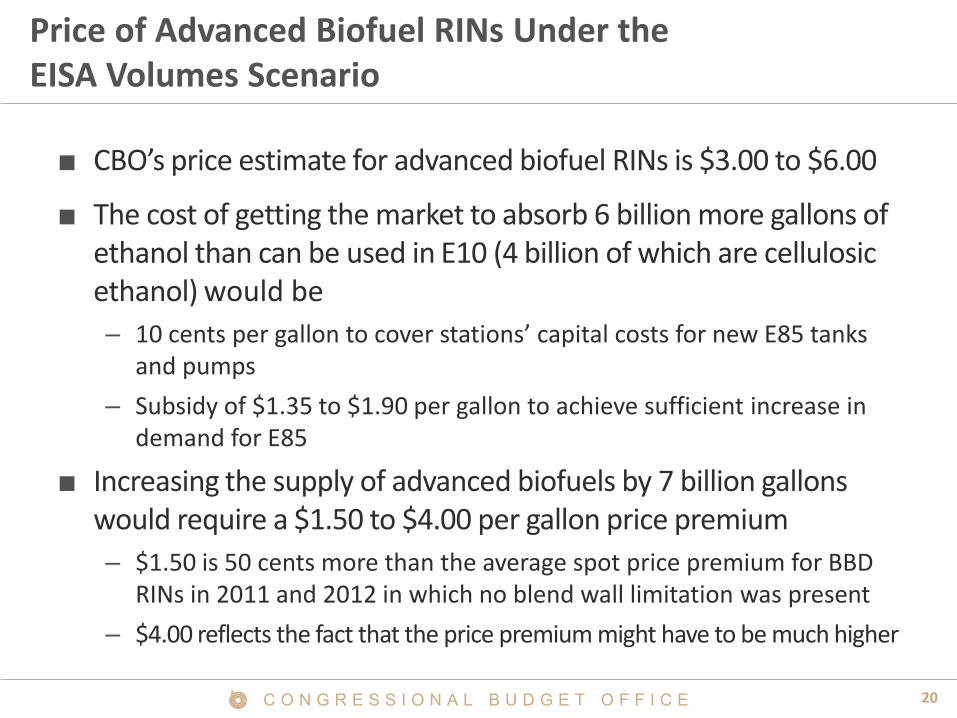
Price of Advanced Biofuel RINs Under the EISA Volumes Scenario
■ CBO’s price estimate for advanced biofuel RINs is $3.00 to $6.00
■ The cost of getting the market to absorb 6 billion more gallons of ethanol than can be used in E10 (4 billion of which are cellulosic ethanol) would be
– 10 cents per gallon to cover stations’ capital costs for new E85 tanks and pumps
– Subsidy of $1.35 to $1.90 per gallon to achieve sufficient increase in demand for E85
■ Increasing the supply of advanced biofuels by 7 billion gallons would require a $1.50 to $4.00 per gallon price premium
– $1.50 is 50 cents more than the average spot price premium for BBD RINs in 2011 and 2012 in which no blend wall limitation was present
– $4.00 reflects the fact that the price premium might have to be much higher
21C O N G R E S S I O N A L B U D G E T O F F I C E
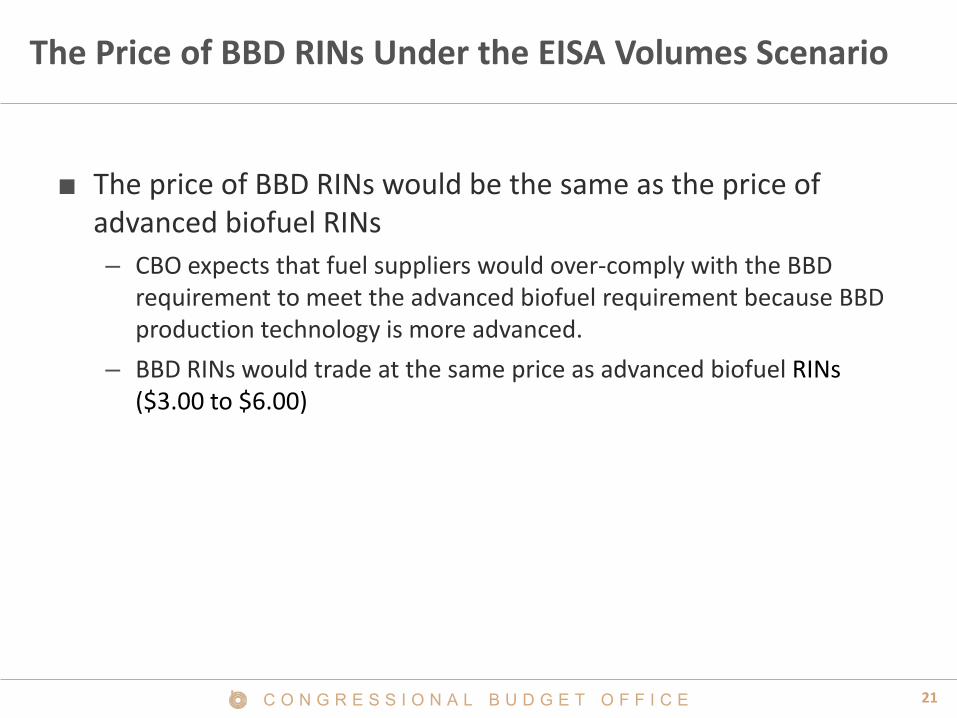
The Price of BBD RINs Under the EISA Volumes Scenario
■ The price of BBD RINs would be the same as the price of advanced biofuel RINs
– CBO expects that fuel suppliers would over-comply with the BBD requirement to meet the advanced biofuel requirement because BBD production technology is more advanced.
– BBD RINs would trade at the same price as advanced biofuel RINs ($3.00 to $6.00)
22C O N G R E S S I O N A L B U D G E T O F F I C E
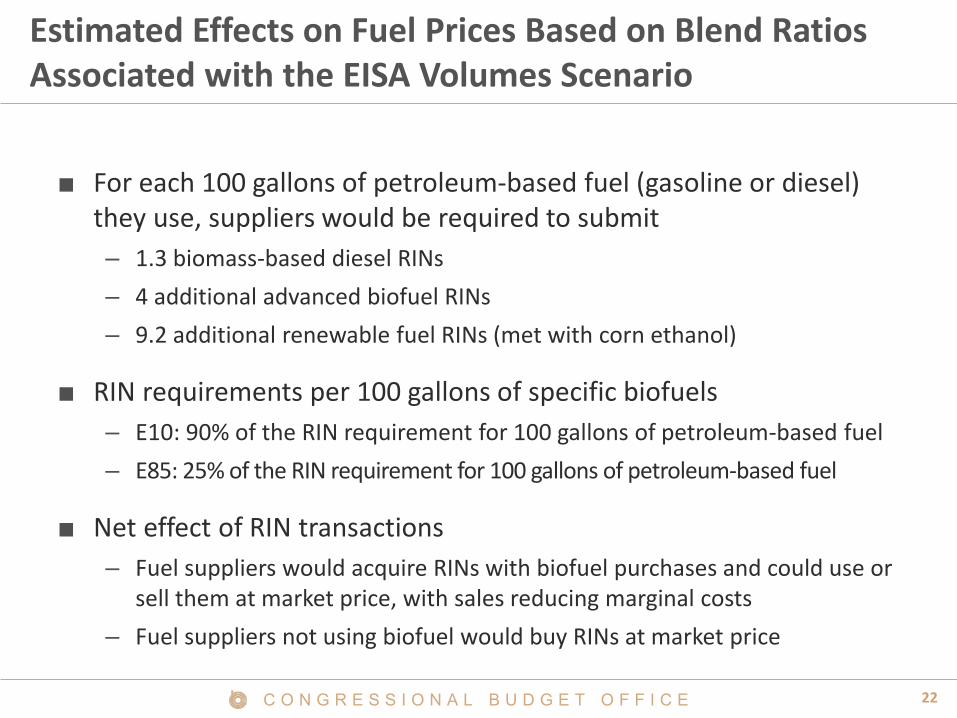
Estimated Effects on Fuel Prices Based on Blend Ratios Associated with the EISA Volumes Scenario
■ For each 100 gallons of petroleum-based fuel (gasoline or diesel) they use, suppliers would be required to submit
– 1.3 biomass-based diesel RINs
– 4 additional advanced biofuel RINs
– 9.2 additional renewable fuel RINs (met with corn ethanol)
■ RIN requirements per 100 gallons of specific biofuels
– E10: 90% of the RIN requirement for 100 gallons of petroleum-based fuel
– E85: 25% of the RIN requirement for 100 gallons of petroleum-based fuel
■ Net effect of RIN transactions
– Fuel suppliers would acquire RINs with biofuel purchases and could use or sell them at market price, with sales reducing marginal costs
– Fuel suppliers not using biofuel would buy RINs at market price
23C O N G R E S S I O N A L B U D G E T O F F I C E
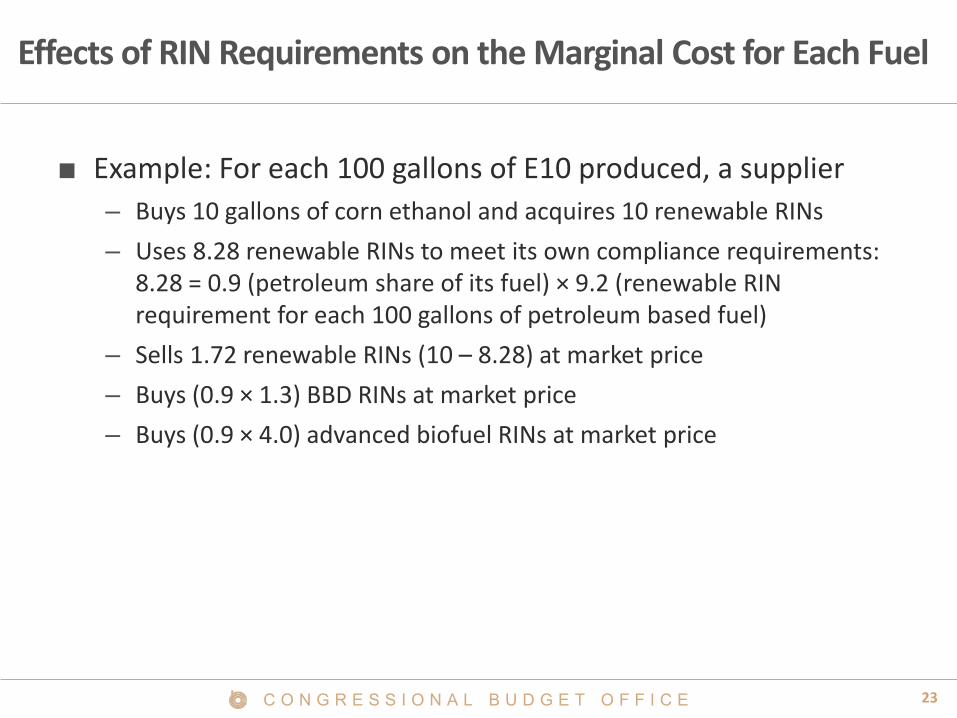
Effects of RIN Requirements on the Marginal Cost for Each Fuel
■ Example: For each 100 gallons of E10 produced, a supplier
– Buys 10 gallons of corn ethanol and acquires 10 renewable RINs
– Uses 8.28 renewable RINs to meet its own compliance requirements: 8.28 = 0.9 (petroleum share of its fuel) × 9.2 (renewable RIN requirement for each 100 gallons of petroleum based fuel)
– Sells 1.72 renewable RINs (10 – 8.28) at market price
– Buys (0.9 × 1.3) BBD RINs at market price
– Buys (0.9 × 4.0) advanced biofuel RINs at market price
24C O N G R E S S I O N A L B U D G E T O F F I C E
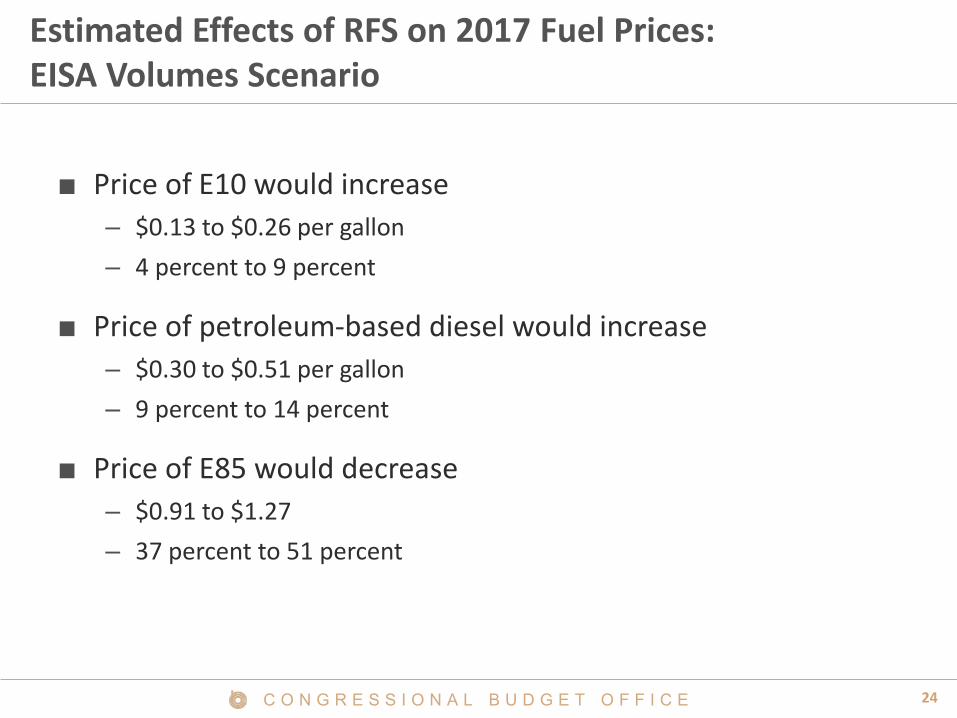
Estimated Effects of RFS on 2017 Fuel Prices: EISA Volumes Scenario
■ Price of E10 would increase
– $0.13 to $0.26 per gallon
– 4 percent to 9 percent
■ Price of petroleum-based diesel would increase
– $0.30 to $0.51 per gallon
– 9 percent to 14 percent
■ Price of E85 would decrease
– $0.91 to $1.27
– 37 percent to 51 percent
25C O N G R E S S I O N A L B U D G E T O F F I C E
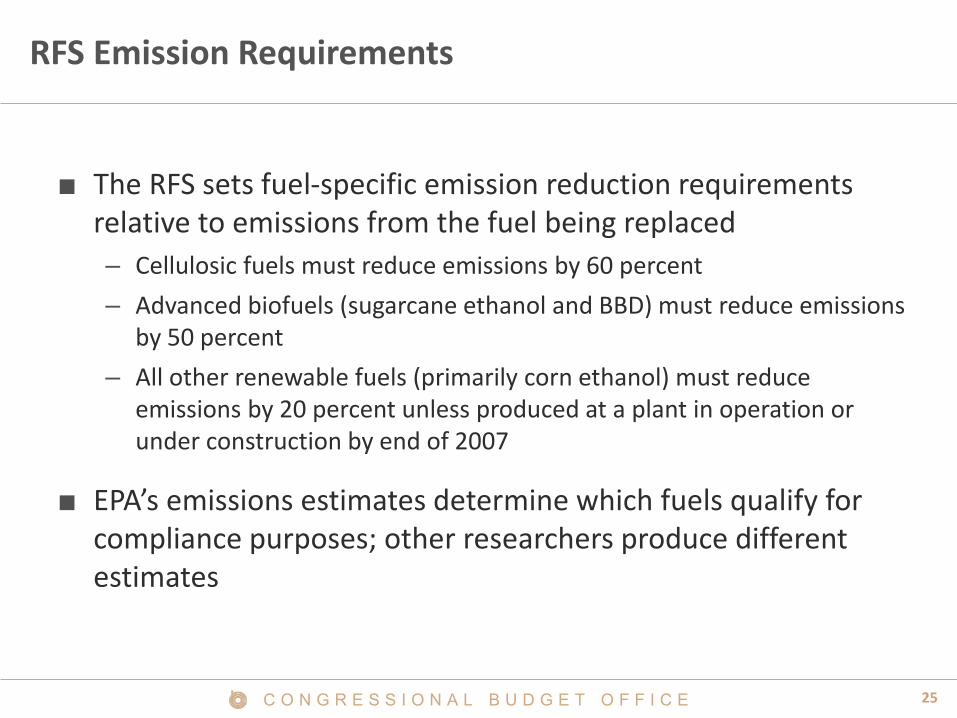
RFS Emission Requirements
■ The RFS sets fuel-specific emission reduction requirements relative to emissions from the fuel being replaced
– Cellulosic fuels must reduce emissions by 60 percent
– Advanced biofuels (sugarcane ethanol and BBD) must reduce emissions by 50 percent
– All other renewable fuels (primarily corn ethanol) must reduce emissions by 20 percent unless produced at a plant in operation or under construction by end of 2007
■ EPA’s emissions estimates determine which fuels qualify for compliance purposes; other researchers produce different estimates
26C O N G R E S S I O N A L B U D G E T O F F I C E
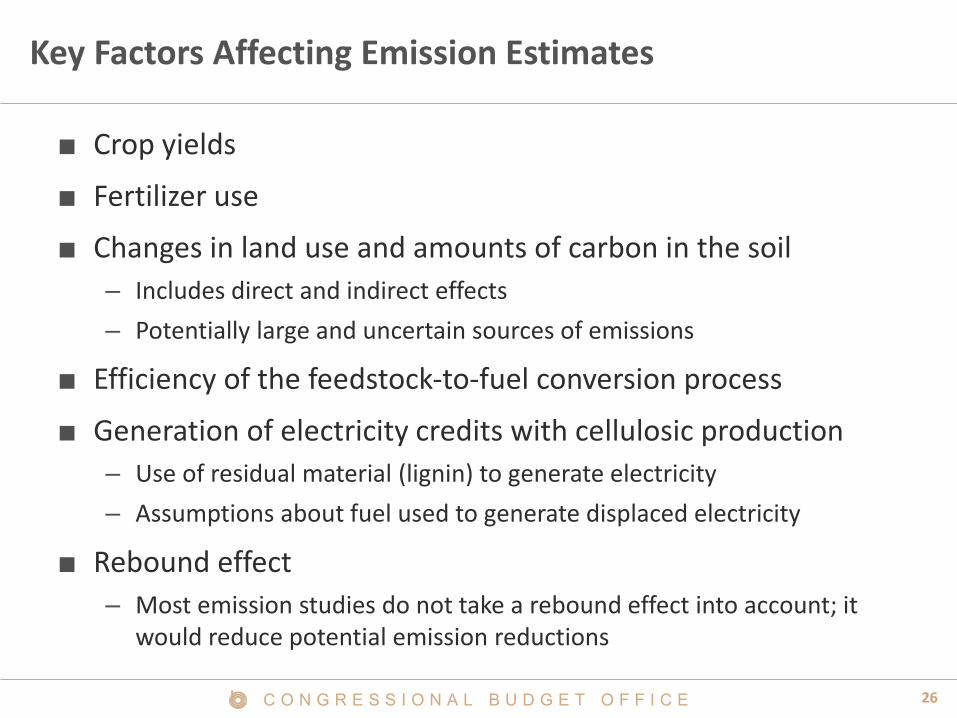
Key Factors Affecting Emission Estimates
■ Crop yields
■ Fertilizer use
■ Changes in land use and amounts of carbon in the soil
– Includes direct and indirect effects
– Potentially large and uncertain sources of emissions
■ Efficiency of the feedstock-to-fuel conversion process
■ Generation of electricity credits with cellulosic production
– Use of residual material (lignin) to generate electricity
– Assumptions about fuel used to generate displaced electricity
■ Rebound effect
– Most emission studies do not take a rebound effect into account; it would reduce potential emission reductions
27C O N G R E S S I O N A L B U D G E T O F F I C E
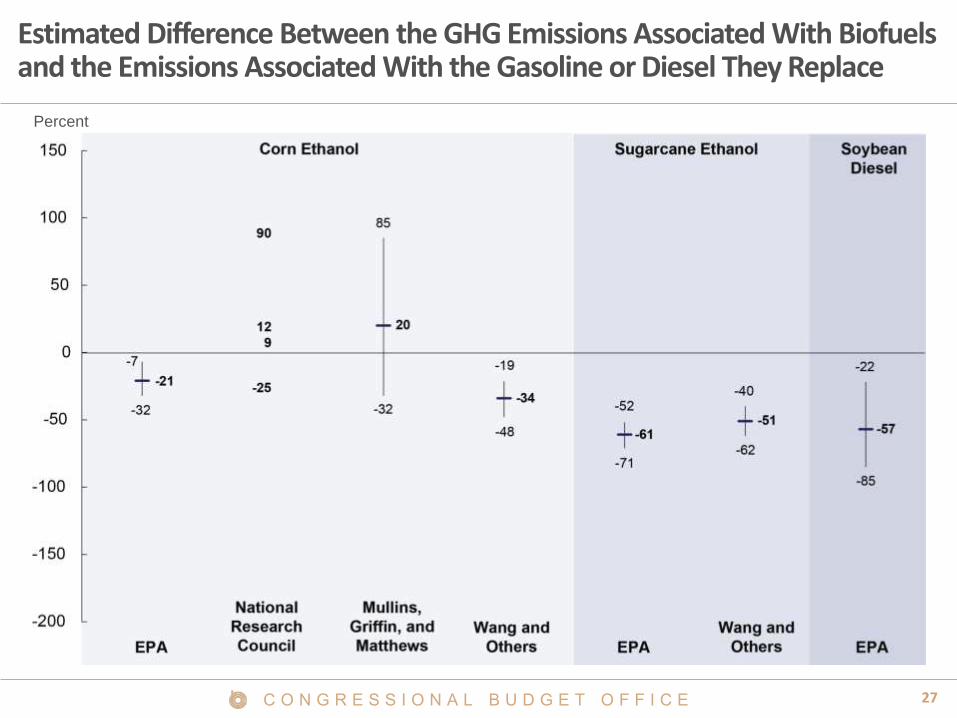
Estimated Difference Between the GHG Emissions Associated With Biofuels and the Emissions Associated With the Gasoline or Diesel They Replace
Percent
28C O N G R E S S I O N A L B U D G E T O F F I C E
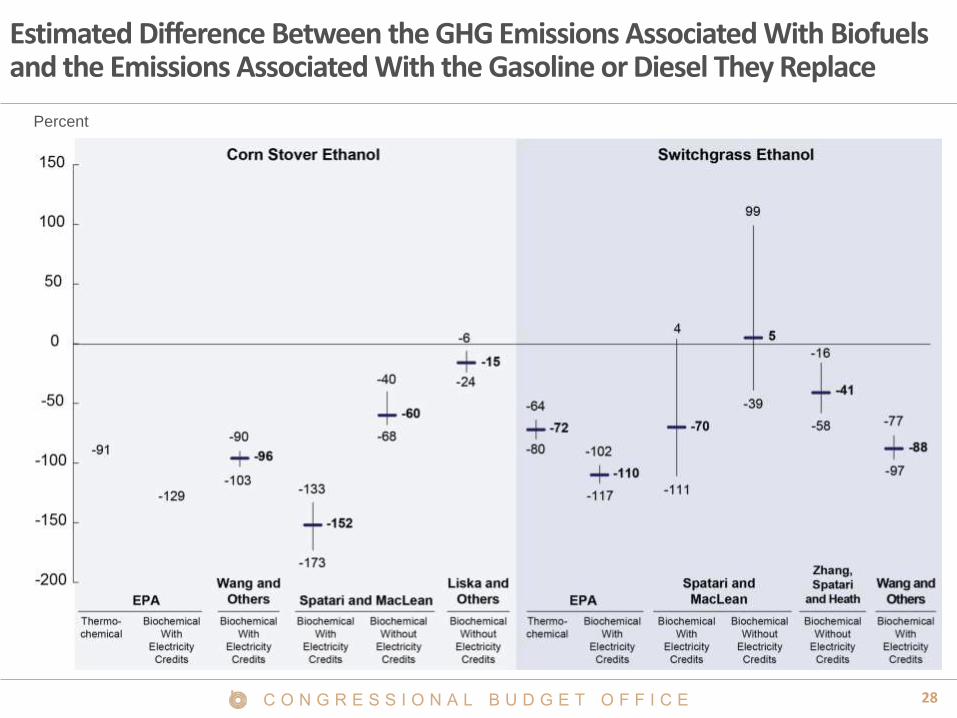
Estimated Difference Between the GHG Emissions Associated With Biofuels and the Emissions Associated With the Gasoline or Diesel They Replace
Percent
29C O N G R E S S I O N A L B U D G E T O F F I C E
Conclusions About Emissions
■ Emission reductions are uncertain; estimates differ
– Changes in land use and soil carbon
– Assumptions about electricity credits
■ Reductions in 2017 emissions under the EISA Volumes Scenario would be small
– Limited use of cellulosic biofuels
– Continued use of corn ethanol from grandfathered facilities
■ Reductions over the longer term will depend on the development and deployment of new technologies
30C O N G R E S S I O N A L B U D G E T O F F I C E
Summing Up
■ To date, RIN prices have typically been low
– Fuel suppliers have complied by using corn ethanol in E10
– EPA has waived cellulosic requirements
■ In the future, meeting EISA mandates will be challenging
– Cellulosic production capacity likely to remain well below mandated levels
– Substituting other advanced fuels for cellulosic biofuels would entail large and rapid increases in their supply
– Overcoming the blend wall will require capital investments in fueling stations and significant subsidies to encourage use of E85
31C O N G R E S S I O N A L B U D G E T O F F I C E
Summing Up (Continued)
■ The EISA Volumes Scenario
– Small effects on food prices
– Significant effects on transportation fuel prices
– Small effects on emissions
■ Potential for significant emission reductions in the longer term depends on technology development
■ The RFS illustrates the trade-off between the use of waivers to contain costs and the effectiveness of the policy in forcing technologies