issues in diabetes care academic half-day february 2002 d. hunt
TRANSCRIPT

Issues in Diabetes Care
Academic Half-day
February 2002
D. Hunt

Outline
1. Significance of diabetes mellitus
2. Glycemic control: - evidence
- oral agents
- insulin
3. Blood pressure control
4. Nephropathy and microalbuminuria
5. Cases

Significance of diabetes mellitus
• 5% of the population has diagnosed diabetes• 10% Type 1; 90% Type 2• prevalence increases with age:
20 - 44: 1%
45 - 65: 5%
> 65: 10%
• the true prevalence of diabetes is estimated to be twice the prevalence of diagnosed diabetes

Frequency of diagnosed and undiagnosed diabetes and IGT, by age (U.S. data - Harris)
1.5 Million Canadians Have Diabetes Mellitus
0
5
10
15
20
25
30
35
40
20-34 35-44 45-54 55-64 65-74
% ofpopulation
IGTUndiagnosed diabetesDiagnosed diabetes
Harris. Diabetes Care 1993;16:642-52.

Proliferative retinopathy
Type 1: 25% after 15 years
Type 2: 4% - 12% after 15 years
Blindness: 10% - 15% of patients with proliferative retinopathy have severe visual loss within 2 years
Diabetes is the leading cause of adult-onset blindness

Nephropathy
Type 1: 30% after 15 years
Type 2: 20% after 15 years
Follow-up from the Multiple Risk Factor Intervention Trial:RR for end-stage renal disease: 9.0 (7.4 - 11.0)
Diabetes is the leading cause of end-stage renal disease

Neuropathy
Loss of foot sensation > foot ulcers and infections > foot amputations
Amputation rate: 2 - 30/1000 patient-years
Diabetes is the leading cause of non-traumatic amputation

Haffner Am J Cardiol 1999;84:11J-4J.
Framingham study: diabetes and CAD mortalityat 20-year follow-up
Cardiovascular Disease Risk is Increased 2 to 4 Times
17.4
8.5
17.0
3.602468
101214161820
Annual CAD Deaths per 1,000
Persons
Men Women
Diabetics Nondiabetics

Macrovascular disease
Multiple Risk Factor Intervention Trial:Follow-up of 350,000 screened patients
RR for cardiovascular death: 3.0
Swedish cohort study:Baseline age: 51 - 59Follow-up: 16 years
RR for cardiovascular death: 2.9 (2.3 - 5.6)

Glycemic control - Type 1 diabetes
The Diabetes Control and Complications Trial:– 1441 patients with Type 1 diabetes– intensive insulin therapy vs conventional therapy– follow-up 6.5 years
Early retinopathy: 24% vs 7%
Microalbuminuria:20% vs 13%
Neuropathy: 10% vs 3%

Glycemic control
Can these results be applied to people with Type 2 diabetes?
Potential benefits: Decreased microvascular disease
Potential adverse effects: Increased cardiovascular mortality with oral hypoglycemic agents and insulin

Does an intensive glucose Does an intensive glucose control policy reduce the risk control policy reduce the risk of complications for people of complications for people
with Type 2 diabetes?with Type 2 diabetes?
UK Prospective Diabetes StudyUK Prospective Diabetes Study
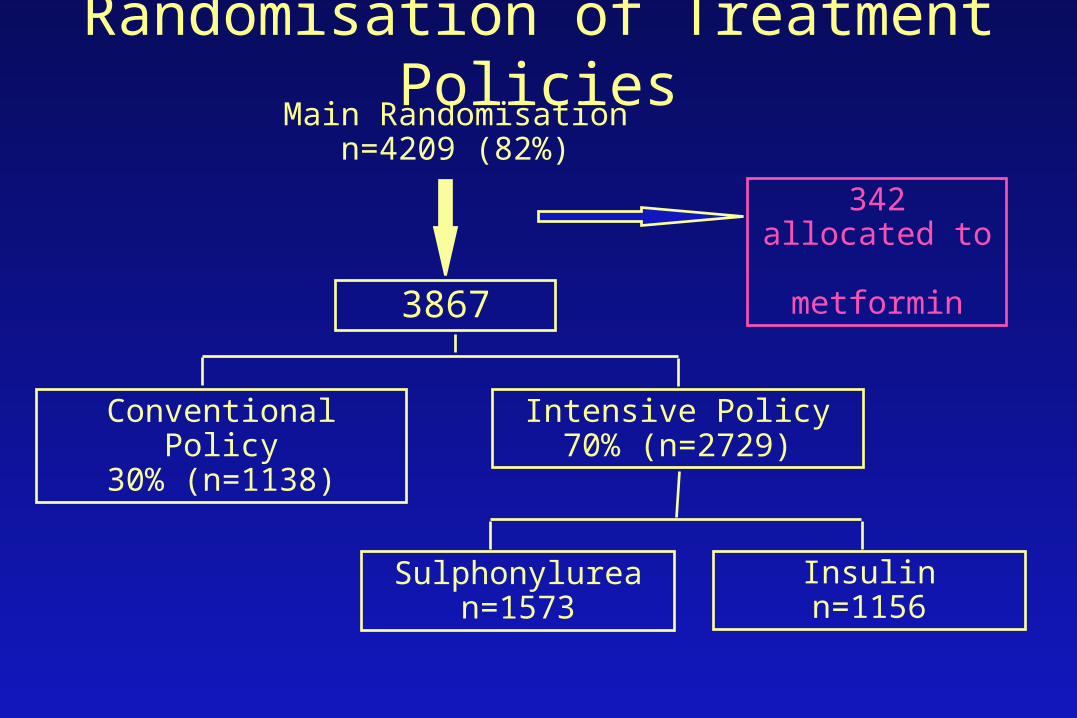
Randomisation of Treatment Policies
342 allocated to metformin
Conventional Policy30% (n=1138)
Intensive Policy70% (n=2729)
Sulphonylurean=1573
Insulinn=1156
Main Randomisationn=4209 (82%)
3867

Treatment Policies in 3867 patients
Conventional Policy
n = 1138
• initially with diet alone
• aim for near normal weightbest fasting plasma glucose < 15 mmol/Lasymptomatic
• when marked hyperglycaemia developsallocate to non-intensive pharmacological therapy
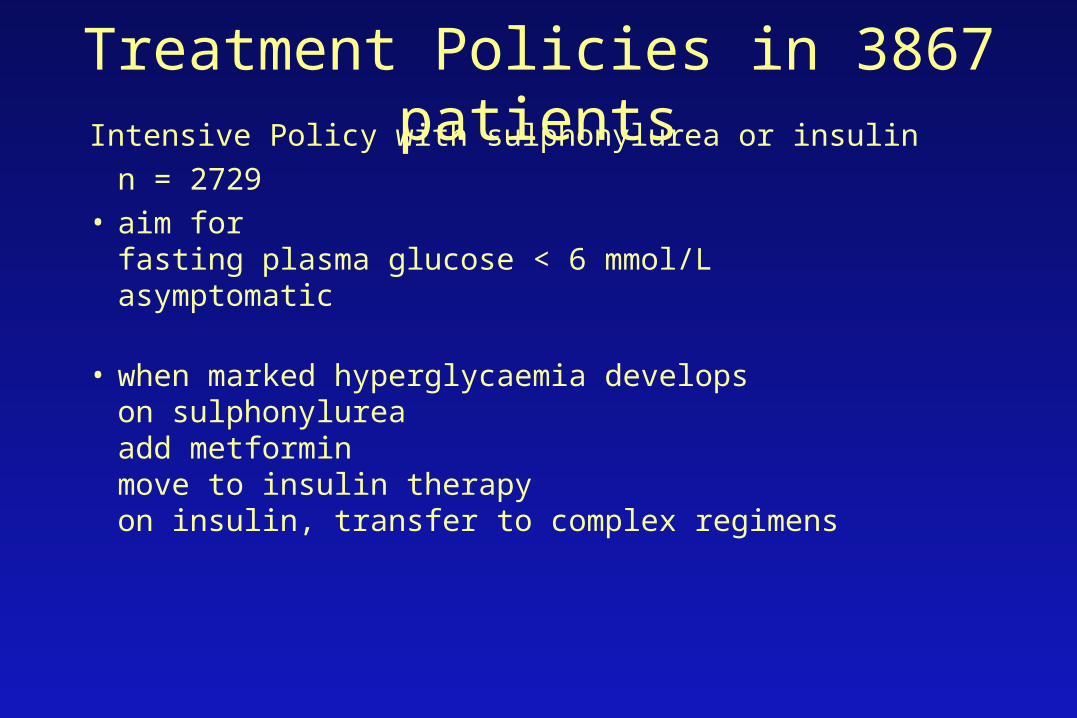
Treatment Policies in 3867 patientsIntensive Policy with sulphonylurea or insulin
n = 2729 • aim for
fasting plasma glucose < 6 mmol/Lasymptomatic
• when marked hyperglycaemia developson sulphonylurea add metforminmove to insulin therapyon insulin, transfer to complex regimens

Actual Therapy
Years from randomisation
1 2 3 4 5 6 7 8 9 10 11 120
20
40
60
80
100
pro
po
rtio
n o
f p
ati
en
ts
diet alone
1 2 3 4 5 6 7 8 9 10 11 12
intensivepharmacologicaltherapy
diet aloneadditional non-intensivepharmacological therapy
Intensive Policyaim for < 6 mmol/L
Conventional Policyaccept < 15 mmol/L
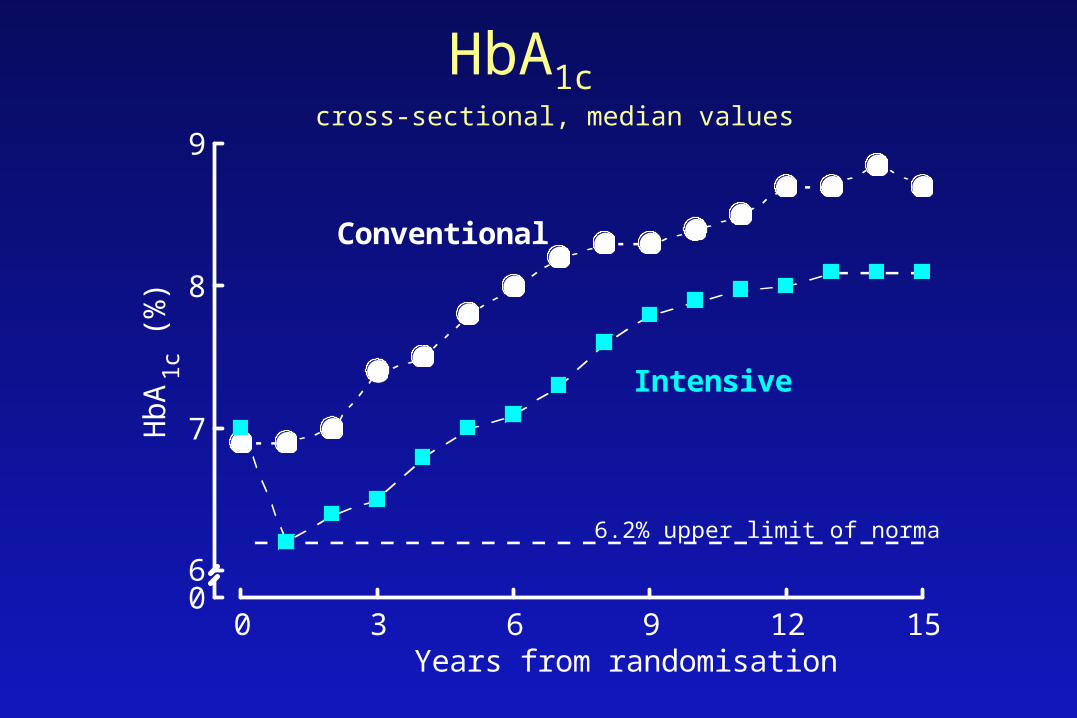
HbA1c cross-sectional, median values
06
7
8
9
0 3 6 9 12 15
HbA 1
c (%
)
Years from randomisation
Conventional
Intensive
6.2% upper limit of normal range

Any Diabetes Related EndpointAny Diabetes Related Endpoint
1401 of 3867 patients (36%)
First occurrence of any one of:
• diabetes related death
• non fatal myocardial infarction, heart failure or angina
• non fatal stroke
• amputation
• renal failure
• retinal photocoagulation or vitreous haemorrhage
• cataract extraction or blind in one eye
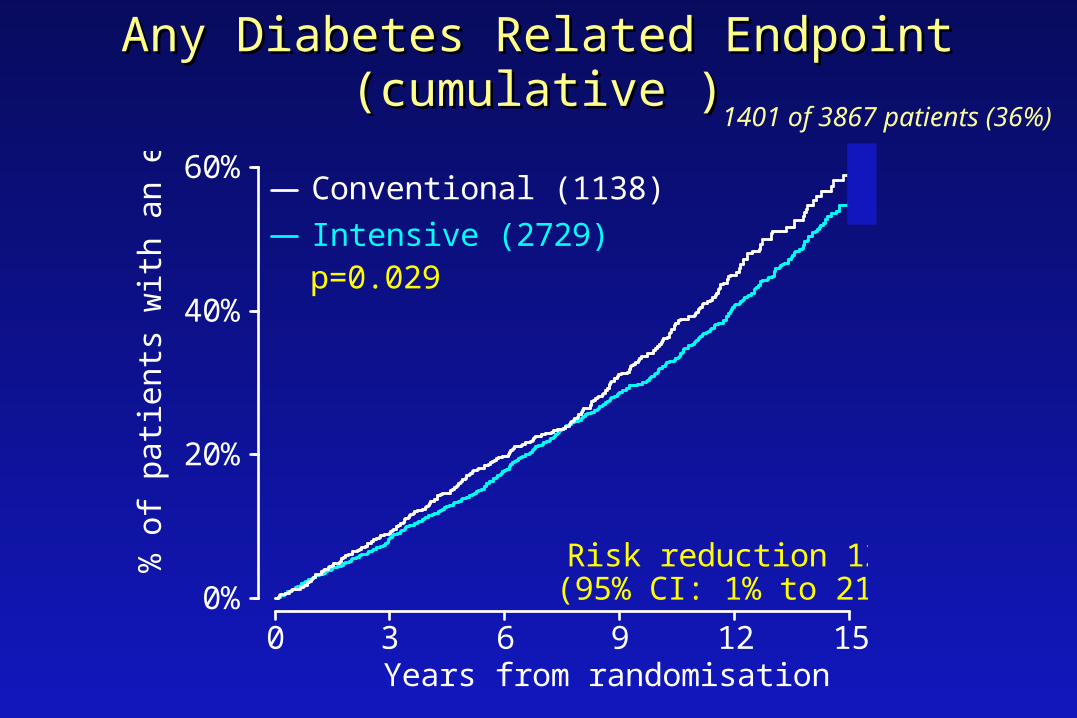
Any Diabetes Related Endpoint (cumulative )Any Diabetes Related Endpoint (cumulative )
0%
20%
40%
60%
0 3 6 9 12 15
% o
f pa
tient
s w
ith a
n ev
ent
Years from randomisation
Intensive (2729)
Conventional (1138)
Risk reduction 12%(95% CI: 1% to 21%)
p=0.029
1401 of 3867 patients (36%)

Diabetes Related DeathsDiabetes Related Deaths
414 of 3867 patients (11%)
Any of:
• fatal myocardial infarction or sudden death
• fatal stroke
• death from peripheral vascular disease
• death from renal disease
• death from hyper/hypoglycaemia

Diabetes Related Deaths (cumulative)
0%
10%
20%
30%
0 3 6 9 12 15
% o
f pa
tient
s w
ith a
n ev
ent
Years from randomisation
Intensive (2729)
Conventional (1138)
p=0.34
414 of 3867 patients (11%)

Microvascular Endpoints (cumulative)Microvascular Endpoints (cumulative)
p=0.0099
0%
10%
20%
30%
0 3 6 9 12 15
% o
f pa
tient
s w
ith a
n ev
ent
Years from randomisation
Intensive
Conventional
Risk reduction 25%(95% CI: 7% to 40%)
renal failure or death, vitreous haemorrhage or photocoagulation346 of 3867 patients (9%)
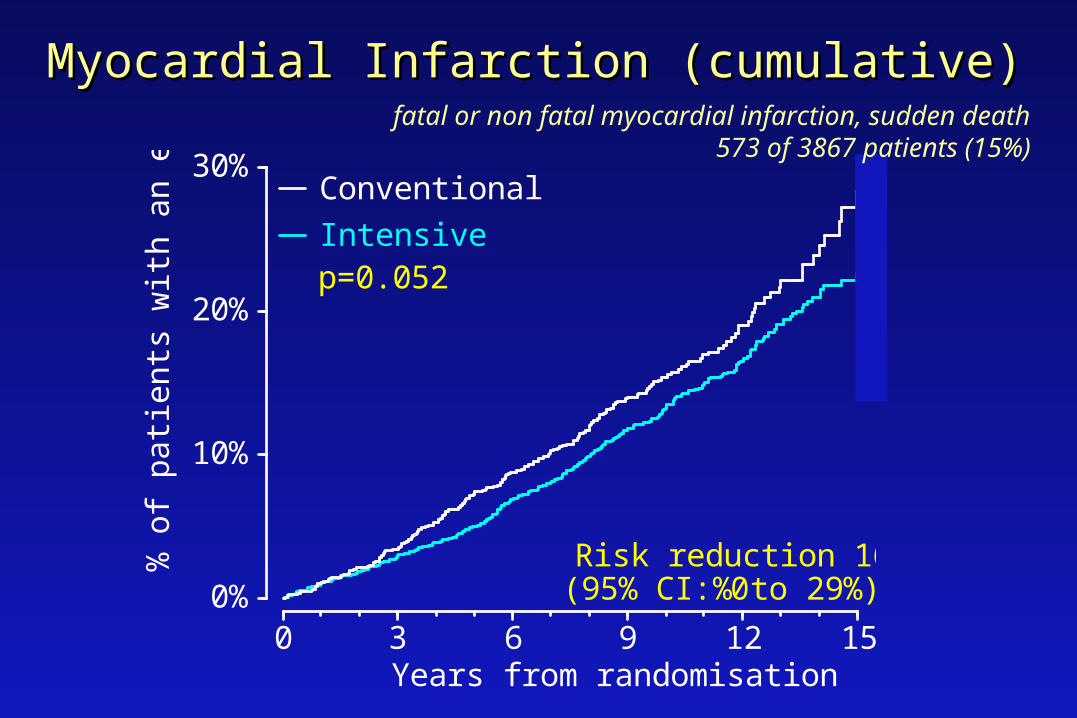
Myocardial Infarction (cumulative)Myocardial Infarction (cumulative)
0%
10%
20%
30%
0 3 6 9 12 15
% o
f pa
tient
s w
ith a
n ev
ent
Years from randomisation
Intensive
Conventional
p=0.052
Risk reduction 16%(95% CI: 0% to 29%)
fatal or non fatal myocardial infarction, sudden death573 of 3867 patients (15%)

Aggregate Clinical EndpointsAggregate Clinical Endpoints
Favoursconventional
0.5 1 2
0.88
0.90
0.94
0.84
1.11
0.75
0.029
0.34
0.44
0.052
0.52
0.0099
Any diabetes related endpoint
Diabetes related deaths
All cause mortality
Myocardial infarction
Stroke
Microvascular
RR p
Favoursintensive
Relative Risk& 95% CI
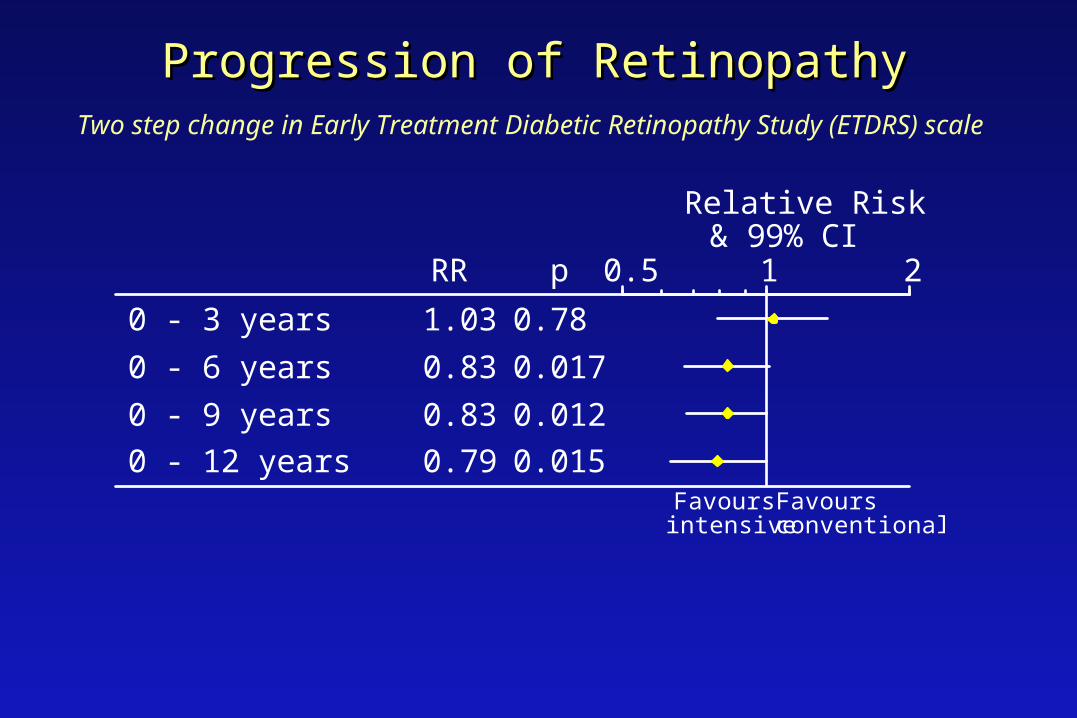
Progression of RetinopathyProgression of RetinopathyTwo step change in Early Treatment Diabetic Retinopathy Study (ETDRS) scale
1.03
0.83
0.83
0.79
0.78
0.017
0.012
0.015
0 - 3 years
0 - 6 years
0 - 9 years
0 - 12 years
RR p 0.5 1 2
Relative Risk& 99% CI
Favoursconventional
Favoursintensive
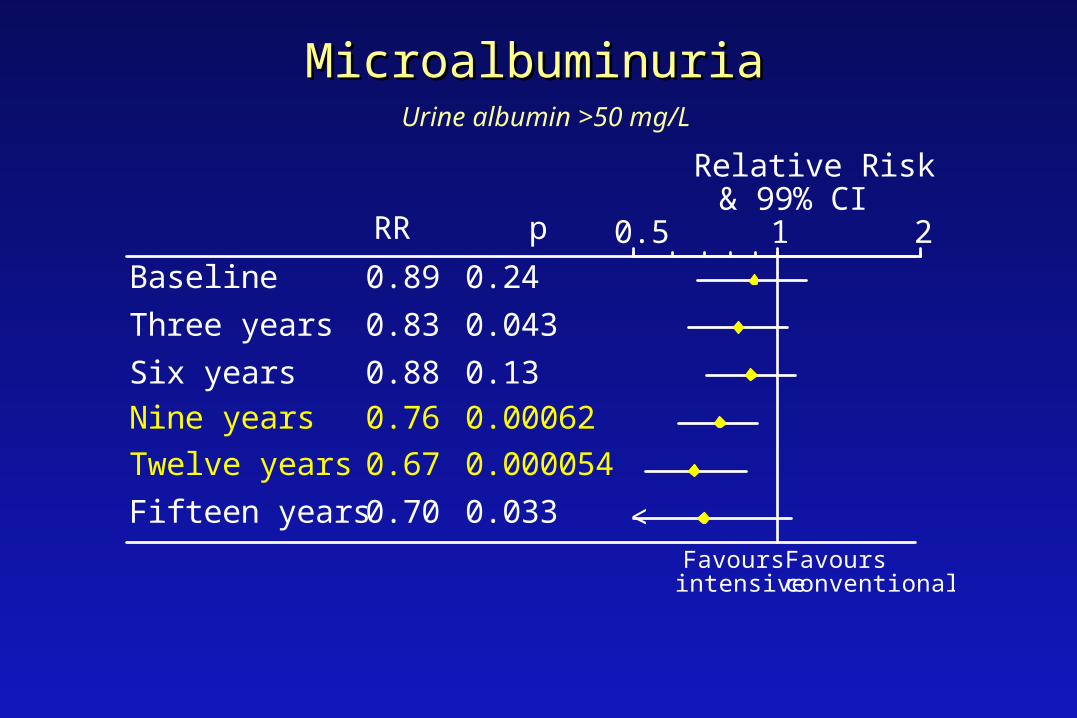
MicroalbuminuriaMicroalbuminuriaUrine albumin >50 mg/L
0.89
0.83
0.88
0.76
0.67
0.70
0.24
0.043
0.13
0.00062
0.000054
0.033
Baseline
Three years
Six years
Nine years
Twelve years
Fifteen years
RR p 0.5 1 2
Relative Risk& 99% CI
Favoursconventional
Favoursintensive
<

Glycemic control - UKPDSGlycemic control - UKPDS
Intensive blood glucose control reduces
the risk of diabetic complications, the
greatest effect being on microvascular
complications
Does metformin in overweight diabetic patients have any
advantages or disadvantages?
UK Prospective Diabetes StudyUK Prospective Diabetes Study
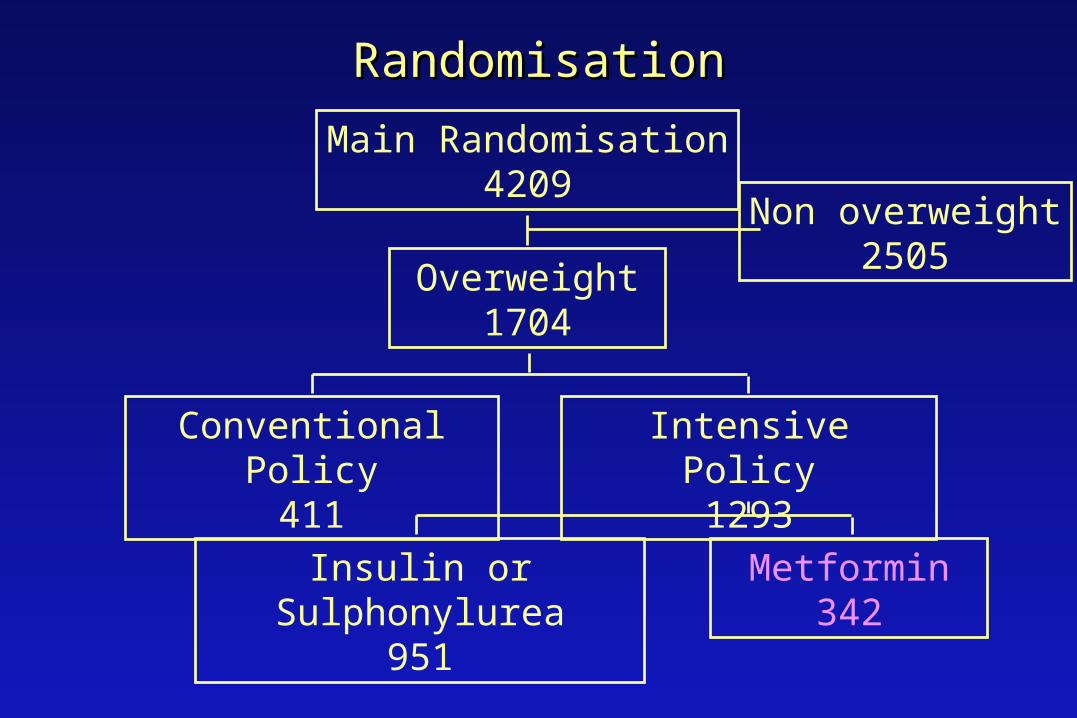
RandomisationRandomisation
Main Randomisation4209
Overweight1704
Non overweight2505
Conventional Policy411
Intensive Policy1293
Metformin342
Insulin or Sulphonylurea951
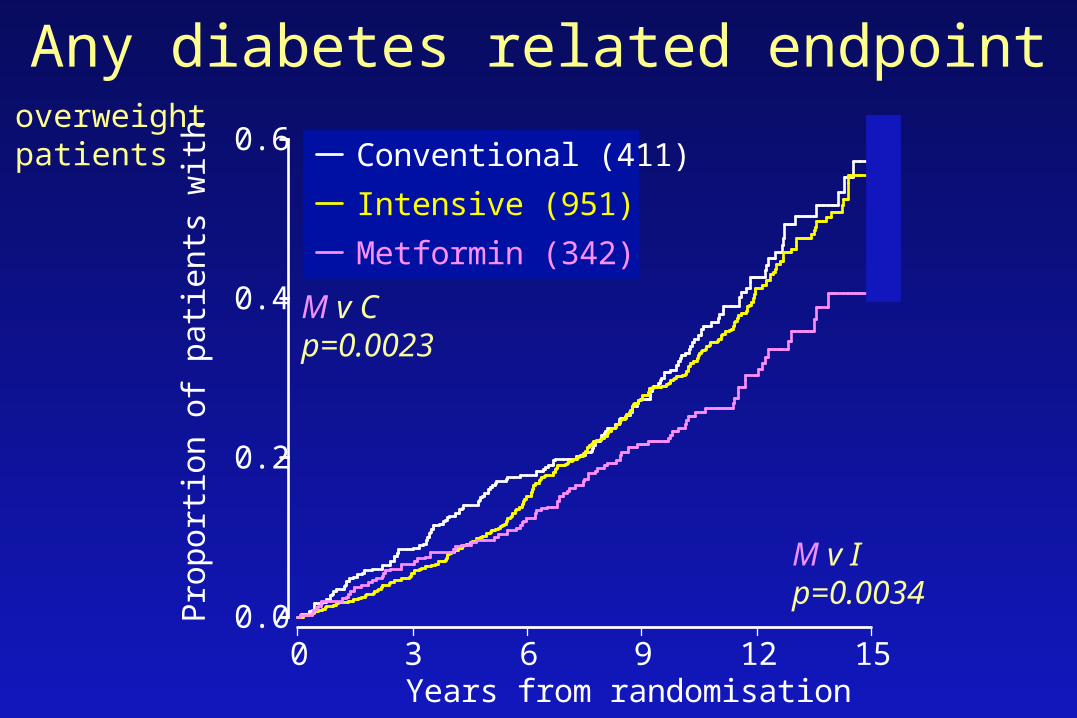
0.0
0.2
0.4
0.6
0 3 6 9 12 15
Pro
port
ion
of p
atie
nts
with
eve
nts
Years from randomisation
Conventional (411)
Intensive (951)
Metformin (342)
Any diabetes related endpoint
M v Ip=0.0034
overweight patients
M v C p=0.0023

0.0
0.1
0.2
0.3
0.4
0 3 6 9 12 15
Pro
port
ion
of p
atie
nts
with
eve
nts
Years from randomisation
Conventional (411)
Intensive (951)
Metformin (342)
Diabetes related deaths
M v Ip=0.11
overweight patients
M v C p=0.017

Myocardial Infarction
M v Ip=0.12
overweight patients
0.0
0.1
0.2
0.3
0.4
0 3 6 9 12 15
Pro
port
ion
of p
atie
nts
with
eve
nts
Years from randomisation
Conventional (411)
Intensive (951)
Metformin (342)
M v Cp=0.010

0.0
0.1
0.2
0.3
0 3 6 9 12 15
Pro
port
ion
of p
atie
nts
with
eve
nts
Years from randomisation
Conventional (411)
Intensive (951)
Metformin (342)
Microvascular endpoints
M v Ip=0.39
overweight patients
M v Cp=0.19
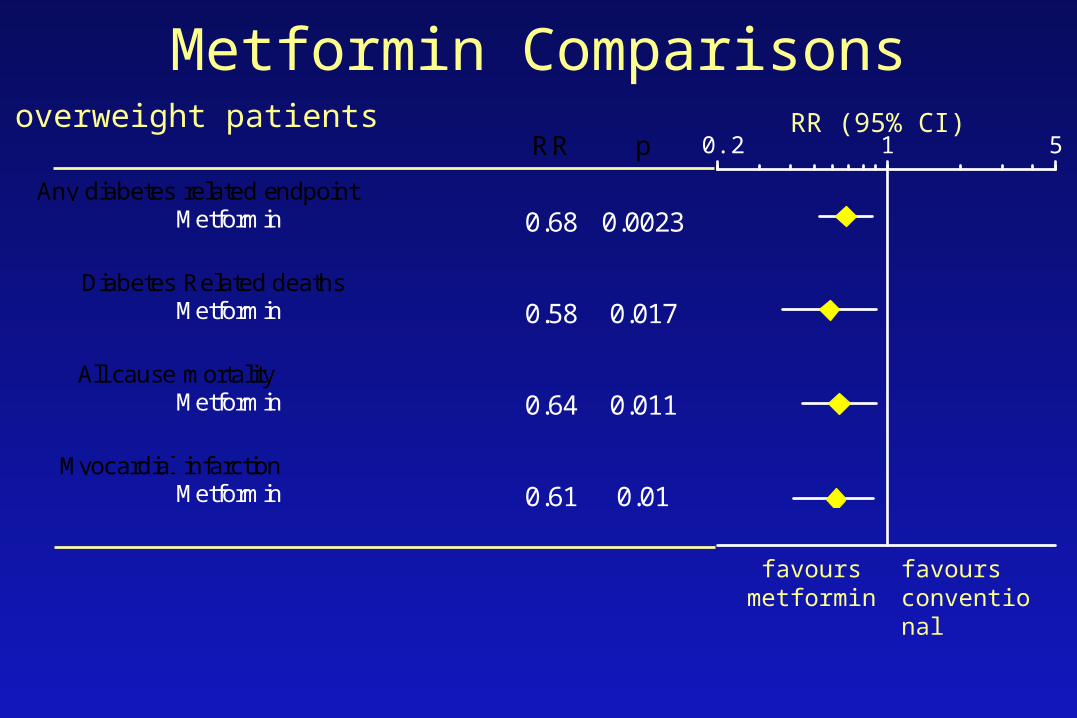
Metformin Comparisons
favours metformin
favours conventional
overweight patientsRR p
Any diabetes related endpointMetformin 0.68 0.0023
Diabetes Related deathsMetformin 0.58 0.017
All cause mortalityMetformin 0.64 0.011
Myocardial infarctionMetformin 0.61 0.01
RR (95% CI)
0.2 1 5

Metformin in Overweight Patients
• compared with conventional policy
32% risk reduction in diabetes-related endpoints p=0.002342% risk reduction in diabetes-related deaths p=0.01736% risk reduction in all cause mortality p=0.01139% risk reduction in myocardial infarction p=0.01
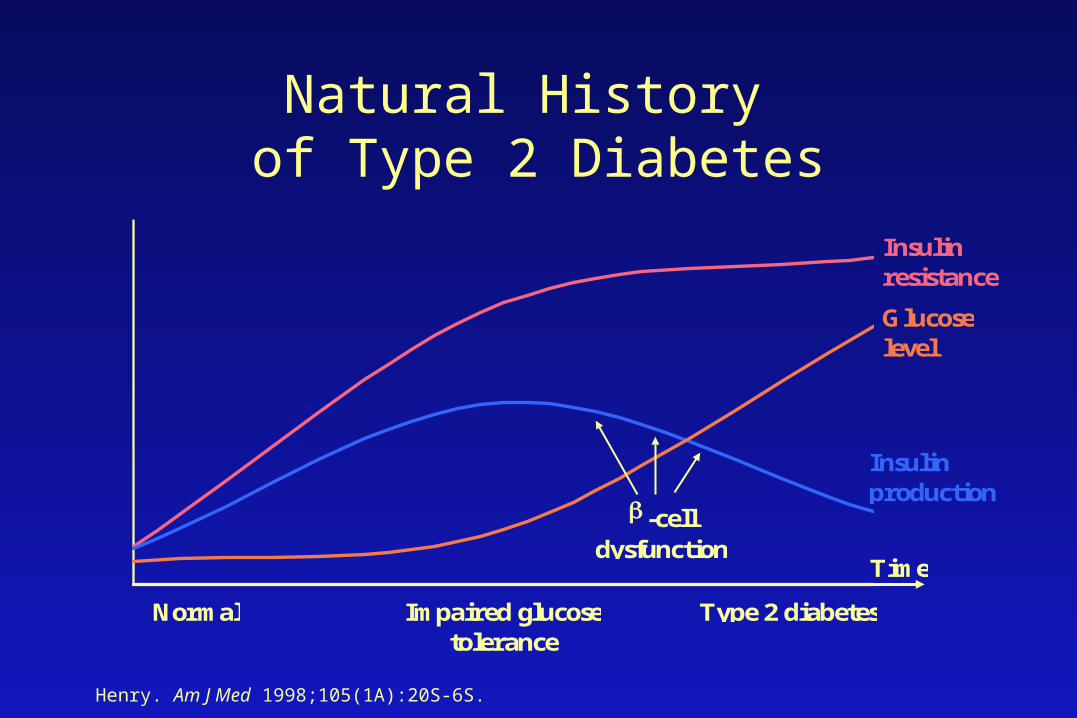
Natural History of Type 2 Diabetes
Normal Impaired glucosetolerance
Type 2 diabetes
Time
Insulinresistance
Insulinproduction
Glucoselevel
-celldysfunction
Henry. Am J Med 1998;105(1A):20S-6S.

Meltzer et al CMAJ 1998;159(Suppl):S1-29.
Oral Antihyperglycemic Agents: Biguanides (metformin)
• Decreases hepatic glucose production• Enhances peripheral glucose uptake• Increased insulin sensitivity in the periphery
• HbA1c: 7.1% vs. 8.6% (US Metformin Study) 7.4% vs. 8.0% (UKPDS)
• Not associated with hypoglycemia• May promote weight loss
MUSCLELIVER

Meltzer et al CMAJ 1998;159(Suppl):S1-29.
Oral Antihyperglycemic Agents: Biguanides (metformin)
• May cause GI side effects– Introduce slowly!
• Contraindicated in renal/hepatic insufficiency
• Lactic acidosis (0.03 cases/1000 patient years)
• Dose 250 – 500 mg BID/TID, to max of 2500 mg/d
MUSCLELIVER

Plosker, Faulds Drugs 1999;57:410-32. Balfour, Plosker Drugs 1999;57:921-30.
MUSCLE
ADIPOSE TISSUE
LIVER
Oral Antihyperglycemic Agents: Thiazolidinediones (TZDs)
• New class of oral agents
• Designed to increase insulin sensitivity
• Pioglitazone, rosiglitazone

Plosker, Faulds Drugs 1999;57:410-32. Balfour, Plosker Drugs 1999;57:921-30.
Oral Antihyperglycemic Agents: Thiazolidinediones (TZDs)
Mechanism:• Activate the peroxisome proliferator-activated receptor gamma
(PPARγ) nuclear receptor• Expressed in adipose tissue, large colon, hematopoietic cells• Involved in efficient energy storage and adipogenesis• Activation of the gene in adipose tissue leads to:
– Apoptosis of larger fully differentiated adipocytes (insulin resistant)– Differentiation of pre-adipocytes into small metabolically active
adipose cells
Plosker, Faulds Drugs 1999;57:410-32. Balfour, Plosker Drugs 1999;57:921-30.
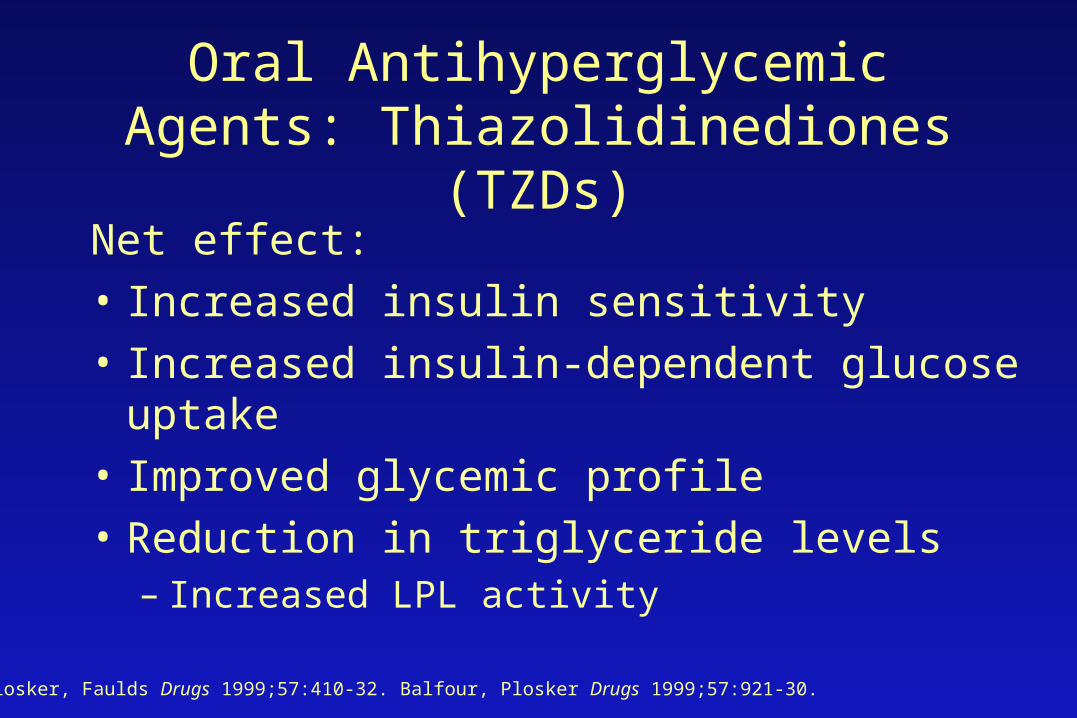
Oral Antihyperglycemic Agents: Thiazolidinediones (TZDs)
Net effect:
• Increased insulin sensitivity
• Increased insulin-dependent glucose uptake
• Improved glycemic profile
• Reduction in triglyceride levels – Increased LPL activity

Plosker, Faulds Drugs 1999;57:410-32. Balfour, Plosker Drugs 1999;57:921-30.
Oral Antihyperglycemic Agents: Thiazolidinediones (TZDs)
Effect on glycemic control when combined with other oral agents:
Pioglitazone:HbA1c: 0.8% - 1.3%
FBG: 2.1 – 3.2 mmol/L
Rosiglitazone: HbA1c: 1.0% – 1.2%
FBG: 2.4 – 2.9 mmol/L
Plosker, Faulds Drugs 1999;57:410-32. Balfour, Plosker Drugs 1999;57:921-30.
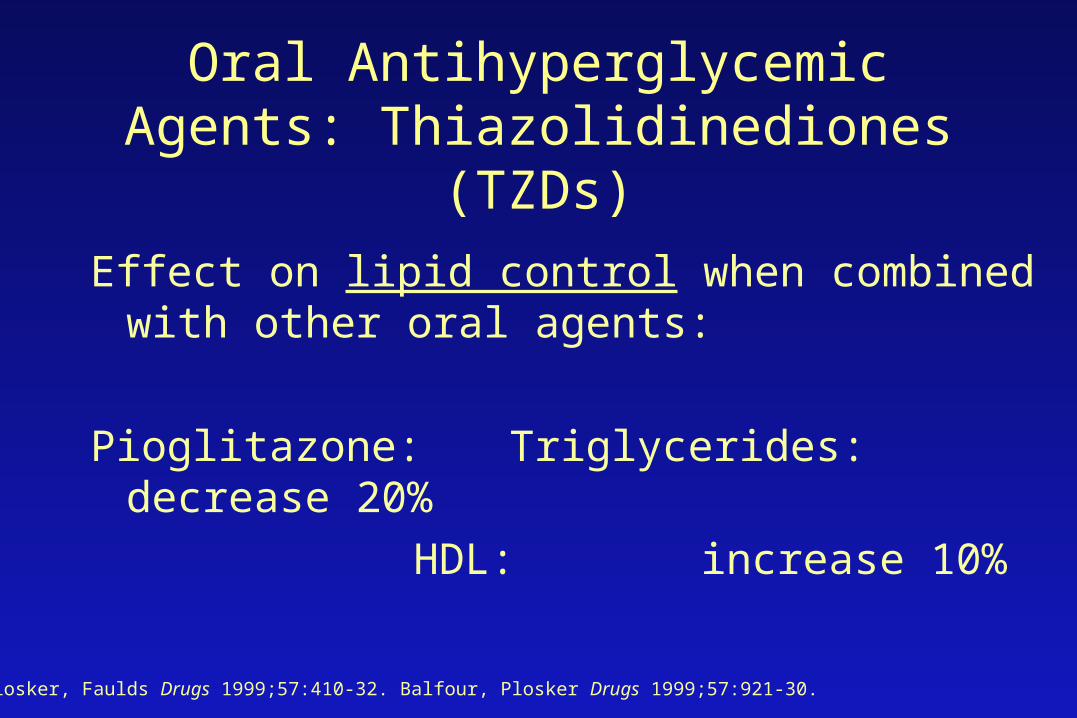
Oral Antihyperglycemic Agents: Thiazolidinediones (TZDs)
Effect on lipid control when combined with other oral agents:
Pioglitazone:Triglycerides: decrease 20%
HDL: increase 10%

Thiazolidinediones
Side effects:- Edema/fluid retention - 4%- Congestive heart failure- Weight gain – 4.5 kg- Ovulation – polycystic ovarian syndromeContraindications:- Elevated liver function tests (>2.5 x upper limit of normal)- Class 2,3,4 heart failure- EdemaMonitoring: Liver function tests every 2 months for 1 year
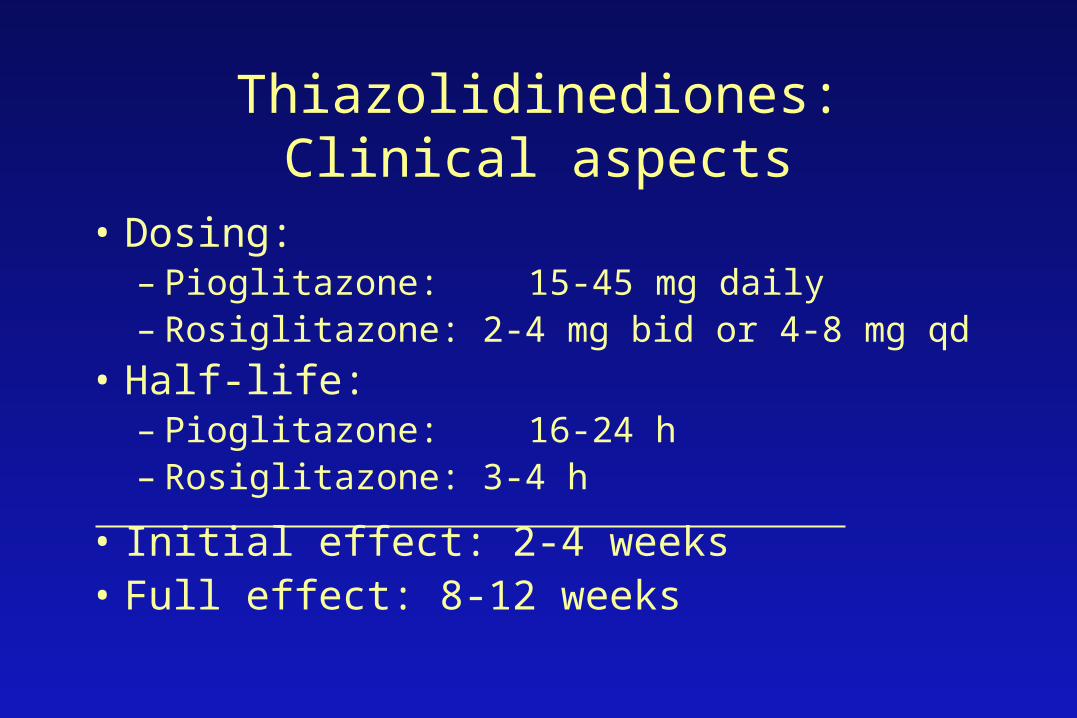
Thiazolidinediones:Clinical aspects
• Dosing:– Pioglitazone: 15-45 mg daily– Rosiglitazone: 2-4 mg bid or 4-8 mg qd
• Half-life:– Pioglitazone: 16-24 h– Rosiglitazone: 3-4 h
• Initial effect: 2-4 weeks • Full effect: 8-12 weeks

Sites of Action of Currently Available Therapeutic Options
GLUCOSE ABSORPTION
GLUCOSE PRODUCTIONBiguanides
Thiazolidinediones
MUSCLE
PERIPHERAL GLUCOSE UPTAKE
Thiazolidinediones(Biguanides)
PANCREAS
INSULIN SECRETIONSulfonylureasMeglitinides
ADIPOSE TISSUE
LIVER
Alpha-glucosidase inhibitors
INTESTINE
Sonnenberg, Kotchen Curr Opin Nephrol Hypertens 1998;7:551-5.
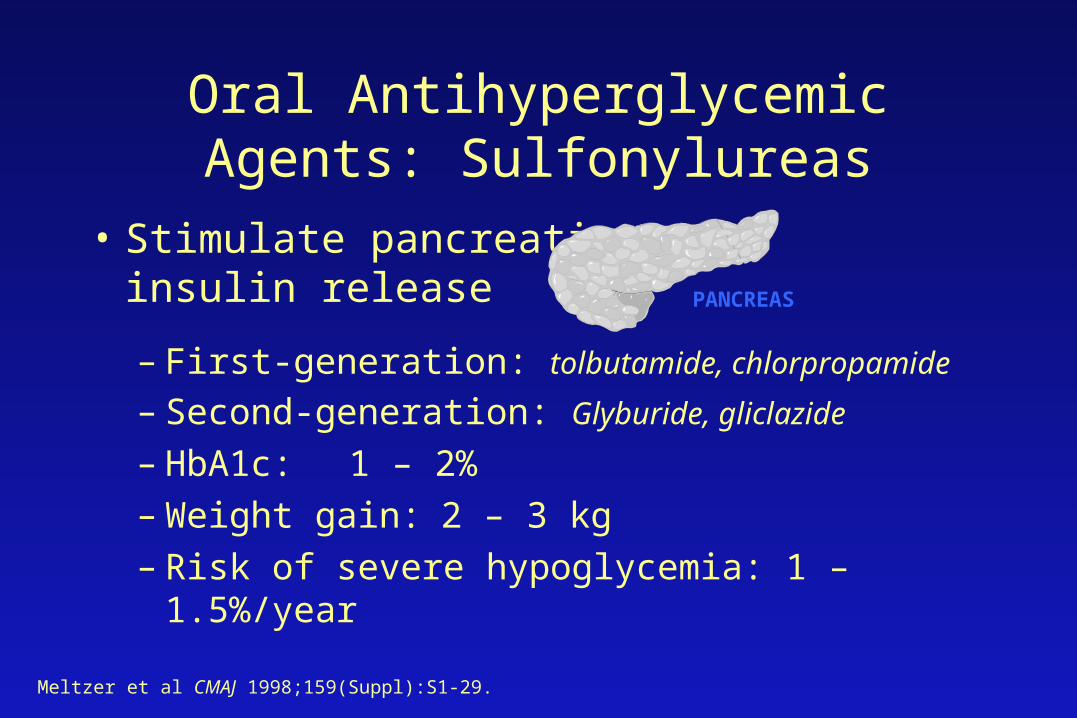
Oral Antihyperglycemic Agents: Sulfonylureas
• Stimulate pancreatic insulin release
– First-generation: tolbutamide, chlorpropamide
– Second-generation: Glyburide, gliclazide
– HbA1c: 1 – 2%– Weight gain: 2 – 3 kg– Risk of severe hypoglycemia: 1 – 1.5%/year
Meltzer et al CMAJ 1998;159(Suppl):S1-29.
PANCREAS

Oral Antihyperglycemic Agents: Meglitinides
• Stimulate pancreatic insulin release
– Repaglinide – Rapid onset and short duration of action– Lowers fasting and postprandial glucose levels– HbA1c: 1.5%– May cause hypoglycemia
Balfour, Faulds Drugs Aging 1998;13:173-80.
PANCREAS
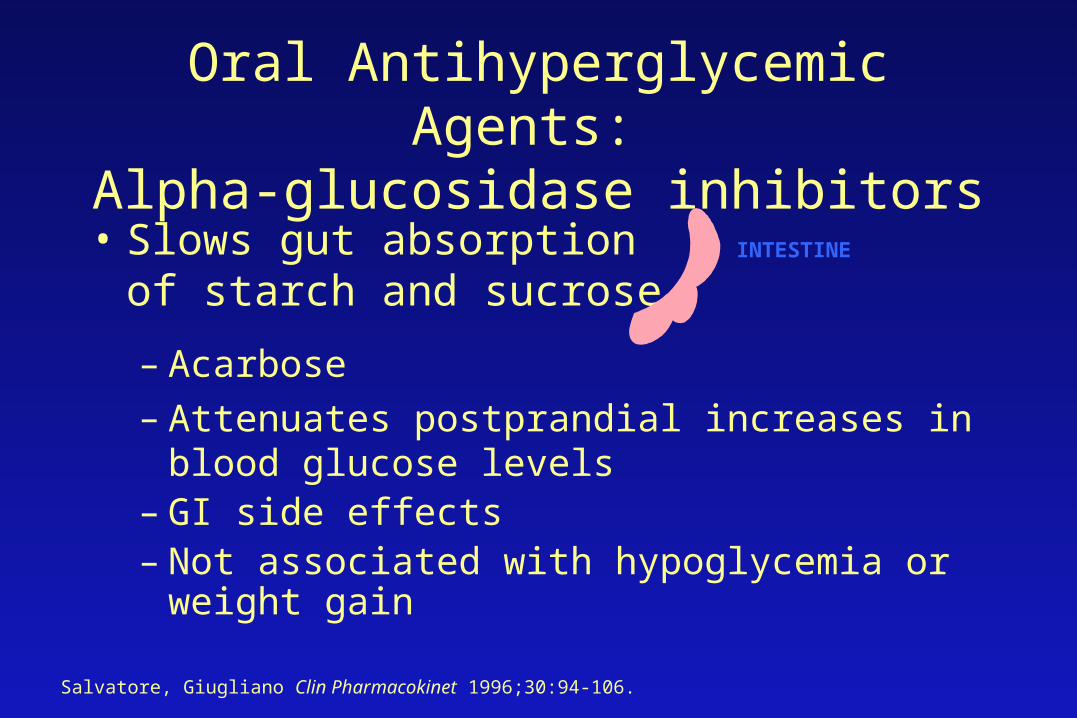
Oral Antihyperglycemic Agents: Alpha-glucosidase inhibitors
• Slows gut absorptionof starch and sucrose
– Acarbose
– Attenuates postprandial increases in blood glucose levels
– GI side effects– Not associated with hypoglycemia or weight gain
Salvatore, Giugliano Clin Pharmacokinet 1996;30:94-106.
INTESTINE

Stepwise approach to type 2 diabetes
Nonpharmacologic therapy
Oral agent monotherapy
Oral agent combination therapy
Bedtime insulin and oral agents
Insulin 2–4 times/day

Goals of insulin therapy
• Achieve optimal glycemic control
• Minimize adverse effects:– Weight gain– Hypoglycemia– Inconvenience

Insulin action
Onset Peak Duration
(min) (hrs) (hrs)
Regular 15-60 2-4 5 - 8
NPH 2.5-3.0 5-7 13-16
Regular – with meals
NPH - basal
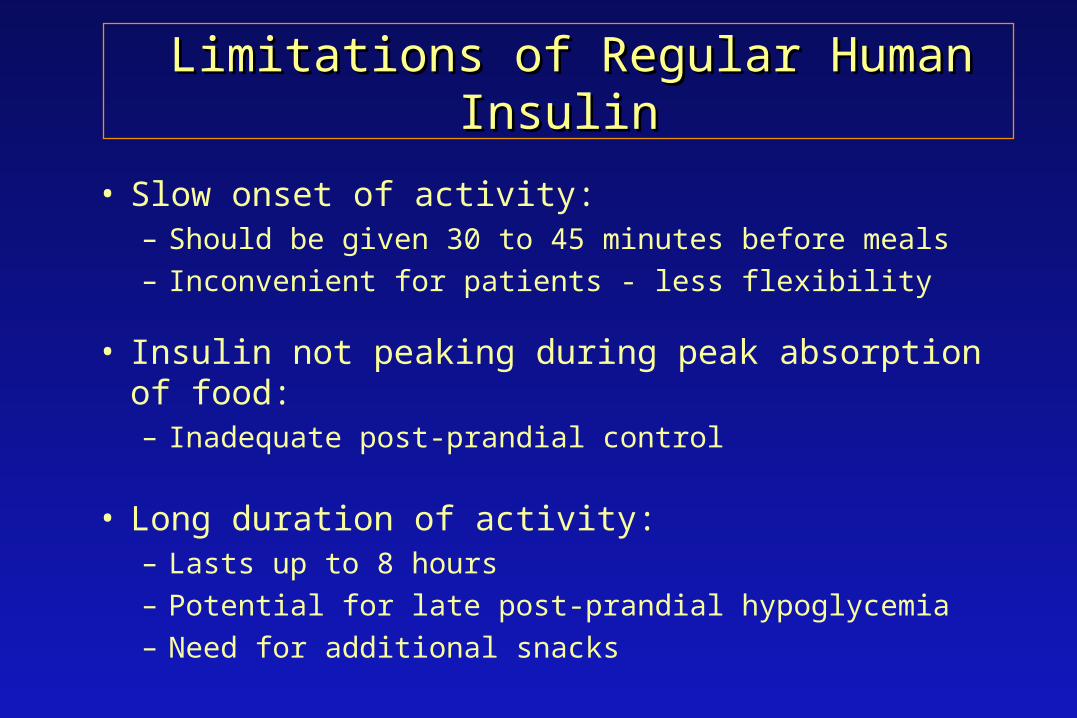
Limitations of Regular Human InsulinLimitations of Regular Human Insulin
• Slow onset of activity:– Should be given 30 to 45 minutes before meals
– Inconvenient for patients - less flexibility
• Insulin not peaking during peak absorption of food:– Inadequate post-prandial control
• Long duration of activity:– Lasts up to 8 hours
– Potential for late post-prandial hypoglycemia
– Need for additional snacks

Insulin action
Onset Peak Duration
(min) (hrs) (hrs)
Lispro 10-15 1-1.5 4-5
Regular 15-60 2-4 5 - 8
NPH 2.5-3.0 5-7 13-16
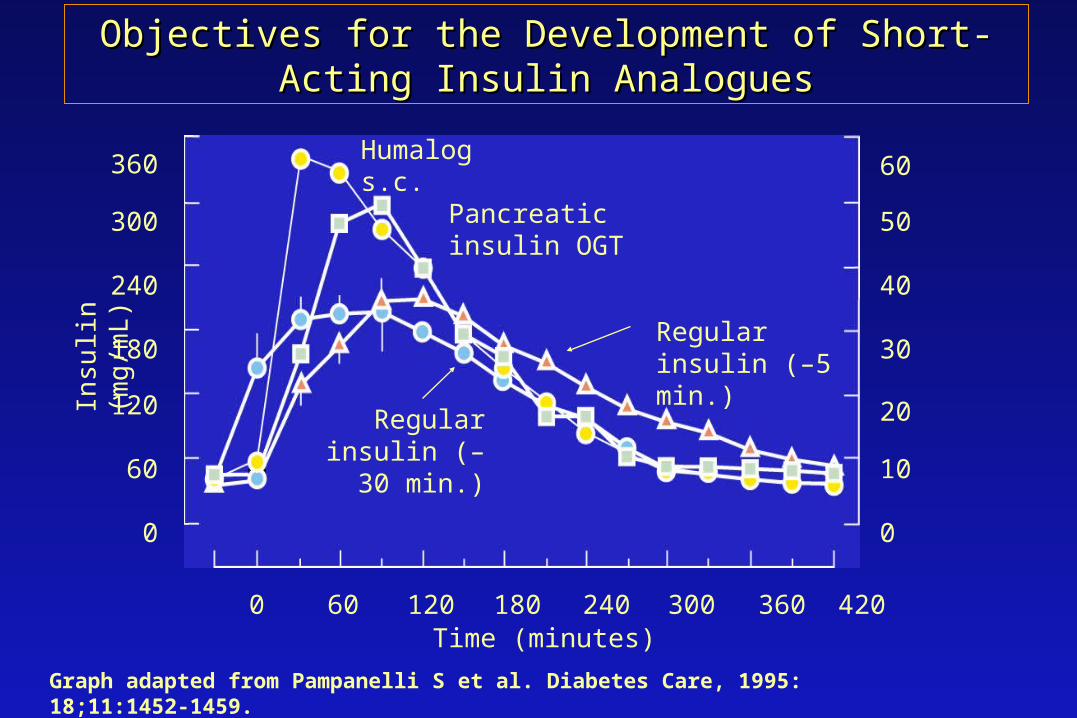
Objectives for the Development of Short-Acting Insulin Objectives for the Development of Short-Acting Insulin AnaloguesAnalogues
360
180
300
240
120
60
0
0 60 120 180 240 300 360 420
0
10
20
30
60
50
40
Humalog s.c.
Time (minutes)
Graph adapted from Pampanelli S et al. Diabetes Care, 1995: 18;11:1452-1459.
Insu
lin (
mg
/mL
)
Pancreatic insulin OGT
Regular insulin (–5 min.)
Regular insulin (–30 min.)
0
1
2
3
4
0 1 2 3 4 5 6
months
regular-lisprolispro-regular
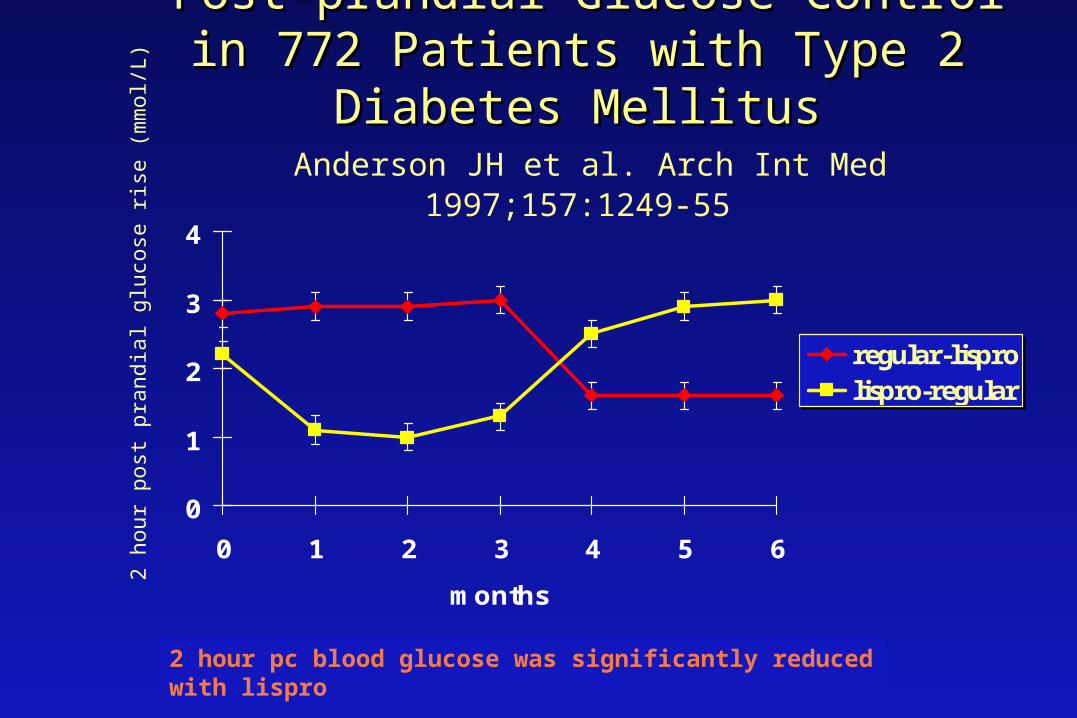
Post-prandial Glucose Control in 772 Patients Post-prandial Glucose Control in 772 Patients with Type 2 Diabetes Mellituswith Type 2 Diabetes Mellitus
Anderson JH et al. Arch Int Med 1997;157:1249-55
2 hour pc blood glucose was significantly reduced with lispro
2 ho
ur p
ost p
rand
ial g
luco
se r
ise
(mm
ol/L
)

Hypoglycemia in 772 PatientsHypoglycemia in 772 Patientswith Type 2 Diabetes Mellituswith Type 2 Diabetes Mellitus
Anderson JH et al. Arch Int Med 1997;157:1249-55
• hypoglycemia reduced by 7.3% with lispro insulin ( 3.43 to 3.18 episodes/30 days/pt, p<0.02)
• severe hypoglycemia was rare
• overnight hypoglycemia reduced by 36% with lispro insulin (0.73 to 0.47 episodes/30 days/pt, p<.001)

Lispro Insulin in Type 1 Diabetes
• Systematic review – 8 trials
• Lispro insulin vs. regular insulin
• 2576 patients with type 1 diabetes mellitus
• Follow-up: 4 – 12 months
• Severe hypoglycemia: 3.1% vs. 4.4%, p=0.024
Brunelle RL Diabetes Care 1998;21:1726-31.
LisproLispro
– Allows patients to inject at time of meal
– Significantly reduces post-prandial blood glucose levels
– Reduces the incidence of hypoglycemia
– Can improve the HbA1c
– Offers improved flexibility and convenience

Pre-mixed InsulinPre-mixed Insulin
– Convenient
– Less injections per day
– Adjustments in basal and meal time insulin more difficult
– Preparations:
• 30/70 – 30% regular insulin/70% NPH insulin
• Other ratios available
• Mix25 – 25% lispro/75% NPH insulin

Insulin regimens
Many different potential regimens!
– Oral + hs insulin (NPH)– Oral + AM insulin (NPH)– Pre-mixed insulin with breakfast and supper– Short-acting with meals + bedtime NPH
– Pre-mixed with breakfast, short acting at supper, and bedtime HPH

Insulin regimens
All equivalent glycemic control.
Weight gain less with bedtime insulin.
Less hypoglycemia and weight gain with metformin (vs. glyburide)
Regime will depend on patient preferences and ability to achieve glycemic goals!

CDA Guidelines for Glucose Control
Normal Optimal Suboptimal Inadequate
Glycated Hb (% of ULN) HbA1C assay
<100
(0.04-0.06)
<115
(<0.07)
116-140
(0.07-0.084)
>140
(>0.084)
Preprandial glucose (mmol/L)
3.8-6.1
4-7
7.1-10
>10
Postprandial glucose (mmol/L)
4.4-7
5-11
11.1-14
>14
Meltzer et al CMAJ 1998;159(Suppl):S1-29. Gerstein HC et al CDA’s UKPDS Position Statement.

Blood Pressure Control Study
UK Prospective Diabetes StudyUK Prospective Diabetes Study

Blood Pressure Control Study
- to determine whether a tight blood pressure control policy can reduce morbidity and mortality in Type 2 diabetic patients

Randomisation
on antihypertensive therapyn = 421
not on antihypertensive therapyn = 727
avoid ACE inhibitor : Beta blockern = 390
34%
less tight blood pressure controlaim : BP < 180/105 mmHg
ACE inhibitorn = 400
35%
Beta blockern = 358
31%
tight blood pressure controlaim : BP < 150 / 85 mmHg
randomisation
1148 hypertensive patients
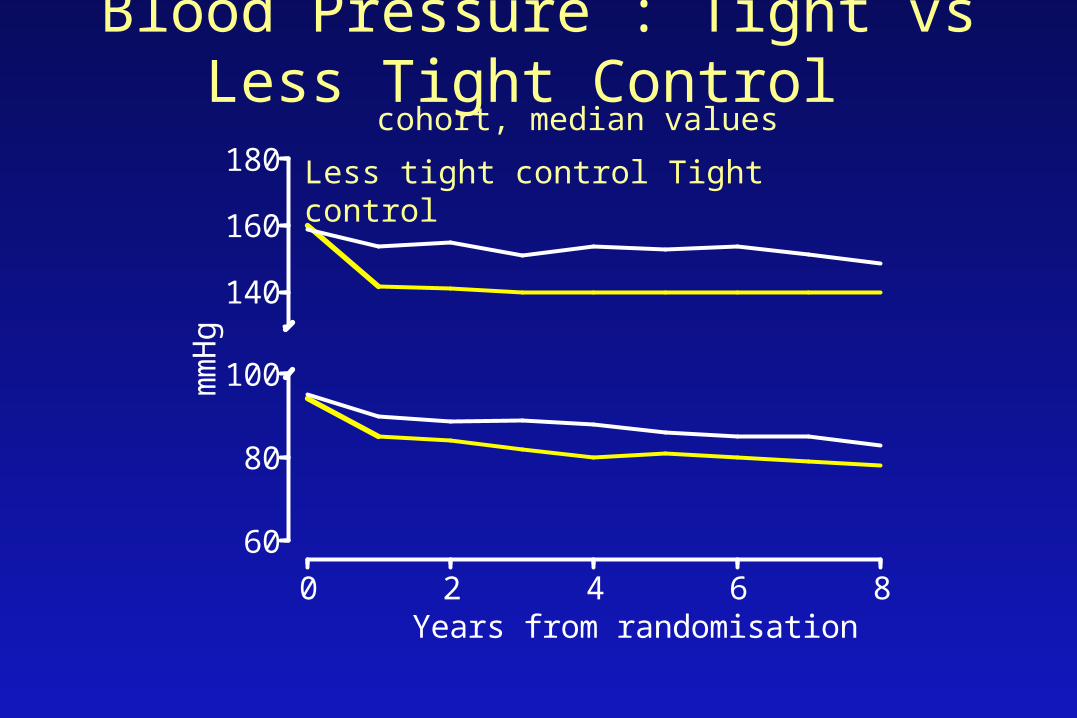
Blood Pressure : Tight vs Less Tight Control
60
80
100
140
160
180
0 2 4 6 8
mm
Hg
Years from randomisation
cohort, median values
Less tight control Tight control

mmHg baseline mean over 9 years
Less tight control 160 / 94 154 / 87
Tight control 161 / 94 144 / 82
difference 1 / 0 10 / 5
p n.s. <0.0001
ACE inhibitor 159 / 94 144 / 83
Beta blocker 159 / 93 143 / 81
difference 0 / 0 1 / 1
p n.s. n.s. / p=0.02
Mean Blood Pressure

Therapy requirement
1 2 3 4 5 6 7 80
20
40
60
80
100
% o
f pa
tient
s
LessTight Control Policy
1 2 3 4 5 6 7 8
Years from randomisation
None one two > two
Tight Control Policy
number of antihypertensive agents
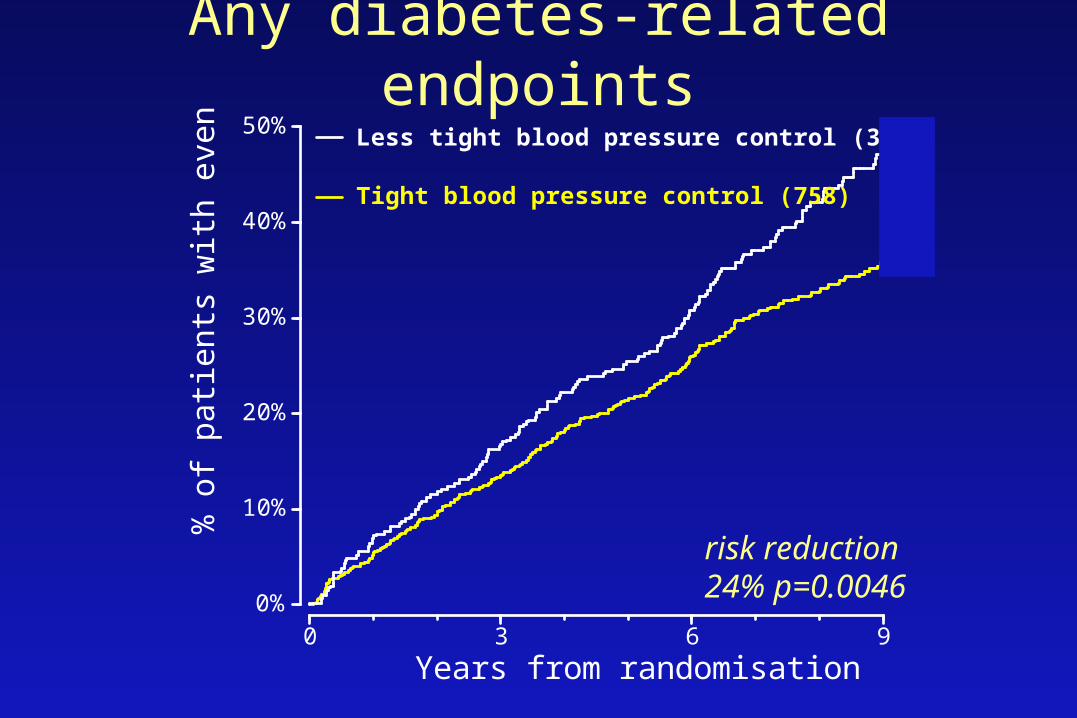
Any diabetes-related endpoints
0%
10%
20%
30%
40%
50%
0 3 6 9
% o
f pa
tient
s w
ith e
vent
s
Years from randomisation
Tight blood pressure control (758)
Less tight blood pressure control (390)
risk reduction24% p=0.0046

Diabetes-related deaths
0%
5%
10%
15%
20%
0 3 6 9
% o
f pa
tient
s w
ith e
vent
s
Years from randomisation
Tight blood pressure control (758)
Less tight blood pressure control (390)
risk reduction32% p=0.019

Myocardial Infarction
0%
5%
10%
15%
20%
25%
0 3 6 9
% o
f pa
tient
s w
ith e
vent
Years from randomisation
Tight Blood Pressure Control (758)
Less Tight Blood Pressure Control (390)
risk reduction21% p=0.13

Heart Failure
0%
5%
10%
15%
20%
25%
0 3 6 9
% p
atie
nts
with
eve
nt
Years from randomisation
Tight Blood Pressure Control (758)
Less Tight Blood Pressure Control (390)
risk reduction 56% p=0.0043
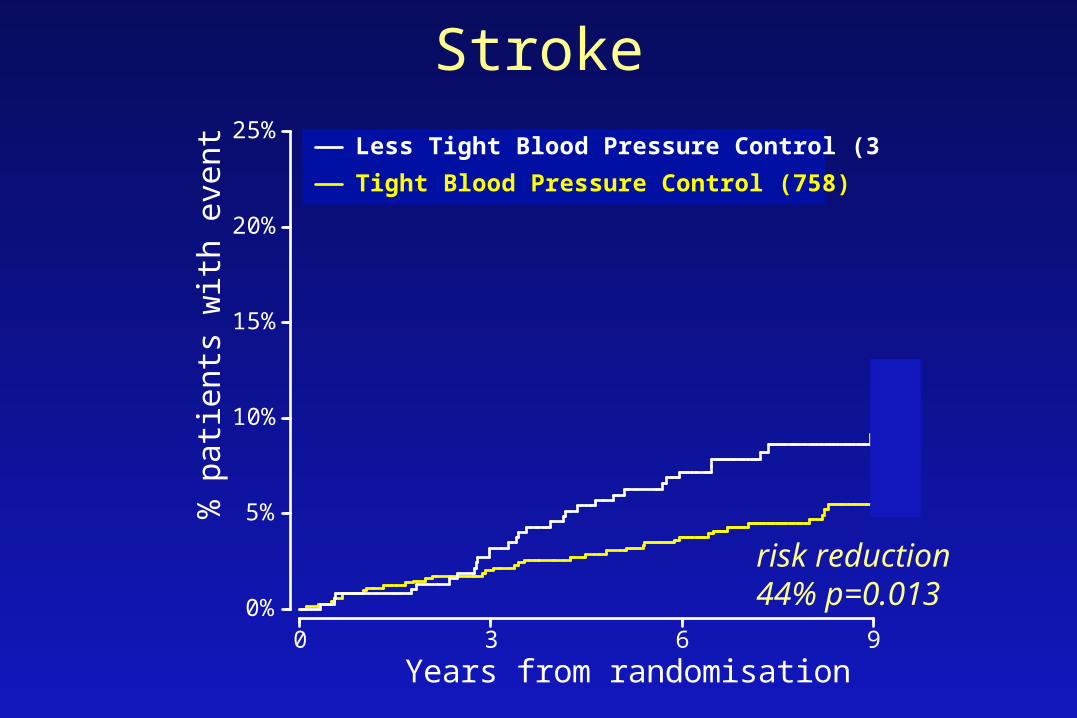
Stroke
0%
5%
10%
15%
20%
25%
0 3 6 9
% p
atie
nts
with
eve
nt
Years from randomisation
Tight Blood Pressure Control (758)
Less Tight Blood Pressure Control (390)
risk reduction44% p=0.013
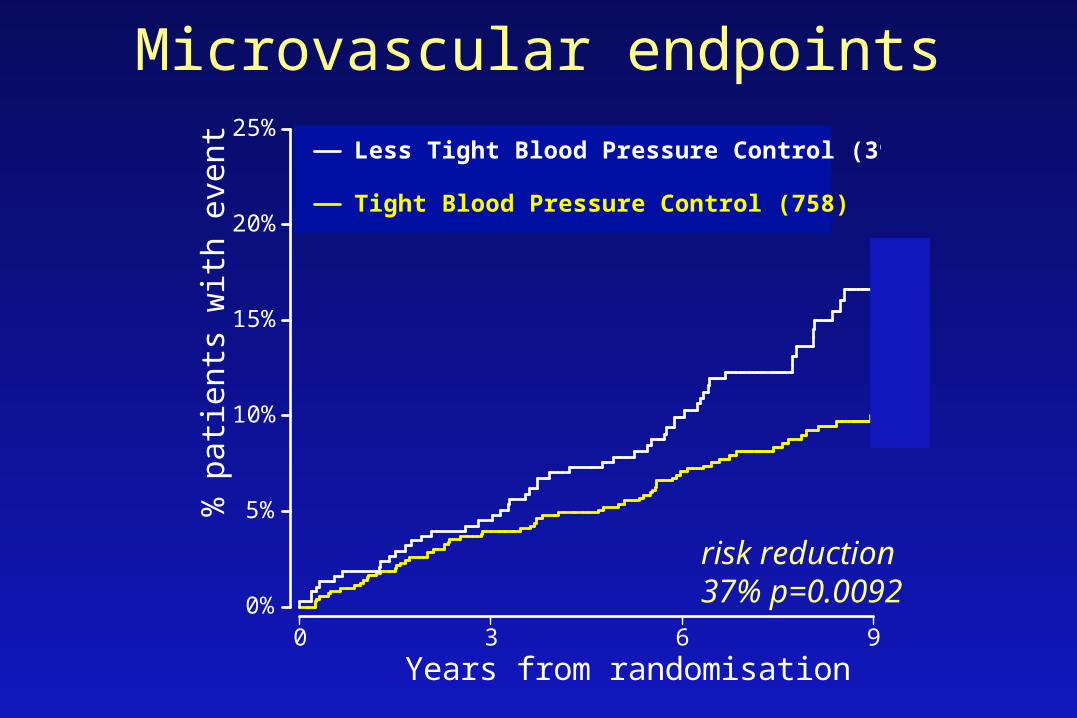
Microvascular endpoints
0%
5%
10%
15%
20%
25%
0 3 6 9
% p
atie
nts
with
eve
nt
Years from randomisation
Tight Blood Pressure Control (758)
Less Tight Blood Pressure Control (390)
risk reduction37% p=0.0092
Do ACE inhibitors or Do ACE inhibitors or Beta Blockers Beta Blockers
have any specific advantages have any specific advantages or disadvantages?or disadvantages?
UK Prospective Diabetes StudyUK Prospective Diabetes Study
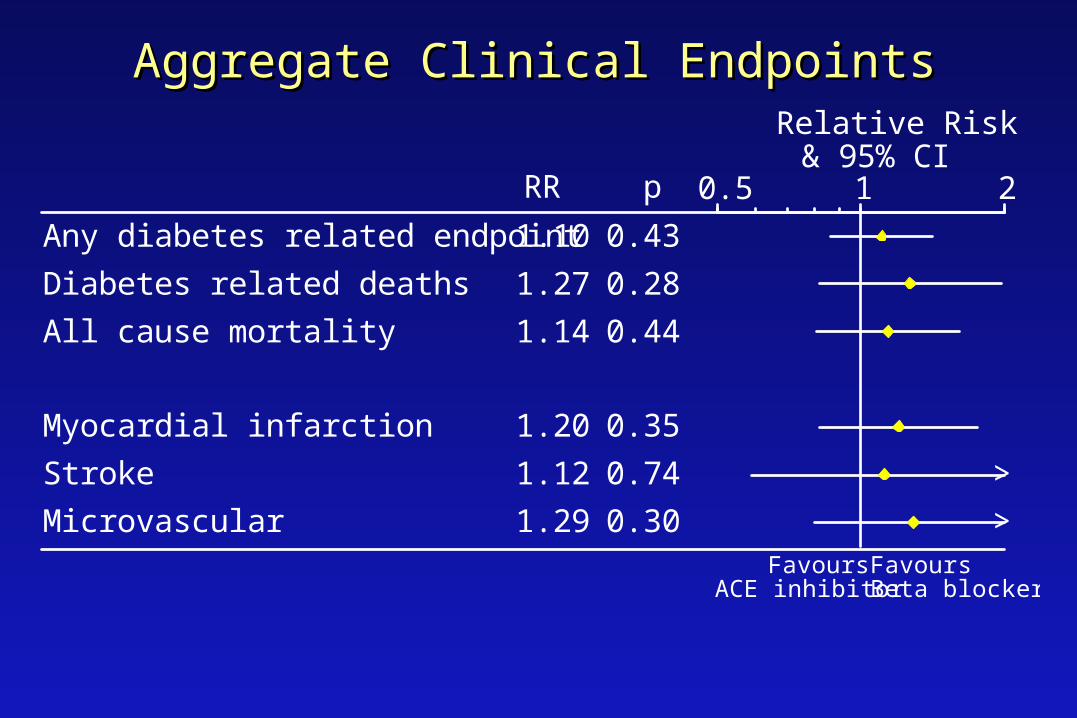
Aggregate Clinical EndpointsAggregate Clinical Endpoints
1.10
1.27
1.14
1.20
1.12
1.29
0.43
0.28
0.44
0.35
0.74
0.30
Any diabetes related endpoint
Diabetes related deaths
All cause mortality
Myocardial infarction
Stroke
Microvascular
RR p 0.5 1 2
Relative Risk& 95% CI
>
>
FavoursBeta blocker
FavoursACE inhibitor

Renal Disease in Diabetes
Blood pressure control
ACE - inhibition
Angiotensin receptor blockade

Diabetes:The Most Common Cause of ESRD
Primary Diagnosis for Patients Who Start Dialysis
Diabetes50.1%
Hypertension27%
Glomerulonephritis
13%
Other
10%
United States Renal Data System. Annual data report. 2000.
No. of patientsProjection95% CI
1984 1988 1992 1996 2000 2004 20080
100
200
300
400
500
600
700
r2=99.8%243,524
281,355520,240
No
. o
f d
ialy
sis
pat
ien
ts
(th
ou
san
ds)
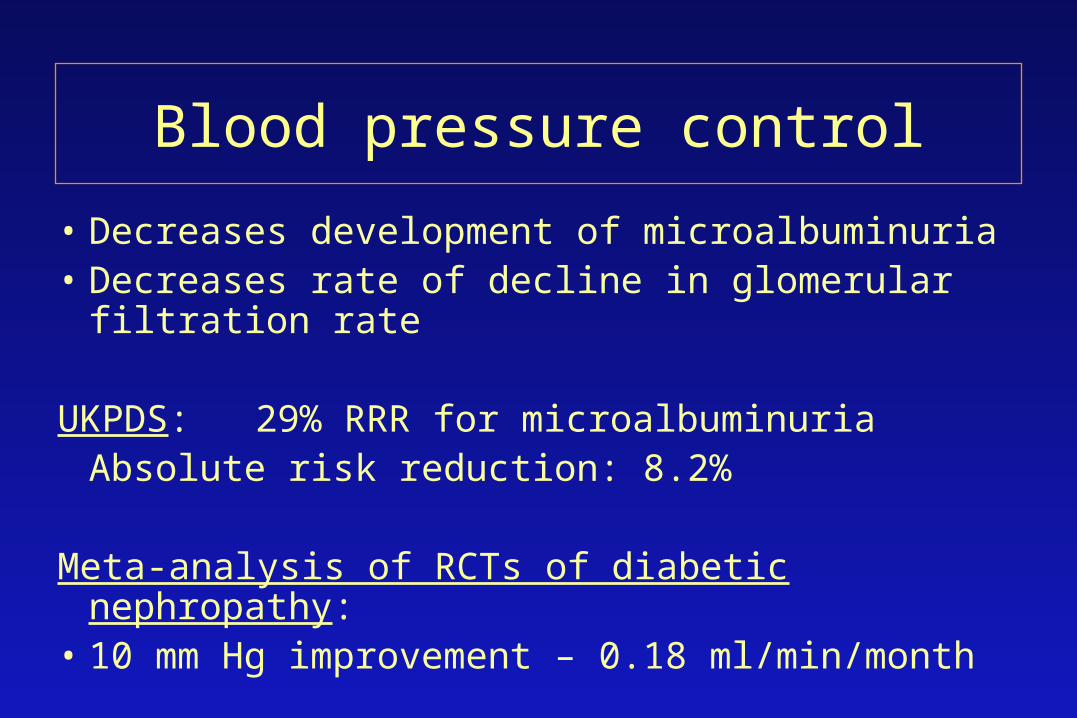
Blood pressure control
• Decreases development of microalbuminuria• Decreases rate of decline in glomerular filtration rate
UKPDS: 29% RRR for microalbuminuriaAbsolute risk reduction: 8.2%
Meta-analysis of RCTs of diabetic nephropathy:• 10 mm Hg improvement – 0.18 ml/min/month

ACE-inhibition
• Role in patients with Type 1 diabetes and nephropathy– Prevent death, dialysis, and transplantation
• Role in patients with microalbuminuria– Reduce rate of diabetic nephropathy
• Role in patients with Type 2 diabetes at high risk of cardiac complications– Reduce risk of MI, stroke, and cardiovascular death

Type 1 Diabetes and nephropathy
Lewis and colleagues, 1993
• 409 patients
• Captopril vs. placebo
• Follow-up 3.5 years
• Outcome: Death, dialysis, renal transplant
• Placebo arm: 21%
• Captopril arm: 11%

Microalbuminuria
• Systematic review of randomized controlled trials
• Follow-up: >1 year
• RR for proteinuria: 0.35 (0.24 – 0.53)
• ARR 16.3% NNT 6
• No demonstrated effect on renal function
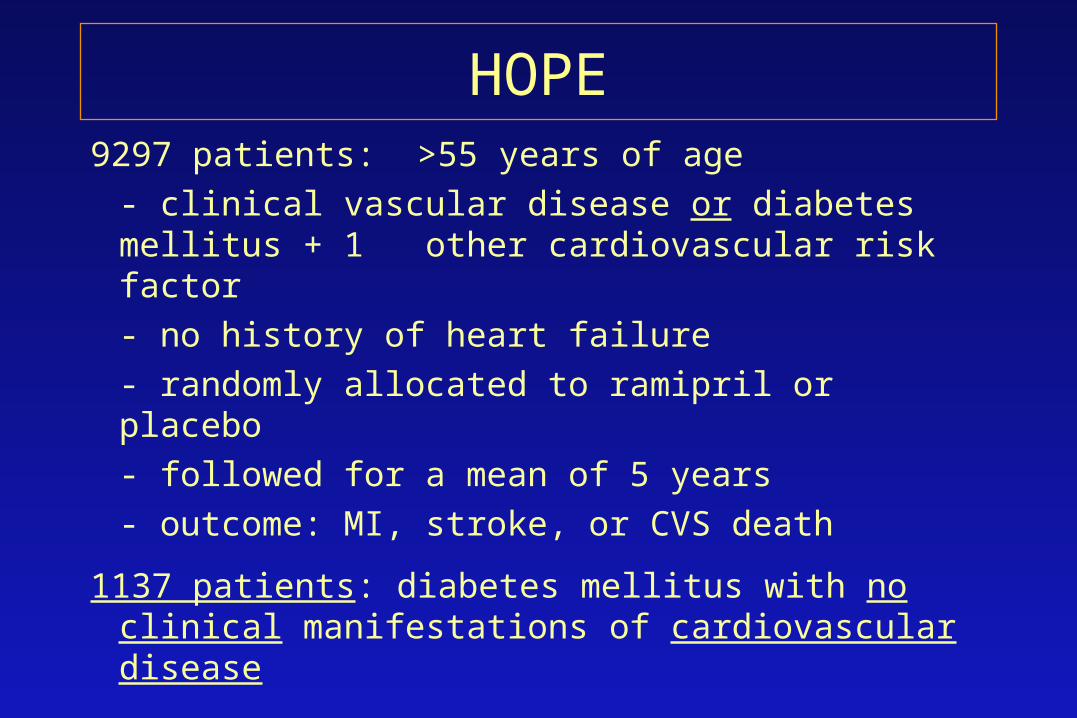
HOPE9297 patients: >55 years of age
- clinical vascular disease or diabetes mellitus + 1 other cardiovascular risk factor
- no history of heart failure
- randomly allocated to ramipril or placebo
- followed for a mean of 5 years
- outcome: MI, stroke, or CVS death
1137 patients: diabetes mellitus with no clinical manifestations of cardiovascular disease
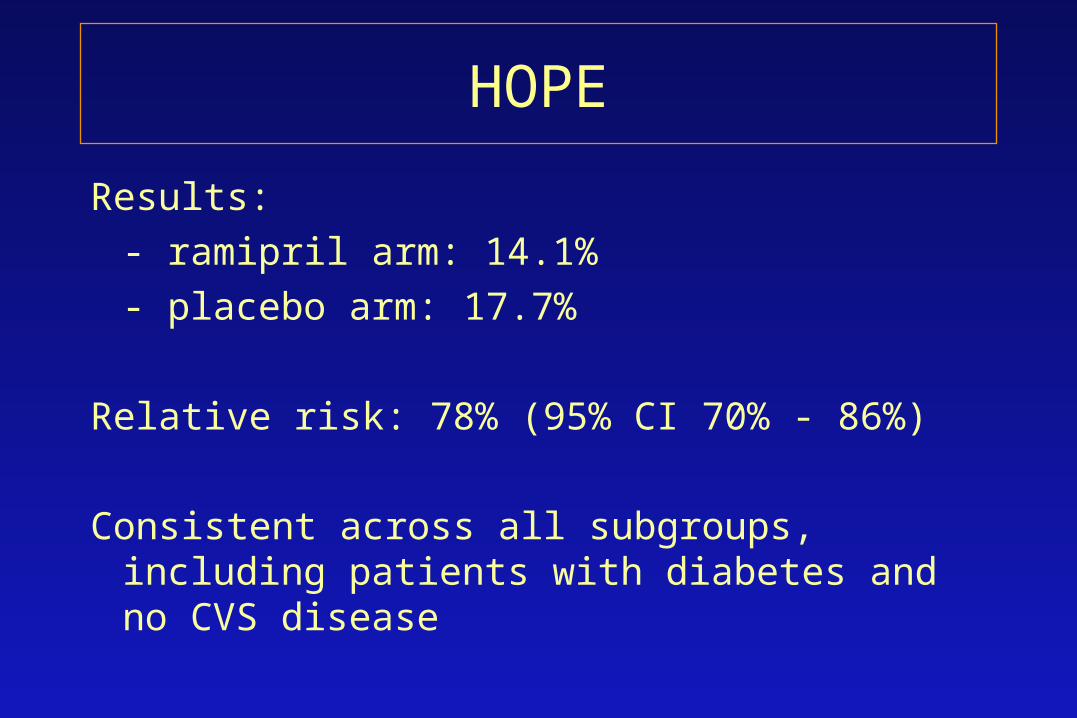
HOPE
Results:
- ramipril arm: 14.1%
- placebo arm: 17.7%
Relative risk: 78% (95% CI 70% - 86%)
Consistent across all subgroups, including patients with diabetes and no CVS disease


MICRO-HOPE: ACEI Reduces the Risk of MI, Stroke, and CV Death in Patients With Diabetes
HOPE Study Investigators. Lancet. 2000;335:253.
Combined MI Stroke CV death
15.3
10.2
4.26.2
19.8
12.9
6.1
9.7
0
5
10
15
20
25
30Ramipril
Placebo
25% RRP=0.0004
22% RRP=0.01
33% RRP=0.0074
37% RRP=0.0001
Pri
ma
ry e
ve
nts
Angiotensin Receptor Blockers
• 3 recent publications
• Effect of angiotensin receptor blockers in patients with Type 2 diabetes mellitus and nephropathy or microalbubinuria

IRMA 2: IRbesartan MicroAlbuminuria Type 2 Diabetes Mellitus in Hypertensive Patients
• Irbesartan (150 mg and 300 mg) vs. other antihypertensive medications
– (excl ACEIs, ARBs, dihydropyridine Ca++ ch. blockers)
• 590 patients
• Hypertension, type 2 diabetes, and microalbuminuria
• Follow-up: 2 years

IRMA 2: Results
• Nephropathy rate:– 5.2% among patients treated with 300 mg irbesartan/day
– 9.7% among patients treated with 150 mg irbesartan/day
– 14.9% among those treated with conventional therapy (P=0.0004)
• Reduction in microalbuminuria to normal levels (33% vs 20%; P=0.006)
• BP control similar across study arms

IDNT: Irbesartan Type 2 Diabetic Nephropathy Trial
Patients: 1715 patients with NIDDM, HT, proteinuria (≥900 mg/24 h), serum creatinine 88 – 265 µmol/l
Treatment regimen: Irbesartan 300mg, amlodipine 10mg, or placebo (± conventional therapy); target BP 135/85
1 End points: Combined incidence of doubling of sCr, ESRD, and death
2 End points: cardiovascular events
Follow-up: 2.6 years

IDNT: Results• Incidence of the composite endpoint (CrX2, ESRD, death):
– Irbesartan: 32.6%– Amlodipine: 41.1%– Placebo: 39.0%
• Effects of irbesartan independent of effects on BP• No effect on mortality or cardiovascular outcomes
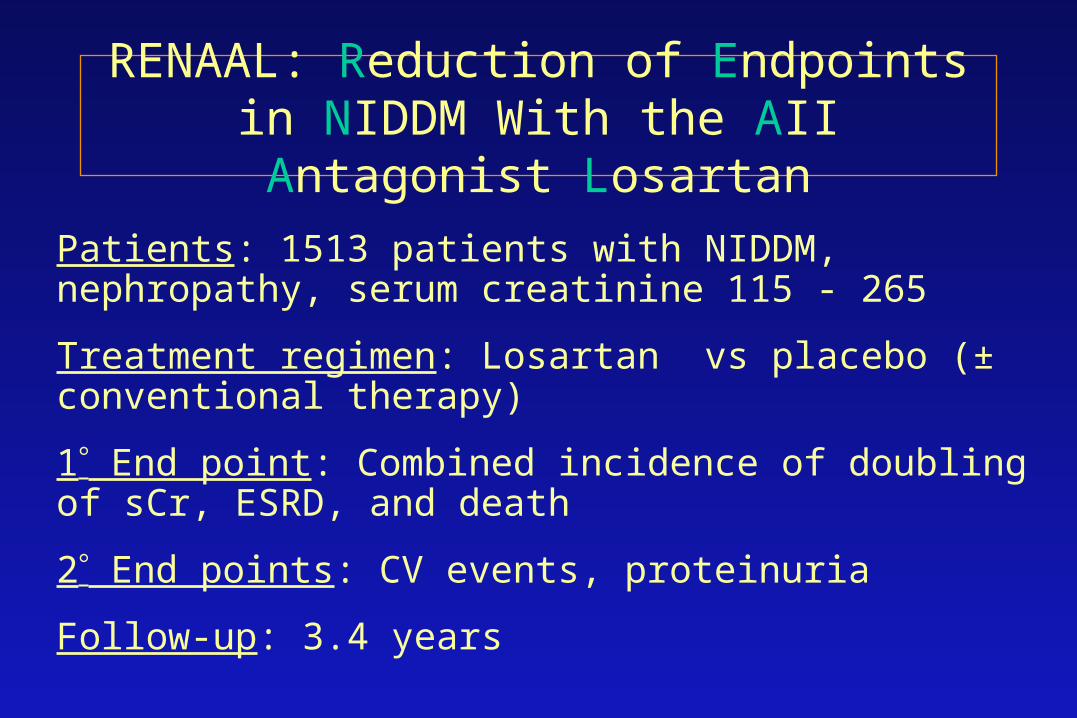
Patients: 1513 patients with NIDDM, nephropathy, serum creatinine 115 - 265
Treatment regimen: Losartan vs placebo (± conventional therapy)
1 End point: Combined incidence of doubling of sCr, ESRD, and death
2 End points: CV events, proteinuria
Follow-up: 3.4 years
RENAAL: Reduction of Endpoints in NIDDM With the AII Antagonist Losartan

RENAAL: Results• Incidence of the composite endpoint (CrX2, ESRD, death):
– Losartan: 43.5%– Placebo: 47.1%,– RRR 16%, p=0.02
• Effects of losartan independent of effects on BP• No effect on mortality or cardiovascular outcomes
Diabetes Clinical Cases
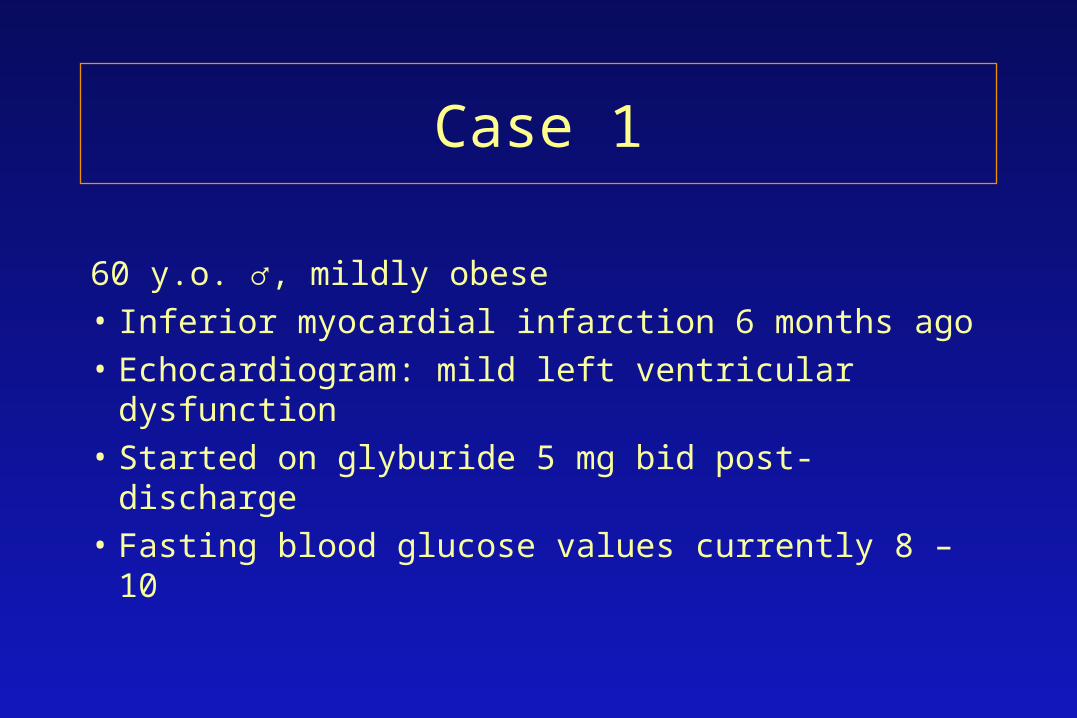
Case 1
60 y.o. ♂, mildly obese
• Inferior myocardial infarction 6 months ago
• Echocardiogram: mild left ventricular dysfunction
• Started on glyburide 5 mg bid post-discharge
• Fasting blood glucose values currently 8 – 10
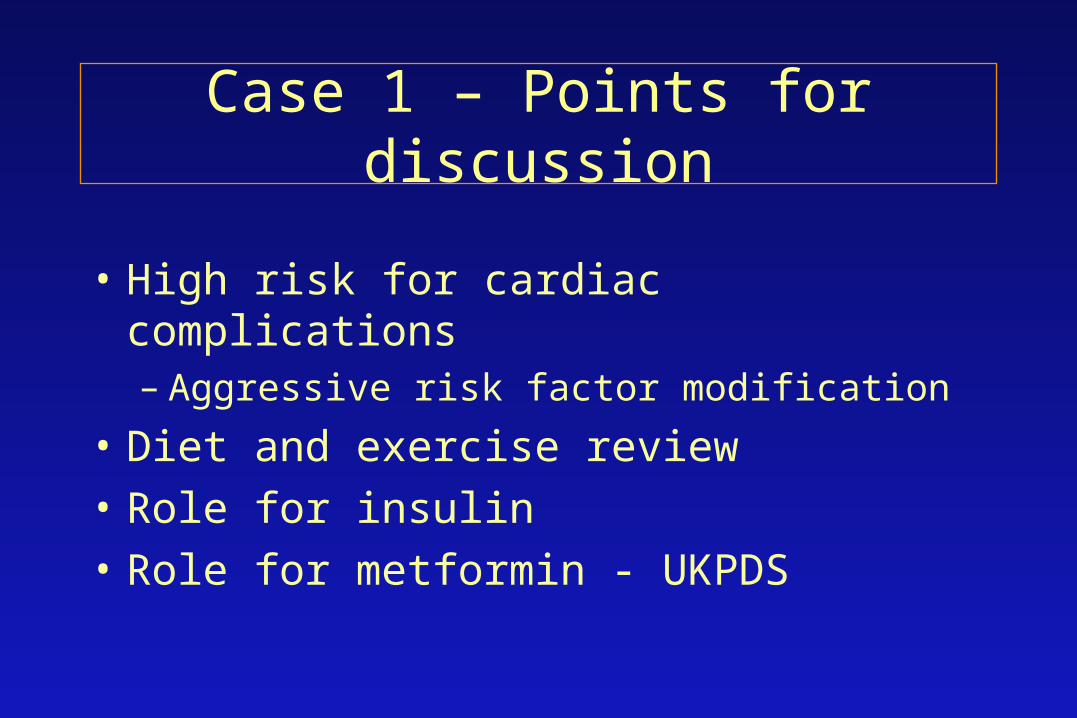
Case 1 – Points for discussion
• High risk for cardiac complications– Aggressive risk factor modification
• Diet and exercise review
• Role for insulin
• Role for metformin - UKPDS

Case 2
50 y.o. ♀; Type 2 DM for 6 years; uses 30/70 bid
• Poor glycemic control despite increasing doses
• Persistently elevated fasting blood glucose values
• Progressive weight gain
• Lab: LDL 3.2
↑microalb/creat. ratio
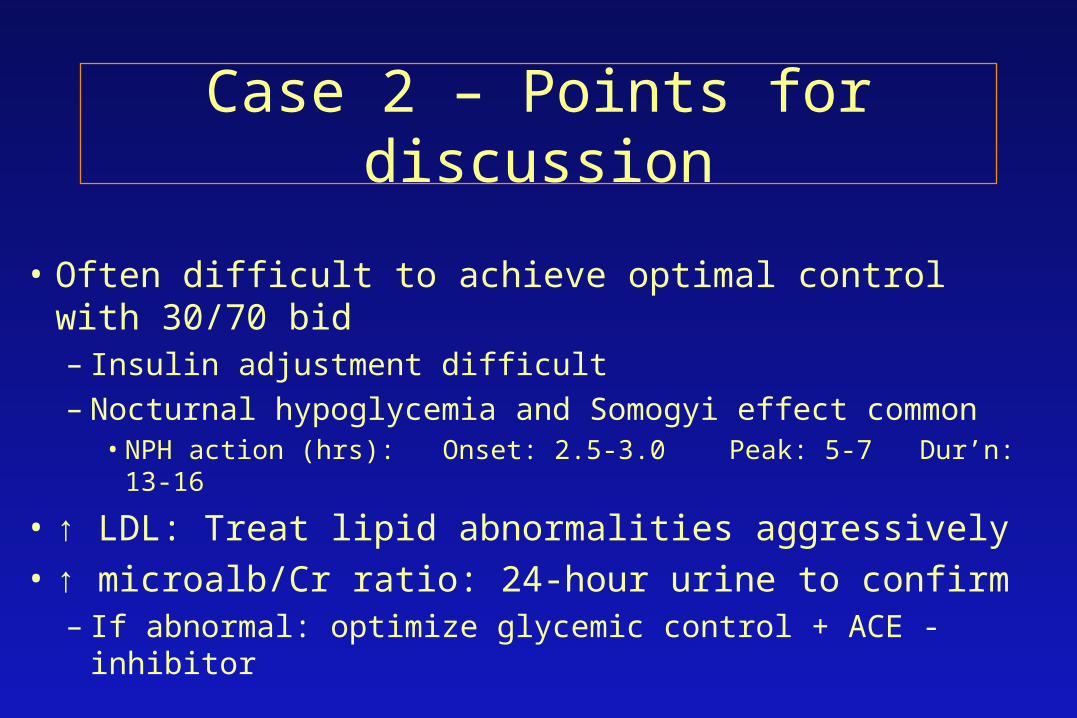
Case 2 – Points for discussion
• Often difficult to achieve optimal control with 30/70 bid– Insulin adjustment difficult– Nocturnal hypoglycemia and Somogyi effect common
• NPH action (hrs): Onset: 2.5-3.0 Peak: 5-7 Dur’n: 13-16
• ↑ LDL: Treat lipid abnormalities aggressively
• ↑ microalb/Cr ratio: 24-hour urine to confirm – If abnormal: optimize glycemic control + ACE - inhibitor

Case 3
40 y.o. ♀; Type 1 diabetes for 15 years
• Regular with meals (fixed doses) and NPH qhs
• Sub-optimal glycemic control; HbA1c 8.5%
• Frequent hypoglycemia
• BP 150/80
• Urine: 1+ proteinuria

Case 3 – Points for discussion
• Lyspro insulin– Less post-prandial hyperglycemia– Less hypoglycemia
• Adjust insulin doses according to CHO content
• Probable nephropathy:– 24-hour urine; ACE-inhibition; aggressive BP control

Case 4
65 y.o. ♂; Type 2 diabetes for 7 years
• Glyburide 10 mg bid; metformin 1000 mg bid
• Fasting blood glucose values: 10 – 12
• Lipid profile: ↑ TG, ↓ HDL, normal LDL

Case 4 – Points for discussion
• Diet and exercise review
• Consider insulin sensitizer– e.g. pioglitazone, rosiglitazone

Case 5
75 y.o. ♀; Type 2 diabetes for 12 years
• Main complaint: pain in feet at night
• Physical examination: callus formation, ↓ monofilament sensation

Case 5 – Points for discussion
• Neuropathic pain:– Tricyclic antidepressant– Gabapentin– Capsaicin
• Foot care:– Education – inspection, walking barefoot– Footwear– Nail care