issues developed in background investigations … · 7b address(gty, slate, and sipcode) 6a name of...
TRANSCRIPT

WY
lL POSIGKAQIJAIE SCHOOt rtRCY, CAlJfORNIA S3S40
PERS-TR-90-004
ISSUES DEVELOPED IN BACKGROUND INVESTIGATIONS CONDUCTED BY DEFENSE INVESTIGATIVE SERVICE
ADA Ml ^3 7
Peter A. W. Lewis Naval Postgraduate School
Edward R. Koucheravy United States Military Academy
Ralph M. Carney Defense Personnel Security Research
and Education Center
December 1989
Approved for Public Distribution: Distribution Unlimited
DEFENSE PERSONNEL SECURITY
RESEARCH AND EDUCATION CENTER 99 Pacific Street, Building 455-E Monterey, California 93940-2481

SECURITY CLASSIFICATION OF THIS PAGE
REPORT DOCUMENTATION PAGE Form Approved OMUNo 0704 0188
la REPORT SECURITY CLASSIFICATION
UNCLASSIFIED lb RESTRICTIVE MARKINGS
2a SECURITY CLASSIFICATION AUTHORITY 3 DISTRIBUTION/AVAILABILITY OF REPORT
2b DECLASSIFICATION/DOWNGRADING SCHEDULE
1 PERFORMING ORGANISATION REPORT NUMBER(S)
PERS-TR-90-004
5 MONITORING ORGANIZATION REPORT NUMBER(S)
6d NAME OF PERFORMING ORGANIZATION
Defense Personnel Security Research & Education Center
6b OFFICE SYMBOL (If applicable)
7a NAME OF MONITORING ORGANIZATION
6c ADDRESS (City. State, and ZIP Code)
99 Pacific Street, Building 455-E Monterey, California 93940
7b ADDRESS(Gty, Slate, and SIPCode)
6a NAME OF FUNDING /SPONSORING
ORGANIZATION Defense Personnel Security Research & Educ Ctr
8b OFFICE SYMBOL (/( applicable)
9 PROCUREMENT INSTRUMENT IDENTIFICATION NUMBER
8c ADDRESS (City. State, and IIP Code)
99 Pacific Street, Building 455-E Monterey, California 93940
10 SOURCE OF FUNDING NUMBERS
PROGRAM ELEMENT NO
PROJECT NO
TASK NO
WORK UNIT ACCESSION NO
11 TITLE (Include Security Classification)
Issues Developed in Background Investigations Conducted by Defense Investigative Service
12 PERSONAL AUTHOR(S)
Lewis, Peter S.W.; Koucheravy, Edward R.; Carney, Ralph M, I 3d TYPE OF REPORT 13b TIME COVERED
FROM TO
4 DATF OF REPORT {Year. Month, Day)
1989 December S PAGE COUNT
16 SUPPIEMENTARY NOTATION
17 COSA1I CODES
FIEID GROUP SUB GROUP
18 SUBJECT TERMS (Continue on teverse il necessary and identify by block number)
Background Investigations; Residual Analysis; Graphical Analysis
19 AIISTRAC I (Continue on reverse if necessary and identify by block number)
This report examines the type and frequency of derogatory issues contained in 881 Background Investigations (BI) and 812 Special Background Investigations (SBI) conductec by the Defense Investigative Service (DIS) in 1987 and 1988. Contingency table and graphical analytic techniques were used to compare the two investigative methods on the type and frequency of issues developed by the investigations. Analyses indicate there is little difference between the BI and the SBI in terms of type and amount of infor- mation obtained.
ZO DISTRIBUTION/AVAILABILITY OF ABSTRACT
GD UNCLASSIFIED/UNLIMITED • SAME AS RPI • DTIC USERS
21 ABSTRACT SECURITY Cl ASSIFK ATION
22a NAME Ol RFSPONSIBIL INDIVIDUAI
ROGER P. DENK, Director 22h TEIEPHONI (Include- Aiea Code)
(408) 646-2448 22( OF HO SYMHOI
DD Form 1473. JUN 86 Previous editions are obsolete
S/N 0102-1.!•'-() I 4-f)ftCn SI. CURH Y (I ASSII IC A I ION (II I HIS I'Adf

Preface
It has long been recognized that analyses of the issues contained in Defense Investigative Service (DIS) background investigations has needed better information than that provided by the Defense Central Index of Investigation (DCII). Simply knowing that an issue is present in a case provides no information about the type of issue, the presence of multiple issues, or the prevalence of certain combinations of issues. Since the beginning of PERSEREC we have made inroads into this informa- tion gap by developing a data base of the issues found by DIS background inves- tigation. The following report is the first report which makes use of the data source.
This report focuses on the issues found in the Background Investigation (Bl) and the Special Background Investigation (SBI). Comparing these investigations is a high priority research topic because Bl is considered an effective and expedient alternative to the SBI. Based on the analysis, there appears to be very little dif- ference between the two procedures.
Aside from the research questions, security professionals should find interesting the types of issues contained in DIS investigations. The graphs in this report show clearly and concisely the single and multiple issues that appear most often in the backgrounds of defense employees. It is useful information.
Roger P. Denk Director
PERS-TR-90-004 December 1989
Issues Developed in Background Investigations Conducted by the Defense Investigative Service
Peter A. W. Lewis i Edward R. Koucheravy
Ralph M. Carney
Summary
Background and Problem
The type and frequency of derogatory information contained in Defense Investigative Service (DIS) background investigations has not been well documented. It has been possible to determine that at least one issue was present but the type of issue and the presence of multiple issues has been hard to determine. In coopera- tion with the Personnel Investigation Center (PIC), a data base has been developed that contains information about the issues uncovered during background investiga- tions. This data have been used in the present report to examine the issues obtained in two types of background investigations conducted by DIS: the Background Investigation (Bl) and the Special Background Investigation (SBI).
Approach
Using data supplied by PIC, an analysis was performed on the issues con- tained in 881 Bis and 812 SBIs conducted by DIS.
Two types of analyses were performed. Where data allowed, statistical tests of contingency tables were conducted. In instances where data were not amenable to statistical manipulation, graphical analysis was performed on the patterns of issue combinations generated by the two investigative methods.

Results
Demographics
The analyses show that the SBI population has proportionally more women and more DoD civilians than the Bl population. There are no age differences between the two groupings.
Investigations
Number of Issues per Investigation. Analysis of the number of issues per investigation shows no difference in the frequency of issues generated by the Bl and SBI. There are more issues per investigation for the Bl population than the SBI, but no difference in the proportion of multiple issues.
Distribution of Issues. A graphical depiction of the distribution of issues in the Bl and SBI populations shows there is only slight variation in the pattern of issues developed by the different investigations. In both the Bl and SBI, the three most prevalent issues are the single-issue categories of finances, drugs, and mental- emotional. The next most common issues vary slightly between the Bl and SBI but have similar patterns of single- and multiple-issue combinations: crime, drug-crime, alcohol, alcohol-drug, alcohol-drug-crime, and alcohol-crime. Overall, there is virtually no difference in the kinds of issues generated by the Bl or the SBI.
Conclusions
The analyses indicate there is little difference between the Bl and SBI in terms of the type and amount of information obtained. The quality of material generated by the procedures still needs to be evaluated.
in

Table of Contents
Preface i
Summary ii
List of Tables v
List of Figures vi
Introduction 1 Problem 1 Disclaimer 3 Assumptions 3
Exploratory Data Analysis 5 Comparisons of the Populations by Demographic Factors 5
Gender 5 Age 6 Employment Status 10
Analysis of Issues 11 Number of Issues 11 General Pattern of Issues 13 Single-issue frequency patterns 19 Triple-issue frequency patterns 21 Quadruple-issue frequency patterns 22
Summary and Conclusions 25 Demographic Information 25 Issue Analysis 25 Conclusion 25
References 27
IV

List of Figures
1. The Relative Frequency of Gender in the Bl and SBI Sample 7
2. The Relative Frequency of Each Age Code in the Bl Sample 9
3. The Relative Frequency of Each Age Code in the SBI Sample 9
4. The Relative Frequency of Each Employment Status in the Bl and SBI Sample 11
5. The Relative Frequency of the Number of Issues Per Individual in the Bl and SBI Sample 12
6. Relative Frequency of Issues by Type in Each Issue Category 14
7. Skyscraper Plot of the 20 Most Frequent Issue Combinations in the Bl Sample 17
8. Skyscraper Plot of the 21st through 40th Most Frequent Issue Combinations in the Bl Sample 17
9. Skyscraper Plot of 20 Issues-Combinations in the SBI Sample Indexed in the Same Order as the First Twenty Bl Samples for Comparison Purposes 18
10. Skyscraper Plot of Next Most Frequent Issues in the SBI Sample Indexed in the Same Order as the Second Twenty Frequent Issue Combinations in the Bl Sample 18
11. Skyscraper Plot of the Single Issue Cases in the Bl Sample 19
12. Skyscraper Plot of the Single Issue Cases in the SBI Sample 19
13. Skyscraper Plot of the Double-Issue Cases in the Bl Sample 20
14. Skyscraper Plot of the Double-Issue Cases in the SBI Sample 20
15. Skyscraper Plot of the Triple Issue Cases in the Bl Sample 21
16. Skyscraper Plot of the Triple Issue Cases in the SBI Sample 21
17. Skyscraper Plot of the Quadruple Issue Cases in the Bl Sample 22
18. Skyscraper Plot of the Quadruple Issue Cases in the SBI Sample 22
VI

Introduction
Problem
The Defense Investigative Service (DIS) must conduct alternatively two different types of investigations to obtain background information: the Background Investiga- tion (Bl) and the Special Background Investigation (SBI). The different types of investigations are directed by separate regulations that govern eligibility for access to different types of classified information.
The Bl is conducted for individuals requiring Top Secret clearance. The investigation covers the most recent five years of a subject's background and involves, as a matter of procedure, an indepth interview of the subject. The inves- tigation also contains source interviews and records checks for the five-year period.
The SBI is conducted for individuals requiring access to programs which contain Sensitive Compartmented Information (SCI). The SBI investigates up to 15 years of a subject's background, depending upon the age of a subject, and uncovers issues through record checks and interviews with sources who are familiar with the candidate's background. Issues are generally resolved through a subject interview; otherwise, an indepth interview is not a matter of procedure.
This paper examines the Bl and SBI in terms of the type of information that is developed by the two investigative methods. All security investigations have two possible outcomes: the investigation either yields no information that casts doubt about the subject, or it uncovers problems or questions about the subject's charac- ter. These issues are resolved by further investigation before a subject is granted clearance eligibility.
Both the Bl and SBI return information about 11 issue categories: alcohol, drugs, finances, mental-emotional, crime, sexual, loyalty, foreign connections, foreign preference, falsification, and security violations. The focus of this inquiry is whether there is a difference in the types of issues that are developed by the Bl and SBI.
Comparing the issues generated by the Bl and SBI is not a straightforward matter, because differences in investigative method are confounded by differences between the populations that are nominated for TS and SCI clearances. There is already a considerable body of research about these population differences (e.g., Crawford and Wiskoff 1988, Flyer 1987, Laurence and Colot 1987). Briefly, in comparison to the Bl the SBI population has proportionately more women, and candidates tend to be screened more carefully and to have higher educational levels. The net effect of these differences is that SBI candidates appear to have less derogatory information in their backgrounds; this shows up as a lower proportion of
1
issues for SBI candidates. The problem is that it is impossible to ascertain if the lower issue case rate results from characteristics of the population or characteristics of the investigation.
The present study takes a different approach to the questions surrounding the Bl and SBI. It compares the types of issues contained in the issue cases of Bl and SBI samples. The unit of analysis is the issue(s) generated by Bis and SBIs. Analyses are conducted to determine if there are differences in the composition (i.e., frequency and patterns) of the issues. The study does not eliminate the confounding factors discussed above, but it looks at the issue characteristics of the two popula- tions as developed by the investigative method.
The presumption is that if wide differences are found between the issue patterns of the Bl and SBI there is reason to suspect that there are profound differences between either the investigative method or the population characteristics. If differences are not evident, however, there is reason to think that once issues have been uncovered there is little difference in the ability of the Bl and SBI to investigate issues.
This study represents an improvement over previous studies of the Bl and SBI because it focuses on issues after the issue has been identified. As such, it provides a graphical depiction of issue characteristics of candidates for DoD security clearances. The analyses should prove interesting to a wide cross-section of the personnel security community.
The data analyzed for this study represent a sample of 812 SBI issue cases and a sample of 881 Bl issue cases. Each record consists of demographic informa- tion about an individual (gender, age, and employment status) and entries indicate one or more of the 11 issue categories which caused the particular person to qualify as an issue case.
The data were obtained from the Quality Assurance Branch of DIS Personnel Investigations Center (PIC). This branch is responsible for ensuring that the quality of investigations represents a uniform, acceptable standard. This branch normally samples the issue cases processed each week through the PIC. They select an incidental sample of issue-case records and evaluate the files for adherence to investigation standards. The branch provided the demographic and issue data for each record processed through their office over a period of several months. There is no information about the total number of cases that were available for sampling, so population inferences are limited.
Disclaimer
The data show only the categories of issues for each record, and give no indication of the quality and depth of information produced by each procedure.
Assumptions
An assumption was made that the data represent two random samples of SBI and Bl issue cases. The selection procedure followed by the Quality Assurance Branch is assumed to be unbiased with regard to selection of SBI or Bl cases.
Exploratory Data Analysis
Comparisons of the Populations by Demographic Factors
Three demographic factors are recorded for each record in this study: gender, age, and employment status of the subject. Gender and age are self-ex- planatory. Employment status refers to one of three types of defense employment: Department of Defense (DOD) civilian employees, industrial civilian employees (individuals who work for defense contractors who require access to classified information in the conduct of the government contract-related activities of their employer), and members of the military services.
Each demographic category was summarized into its components and a two- way layout was constructed which allowed the configuration of both samples to be jointly compared for the particular category. For example, a table of counts of males and females for both the Bl and SBI samples was constructed. The marginal counts were also constructed and yielded a contingency table layout. The samples could then be compared to determine whether differences in the proportions of various categories in each sample represented a statistically significant difference. This difference was investigated using contingency table analysis techniques, in particular the two-sample chi-square, goodness-of-fit technique (Gibbons, 1976), and residual analysis. Using this technique, each of the three demographic factors was com- pared between samples.
Graphs of the demographic data are presented as figures whenever possible to represent visually the results of the statistical tests.
Gender
The two populations were compared to see whether they differed by gender, i.e., whether the proportions of males to females are the same within the SBI and Bl populations.
A contingency table which represents the counts and residuals (Anscombe 1981) of the gender classification for each of the samples was constructed (Table 1). The column marginal totals are the fixed numbers which represent the sizes of the samples from each investigation procedure.

TABLE 1
Contingency Table for Gender for Bl & SBI: Counts and Residuals
SBI Bl Total i
Male 601 702 1303 (-.9579) (.9197)
Female 211 179 390 (1.751) (-1.681)
Total 812 881 1693
Summing the squared residuals produced a chi-square statistic T, with 1 degree of freedom:
T = 7.6552
This produced a P-value of less than .01, which indicates that there is a significant difference in the proportion of males to females in each population. There appear to be more males proportionally in the Bl population than in the SBI popula- tion. Relative frequency histograms for each sample are displayed in Figure 1. There is a small statistically significant difference in the proportion of women between samples: there are proportionately more women in the SBI sample.
Age
Ages were coded into groupings (16-20 years old, 21-25 years old, etc.) and the samples were compared for age differences. The statistical test is that the age grouping proportions are the same for the SBI and Bl populations; the alternative hypothesis is that the age grouping proportions differ for at least one grouping.

•J wKuk Males Females
Bl SBI
Figure 1. The Relative Frequency of Gender in the Bl and SBI Sample.

A contingency table (Table 2), giving counts and residuals of age groups for each population, was constructed.
TABLE 2
Expected Values and Residuals for Age in Bl and SBI Samples
Age Grouping Missing
SBI 3
(-1.951)
BJ 4
(.1873)
Total 7
16-20 93 (.0544)
102 (.0522)
195
21-25 177 (-.7351)
213 (.7056)
390
26-30 199 (1.4273)
176 (-1.3703)
375
31-35 125 (-.6005)
150 (.5765)
275
36-40 96 (.3568)
97 (-.3426)
193
41-45 54 (-.0915)
60 (.0879)
114
46-50 27 (-.5851)
36 (.5617)
63
51-55 25 (.1768)
29 (.1697)
54
56-60 13 (.5927)
10 (-.5691)
23
61-75 0 (-1.3851)
4 (1.3298)
4
TOTAL 812 881 1693
Summing the squared residuals produced a chi-square statistic T with 10 degrees of freedom:
T = 11.0656
8
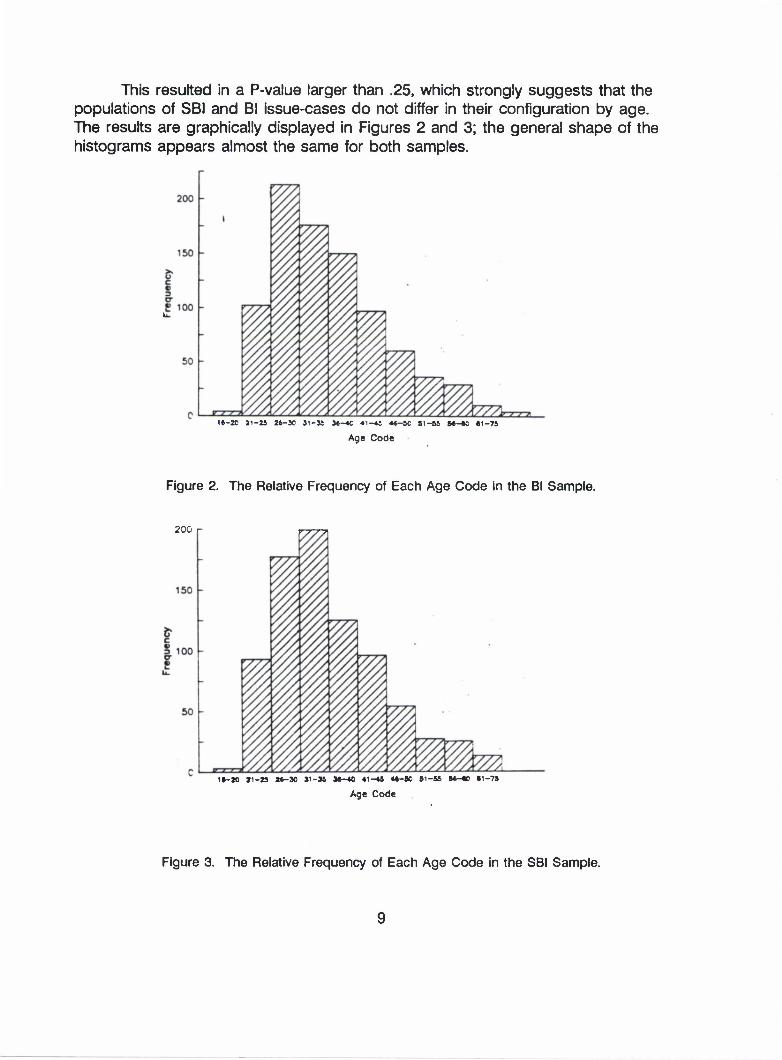
This resulted in a P-value larger than .25, which strongly suggests that the populations of SBI and Bl issue-cases do not differ in their configuration by age. The results are graphically displayed in Figures 2 and 3; the general shape of the histograms appears almost the same for both samples.
16-20 21-24 26-SO J1-J4 36-4C 41-44 4*-sc 61-55 S*-8C 61-71
Age Code
Figure 2. The Relative Frequency of Each Age Code in the Bl Sample.
200 r
1§-20 21-» 2»-X J1-SS J6-40 41-46 46-SC 61-86 St-tO 61-76
Age Code
Figure 3. The Relative Frequency of Each Age Code in the SBI Sample.

Employment Status
The samples were compared to see if the populations differed by employment status. The hypothesis was that the employment status proportions within the SBI and Bl populations are the same; the alternative was that the employment status proportions were different in at least one category.
The following contingency table of counts and residuals for employment status was constructed (Table 3).
TABLE 3
Expected Values and Residuals for Employment Status for Bl and SBI Samples
Employment Status SBJ BJ Total
DOD Civilian 94 (2.6004)
56 (-2.4965)
150
Industrial Civilian 299 (-.7489)
352 (.7190)
651
Military 419 (-.4266)
473 (.4095)
892
Total 812 881 1693
Summing the squared residuals produces a chi-square statistic T with 2 degrees of freedom:
T = 14.422
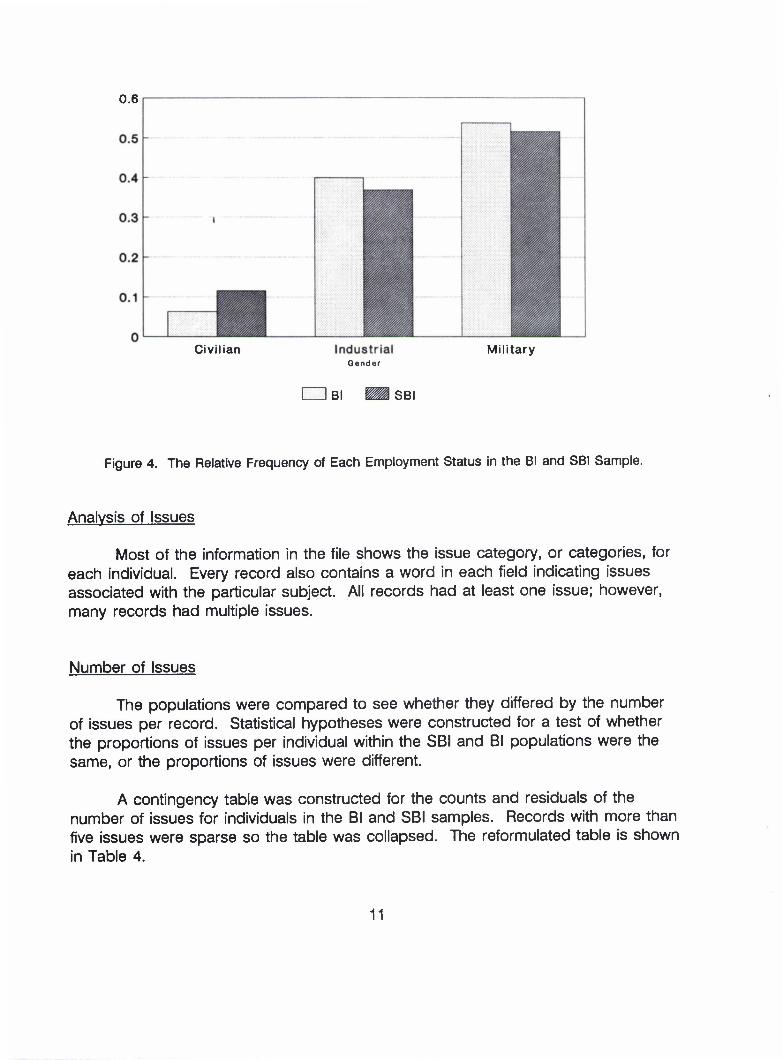
This statistic has a P-value of approximately 0.0000, indicating that the populations differ in their configuration by employment status. In particular, the difference seems to center primarily in the proportion of DOD civilians, as shown by the large residuals in the categories in Table 3: DoD civilian 2.6004 and -2.4965 respectively. The number of DOD civilians in the SBI sample is significantly larger than the proportion of DOD civilians in the Bl sample (11% versus 5%). This difference is easily seen in Figure 4.
10
0.6
Oivilian Military Gender
Bl SBI
Figure 4. The Relative Frequency of Each Employment Status in the Bl and SBI Sample.
Analysis of Issues
Most of the information in the file shows the issue category, or categories, for each individual. Every record also contains a word in each field indicating issues associated with the particular subject. All records had at least one issue; however, many records had multiple issues.
Number of Issues
The populations were compared to see whether they differed by the number of issues per record. Statistical hypotheses were constructed for a test of whether the proportions of issues per individual within the SBI and Bl populations were the same, or the proportions of issues were different.
A contingency table was constructed for the counts and residuals of the number of issues for individuals in the Bl and SBI samples. Records with more than five issues were sparse so the table was collapsed. The reformulated table is shown in Table 4.
11

TABLE 4
Expected Values and Residuals for Number of Issues in Bl and SBI Samples
Number of Issues 1
i 2 3 4 5-7 Total
SBI 484 200 86 30 12 812 (-1.31) (-.983) (1.11) (-.695) (.4459)
Bl 467 247 116 41 10 881 (-1.25) (.9436) (1.062) (.668) (-.428)
Total 951 447 202 71 22 1693
Summing the squared residuals produced a chi-square statistic T, with 4 degrees of freedom:
T = 8.7895
This produced a P-value of approximately .075, indicating that the proportion of issues per individual in each population, SBI and Bl, is the same. The general shape of the histogram in Figure 5 supports this.
0.7
0.6
0.5
0.4
0.3
0.2
0.1
0 2 3 4
Number of Issues 5-7
SBI Bl
Figure 5. The Relative Frequency of the Number of Issues Per Individual in the Bl and SBI Sample.
12
General Pattern of Issues
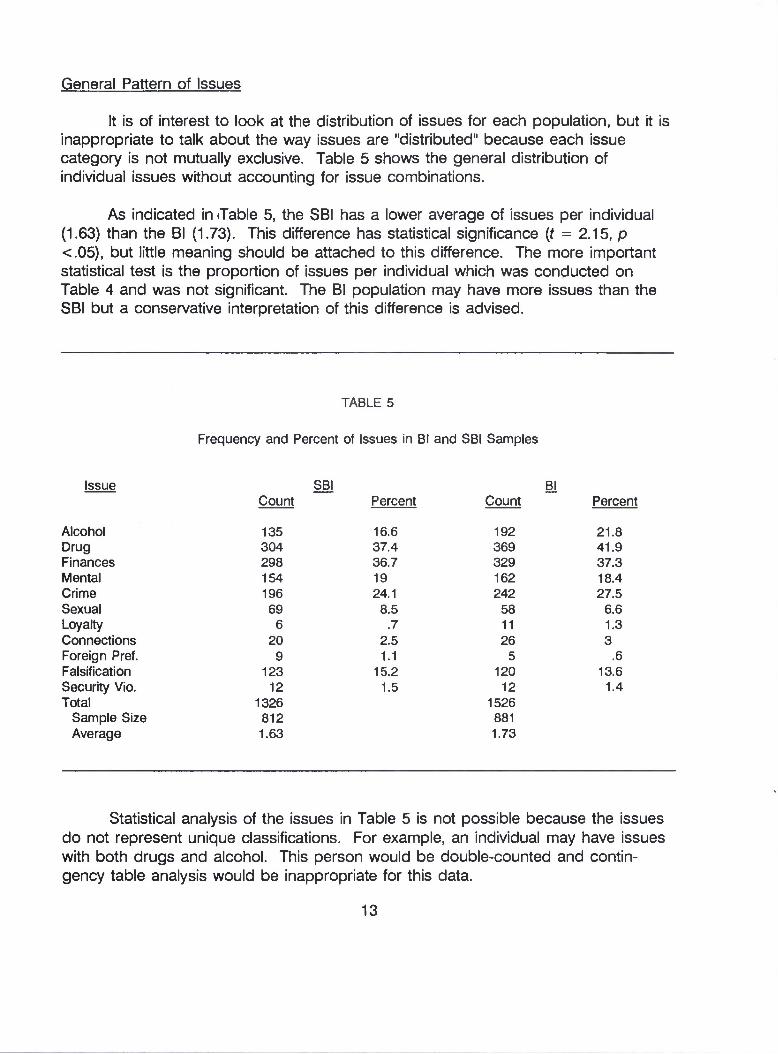
It is of interest to look at the distribution of issues for each population, but it is inappropriate to talk about the way issues are "distributed" because each issue category is not mutually exclusive. Table 5 shows the general distribution of individual issues without accounting for issue combinations.
As indicated in »Table 5, the SBI has a lower average of issues per individual (1.63) than the Bl (1.73). This difference has statistical significance (f = 2.15, p <.05), but little meaning should be attached to this difference. The more important statistical test is the proportion of issues per individual which was conducted on Table 4 and was not significant. The Bl population may have more issues than the SBI but a conservative interpretation of this difference is advised.
TABLE 5
Frequency and Percent of Issues in Bl and SBI Samples
Issue SBI Bl Count Percent Count Percent
Alcohol 135 16.6 192 21.8 Drug 304 37.4 369 41.9 Finances 298 36.7 329 37.3 Mental 154 19 162 18.4 Crime 196 24.1 242 27.5 Sexual 69 8.5 58 6.6 Loyalty 6 .7 11 1.3 Connections 20 2.5 26 3 Foreign Pref. 9 1.1 5 .6 Falsification 123 15.2 120 13.6 Security Vio. 12 1.5 12 1.4 Total 1326 1526
Sample Size 812 881 Average 1.63 1.73
Statistical analysis of the issues in Table 5 is not possible because the issues do not represent unique classifications. For example, an individual may have issues with both drugs and alcohol. This person would be double-counted and contin- gency table analysis would be inappropriate for this data.
13

A bar chart (Figure 6) was constructed from the counts in Table 5; it indicates the frequency of appearance of individual issues in each sample. Figure 6 shows there are nearly equivalent proportions of the issues in both the SBI and Bl samples. The percentage of individuals in the SBI sample associated with any particular issue is generally less, but the shape of the bar chart is nearly identical for both.
0.5
0.4
0.3
0.2
0.1
m A D F M C S L c P F s I r i e r e o 0 r a c c u n n i X y n e I t o g a t m u a n f s y h n a e a I e n i 0 I
c e
I I t y
c t
c e
f y
V i o I
SBI Bl
Figure 6. Relative Frequency of Issues by Type in Each Issue Category
Issue Combinations
Another way to look at the issue interaction is to construct a table of counts for all the unique combinations of issues. Out of a possible 211 occurrences, 134 different combinations of issues were present in the two samples. Since this large number of combinations is too difficult to interpret, the 20 most common combina- tions, based upon the Bl ranks, are listed in Table 6 below; Bl ranking is used to allow comparison between the samples.
14

TABLE 6
Twenty Most Frequent Issue Combinations Based on Bl Ranking, in Bl and SBI Samples
Issue Combination SBI Sample Bl Sample Count Rank Count Rank
Finances 187 1 175 1 Drug 124 2 115 2 Mental 68 3 74 3 Crime 28 5 37 4 Drug-Crime 21 7 35 5 Drug-Finance 15 11 34 6 Alcohol 31 4 31 7 Alcohol-Drug 15 11 28 8 Alcohol-Drug-Crime 12 14 23 9 Alcohol-Crime 17 8 22 10 Drug-Falsify 16 10 19 11 Finance-Crime 13 13 17 12 Drug-Mental 22 6 15 13 Finance-Mental 8 18 11 14 Sexual 17 8 11 15 Drug-Finance-Crime 6 25 11 16 Alcohol-Finance 2 46 11 17 Drug-Crime-Falsify 9 16 9 18 Foreign Connections 10 15 9 19 Loyalty 4 31 9 20
While 134 combinations occurred, Table 6 indicates that the frequencies rapidly decreased after the first 20 combinations are displayed. The Bl and SBI samples appear to display very similar rankings of issue types, with some differences apparent.
Table 6 does not allow for an easy comparison between issue combinations of the Bl and SBI. However, when the numerical information is combined with a graph of the interaction of the various issues, we gain a much stronger insight into the most common interactions within each sample. This provides a quick way to compare interactions between and within samples; similarities are highlighted and differences are much more quickly apparent.
15

Bl Issue Combinations
Figure 7 is a skyscraper plot of the Bl information in Table 6. The x-axis (the axis labeled "Issue Combination") represents the 20 most frequent Bl issue combina- tions. Perpendicular to the x-axis are the issue categories. The towers along this axis represent the prevalence of the particular issue category. The z-axis represents the count (or frequency) of any particular issue-combination.
As an example of the interpretation of Table 6, the tallest skyscraper in Figure 7 is to the left of the graph. The count indexed along the x-axis is 175. This means there is a frequency of occurrence of this combination of 175 within the Bl sample. Reading back along the column from the x-axis, we see only one sky- scraper. This is a single issue category. Following the y-location to the y-axis, we see that this skyscraper represents the finances issue category. To summarize, the most frequently occurring issue combination is a single issue, finance: 175 individuals have this problem.
Moving to the fifth issue along the x-axis, two skyscrapers line up in the y- direction. This represents a combination of drug and crime with a count of 35. This means that the fifth most common combination in the Bl sample was the drug-crime combination; 35 people have this particular problem.
Only the first 20 combinations are listed because the graph gets increasingly difficult to read with more combinations; however, these first 20 combinations represent 696 out of the 881 total combinations, which means that 79% of all persons in the Bl sample have one of these issue combinations.
What does this graph tell us? The first four most frequent issue combinations are finances alone, drugs alone, mental alone, and crime alone (in fact 45% of the Bl cases are contained in these four single issues). We also see that not only are drugs alone and finance alone the most common combinations, but as we move to the right, we see that they frequently interact with other issue categories. In the same light, while alcohol is relatively infrequent as a single factor, the seventh through tenth most common combinations involve multiple issue combinations involving alcohol. Also noteworthy is the low rate of frequency of issue categories involving the sexual, loyalty, foreign connections, foreign preference, or security categories.
16

c
is
Vect3;
Figure 7. Skyscraper Plot of the 20 Most Frequent Issue Combinations in the Bl Sample. Each increment along the x-axis represents the unique issue combination. The issues involved in that particular combination are represented by the particular skyscraper.
Figure 8 displays the 20 next most frequent issue combinations in the Bl sample. Only 10% of the subjects are represented among these combinations. Crime and falsification interact strongly with each other and with the other issues.
S
c
Is
O L
MiftSmm-
• • •"•-. ^» "iT'••:•••••••• • •- . • mT-• • • • -^ • ••&•• • V
Figure 8. Skyscraper Plot of the 21st through 40th Most Frequent Issue Combinations in the Bl Sample.
17

SBI Issue Combinations
Figures 9 and 10 display the issue combination information for the SBI samples arranged in the same order as the Bl. The SBI sample, with relatively few exceptions, does not seriously deviate from the Bl sample. The same top 20 issue combinations represent 77% of the SBI sample and the next 20 combinations represent 11 %. The pictures strongly suggest, even with such a complex interaction of factors, that the two samples have behaved in remarkably similar ways.
vects)
Figure 9. Skyscraper Plot of 20 Issues-Combinations in the SBI Sample Indexed in the Same Order as the First Twenty Bl Samples for Comparison Purposes.
°f Sub 'J9eta) -9
Figure 10. Skyscraper Plot of Next Most Frequent Issues in the SBI Sample Indexed in the Same Order as the Second Twenty Frequent Issue Combinations in the Bl Sample.
18

Single-issue frequency patterns
Figures 11 and 12 show the frequency comparisons of the individuals with only single issues. Comparison of the two samples indicates that single issues occur with similar frequencies in both samples.
^ o c "~ 8
nsr^U irt^/js Tji^-*./*r£,-/.+ ?*y/%/\ / • •••JS;~".~...7T/ o " ;' *•' '2l""S—z!r / *m 7 .•;' ^ // %.
• J^ • m" ~ * ~ • *r ° « /V* <?
" 0f Subi^, 'Jects)
Figure 11. Skyscraper Plot of the Single Issue Cases in the Bl Sample.
'»soe
*""'•*" «-.„ No. of Sub Vects)
Figure 12. Skyscraper Plot of the Single Issue Cases in the SBI Sample
19

Double-issue Frequency Patterns
Figures 13 and 14 display frequency comparisons of the individuals with double-issue combinations. It is apparent that the Bl sample produces double-issue combinations more frequently than the SBI, but the first seven most frequent double- issue cases are the same for both samples. Drug, alcohol and crime issues are involved in double-issue combinations in a similar fashion for both samples.
%h
3 I
* <
•-- _7 n • *m • M< \.^w . tM • •^^r- .• / u|£
^obe/ /3
''V'ects;
Figure 13. Skyscraper Plot of the Double-Issue Cases in the Bl Sample.
'»*ue Con*'notlon
Figure 14. Skyscraper Plot of the Double-Issue Cases in the SBI Sample.
20
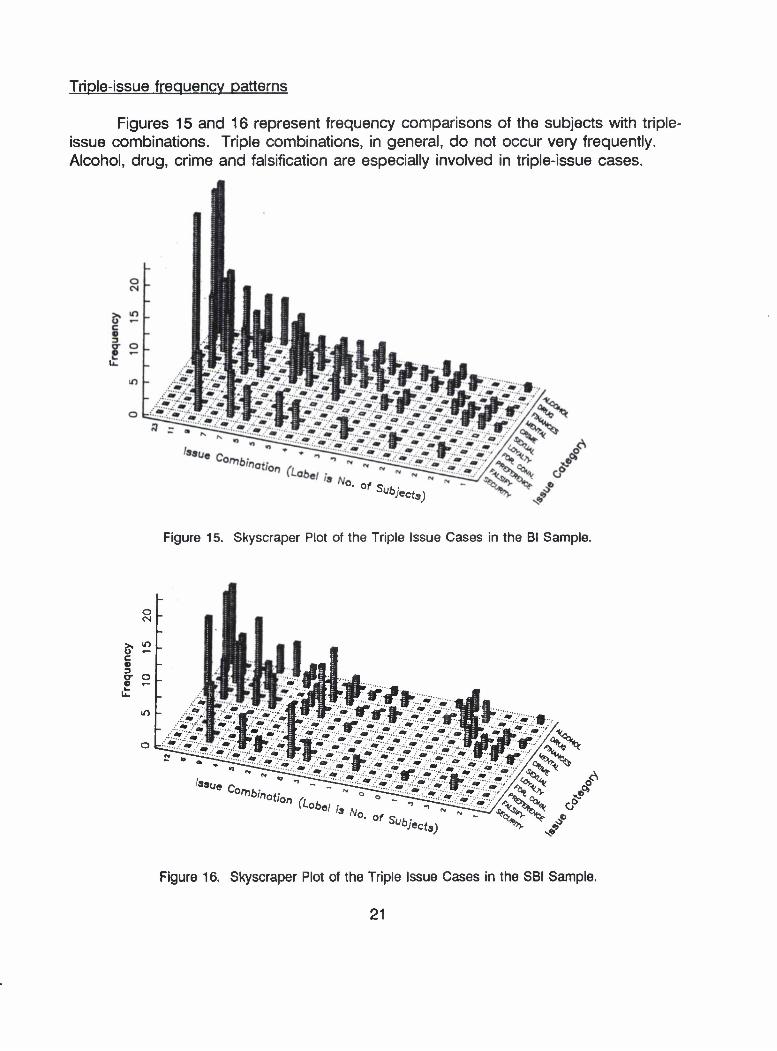
Triple-issue frequency patterns
Figures 15 and 16 represent frequency comparisons of the subjects with triple- issue combinations. Triple combinations, in general, do not occur very frequently. Alcohol, drug, crime and falsification are especially involved in triple-issue cases.
N°. Of SubJ*ct9)
Figure 15. Skyscraper Plot of the Triple Issue Cases in the Bl Sample.
S- 5 c o 3 <T O O .-
-• -«".- -V - . j
'ssue C<""6mQ,,
,",°<;o" ftob./ " Wo. 0, Sub !/«ct«;
Figure 16. Skyscraper Plot of the Triple Issue Cases in the SBI Sample.
21

Quadruple-issue frequency patterns
Figures 17 and 18 represent quadruple-issue combinatipns. In some ways quadruple-issue cases are the most serious cases, even though they occur infrequently. It is probably inappropriate to draw many conclusions from these patterns; however, the interaction of alcohol, drugs, crime, and falsification are very strong.
c
vecta)
Figure 17. Skyscraper Plot of the Quadruple Issue Cases in the Bl Sample.
Figure 18. Skyscraper Plot of the Quadruple Issue Cases in the SBI Sample.
22
As a final note, it is important that issues not be completely discounted because of their relative rarity. There is no way to determine, based upon these samples, who was awarded a clearance and who was deemed ineligible. Some of the rare combinations may, in fact, be the ones which are most interesting. Examination of the issue cases which resulted in denial of clearance may highlight these rare combinations.
23

Summary and Conclusions
Demographic Information
The gender configuration of the SBI population is statistically different from the gender configuation of the Bl issue populations. The SBI population has a sig- nificantly greater proportion of women than the Bl population.
The age distribution of the SBI and Bl issue-case populations appears to be the same.
Employment status distributions of the SBI and Bl issue-case populations appear to be significantly different. The proportion of DoD civilians in the SBI sample is significantly larger than the proportion of DoD civilians in the Bl sample.
Issue Analysis
The SBI sample, in general, had a slightly smaller percentage of issues in most categories and a smaller mean number of issues for each subject (1.63 issues per subject for the SBI sample versus 1.73 issues per subject for the Bl sample). It is difficult to say whether this difference is meaningful, because many subjects had multiple issues and there was no difference in the proportion of issues per individual in the Bl and SBI populations. The presence of multiple issues presents a problem that is not amenable to traditional, contingency table analysis. It is not statistically possible to compare the distribution of issues in the SBI and Bl populations; however, the graphs of issue counts by sample strongly suggest that the issues occur in similar proportions in both populations. When depicted graphically, both samples show similar patterns and frequencies of issue combinations.
Conclusion
It appears that the type and amount of information contained in Bl and SBI is roughly the same. Although there are some differences between the samples, graphical and statistical analysis of the samples does not reveal any major differen- ces. In fact, the similarities between the amount and type of issue cases in both samples is noteworthy. This suggests that population differences are not strong enough to affect issue patterns and that the two investigations are equivalent in developing issues. Thus, we conclude, based on the data available, that there is little difference between the Bl and SBI in terms of type and amount of information obtained.
25

There are unanswered questions about representatives of the Bl and SBI samples and the quality of material generated by the Bl and SBI. These questions require separate inquiry and will be addressed in future studies.
26

References
Anscombe, F. J. (1981). Computing in Statistical Science Through APL. New York: Springer Verlag.
Crawford, K. S., & Wiskoff, M. F. (1988). Screening Enlisted Accessions for Sensitive Military Jobs (Tech Report PERS-TR-89-001). Monterey, CA: Defense Personnel Security Research and Education Center.
Flyer, E. S. (1987). Characteristics and Behavior of Recruits Assigned to Highly Sensitive Positions (Tech Report HII 80-01) Alexandria, VA: HumRRO International, Inc.
Gibbons, J. D (1976). Non-parametric method for quantitative analyses. New York: Holt, Rinehart & Winston.
Laurence, J. H., & Colot, P. L (1987). Comparison and evaluation of interview- oriented and special background investigations. (Technical Report No. 83-03). Alexandria, VA: HumRRO International, Inc.
27