issues, challenges and practical approaches to it security ... · and completeness, frequency,...
TRANSCRIPT
CRISC
CGEIT
CISM
CISA 2013 Fall Conference – “Sail to Success”
Issues, Challenges and Practical Approaches to IT Security Risk Metrics & Reporting
Arun Sivaraman, Director, SOAProjects Governance, Risk & Compliance – G21
2013 Fall Conference – “Sail to Success” September 30 – October 2, 2013
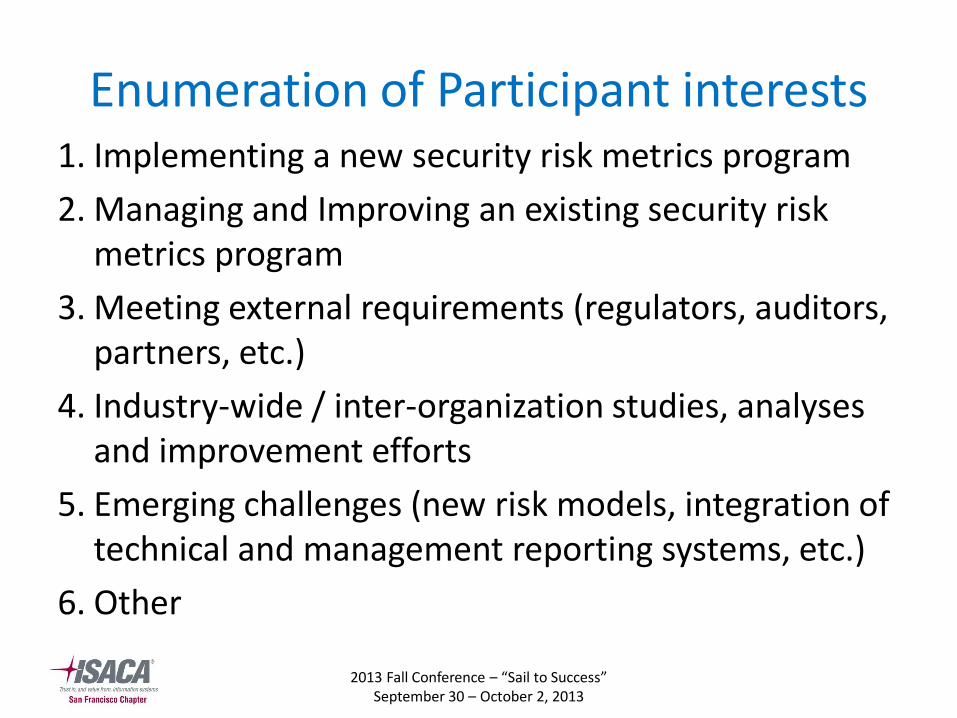
Enumeration of Participant interests 1. Implementing a new security risk metrics program
2. Managing and Improving an existing security risk metrics program
3. Meeting external requirements (regulators, auditors, partners, etc.)
4. Industry-wide / inter-organization studies, analyses and improvement efforts
5. Emerging challenges (new risk models, integration of technical and management reporting systems, etc.)
6. Other

2013 Fall Conference – “Sail to Success” September 30 – October 2, 2013
About me
• Experienced in Comprehensive information security management programs, Designing and deploying security solutions, Executing IT audits, compliance and certifications, Security project management
• Worked with High tech, Manufacturing, Banking, Finance and Not-for-Profit clients
• Areas of interest: Operational risk, Enterprise Risk Management dashboards, Integrated compliance frameworks, Emerging technologies

2013 Fall Conference – “Sail to Success” September 30 – October 2, 2013
Agenda
4
• Overview of security risk metrics
• Implementing a security risk metrics program
• Issues, challenges and practical approaches for resolution
• Popular models and resources
• Q&A

9/11/2013 5
CRISC
CGEIT
CISM
CISA 2013 Fall Conference – “Sail to Success”
Overview of Security Risk Metrics
5

2013 Fall Conference – “Sail to Success” September 30 – October 2, 2013
Overview of Security Risk Metrics
• Defining security risk metrics
• Characteristics of Good and Bad Metrics
• Security Risk Measurement
• Drivers
• Benefits
• Trends
6

2013 Fall Conference – “Sail to Success” September 30 – October 2, 2013
Defining Security Risk Metrics
• Risk and Security
• Security Metrics:
– ‘A system or standard of measurement’ for objectively analyzing the performance of Information Security to aid decision-making*
– A system or standard for measuring security risks objectively to aid decision making
• Evolving discipline
• “Measures” vs. “Metrics”
7

2013 Fall Conference – “Sail to Success” September 30 – October 2, 2013
Defining Metrics: What are they
• Enumerations based on quantitative measurements and baselines
• Oftentimes correlated across two or more dimensions
• Targeted towards specific IT, Security and Business processes
8

2013 Fall Conference – “Sail to Success” September 30 – October 2, 2013
Defining Metrics: What they aren’t
• Qualitative, subjective enumerations
• Enumerations without specific context or baselines
• Measures of effectiveness of undefined, informal processes and one-off activities
9
2013 Fall Conference – “Sail to Success” September 30 – October 2, 2013
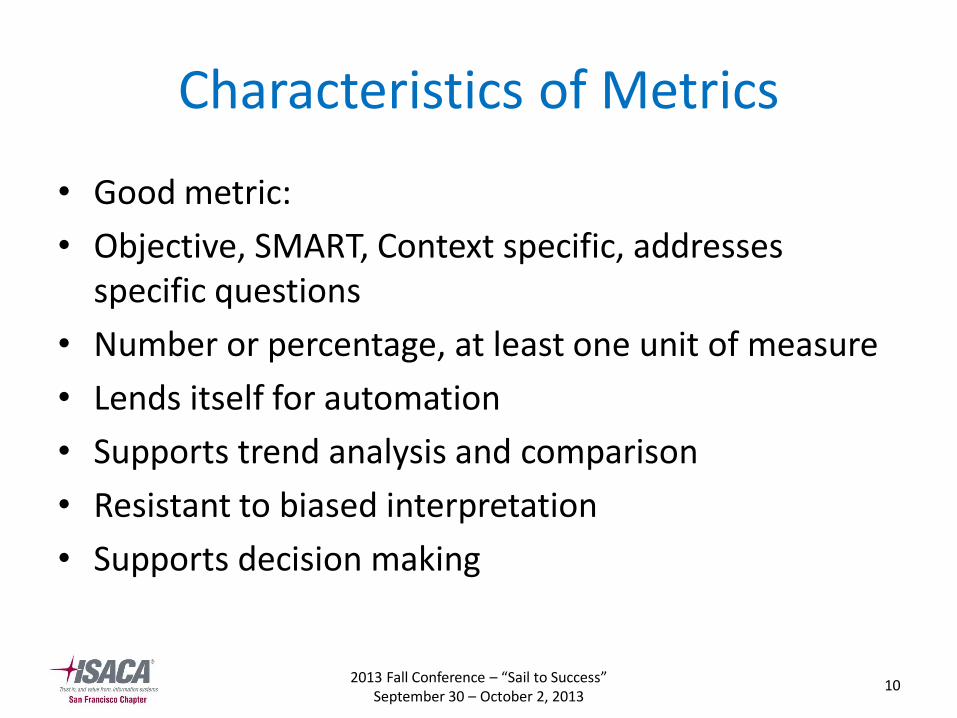
Characteristics of Metrics
• Good metric:
• Objective, SMART, Context specific, addresses specific questions
• Number or percentage, at least one unit of measure
• Lends itself for automation
• Supports trend analysis and comparison
• Resistant to biased interpretation
• Supports decision making
10

2013 Fall Conference – “Sail to Success” September 30 – October 2, 2013
Characteristics of Metrics
• Not-so-good metric:
• Context - does not address business or management questions (“so what?” test)
• Qualitative, non-numeric
• Vulnerable to biased interpretation
• Subjective, does not support comparisons
• Less automation, More expensive to collect, analyze or present
• Leads to doubting the metric itself
11

2013 Fall Conference – “Sail to Success” September 30 – October 2, 2013
Security Risk Measurement
• Historical take on Risk measures
– Typically qualitative, vulnerable to bias
– Quantitative methods - expensive, complicated
– Blamed as a tool for FUD tactics
• On the other hand,
– Good for communicating risk to non-technical stakeholders
• Challenge: How do we make our risk-metrics good metrics?
12
2013 Fall Conference – “Sail to Success” September 30 – October 2, 2013
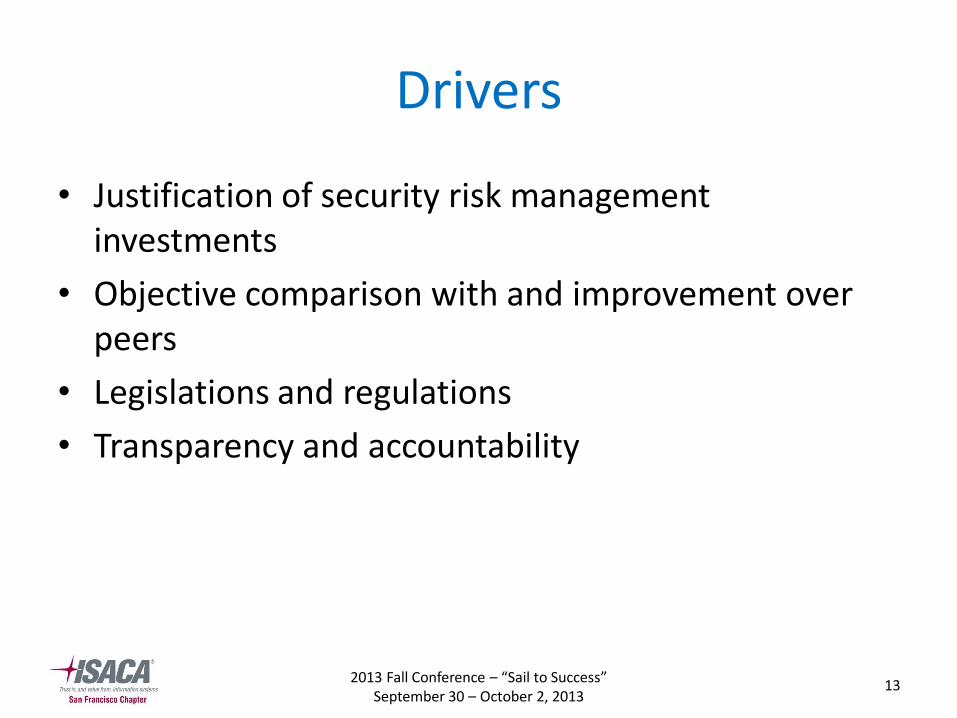
Drivers
• Justification of security risk management investments
• Objective comparison with and improvement over peers
• Legislations and regulations
• Transparency and accountability
13

2013 Fall Conference – “Sail to Success” September 30 – October 2, 2013
Benefits
• Objectivity, enables measurable improvement of security performance (and manage risks)
• Facilitates open discussion of the causes, controls and effects
• Elevates security on par with other risk disciplines
• Better understanding for decision makers
14

2013 Fall Conference – “Sail to Success” September 30 – October 2, 2013
Trends
• Integration with GRC, ERM, IT Fin. management, Operational Risk, etc.
• Benchmarking and improvement of security processes
• Automation and integration improves metric data quality, time, response
• Better modeling of security risks
• Transparency in communicating and managing risks
• Dashboards and Scorecards drive growth
15

9/11/2013 16
CRISC
CGEIT
CISM
CISA 2013 Fall Conference – “Sail to Success”
Implementing a security risk metrics program
16

2013 Fall Conference – “Sail to Success” September 30 – October 2, 2013
Security risk metrics program
• Business alignment
• Program structure
• Design considerations
• Sample structures and applications
• Developing a metrics program
• Implementing a metrics program
• Sustaining and improving a metrics program
• Sample metrics
• Critical success factors
17

2013 Fall Conference – “Sail to Success” September 30 – October 2, 2013
Business Alignment
• Helps build program based on “what’s needed for the business” instead of “what’s available”
• Makes resources available and accessible to the program
• Helps determine the program’s overall usefulness and sustainability
18
2013 Fall Conference – “Sail to Success” September 30 – October 2, 2013
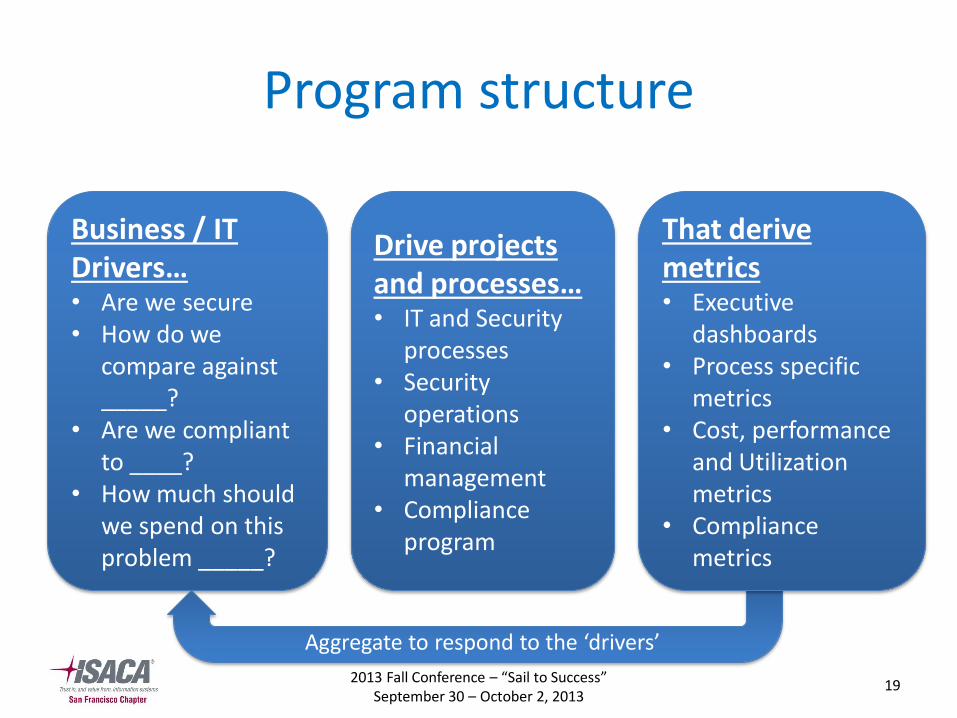
Program structure
19
Business / IT Drivers… • Are we secure • How do we
compare against _____?
• Are we compliant to ____?
• How much should we spend on this problem _____?
Drive projects and processes… • IT and Security
processes • Security
operations • Financial
management • Compliance
program
Aggregate to respond to the ‘drivers’
That derive metrics • Executive
dashboards • Process specific
metrics • Cost, performance
and Utilization metrics
• Compliance metrics
2013 Fall Conference – “Sail to Success” September 30 – October 2, 2013
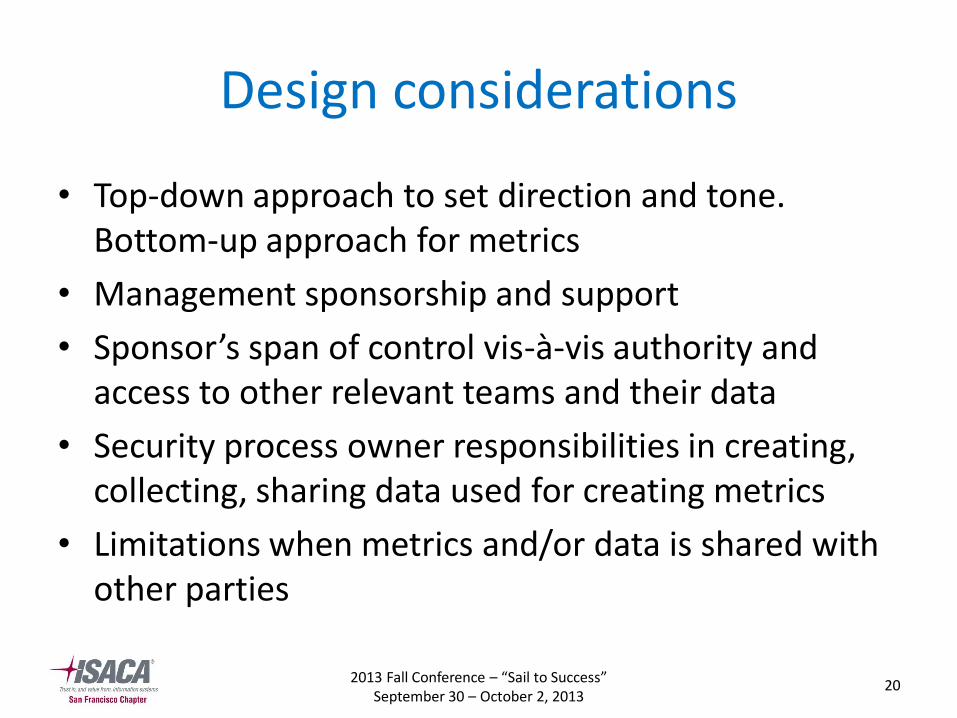
Design considerations
• Top-down approach to set direction and tone. Bottom-up approach for metrics
• Management sponsorship and support
• Sponsor’s span of control vis-à-vis authority and access to other relevant teams and their data
• Security process owner responsibilities in creating, collecting, sharing data used for creating metrics
• Limitations when metrics and/or data is shared with other parties
20

2013 Fall Conference – “Sail to Success” September 30 – October 2, 2013
Metrics program structures
• Common dimensions: Tiered approach*
– Governance, Management, and Technical
– Management, Operational, and Technical
– Organizational/Performance, Operational, Technological, Business Process, Business Value, and Compliance
– Implementation, Effectiveness and Efficiency, Business Impact
– Financial, Customer, Internal Business Processes, Learning and Growth
21

2013 Fall Conference – “Sail to Success” September 30 – October 2, 2013
Metrics program applications
• Security and Risk management initiatives.
– Achieved through costs and performance metrics, program coverage and effectiveness metrics, metric feeds into GRC initiatives, etc.
• Tactical IT and Security processes.
– Achieved through scope and coverage metrics, process effectiveness and efficiency metrics
• Operational / Technical security controls.
– Achieved through effectiveness and efficiency metrics for security and IT controls (i.e., both operational, technical)
22

2013 Fall Conference – “Sail to Success” September 30 – October 2, 2013
Developing a Security metrics program
23
• Identify Business/IT drivers and break them down to lower level metrics
• Leverage existing Policies, Guidelines and Procedures
• Identify/Add required metrics in the existing controls environment
• Document the program
Refer to Handout A for more details

2013 Fall Conference – “Sail to Success” September 30 – October 2, 2013
Implementing a security metrics program
24
• Start small – with limited processes and mature (preferred) metrics. Focus on essentials before expanding the scope
• Considerations – current vs. historical data, accuracy and completeness, frequency, analysis, reporting and presentation, gap remediation, delegation, training.
Refer to Handout A for more details

2013 Fall Conference – “Sail to Success” September 30 – October 2, 2013
Sustaining and Improving a security metrics program
25
• Ongoing review and customization of program at pre-determined points
• Considerations – Current metrics and approach. Emerging IT and security technologies. Evolving business and IT requirements, standards, regulations. Continuous improvement.
Refer to Handout A for more details
2013 Fall Conference – “Sail to Success” September 30 – October 2, 2013
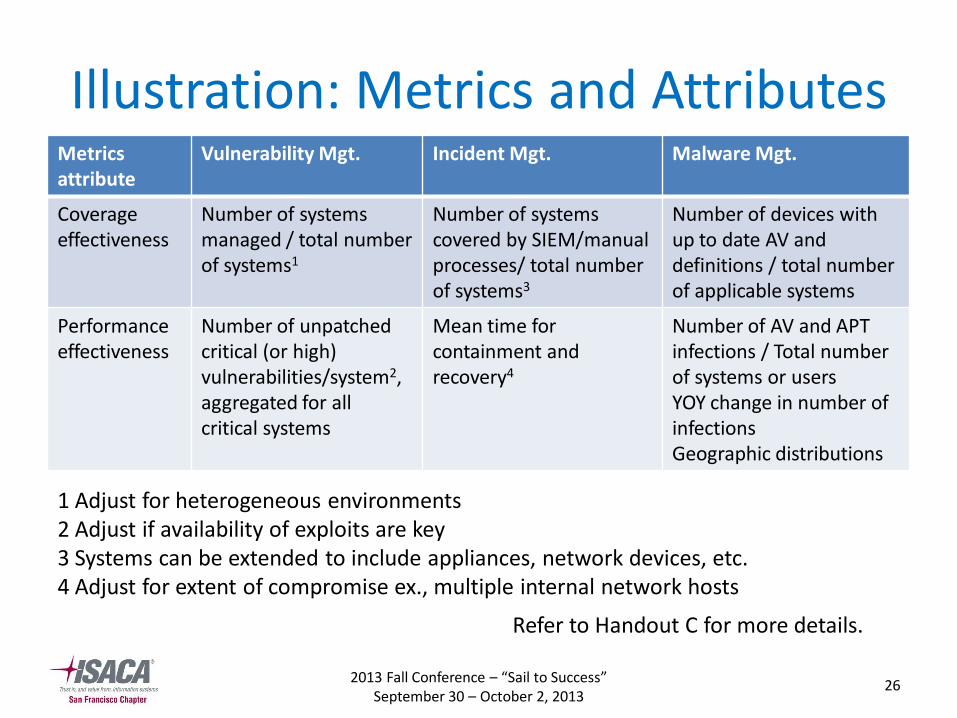
Illustration: Metrics and Attributes Metrics attribute
Vulnerability Mgt. Incident Mgt. Malware Mgt.
Coverage effectiveness
Number of systems managed / total number of systems1
Number of systems covered by SIEM/manual processes/ total number of systems3
Number of devices with up to date AV and definitions / total number of applicable systems
Performance effectiveness
Number of unpatched critical (or high) vulnerabilities/system2, aggregated for all critical systems
Mean time for containment and recovery4
Number of AV and APT infections / Total number of systems or users YOY change in number of infections Geographic distributions
26
1 Adjust for heterogeneous environments 2 Adjust if availability of exploits are key 3 Systems can be extended to include appliances, network devices, etc. 4 Adjust for extent of compromise ex., multiple internal network hosts
Refer to Handout C for more details.

2013 Fall Conference – “Sail to Success” September 30 – October 2, 2013
Illustration (contd.) Metrics attribute Vulnerability Mgt. Incident Mgt. Malware Mgt.
Process efficiency Average time for application of patches for critical vulnerabilities per system, aggregated for all critical systems
Time taken for each phase as a percentage of average time taken for that phase during the calendar year
Mean Time taken for all computers (onsite and remote) to receive latest updates
Cost effectiveness Number of Support hours required to keep critical system compliant per month
Mean cost for containment and recovery
Mean cost for containment and recovery Mean hours spent on each incident
27
Refer to Handout C for more details.

2013 Fall Conference – “Sail to Success” September 30 – October 2, 2013
Risk specific metrics
• Considerations:
– Quantitative Risk Measurement Challenges
– Qualitative Risk Measurement Challenges
– Value At Risk
– Indicators for risk
– Dashboards
28

2013 Fall Conference – “Sail to Success” September 30 – October 2, 2013
Integrating the results
• Operational metrics carved from business level drivers
– Indicate coverage, maturity, effectiveness, efficiency at Tactical and Operational / Technical layers
• Integrate Operational metrics to create Process and Program level metrics
– Integrate specific processes to determine program effectiveness and risk containment
• Respond to business drivers based on program health
29

2013 Fall Conference – “Sail to Success” September 30 – October 2, 2013
Critical success factors
30
Stage Factors
Pre-requisites Management support Scope Document rationale and approach Policies and mature processes
Design and Execution
Start small and simple Automation
Delivery Stakeholder Review Non-performing metrics New metrics
Growth Base metrics before integrated metrics Embed metrics into Org. culture

9/11/2013 31
CRISC
CGEIT
CISM
CISA 2013 Fall Conference – “Sail to Success”
Issues, Challenges and Practical approaches for resolution
31
2013 Fall Conference – “Sail to Success” September 30 – October 2, 2013
Issues, Challenges and Practical approaches for resolution
• Program planning and execution
• Program development
• Implementation and Operations
• Human factors
• Evolving challenges
32

2013 Fall Conference – “Sail to Success” September 30 – October 2, 2013
Program planning and execution
33
• Primary questions or drivers biased by lack of metrics
• Inability to break down high level management questions (or drivers)
• Requiring additional investments
• Accessibility to resources (ex., people and raw data)
• Processes are not stable or mature
• Incomplete coverage on key processes (ex., driven solely by compliance / audit needs)
• Working with differing or conflicting needs
Risk based approach
McKinsey Diagnostic Method
Senior management commitment
Fix the processes
Business first approach with IT building blocks

2013 Fall Conference – “Sail to Success” September 30 – October 2, 2013
Program development
34
• Scope and cost issues
• Using and customizing templates
• Deciding on right metrics
– Base vs. derived / complex metrics
– Availability and Cost of data and human resources
– Processes (objective, risks, control obj., controls) to derive metrics
– Number of metrics (focus on Key)
• Stakeholder Issues (see “Human Factors” slide)
Start small and evolve
Utilize project management principles
Let your goals and processes drive the design

2013 Fall Conference – “Sail to Success” September 30 – October 2, 2013
Implementation and operations
35
• Data challenges – Gaps in systems integration, automation,
processing, data quality, data integrity
• Consolidation challenges – Automation, Integration and Complexity
• Analytics challenges – Objectivity and Repeatability
• Reporting challenges – Visualization, Reporting, Interpretation Bias,
Swings, Disclosure issues
• Updating program model for business, technological or procedural changes
Fix source or update model
Consider automation to eliminate consistency issues
Promote transparency, Work with stakeholders to eliminate biases, objectivity issues and unplanned changes

2013 Fall Conference – “Sail to Success” September 30 – October 2, 2013
Human factors • Stakeholder reluctance to
participate
• Accuracy and reliability of metrics data
• Customization and Consumption challenges
• Sustaining the metrics program amongst other priorities
Leverage management authority to drive accountability Training Personalization of Dashboards Integrate the metrics program outcomes with the organization’s fabric

2013 Fall Conference – “Sail to Success” September 30 – October 2, 2013
Evolving challenges
• Correctness and effectiveness
• Complex metrics as Leading/ Lagging Indicators
• Comparing security metrics across organizations
• Quantitative vs. Qualitative ratings
• Composability problems
• Reducing human reliance, increasing automation through integration
• Reporting

9/11/2013 38
CRISC
CGEIT
CISM
CISA 2013 Fall Conference – “Sail to Success”
Resources
38

2013 Fall Conference – “Sail to Success” September 30 – October 2, 2013
References
• The CIS security metrics, Consensus metric definitions (Version 1.1.0) – www.cisecurity.org
• NIST SP 800-55 and NISTIR 7564 - crsc.nist.gov
• ISO/IEC (2009a). ISO/IEC 27004:2009 – www.iso.org
• Security Metrics www.securitymetrics.org
• Payne, S. C. (2006). A guide to security metrics – www.sans.org
• Rathbun, D. (2009). Gathering Security Metrics and Reaping the Rewards – www.sans.org
• Jaquith, A. (2007). Security metrics: Replacing fear, uncertainty, and doubt.
• Barabanov, R. (2011). Information Security Metrics - State of the Art – http://su.diva-portal.org/smash/get/diva2:469570/FULLTEXT01.pdf
• R Grandy & G Serene, A Report from the Field: Implementing Cyber Security Metrics that Work
• See Handout B for a summary of popular metrics program models
9/11/2013 40
CRISC
CGEIT
CISM
CISA 2013 Fall Conference – “Sail to Success”
Q & A
40
9/11/2013 41
CRISC
CGEIT
CISM
CISA 2013 Fall Conference – “Sail to Success”
Thank You!
41
Arun Sivaraman
SOAProjects, Inc.
www.soaprojects.com
www.linkedin.com/in/arunsivaraman