issue no. 8 june 1996 - aviation safety · issue no. 8 june 1996 the aviation safety reporting...
TRANSCRIPT

ISSUE NO. 8 JUNE 1996
The Aviation Safety Reporting System is a cooperative program established by the Federal Aviation Administration’s Office of the Assistant Administrator for System Safety, and administered by NASA
… page 11
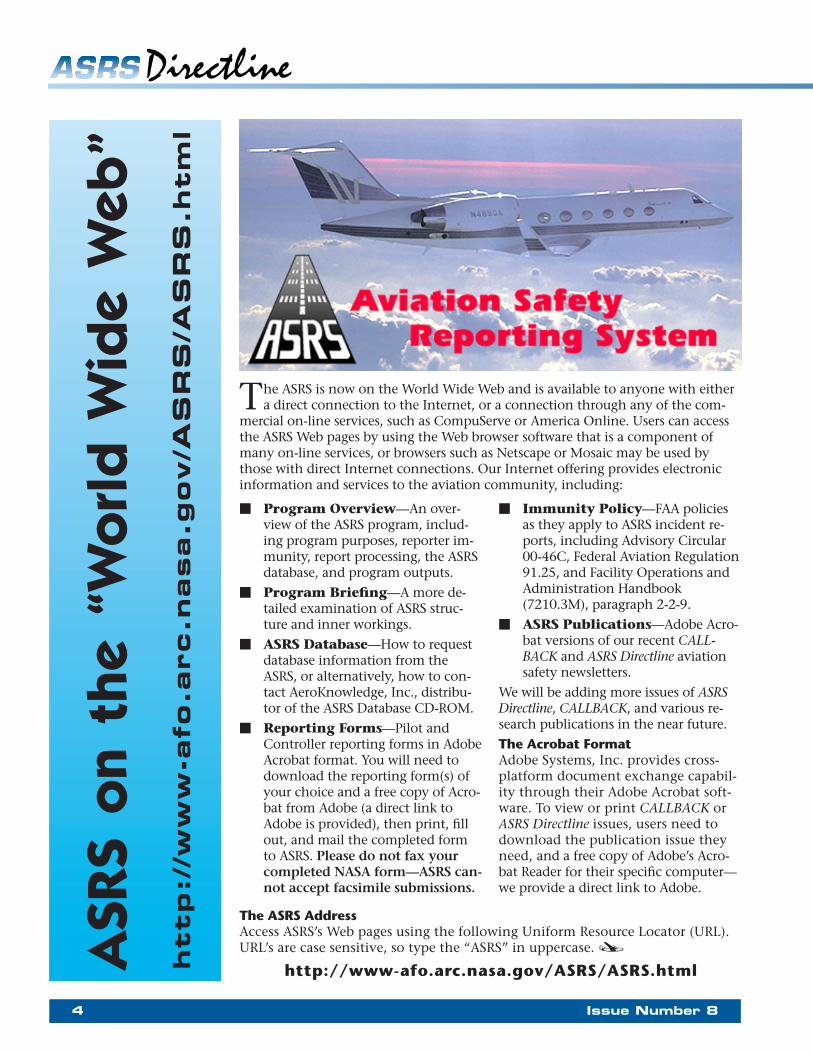
ASRS on the World Wide Web
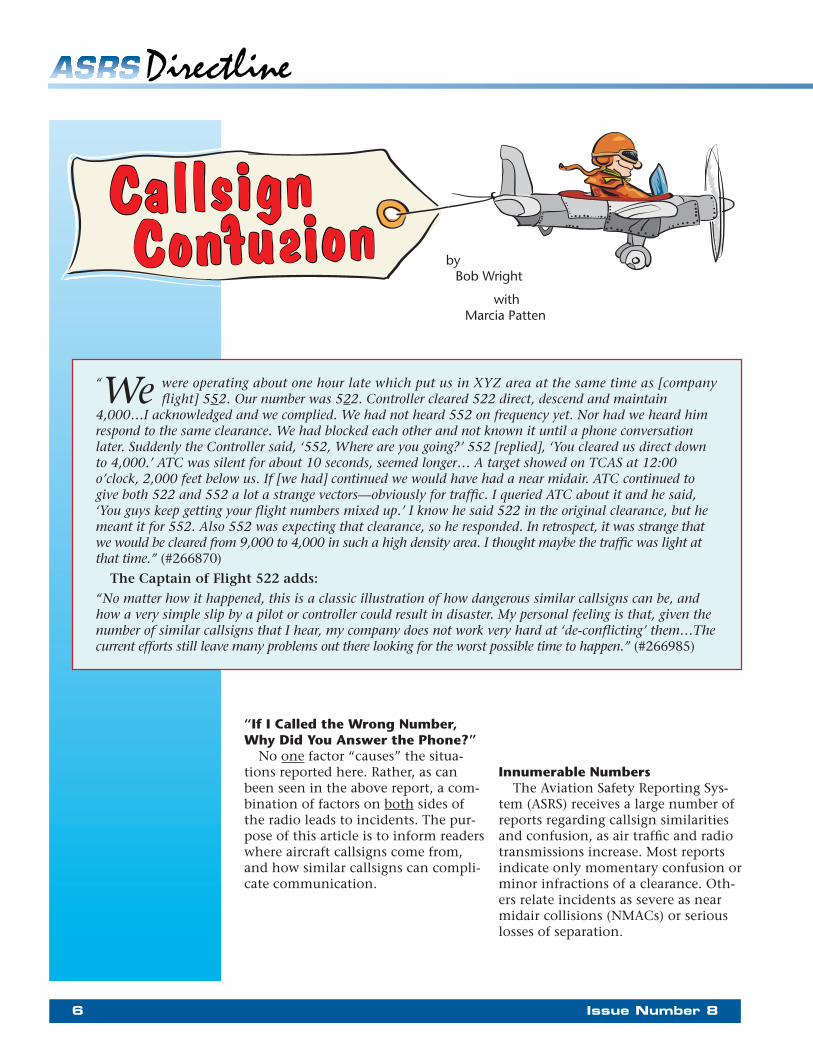
Callsign Confusion by Bob Wright and Marcia Patten
Ramp Safety by Roy Chamberlin, Charles Drew, Marcia Patten, & Bob Matchette
ASRS Database Statistics

Dr. William D. Reynard Director—NASA/ASRS
1980 to 1996
Bill joined the ASRS program very shortly after its inception 20 years ago. He served first as its Attorney/Advisor, and then as its Director from 1980 on. As Director of the ASRS, he administered a highly successful program that identifies and addresses safety deficiencies in the national aviation system. Under his leadership, the ASRS became a model for aviation incident reporting systems that were subsequently developed in the United Kingdom, Canada, Australia, New Zealand, Japan, Russia, Germany, and elsewhere. Each of these international programs benefited from Bill’s guidance and unending enthusiasm for the causes of aviation safety and voluntary safety reporting.
Bill was widely known and highly regarded throughout the international aviation community. He was frequently introduced at meetings of this community as “the only lawyer they really trusted”. He earned this respect and friendship because of his genuine passion for aviation and his dedicated stewardship of the ASRS.
In 1992, Bill was awarded the prestigious Barbour Air Safety Award by the Flight Safety Foundation. He received numerous other Special Achievement and Special Performance Awards throughout his career at NASA. He also authored nearly 30 papers on aviation safety and incident reporting, and was called upon to present testimony as an authoritative witness on aviation safety at several Congressional hearings.
Bill already had an illustrious career before joining NASA. He was a commissioned officer in the U.S. Army Adjutant General Corps from 1963 to 1966, serving in the U.S. and in Europe. He was in the Ohio National Guard from 1966 to 1969, and the U.S. Army Reserve from 1969 to 1981. After receiving his Juris Doctorate from The Ohio State University College of Law in 1969, Bill served as Legal Counsel / Congressional Affairs to the National Aviation Trades Association in Washington, DC, and, subsequently became Vice President of Operations for that association. In 1971, he became Director of Special Courses for the AOPA Air Safety Foundation, and then Executive Director of the National Association of Flight Instructors at The Ohio State University until 1976 when he joined NASA. Bill was admitted to the Bars of The State of Ohio in 1976 and The District of Columbia in 1977. He held a Commercial Pilot Certificate with Instrument and Multi-Engine Ratings.
2 Issue Number 8

An Introduction to Issue Number 8 June 1996
Here is Issue Number Eight of ASRS Directline. Directline has made an important addition to the editorial staff—Marcia Patten. In addition to her role as Associate Editor for Directline, Ms. Patten is also Managing Editor for CALLBACK. Readers will note that Ms. Patten has authored or co-authored a number of articles in this and previous issues of ASRS Directline.
Ms. Patten is a commercial rotorcraft pilot and certified rotorcraft flight instructor, with more than 1,200 flight hours in Hughes, Bell, and Aerospatiale helicopters, and is also an experienced pilot of fixed-wing general aviation aircraft. Ms. Patten has a B.A. in Classics and a Masters in Education.
Users are encouraged to reproduce and redistribute any of the articles and information contained within Directline. We DO ask that you give credit to the ASRS, to Directline, and to the authors. We also request that you send us a copy of any publication or other material that makes use of Directline articles or information.
Here are the articles for Issue Number Eight:
ASRS is on the “Web”
4ASRS is now on the World Wide Web! (Isn’t everybody?) We have provided information
on ASRS’s purpose and structure, specifics about the FAA’s immunity polices, and Adobe Acrobat versions of NASA Reporting Forms, CALLBACK, and ASRS Directline.
5Directline Wins Flight Safety Foundation Award
Flight Safety Foundation recently honored ASRS with the Cecil A. Brownlow award for
ASRS Directline. ASRS has received several awards and citations for CALLBACK; this accolade for Directline rounds out ASRS’s one-two publications punch.
Callsign Confusion by Bob Wright (with Marcia Patten)
6 In the 20 years (or so) of ASRS’s existence, it has received over 330,000 aviation
safety incident reports from pilots, controllers, and others. ASRS’s Chief Analyst, Bob Wright, can claim to have read many of these and, because of his many years of experience as an Air Traffic Controller and ASRS Analyst, has developed a very good understanding of many of the problems in the aviation community. Bob has several pet peeves, not the least of which are the problems associated with similar-sounding aircraft callsigns. In this article, Bob (with the assistance of Marcia Patten), talks about the problems of aircraft Callsign Confusion.
Ramp Safety by Roy Chamberlin and a cast of several
11Captain Chamberlin has seen many aviation safety problems in his 48-plus years in
aviation (8 in the Air Force, 33 with TWA, and 7 as an ASRS Analyst). One of his great concerns is airport ramp safety—not only the safety aspect, but also the economic impact of failures in safe ramp procedures, which cost the industry in excess of 2 billion dollars annually. Ramp Safety is an adaptation of a research paper presented at the 8th Ohio State University International Aviation Psychology Symposium, and at the Flight Safety Foundation’s 48th annual International Air Safety Seminar.
ASRS Database Statistics
20 A quick review of ASRS database statistics for 1994. This is a topical examina
tion of top-level categorizations.
That’s all for this issue of ASRS Directline. _
Charles Drew—ASRS Directline Executive Editor.
Questions? Comments? Write to:
ASRS Directline Editor NASA/ASRS P.O. Box 189 Moffett Field, CA 94035-0189
Issue Number 8 3
ASR
S o
n th
e “W
orl
d W
ide
Web
”http:/
/ww
w-a
fo.a
rc.n
asa.g
ov/A
SR
S/A
SR
S.h
tm
l
The ASRS is now on the World Wide Web and is available to anyone with either a direct connection to the Internet, or a connection through any of the com
mercial on-line services, such as CompuServe or America Online. Users can access the ASRS Web pages by using the Web browser software that is a component of many on-line services, or browsers such as Netscape or Mosaic may be used by those with direct Internet connections. Our Internet offering provides electronic information and services to the aviation community, including:
�
�
�
�
Program Overview—An overview of the ASRS program, including program purposes, reporter immunity, report processing, the ASRS database, and program outputs.
Program Briefing—A more detailed examination of ASRS structure and inner workings.
ASRS Database—How to request database information from the ASRS, or alternatively, how to contact AeroKnowledge, Inc., distributor of the ASRS Database CD-ROM.
Reporting Forms—Pilot and Controller reporting forms in Adobe Acrobat format. You will need to download the reporting form(s) of your choice and a free copy of Acrobat from Adobe (a direct link to Adobe is provided), then print, fill out, and mail the completed form to ASRS. Please do not fax your completed NASA form—ASRS cannot accept facsimile submissions.
The ASRS Address
�
�
Immunity Policy—FAA policies as they apply to ASRS incident reports, including Advisory Circular 00-46C, Federal Aviation Regulation 91.25, and Facility Operations and Administration Handbook (7210.3M), paragraph 2-2-9.
ASRS Publications—Adobe Acrobat versions of our recent CALLBACK and ASRS Directline aviation safety newsletters.
We will be adding more issues of ASRS Directline, CALLBACK, and various research publications in the near future.
The Acrobat Format Adobe Systems, Inc. provides cross-platform document exchange capability through their Adobe Acrobat software. To view or print CALLBACK or ASRS Directline issues, users need to download the publication issue they need, and a free copy of Adobe’s Acrobat Reader for their specific computer— we provide a direct link to Adobe.
Access ASRS’s Web pages using the following Uniform Resource Locator (URL). URL’s are case sensitive, so type the “ASRS” in uppercase. _
http://www-afo.arc.nasa.gov/ASRS/ASRS.html
4 Issue Number 8

Directline Wins Flight Safety Foundation Award
Over the years, ASRS has received many awards for its contributions to aviation safety. CALL
BACK, ASRS’s monthly safety newsletter, and CALLBACK’s editors, have been the recipients of a number of awards. These include Flight Safety Foundation (FSF) publication awards in November 1981 and April 1987, and The Aviation/Space Writers Association’s (AWA) Award of Excellence awarded to CALLBACK’s editors, Rex Hardy in 1982, and Dr. Rowena Morrison in 1992.
Flight Safety Foundation recently honored ASRS with the Cecil A. Brownlow award for ASRS Directline. First established as the FSF Publication Award, the award was renamed in 1988 in memory of Cecil A. Brownlow, an aviation journalist and former FSF editor. The Foundation has given the award since 1968 to honor publications and individuals that have reported consistently and accurately on timely aviation safety issues from around the globe. An independent award board makes the selection from nominations from throughout the world’s aviation community.
The award noted that “ASRS Directline, under the editorship of Charles R. Drew…[has been awarded]…the Flight Safety Foundation (FSF) Cecil A. Brownlow Publication Award in recognition of outstanding achievement in the furtherance of aviation safety through the reporting and dissemination of timely safety information. ASRS Directline, using the incident database created from reports to the U.S. National Aeronautics and Space Administration’s Aviation Safety Reporting System (ASRS), offers a unique focus on real-time operational safety issues.
“By placing this wealth of data in the hands of the aviation community, ASRS Directline has helped reduce risk and prevent accidents,” the award citation noted. “ASRS Directline is distributed without charge to selected U.S. and non-U.S. recipients and has been reprinted in many company safety newsletters.”
ASRS shared the 1995 award with Jerry Hannifin, a correspondent with Time Magazine. Mr. Hannifin was honored for his long-term contribution to aviation reporting.
ASRS thanks the Flight Safety Foundation for this prestigious award—we are truly honored. _
Issue Number 8 5
by Bob Wright
6 Issue Number 8
“We were operating about one hour late which put us in XYZ area at the same time as [company flight] 552. Our number was 522. Controller cleared 522 direct, descend and maintain
4,000…I acknowledged and we complied. We had not heard 552 on frequency yet. Nor had we heard him respond to the same clearance. We had blocked each other and not known it until a phone conversation later. Suddenly the Controller said, ‘552, Where are you going?’ 552 [replied], ‘You cleared us direct down to 4,000.’ ATC was silent for about 10 seconds, seemed longer… A target showed on TCAS at 12:00 o’clock, 2,000 feet below us. If [we had] continued we would have had a near midair. ATC continued to give both 522 and 552 a lot a strange vectors—obviously for traffic. I queried ATC about it and he said, ‘You guys keep getting your flight numbers mixed up.’ I know he said 522 in the original clearance, but he meant it for 552. Also 552 was expecting that clearance, so he responded. In retrospect, it was strange that we would be cleared from 9,000 to 4,000 in such a high density area. I thought maybe the traffic was light at that time.” (#266870)
The Captain of Flight 522 adds:
“No matter how it happened, this is a classic illustration of how dangerous similar callsigns can be, and how a very simple slip by a pilot or controller could result in disaster. My personal feeling is that, given the number of similar callsigns that I hear, my company does not work very hard at ‘de-conflicting’ them…The current efforts still leave many problems out there looking for the worst possible time to happen.” (#266985)
“If I Called the Wrong Number, Why Did You Answer the Phone?”
No one factor “causes” the situations reported here. Rather, as can Innumerable Numbers been seen in the above report, a com The Aviation Safety Reporting Sysbination of factors on both sides of tem (ASRS) receives a large number of the radio leads to incidents. The pur reports regarding callsign similarities pose of this article is to inform readers and confusion, as air traffic and radio where aircraft callsigns come from, transmissions increase. Most reports and how similar callsigns can compli indicate only momentary confusion or cate communication. minor infractions of a clearance. Oth
ers relate incidents as severe as near midair collisions (NMACs) or serious losses of separation.
with Marcia Patten

Numbers are always a potential problem in aviation as they can refer to altitudes, airspeeds, headings, frequencies, transponder codes, flight numbers or various other flight elements. ATC instructions full of numbers are often delivered rapid-fire, received and read back by a pilot in a noisy cockpit, then heard back and accepted by a harried and hurried controller. At some time in their careers, most pilots have been waylaid by all the numbers in a clearance such as, “Aircraft 46261, cleared for takeoff runway 26, wind 250 at 16 knots, turn left heading 210, climb to 2,600 feet, squawk 1216, contact departure on 126.2.” (Another article on “the number crunch” can be found in ASRS Directline #2, Fall 1991, “One Zero Ways to Bust an Altitude.”)
Letters may pose a problem, too. B, C, D, E, G, P, T, V, and Z are the largest group of letters that can be easily misheard. Other similar-sounding letters include M and N, I and Y, F and S, and A, J, and K. Proper use of the phonetic alphabet can eliminate much of the confusion of similar sounds. Still, similar-sounding words may be misunderstood, especially when transposed, for example, Delta Alpha and Alpha Delta, and Kilo Echo and Echo Kilo.
Take a Number, Please Where do aircraft numbers come
from? FBOs, general aviation aircraft, and most non-scheduled air taxis use the aircraft tail numbers or N-numbers (the numbers or the number-and-letter combination) as their radio callsigns. Most scheduled air taxis and commuter and air carrier airlines use flight numbers rather than N-numbers as their callsigns.
The FAA does not assign the flight numbers used by most air carriers and commuters. If it did take on this task, it would probably have as much difficulty as the air carriers themselves. Assignment of flight numbers is typically a function of an airline’s marketing department. Sometimes it appears that Marketing chooses the quickest, easi
est method of assigning numbers to newly-created flights. Consequently, some flight numbers have only one number that is different, some have numbers that are transposed, some just happen to sound similar, even though they may contain few, if any, of the same numbers. This problem appears to be increasing, as airline mergers and buyouts have led to operators blending flights under the same carrier name, but with a decreasing pool of available flight numbers.
For example, air carrier A buys commuter B and gains 30 new flights per day. The easiest way to assign flight numbers is to take a block of unused numbers, say, 4101-4130, and assign those numbers in order of departure time. Often odd numbers are assigned to one compass direction, and even numbers assigned to the opposite direction. This can apply to North-South flights and to East-West flights. So, for our fictitious air carrier A, SFO-PDX flights could be 4101, 4103, 4105, etc., and PDX-SFO flights could be 4102, 4104, 4106, etc. If air carrier C, which may also have undergone mergers, also has flights to and from PDX or SEA at approximately the same times using the same or similar block of numbers, there is a potential for major confusion while these aircraft are sharing the same airspace.
The FAA does assign aircraft tail numbers. Usually the numbers are assigned at random. However, owners or operators of corporate, FBO, or air taxi aircraft may request specific or “personalized” N-numbers, like many state vehicle license plates. The result can be a whole family of aircraft with similar or similar-sounding numbers and letters. These aircraft look very impressive sitting all in a row on the ramp, but their numbers can create a nightmare for both pilots and controllers if several of the aircraft depart in the same direction at the same time.
Issue Number 8 7

What is Similar? “Similar” generally means having a
resemblance to one another or to something else, or like but not completely identical.
What seems or sounds similar to one person may not sound similar to another. Hence, a pilot may be utterly confused about which aircraft a controller is giving instructions to, while the controller is frustrated and impatient with the pilot’s hesitation or failure to comply with an instruction. What sounds similar to a pilot in a noisy cockpit may not appear to be a problem to a controller looking at a radar scope. Likewise, a controller looking at flights 404, 1441, and 4124 on flight progress strips or a radar screen may feel muddled with all the similar numbers, while the pilots of these flights may not have any trouble hearing their respective flight numbers called out to them.
Aircraft with similar callsigns arriving or departing a destination at the same time sets the stage for a mix-up. Even with a thorough understanding of the potential for confusion, this Captain admits to being caught off-guard on occasion:
✍ “Every morning, air carrier A flight 123 leaves [one airport] while air carrier B flight 123 leaves [a nearby airport], both headed for the same destination… Both flight crews of both flights have been aware and alert for the obvious probable problems of this situation. In spite of their alertness, at least a dozen clearances to one of the aircraft have been read back or at least questioned by the other. On one occasion, the wrong aircraft left its cruise altitude based on the clearance intended for the other.”
From his recommendation, it sounds as if the Captain has given up on company avenues, and is seeking ATC intervention:
“If the operators cannot prevent this type of situation, each ATC Center should not accept two or more aircraft with the same numbers in the callsign.” (#210928)
Similar Numbers + Human Error = Callsign Confusion
Although the callsign problem originates in the management arena, flight crews and controllers add human error to the equation. Any number of human factors can combine to cause miscommunication.
Say What? Overall radio and communication
technique appears to be a major contributor to callsign confusion. Use of an abbreviated callsign, although a common practice and completely legal, can invite a misunderstanding. Related to communication technique is the issue of readback/hearback, frequently cited in reports of callsign confusion. Often this is a case of selective listening—a pilot’s expectation of a particular clearance, and a controller’s expectation of a correct clearance readback.
✍ “Operating flight 961, we received and acknowledged a clearance… A few minutes later a flight 691 received and read back the same clearance. I commented on the similar callsigns and asked the other crew members to listen carefully. A short time later, the Controller…asked us to stop our descent…and said something to the effect, ‘I believe that clearance was for another aircraft.’ Nothing more was said on the radio and there appeared to be no conflict.
“This is a classic example of the confusion that arises when there are similar callsigns in the same airspace. Everyone hears what they expect to hear. If the Controller misstates a callsign, he probably will expect to hear a readback from the aircraft he intended to address and the mistaken readback will not register. If a pilot is expecting a clearance, he can mishear a callsign. I have heard more errors recently involving the transposition of callsigns (961 versus 691), than errors between similar sounding callsigns (1468 versus 468). Everyone must listen carefully to clearances and readbacks and, to the extent possible, the airlines must try to separate similar callsigns.” (#268738)
8 Issue Number 8

Too Busy to Listen Workload and fatigue, particularly
in bad weather, can take their toll on people’s ability to concentrate and perform to the usual standards. For flight crews, fatigue can be the culmination of schedule pressures, long days, and multiple takeoffs and landings at the same airport with quick turnarounds. The addition of frequency congestion can seriously muddle communication.
✍ “There were three aircraft on frequency with similar sounding callsigns. We all had been ‘stepping on’ each other’s radio transmissions and on Center. The callsign of the other aircraft was very similar to our callsign on our [previous] leg (this was our seventh and last leg of the day).” (#268344)
High traffic volume, the presence of airline hubs, and combined position operation (for example, working Ground and Tower simultaneously) can overload ATC personnel and leave pilots frustrated, as the next report illustrates:
✍ “I believe the Controller was working 2 frequencies and the fact that there were similar flight numbers on each frequency were the contributing factors. Controllers working separate frequencies make it very difficult for us to maintain as high a situational awareness as we could. On a single frequency we are able to hear if another flight answers the Controller’s instructions when we think the instructions are for us. That raises the question in our minds and we are able to ask, ‘Was that last call for us?’ Similar flight numbers, be it on a single frequency or separate frequencies, are a major drawback.” (#246226)
Juggling Act Modern electronics—GPWS, TCAS,
FMS, and ACARS, for example—abound in an aircraft cockpit. All that complex equipment, as well as cockpit checklists, company communications, and PA announcements, may produce additional distractions for pilots trying to listen for critical radio transmissions. A Captain provides an example of distraction and divided attention:
✍ “The copilot…turned the radios over to me so he could do a passenger announcement. I acknowledged a frequency change. I then checked in to the new frequency, using the callsign of my previous flight. The Controller, who I think was expecting me, gave me a clearance for the correct callsign. I acknowledged, apologized for the mistake, and continued without incident. In retrospect, I feel I was too quick to accept the clearance. I could have easily taken someone else’s clearance…You lose your system of double check when one pilot is off the air getting ATIS, doing a passenger announcement, or talking with company.” (#292850)
Confusion Conclusions
✔ Phraseology. Communication technique is still pilots’ and controllers’ primary defense. Use of proper phraseology with full callsigns in every radio transmission can eliminate many of the types of miscommunications cited here.
✔ Attention Management. Attentiveness to radio traffic and timeliness of transmissions can ease frequency congestion.
✔ Cockpit Communication. Communication within the cockpit can be critical—all crew members need to be “in the loop” at high workload times or during crucial radio communications to prevent read-back/hearback errors. Whenever there is doubt about a clearance or instruction, crews should clarify the matter among themselves and with ATC.
Issue Number 8 9

✔ Procedures. Adherence to procedures can also play a major role in alleviating callsign confusion. Careful readback and confirmation of clearances are all-important. Pilots and controllers both need to question transmissions that are out of the ordinary or don’t sound “right,” and ask for a repeat if a transmission is not clear or may have been stepped on.
✔ Technical Solutions. Technical improvements may help some aspects of the problem. Pre-Departure Clearances (PDCs) have cut down somewhat on congestion of the clearance delivery frequencies, but the FAA has not yet provided a system for confirmation or acknowledgment of the correct clearance being correctly received by the flight crew. (For more information, see ASRS Directline #5, Spring 1994, “PDCs—the Problems with Pre-Departure Clearances.”) Data Link may improve problems related to frequency congestion, blocked transmissions, speech rate, foreign and regional accents, and pronunciation (manner of speech) and enunciation (speaking distinctly or with clarity). Human error can still occur, however, in keying the input into the Data Link system, or in trying to read a poorly-lit ACARS screen or a poor quality print-out.
✔ Company Policy. Company planning and marketing departments in all segments of aviation (air carriers, commuters, corporate departments, and FBOs) need to be mindful of the potential for callsign confusion.
• For air carriers assigning a new block of flight numbers, a quick check of the Official Airline Guide might help determine if conflicts exist with other aircraft using similar numbers along the same routes, or into and out of airports at the same time. Coordination between a company and its regional affiliate can eliminate a situation such as Company B 454 and Company B Express 1454 arriving at the same destination at the same time.
• For non-air carriers using sequential tail numbers or transposed tail numbers (e.g., 58SH/ 68SH or 404SH/404HS), a request for assignment of less-confusing but still meaningful N-numbers might be an option.
Dealing with Conflict Currently, pilots can go through
channels within their companies to request changes for numbers that are a problem. Pilots might also consider taking this issue to ALPA or ATA, to bring attention to the situation in an industry-wide forum. This might encourage more coordination between airline companies. Controllers have the option of talking to their supervisors about ongoing problems with similar callsigns, and the supervisors can take a case to airline representatives. But there is no promise of action. Pilots and controllers need to continue to bring callsign problems to the attention of management, and as always, all are encouraged to submit reports to ASRS. _
10 Issue Number 8

by Roy Chamberlin, Charles Drew, Marcia Patten, & Robert Matchette
“AS I was approaching Gate XX, I shut down the #2 engine (per our Ops Manual). I was momentarily distracted inside the cockpit…When I looked back outside, I saw about four ramp per
sonnel around one of our gates, so I turned into that gate. One of the ramp personnel jumped up and crossed his arms, so I stopped the airplane. It was Gate XY, not XX. There was enough room to make a turn to the left to taxi over to Gate XX. I added power on the #1 engine. I did not notice the power setting, as I was clearing outside to my left.
During the left turn, the jet blast from the #1 engine blew a mechanic off a maintenance stand. It also blew part of an engine cowling off the stand.
Perhaps if I had not been so focused outside, I would have been more aware of my power application. In future situations, I will…shut down and use a tug to reposition if there is any doubt about jet blast.” (#260480)
Airport Ramp Safety has been given much attention recently in reports and papers by a number of safety organizations. In spite of their efforts, and those of air carrier safety departments, damage to aircraft and ground equipment and injury to personnel continue to occur during ramp operations. A safety specialist from the United Kingdom Flight Safety Committee stated the loss in terms almost everyone can understand: worldwide, the dollar equivalent of fifteen Boeing 747-400s is lost each year to equipment damage during ramp operations.1
Since 1986, the Aviation Safety Reporting System (ASRS) has received more than 370 incident reports describing equipment damage and personnel injury during ramp operations.
A detailed study of 182 relevant reports was undertaken to further identify the major areas of risk in ramp operations, and the flight crew and ground crew performance factors that contributed to these events. To be included in the set of relevant reports, an incident had to meet each of the following criteria: 1) involve a ramp operation of an FAR Part 121 or Part 135 aircraft, or a two-crew corporate aircraft; 2) mention damage to aircraft or ground equipment, or injury to flight or ground personnel or passengers; and 3) directly involve the flight crew (that is, the flight crew occupied the cockpit at the time of the incident, and their actions or inactions may have contributed to the incident).
Footnote: 1. This damage estimate was cited in the closing remarks by Harry Hopkins, the former chairman of the United Kingdom Flight Safety Committee (UKFSC), at the committee’s annual seminar held in November, 1994. The focus of the 1994 seminar was “Ramp Accidents: The Problem, the Key, and the Cure.”
Issue Number 8 11

Setting the Stage As expected relative to the selection
criteria, 80% of the reports were from Part 121 primary air carriers, and 87% of the incidents occurred during passenger-carrying operations. Nearly all the reporters were flight crew; only one report from a ground crew member was in the study set. Specific environmental factors were studied to determine to what extent they influenced the occurrence of ramp incidents. The time of day, month of the year, location (city and state), and weather conditions referenced in the study set generally mirrored the distribution of those factors in the nearly 60,000 full-form records in the ASRS database. Overall, environmental factors do not appear to be directly relevant to the reported ramp incidents.
Where and When At first glance, one might expect an
even distribution of ramp incidents during arrivals and departures. However, in the study set, the aircraft was making its arrival at the time of the incident in 58% of the reports and its departure in 35% of the reports (another 7% encompass miscellaneous events, such as gate changes, power-outs, etc.). Different procedures–or lack of procedures–during arrival and departure may account for this disparity.
On arrival, the ramp procedures may be loosely defined. The flight crew is often no longer in contact with ATC, or even with company ramp control, once the aircraft transitions to the company gate area. Further, the flight crew communications with ground crew are likely to be primarily visual (hand signals or guide light systems).
In contrast, departure operations tend to be controlled by procedures and checklists. The flight crew is usually in radio contact with ATC or company ramp control before any aircraft movement begins from the gate. In addition, there is more likely to be verbal communication with the ground crew during the early segments of a departure procedure. In spite of increased levels of communication, a misunderstanding placed the next crew’s 747 in the path of another 747, causing damage to both aircraft:
✍ “We were cleared to push after Airline A taxied by. We began pushback after an Airline A DC-10 passed by, but Ground Control said ‘Not that one, the B-727.’ They instructed the tug driver to pull us back into the gate [to let an Airline Y B747 pass]. We started forward and…our right winglet was struck by the 747’s left winglet. Ground Control had told Airline Y ‘Caution for the aircraft pushed out from the gate.’ Airline Y [acknowledged] just before he clipped us. Airline Y continued to the runway apparently unaware of the contact until Tower told him.” (#278114)
12 Issue Number 8

Issue Number 8 13
As shown in Figure 1 (above), the Ramp Entry or Exit Area—the area ad ground crew guidance for clearance jacent to a taxiway and leading to or from obstacles and for final taxi infrom a company ramp—was the site of structions. This guidance is often hand the incident in 18% of the study set. signals from ground crew personnel in Aircraft operating in this area are usu the form of an all-clear salute, or sigally in communication with, and un nals from parking or guidance light der the control of, ATC. Another 39% systems mounted on the terminal of the incidents occurred at the Gate building. Entry or Exit Area, where taxi lines It is interesting to note that there converge leading into or out of the were more incidents in the gate stop gate area. In this area, an aircraft is area during arrival (48%) than during less likely to be in communication departure (31%). A possible explanawith some controlling agency, and tion is that there are more obstacles to may now be relying on a company encounter when entering the more ramp control procedure or ground congested area next to gates and tercrew input for guidance. The largest minal buildings. It was also noted percentage of the incidents, 43%, oc that there were fewer incidents on curred within the Gate Stop Area, that the ramp fringe areas during arrival is, within 20 feet of the nosewheel (13%) than during departure (30%). parking line. At this point, the flight This may be related to the large crew is usually relying entirely on number of pushback, power-out, and
power-turn procedures occurring during departure operations.

Damage Occurrence Ground equipment, and by associa
tion, ground personnel, appear to be most vulnerable to damage or injury in ramp operation incidents. Ground equipment in general was the clear “loser” in the reported incidents, as depicted in Figure 2. Ground equipment damage occurred most often in the gate stop area, less so in the gate entry/exit areas, and rarely on the ramp fringe areas.
In contrast, aircraft-to-aircraft damage usually occurred in the ramp and gate entry/exit areas, where the taxiing aircraft were sharing the common maneuvering area and were likely to be in radio contact with a controlling agency. Damage to aircraft at the gate stop area was less common in Part 121 operations than Part 135.
D
There were 15 reports of injury to personnel, and two-thirds of those injured were ground crew members. Although this number does not seem substantial, it obviously represents a substantial impact in the lives of the persons who were injured. It also represents a potentially large financial loss to the company in flight delays, employee lost-time, insurance, medical, and other costs.
The Main Players Reporters stated that they were pro
vided with ground personnel for ramp guidance in 64% of the incidents. The marshaler is the “PIC” of the ground crew, and has primary responsibility for correct signals being passed to the flight crew. The marshaler is often a relatively senior member of the ground crew, and usually has received specific training for this position. Other ground crew members may have varying degrees of training and experience in their positions. These positions include:
• one or more wingwalkers, who are often baggage handlers or other ground crew members.
• a tug driver, who must watch both the aircraft and the other ground personnel during the tow or push operation.
• a chock handler, whose position may be covered by a marshaler or a tug driver.
14 Issue Number 8
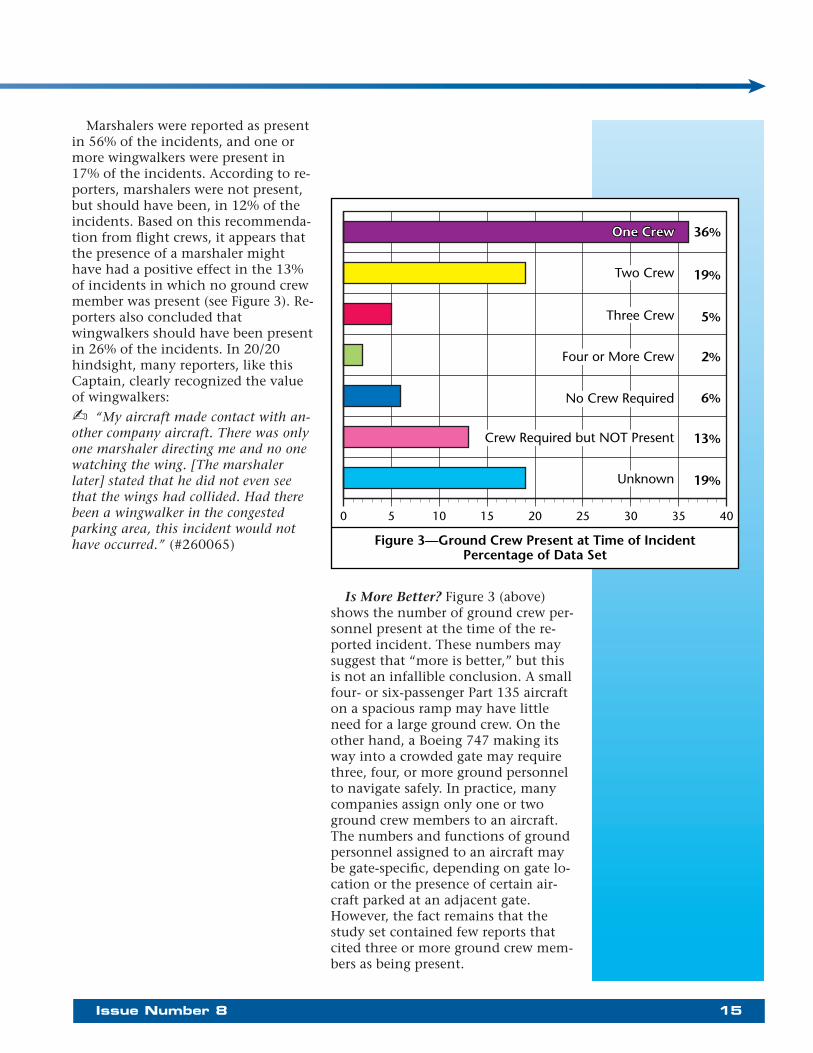
Marshalers were reported as present in 56% of the incidents, and one or more wingwalkers were present in 17% of the incidents. According to reporters, marshalers were not present, but should have been, in 12% of the incidents. Based on this recommendation from flight crews, it appears that the presence of a marshaler might have had a positive effect in the 13% of incidents in which no ground crew member was present (see Figure 3). Reporters also concluded that wingwalkers should have been present in 26% of the incidents. In 20/20 hindsight, many reporters, like this Captain, clearly recognized the value of wingwalkers:
✍ “My aircraft made contact with another company aircraft. There was only one marshaler directing me and no one watching the wing. [The marshaler later] stated that he did not even see that the wings had collided. Had there been a wingwalker in the congested parking area, this incident would not have occurred.” (#260065)
Is More Better? Figure 3 (above) shows the number of ground crew personnel present at the time of the reported incident. These numbers may suggest that “more is better,” but this is not an infallible conclusion. A small four- or six-passenger Part 135 aircraft on a spacious ramp may have little need for a large ground crew. On the other hand, a Boeing 747 making its way into a crowded gate may require three, four, or more ground personnel to navigate safely. In practice, many companies assign only one or two ground crew members to an aircraft. The numbers and functions of ground personnel assigned to an aircraft may be gate-specific, depending on gate location or the presence of certain aircraft parked at an adjacent gate. However, the fact remains that the study set contained few reports that cited three or more ground crew members as being present.
Issue Number 8 15
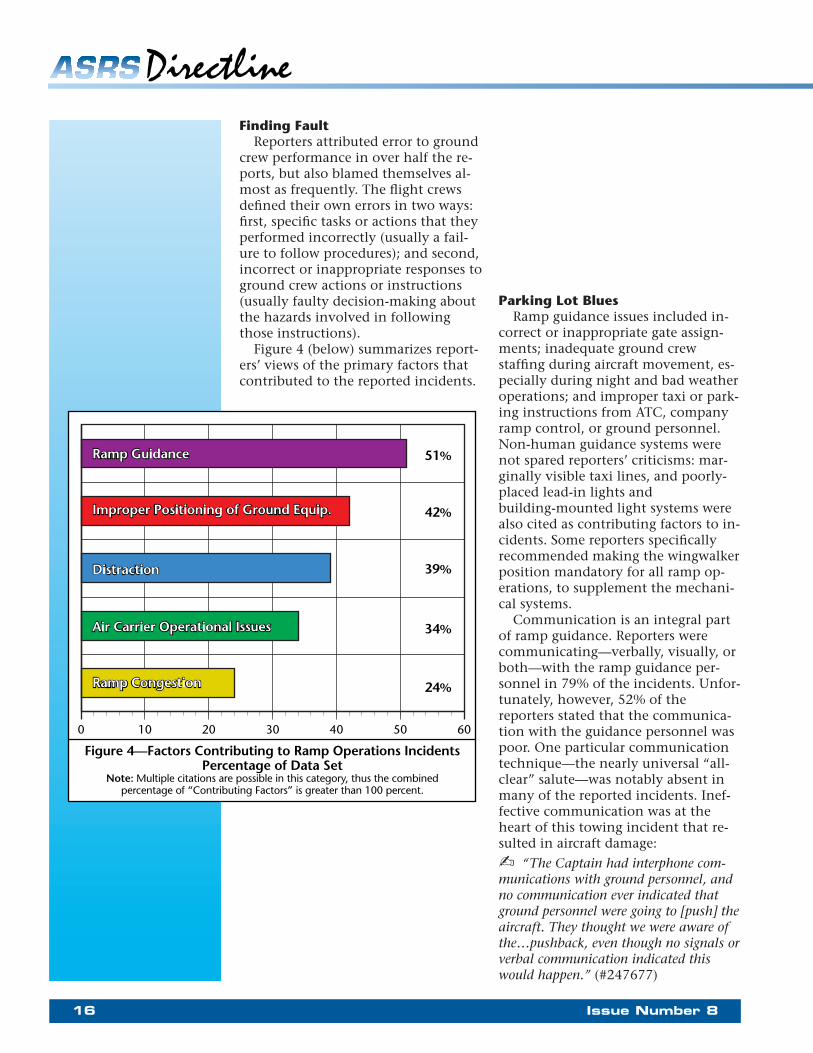
Finding Fault Reporters attributed error to ground
crew performance in over half the reports, but also blamed themselves almost as frequently. The flight crews defined their own errors in two ways: first, specific tasks or actions that they performed incorrectly (usually a failure to follow procedures); and second, incorrect or inappropriate responses to ground crew actions or instructions (usually faulty decision-making about the hazards involved in following those instructions).
Figure 4 (below) summarizes reporters’ views of the primary factors that contributed to the reported incidents.
Parking Lot Blues Ramp guidance issues included in
correct or inappropriate gate assignments; inadequate ground crew staffing during aircraft movement, especially during night and bad weather operations; and improper taxi or parking instructions from ATC, company ramp control, or ground personnel. Non-human guidance systems were not spared reporters’ criticisms: marginally visible taxi lines, and poorly-placed lead-in lights and building-mounted light systems were also cited as contributing factors to incidents. Some reporters specifically recommended making the wingwalker position mandatory for all ramp operations, to supplement the mechanical systems.
Communication is an integral part of ramp guidance. Reporters were communicating—verbally, visually, or both—with the ramp guidance personnel in 79% of the incidents. Unfortunately, however, 52% of the reporters stated that the communication with the guidance personnel was poor. One particular communication technique—the nearly universal “allclear” salute—was notably absent in many of the reported incidents. Ineffective communication was at the heart of this towing incident that resulted in aircraft damage:
✍ “The Captain had interphone communications with ground personnel, and no communication ever indicated that ground personnel were going to [push] the aircraft. They thought we were aware of the…pushback, even though no signals or verbal communication indicated this would happen.” (#247677)
16 Issue Number 8

It is interesting to note that in 85% of the reports, the reporter’s aircraft was moving at the time of the incident, and that 80% of these movements were considered “normal.” In almost half of these incidents, the flight crew reported that a ground crew member was still signaling “come ahead,” even after the aircraft had come into contact with an item of ground equipment. This type of miscommunication is illustrated in a report excerpt from a Part 135 Captain:
✍ “…taxiing to the right of the taxi line, marshaler was on First Officer’s side. Lighting was poor. A commissary truck was adjacent to another truck. I felt I had at least 3 feet of wingtip clearance…[then] I looked to see the wingtip coming off the back of the truck. All the time, the marshaler was still giving me straight ahead.” (#258353)
Related to ramp guidance is the issue of ramp congestion. Increasing numbers of flights, stringent aircraft scheduling requirements, and efforts to squeeze large jets into gates originally designed for much smaller aircraft, contribute to traffic jams and tight quarters on the ramp. The combination of ramp congestion and lack of staffing were the precursors to this Captain’s tale of hitting a cargo loader:
✍ “[Returning to the gate], we had a single marshaler guiding us in. After just passing through some congested areas on the other side of the airport, I figured we had had practice at judging how close things were to the wingtip. Misplaced confidence…” (#201610)
No Parking Zone Improper or premature positioning
of ground equipment was another major factor contributing to incidents. Reporters cited that ground equipment was sometimes parked outside the marked areas, thus encroaching on aircraft movement areas. Some reporters pointed out that the flight crew is usually unable to determine whether ground equipment is parked outside the aircraft movement area, and so must rely on vehicle drivers and jetway operators to keep their equipment within the equipment foul lines.
Other reporters noted that some aircraft support vehicles and jetways had been moved toward the aircraft before it had stopped at the designated stop point, and before the crew had given an “all-clear” signal (usually by turning off the aircraft’s rotating beacon). Such was the case in the following report:
✍ “…ground taxi director directed a stop using a light signal, four to six feet short of normal gate position. Very shortly thereafter, a green light indicated continue taxi. After moving about one foot, the aircraft contacted something. A fuel truck had moved forward of the right wing when the aircraft stopped the first time.” (#222895)
Issue Number 8 17

Activity Overload Reporters often mentioned distrac
tion due to cockpit duties, ATC or company communication, checklists, and fatigue. Some reporters continued with an operation even when something didn’t look right, or was blatantly wrong. Flight crews also admitted to failing to request a tug to get into, or out of, a tight parking place. The latter two problems may have been responses to schedule pressure or to demand for on-time performance, also mentioned by many flight crew members as an underlying cause of incidents.
These and other sources of distraction also caused a marked reduction of cockpit coordination and CRM skills. A plane’s rear airstairs received damage when the crew became distracted by multiple demands, and failed to act as a team:
✍ “[This incident was caused by] distractions in the cockpit, plus a desire to operate on schedule. There were several conversations going on from inside and outside the aircraft. Raising the airstairs is a checklist item…backup is another checklist item which requires the Second Officer to check a warning light. No one noticed the light. The pushback crew consisted of 2 wing observers plus the individual in the tug…all failed to observe the rear stairs.” (#264692)
Procedures Roulette Reporters identified two types of air
carrier operations management issues: some cited instances of a crew’s failure to follow an established policy or procedure; others referred to a lack of established procedure. In the following report, the crew followed one company procedure—requesting a tow-in on an icy ramp; however, misunderstandings about a new towing procedure paved the way for a ramp incident:
✍ “Tow crew did not follow their checklist (unknown to us that they even had one for that situation), and did not challenge us to switch off hydraulic pressure to nosewheel. We overlooked it—new situation, no checklist or SOP for it. They hooked up, and called for brake release a little sooner than I expected. Result was a broken tow bar connection on the nose-wheel. I should have retained command of the aircraft until I was satisfied we were all ready for tow in.” (#264610)
Reporters offered suggestions for alleviating some of these procedural errors—for example, that simulator training in ramp operations and push-back procedures be instituted for pilots, and that both flight crews and ground crews receive parallel training (that is, each group receive the same information and training that is provided the other). Parallel training would promote a clearer understanding of flight/ground crew responsibilities and expectations during ramp and gate operations.
18 Issue Number 8

Recommendations for Reducing Ramp Operation Incidents
There are a number of actions that air carrier managers can take to reduce ramp incidents. The following recommendations are based on the findings presented above and on suggestions from a panel of highly-experienced ASRS analysts.
• Require certification for the marshaler and wingwalker positions.
• Provide scenario-based training for ground crews, using ramp incident reports available from the ASRS database.
• Increase the use of radio communications between flight and ground crews.
• Maintain paint lines, taxiway markings, and light guidance systems in highly visible condition.
• Establish and enforce speed restrictions and communications procedures for vehicles drivers.
Ultimately, however, the responsibility for safe operation of the aircraft rests with the flight crew. Therefore, regardless of any actual or assumed inadequacy on the part of management or the ground crew, it is up to the flight crew to take action to prevent incidents. The discussion presented above suggests the following preventive actions for flight crews:
• Perform a flight crew briefing of the gate entry or exit procedure. Follow the established procedure for operation at that gate. Reaffirm cockpit coordination and CRM techniques.
• All flight crew members should maintain an outside scan during aircraft movement. Be self-aware when judging ground equipment clearance. Any portion of the operation that doesn’t “feel right” probably isn’t right!
• Be particularly wary of faded or painted-over foul lines, the use of orange cones to mark foul lines or taxi lanes, or reflections on guidance light systems.
• If no taxi guidance is provided, a “no taxi” situation exists. Wait for an “all-clear” salute or other specific guidance (which may include the “all-clear” salute), from the person identified as having the authority and responsibility for marshaling the aircraft. If the marshaler is lost from sight, a “no taxi” situation again exists.
• Use wingwalkers if ramp congestion is even a remote consideration. One is good; two are better. However, consider that the marshaler may be focusing on the nosewheel position rather than watching the wingwalkers.
• Be aware that the marshaler may be unable to see wingwalkers.
• Recognize that ground crews may be unable to communicate verbally with each other or with vehicle drivers.
• Finally, in the words of a United Kingdom Flight Safety Committee member, remember that “during ramp operations, everything is alright until is isn’t alright!” _
Issue Number 8 19
Statistical Charts Year of Occurrence ..... 22
Reporting Sources ...... 23
Month of Occurrence .. 24
Weekday of Occurrence ................. 25
Time of Day of Occurrence ................. 26
Involved Facilities ........ 27
Involved Airspaces ...... 28
Anomalies (Top Level Categorization) ........... 29
Airborne Spatial Deviations & Conflicts . 30
Ground Incidents ......... 31
Non-Adherence to Rules & Requirements .......... 32
Other Aircraft Anomalies ................... 33
ATC Handling Anomalies ................... 34
ASRS Database
Statistics Introductory Note Regarding ASRS Database Statistics
ASRS codes descriptive characteristics of every re
port it receives and places that information in a computerized database. We code the function of the person who submitted the report; the place and time of the reported incident; and the descriptive nature of the occurrence. Following are 13 pages of graphs and statistics portraying these and other data.
Time Frame The data presented are for two spe
cific time periods—a 1-year period from January 1994 through December 1994, and a 7-year period from January 1988 through December 1994. The reader will see that, with few exceptions, the 1-year and 7-year data are remarkably similar, with few changes in percentages.
Relationship of ASRS Data to All Aviation Incidents
ASRS reports are voluntarily submitted and are not obtained through a statistically valid sampling process. Thus, the ASRS cannot specify the relationship between its database and the total volume of aviation safety incidents that occur, nor can it say with certainty that this relationship has remained fixed over time. This is known as the self-reporting bias problem.
However, the ASRS can say with certainty that its database provides definitive lower-bound estimates of the frequencies at which various types of aviation safety events actually occur. For example, 34,404 altitude overshoots were reported to the ASRS from January 1988
through December 1988. It can be confidently concluded that at least this number of overshoots occurred during the 1988-94 period—and probably many more. Often, such lower-bound estimates are all that decision makers need to determine that a problem exists and requires attention.
Known Biases We are aware of two prominent fac
tors that bias ASRS statistical data. The first is the relatively high number of reports received from pilots (currently about 96 percent of ASRS report intake) versus controllers (roughly 3 percent). This imbalance causes the ASRS database to have many more records describing pilot errors (altitude deviations, runway transgressions, etc.) than controller errors (operational errors, coordination failures, etc.).
The second biasing factor is the computerized error detection capabilities at FAA Air Route Traffic Control Centers (ARTCCs). These are very effective at capturing altitude and track deviations that result in a loss of aircraft separation. Thus, the ASRS receives disproportionately large numbers of reports describing these kinds of events, mostly from pilots.
20 Issue Number 8
Number of Reports vs. Number of Incidents
Many incidents are reported by more than one individual. For example, an incident may be reported by a pilot and a controller, several pilots and several controllers, the entire flight crew of a given aircraft, and pilots of more than one aircraft. In 1994, ASRS received 32,272 reports describing 26,413 unique incidents; thus, 5,859 reports were “secondary,” in that they described incidents which had already been reported to the ASRS.
Total and Percent Distributions Multiple entries are permitted in many of the data
fields coded by ASRS analysts. For example, an altitude bust that resulted in a loss of standard separation would be coded in the Anomaly field as an altitude deviation, an airborne conflict, and an ATC clearance violation. While this is the most accurate way of coding events, it means that incidents do not fall into neat, mutually exclusive categories that always add up to 100 percent. Moreover, it is not unusual for selected data fields to be left blank during coding, either because needed information is not available, or because the field is not deemed relevant to a particular report. This presents an added complication when incidents are totaled and percent distributions are calculated.
The first chart in the following pages shows the number of unique incidents reported to the ASRS over the past 7 years. This provides a baseline for interpreting data in succeeding charts which characterize the time, location, and other aspects of the reported incidents. The data in these latter tables are presented in a consistent format that provides for unknown or inapplicable data, and for cases in which more than one category applies. An example is shown below in the hypothetical table.
In this example, incident records are categorized as A, B, or C. Any incident may be placed in one, two, or even three of these categories. If categories A, B, and C are simply added together, incidents that are recorded in more than one category will be double-counted in the “Total Row.” Since double-counting is usually unwanted in summations, the totals have been adjusted to eliminate double-counted events. The results are presented in the row entitled Total Unique Incidents.
Thus, in the Hypothetical Example Table, a total of 165 incidents were reported during the current time period. This is the Incident Base for that period. Out of the Incident Base, 127 unique events fell into categories A, B, or C, or some combination of these categories. The remaining 38 incidents did not fit any of the categories, or there was insufficient data to classify them. These are shown in the Inapplicable or Unknown row.
Because the number of Total Unique Incidents varies from table to table, we decided to use the Incident Base to calculate percent distributions for all data sets. By calculating the percentages in this matter, we created a common yardstick which can be used to compare the data presented in the various charts.
Finally, all of the percentages shown were rounded to whole numbers. In those cases where the number of relevant incidents is very small (less than one-half of one percent) the percentages round down to, and are presented as, zero percent. Similarly, in those cases where the number of reports in a category exceed 99.5 percent of the Incident Base, the result was rounded up to, and is presented as, 100 percent. _
Hypothetical Example Table
Data Category 1993 Jan ’87 through Dec ’93
Incidents % of Incident Base Incidents % of Incident Base
Category A 22 13% 1,207 12%
Category B 39 24% 2,945 29%
Category C 83 50% 5,352 52%
Total Unique Incidents 127 77% 7,698 75%
Inapplicable or Unknown 38 23% 2,509 25%
Incident Base 165 100% 10,207 100%
Issue Number 8 21
Year of Occurrence
1988 1989 1990 1991 1992 1993 1994
Period of Occurrence
Reported Incidents
Year Total Cumulative
1988 16,384 16,384
1989 24,953 41,337
1990 27,731 69,068
1991 25,037 94,105
1992 25,869 119,974
1993 24,411 144,385
1994 26,413 170,798
22 Issue Number 8
30,000
25,000
20,000
15,000
10,000
5,000
0
Incident Base

Reporting Sources
Pilot /D Pilot /D Pilot /D Controller All Other Air Carrier General Aviation Other
Reporters 1994 1988 through 1994
Incidents % of Incident Base Incidents % of Incident Base
Pilot/Air Carrier 16,996 64% 108,110 63%
Pilot/General Aviation 7,196 27% 49,023 29%
Pilot/Other 1,040 4% 6,140 4%
Controller 986 4% 6,888 4%
All Other 296 1% 1,271 1%
Total Unique Relevant 26,375 100% 170,607 100%
Irrelevant or Unknown 38 0% 191 0%
Incident Base 26,413 100% 170,798 100%
Issue Number 8 23
70%
0%
1994D
1988 through 1994
60%
50%
40%
30%
20%
10%
Note: Roughly 20 percent of incidents were reported by more than one person,D for example, two pilots reporting the same NMAC.
Month of Occurrence
0%
15%
10%
5%
1994D
1988 through 1994
Jan Feb Mar Apr May Jun Jul Aug Sept Oct Nov Dec
Month
1994 1988 through 1994
Incidents % of Incident Base Incidents % of Incident Base
January 1,878 7% 13,042 8%
February 1,798 7% 12,777 7%
March 2,196 8% 14,776 9%
April 2,198 8% 14,054 8%
May 2,255 9% 14,256 8%
June 2,427 9% 14,763 9%
July 2,423 9% 15,020 9%
August 2,413 9% 15,332 9%
September 2,167 8% 13,873 8%
October 2,277 9% 14,974 9%
November 2,286 9% 14,188 8%
December 2,095 8% 13,383 8%
Total Unique Relevant 26,413 100% 170,438 100%
Irrelevant or Unknown 0 0% 360 0%
Incident Base 26,413 100% 170,798 100%
24 Issue Number 8

Weekday of Occurrence
15%
10%
5%
0% Sunday Monday Tuesday SaturdayWednesday Thursday Friday
1994
1988 through 1994
Weekday
1994 1988 through 1994
Incidents % of Incident Base Incidents % of Incident Base
Sunday 3,517 13% 22,580 13%
Monday 3,805 14% 24,140 14%
Tuesday 3,740 14% 24,338 14%
Wednesday 3,809 14% 25,481 15%
Thursday 4,045 15% 26,228 15%
Friday 4,088 15% 26,426 15%
Saturday 3,390 13% 21,413 13%
Total Unique Relevant 26,394 100% 170,606 100%
Irrelevant or Unknown 19 0% 192 0%
Incident Base 26,413 100% 170,798 100%
Issue Number 8 25

Time of Day of Occurrence
0001-0600 hours D 1201-1800 hours0601-1200 hours 1801-0000 hours
Time of DayD 1994 1988 through 1994 (Local Time) Incidents % of Incident Base Incidents % of Incident Base
0001-0600 hours 702 3% 3,961 2%
0601-1200 hours 9,185 35% 58,837 34%
1201-1800 hours 10,479 40% 69,685 41%
1801-0000 hours 5,559 21% 37,114 22%
Total Unique Relevant 25,925 98% 169,597 99%
Irrelevant or Unknown 488 2% 1,201 1%
Incident Base 26,413 100% 170,798 100%
26 Issue Number 8
50%
0%
1994D
1988 through 1994
40%
30%
20%
10%

Involved Facilities
Airport Control TowerD TRACON CenterD NavigationD FSS andD (ATCT) (ARTCC) Aids Other
Involved Airspace 1994 1988 through 1994
Incidents % of Incident Base Incidents % of Incident Base
Airport 6,343 24% 39,673 23%
Control Tower (ATCT) 6,172 23% 35,530 21%
TRACON 9,299 35% 63,212 37%
Center (ARTCC) 8,155 31% 57,791 34%
Navigation Aids 22 0% 205 0%
FSS and Other 121 1% 719 0%
Total Unique Relevant 26,314 100% 170,043 99%
Irrelevant or Unknown 99 0% 755 0%
Incident Base 26,413 100% 170,798 100%
Issue Number 8 27
1994D
1988 through 1994
0%
40%
30%
25%
5%
35%
20%
15%
10%

Involved Airspaces
TerminalD Airways Special Use –D Center & OtherD UncontrolledD (Class B, C, & D) MOAs, etc. ControlledD (Class G)
(Class A & E)
Involved Airspace 1994 1988 through 1994
Incidents % of Incident Base Incidents % of Incident Base
Terminal–Class B, C, & DD 7,660 29% 49,630 29% DAirways 4,896 19% 26,942 16%
Special Use–MOAs, etc. 397 2% 2,461 1%
Center–Class A & E 6,981 26% 59,224 35%
Uncontrolled–Class G 546 2% 3,516 2%
Total Unique Relevant 20,257 77% 138,283 81%
Irrelevant or Unknown 6,156 23% 32,515 19%
Incident Base 26,413 100% 170,798 100%
28 Issue Number 8
0%
1994D
1988 through 1994
40%
30%
25%
5%
35%
20%
15%
10%

Anomalies (Top Level Categorization)
AirborneD GroundD Non-Adherence D Other AircraftD ATCD SpatialD Incidents to Rules Anomalies PerformanceD
DeviationsD Anomalies & Conflicts
Type of Anomaly 1994 1988 through 1994
Incidents % of Incident Base Incidents % of Incident Base
Airborne Spatial Devs & Conflicts 15,640 59% 109,169 64%
Ground Incidents 2,919 11% 17,047 10%
Non-Adherence to Rules 20,889 79% 128,225 75%
Other Aircraft Anomalies 5,268 20% 32,111 19%
ATC Performance Anomalies 886 3% 7,348 4%
Total Unique Relevant 24,611 93% 158,954 93%
Irrelevant or Unknown 1,802 7% 11,844 7%
Incident Base 26,413 100% 170,798 100%
Issue Number 8 29
0%
1994D
1988 through 1994
80%
60%
50%
10%
70%
40%
30%
20%
25%
5%
1994D
1988 through 199420%
15%
10%
0%
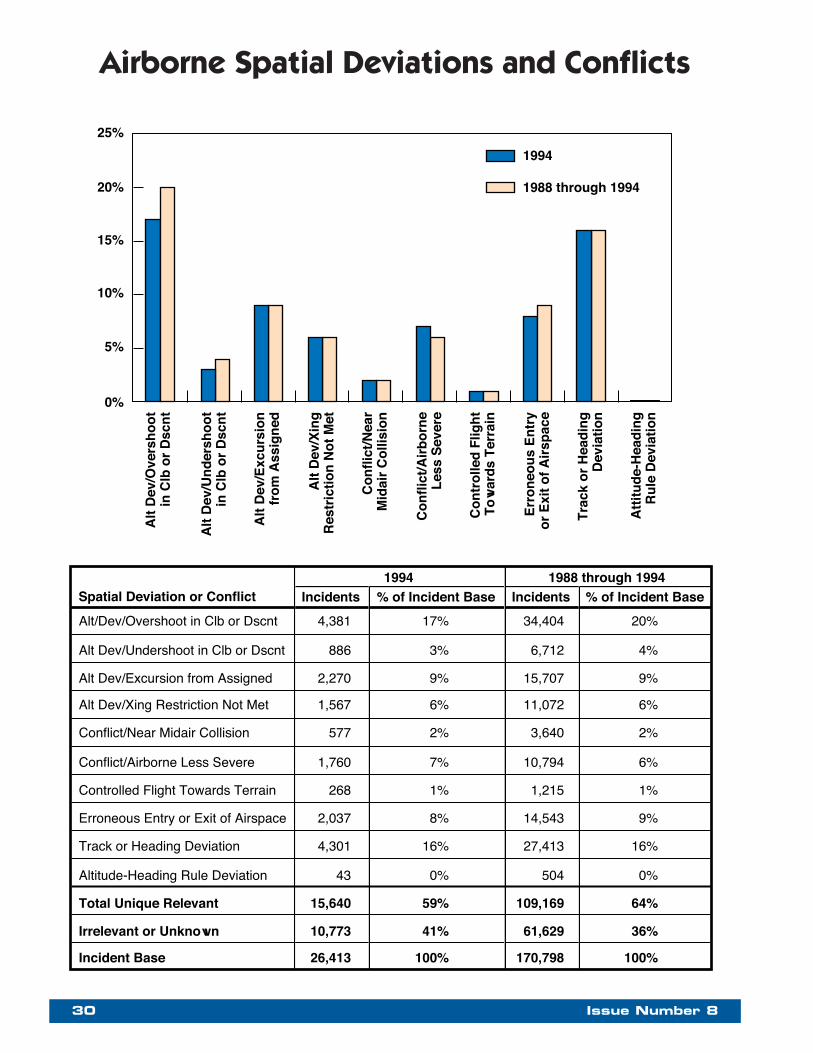
Airborne Spatial Deviations and Conflicts
Alt
Dev
/Ove
rsh
oo
tDin
Clb
or
Dsc
nt
Alt
Dev
/Un
der
sho
otD
in C
lb o
r D
scn
t
Alt
Dev
/Exc
urs
ion
Dfr
om
Ass
ign
ed
Alt
Dev
/Xin
gD
Res
tric
tio
n N
ot
Met
Co
nfl
ict/
Nea
rDM
idai
r C
olli
sio
n
Co
nfl
ict/
Air
bo
rneD
Les
s S
ever
e
Co
ntr
olle
d F
ligh
tDT
ow
ard
s T
erra
in
Err
on
eou
s E
ntr
yDo
r E
xit
of
Air
spac
e
Tra
ck o
r H
ead
ing
DD
evia
tio
n
Att
itu
de-
Hea
din
gD
Ru
le D
evia
tio
n
Spatial Deviation or Conflict 1994 1988 through 1994
Incidents % of Incident Base Incidents % of Incident Base
Alt/Dev/Overshoot in Clb or Dscnt 4,381 17% 34,404 20%
Alt Dev/Undershoot in Clb or Dscnt 886 3% 6,712 4%
Alt Dev/Excursion from Assigned 2,270 9% 15,707 9%
Alt Dev/Xing Restriction Not Met 1,567 6% 11,072 6%
Conflict/Near Midair Collision 577 2% 3,640 2%
Conflict/Airborne Less Severe 1,760 7% 10,794 6%
Controlled Flight Towards Terrain 268 1% 1,215 1%
Erroneous Entry or Exit of Airspace 2,037 8% 14,543 9%
Track or Heading Deviation 4,301 16% 27,413 16%
Altitude-Heading Rule Deviation 43 0% 504 0%
Total Unique Relevant 15,640 59% 109,169 64%
Irrelevant or Unknown 10,773 41% 61,629 36%
Incident Base 26,413 100% 170,798 100%
30 Issue Number 8

Ground Incidents
RwyD RwyD Conflict /D Conflict /D GndD Transgression /DTransgression /D GroundD Ground LessD Excursions &D
Unauth Lndg Other Critical Severe Loss of Control
Ground Incidents 1994 1988 through 1994
Incidents % of Incident Base Incidents % of Incident Base
Rwy Transgression / Unauth Lndg 836 3% 4,662 3%
Rwy Transgression / Other 1,154 4% 6,838 4%
Conflict / Ground Critical 426 2% 2,046 1%
Conflict / Ground Less Severe 245 1% 1,860 1%
Gnd Excursions & Loss of Control 478 2% 2,524 1%
Total Unique Relevant 2,919 11% 17,047 10%
Irrelevant or Unknown 23,494 89% 153,751 90%
Incident Base 26,413 100% 170,798 100%
Issue Number 8 31
0%
1994D
1988 through 1994
1%
5%
4%
3%
2%

Non-Adherence to Rules and Requirements
ATCD D FederalD PublishedD CompanyD Clearances Aviation Regs Procedures Policy & Other
Non-Adherence to...
1994 1988 through 1994
Incidents % of Incident Base Incidents % of Incident Base
ATC Clearances 14,075 53% 90,260 53%
Federal Aviation Regs 6,201 23% 35,290 21%
Published Procedures 4,448 17% 22,593 13%
Company Policy & Other 576 2% 2,556 1%
Total Unique Relevant 20,889 79% 128,225 75%
Irrelevant or Unknown 5,524 21% 42,573 25%
Incident Base 26,413 100% 170,798 100%
32 Issue Number 8
60%
1994D
1988 through 1994
40%
20%
0%

0%
2%
1994D
1988 through 1994
8%
6%
4%
Other Aircraft Anomalies
Acf
t E
qu
ipm
entD
Pro
ble
m –
Cri
tica
l
Acf
t E
qu
ipm
ent
Pro
b –
DL
ess
Sev
ere
Infl
igh
t E
nco
un
ter
–DW
eath
er
Infl
igh
t E
nco
un
ter
–DO
ther
Lo
ss o
f A
ircr
aftD
Co
ntr
ol –
Air
bo
rneD D
Sp
eed
Dev
iati
on
Un
con
tro
lled
Tra
ffic
DP
atte
rn D
ev
VF
R F
ligh
t in
DIM
C C
on
dit
ion
s
Em
erg
ency
orD
Flig
ht
Ass
ist
Other Aircraft Anomlay 1994 1988 through 1994
Incidents % of Incident Base Incidents % of Incident Base
Acft Equipment Problem – Critical 1,461 6% 6,923 4%
Acft Equipment Prob – Less Severe 1,815 7% 12,132 7%
Inflight Encounter – Weather 1,068 4% 7,052 4%
Inflight Encounter – Other 319 1% 1,693 1%
Loss of Aircraft Control – Airborne 117 0% 611 0%
Speed Deviation 499 2% 3,324 2%
Uncontrolled Traffic Pattern Dev 141 1% 1,042 1%
VFR Flight in IMC Conditions 241 1% 1,589 1%
Emergency or Flight AssistD 777 3% 4,402 3%
Total Unique Relevant 5,268 20% 32,111 19%
Irrelevant or Unknown 21,145 80% 138,687 81%
Incident Base 26,413 100% 170,798 100%
Issue Number 8 33

ATC Handling Anomalies
ATCD D ATCD Inter-FacilityD Intra-FacilityD OperationalD OperationalD Coord'nD Coord'nD
Errors Deviations Problem Problem
ATC Performance D 1994 1988 through 1994 Anomaly Incidents % of Incident Base Incidents % of Incident Base
ATC Operational Errors 582 2% 4,424 3%
ATC Operational Dev 135 1% 1,963 1%
Inter-Facility Coord’n Prob 169 1% 1,451 1%
Intra-Facility Coord’n Prob 109 0% 934 1%
Total Unique Relevant 886 3% 7,348 4%
Irrelevant or Unknown 25,527 97% 163,450 96%
Incident Base 26,413 100% 170,798 100%
34 Issue Number 8
3%
0%
2%
1%
1994D
1988 through 1994