issue 34 • july–september 2013 - ceves.org.rs
TRANSCRIPT

OF ECONOMIC TRENDS AND POLICIES IN SERBIA
Issue 34 • July–September 2013
Belgrade, December 2013
6PUBLISHER
The Foundation for the Advancement of Economics (FREN)Kamenička 6, BeogradTel/Fax: 011 3021 069
E-mail: [email protected]://www.fren.org.rs
EDITORIAL COUNCILMihail Arandarenko (for the Publisher)
Jurij BajecPavle Petrović
Branko UroševićBoško Živković
EDITOR IN CHIEFMilojko Arsić
EXECUTIVE EDITORSaša Ranđelović
AUTHORSMilojko Arsić
Danko Brčerević, Economic Activity Mirjana Gligorić, Balance of Payments and Foreign Trade
Aleksa Nenadović, International EnvironmentMilan Pejić, Prices and the Exchange Rate
Jelena Žarković Rakić, Employment and WagesSaša Ranđelović, Fiscal Flows and Policy
Svetozar Tanasković, Monetary Flows and Policy
ASSOCIATES IN THIS ISSUEBorko HanđiskiTanja KaraulacDejan MolnarLazar Šestović
Jovana Šljivančanin
TRANSLATIONDarko Popović
Dragica MihajlovicMarjeta PevecVladica Đukić
DESIGN OF INNER PAGESStefan Ignjatović
PRINTING PREPARATIONMaja Tomić
COVER DESIGNNikola Drinčić
PRINTING OFFICEAlta Nova
VOLUME100 copies
Quarterly Monitor of Economic Trends and Policies in Serbia (QM) was created by Kori Udovički, who was the Editor-in-Chief of the first six issues of QM. For issues seven to twenty three, the Editor-in-Chief of QM was Prof. Pavle Petrović. Diana Dragutinović was the Editor-in-Chief of QM24. Since issue QM25-26 the Editor-in-Chief of QM is Milojko Arsić.

7
Table of Contents
From the Editor . . . . . . . . . . . . . . . . . . . . . . . . . . . . . 5
TRENDS
1. Review . . . . . . . . . . . . . . . . . . . . . . . . . . . . . . . . . . . . . 7
2. Economic Activity . . . . . . . . . . . . . . . . . . . . . . . .11
3. Employment and Wages . . . . . . . . . . . . . . . . . . 19
4. Balance of Payments and Foreign Trade . . . . . 26
5. Prices and the Exchange Rate . . . . . . . . . . . . . . . . 34
6. Fiscal Flows and Policy . . . . . . . . . . . . . . . . . . . . . . 39
7. Monetary Flows and Policy . . . . . . . . . . . . . . . . . 50
8. International Environment . . . . . . . . . . . . . . . . . 56
HIGHLIGHTS
Highlight 1
Analysis and Evaluation of the Fiscal Policy
for 2014-2016. . . . . . . . . . . . . . . . . . . . . . . . . . . . . . . . . . 60Milojko Arsić, Saša Ranđelović
Highlight 2
Low Inflow of Foreign Direct Investment:
Regional Problem or a Specificity of Serbia? . . . . . .65Mirjana Gligorić
Highlight 3
Is Privatization First to Blame
for Job Losses in Serbia? . . . . . . . . . . . . . . . . . . . . . . . . .70Milojko Arsić
Highlight 4
Is Turkey Gaining in Economic Importance
in the Southeastern Europe Region?. . . . . . . . . . . . . . 73Borko Hanđiski, Lazar Šestović i Jovana Šljivančanin
SPOTLIGHT ON
Spotlight on: 1
Is Decentralisation Good for
Economic Growth?. . . . . . . . . . . . . . . . . . . . . . . . . . . . . . .79
Dejan Molnar
Analytical and Notation ConventionsValuesThe data is shown in the currency we believe best reflects relevant economic processes, regardless of the currency in which it is published or is in official use in the cited transactions. For example, the balance of payments is shown in euros as most flows in Serbia’s international trade are valued in euros and because this comes closest to the measurement of real flows. Banks’ credit activity is also shown in euros as it is thus indexed in the majo-rity of cases, but is shown in dinars in analyses of mo-netary flows as the aim is to describe the generation of dinar aggregates. Definitions of Aggregates and IndicesWhen local use and international conventions differ, we attempt to use international definitions wherever appli-cable to facilitate comparison. Flows – In monetary accounts, the original data is stocks. Flows are taken as balance changes between two periods. New Economy – Enterprises formed through private initiative Traditional Economy - Enterprises that are/were sta-te-owned or public companies Y-O-Y Indices – We are more inclined to use this index (growth rate) than is the case in local practice. Compa-rison with the same period in the previous year informs about the process absorbing the effect of all seasonal variations which occurred over the previous year, es-pecially in the observed seasons, and raises the change measure to the annual level. NotationsCPI – Consumer Price IndexCumulative – Refers to incremental changes of an ag-gregate in several periods within one year, from the be-ginning of that year.H – Primary money (high-powered money)IPPI – Industrial Producers Price IndexM1 – Cash in circulation and dinar sight depositsM2 in dinars – In accordance with IMF definition: cash in circulation, sight and time deposits in both di-nars and foreign currency. The same as M2 in the accep-ted methodology in SerbiaM2 – Cash in circulation, sight and time deposits in both dinars and foreign currency (in accordance with the IMF definition; the same as M3 in accepted metho-dology in Serbia)
NDA – Net Domestic AssetsNFA – Net Foreign AssetsRPI – Retail Price Indexy-o-y - Index or growth relative to the same period of the previous yearAbbreviationsCEFTA – Central European Free Trade Agreement EU – European Union FDI – Foreign Direct InvestmentFFCD – Frozen Foreign Currency DepositFREN – Foundation for the Advancement of Econo-micsGDP – Gross Domestic ProductGVA – Gross Value AddedIMF – International Monetary FundLRS – Loan for the Rebirth of SerbiaMAT – Macroeconomic Analyses and Trends, publication of the Belgrade Institute of EconomicsNES - National Employment Service NIP – National Investment PlanNBS – National Bank of SerbiaOECD – Organization for Economic Cooperation and DevelopmentPRO – Public Revenue OfficeQ1, Q2, Q4, Q4 – 1st, 2nd, 3rd, and 4th quarters of the year QM – Quarterly MonitorSORS – Statistical Office of the Republic of SerbiaSDF – Serbian Development FundSEE – South East EuropeSEPC – Serbian Electric Power CompanySITC – Standard International Trade Classification
SME – Small and Medium EnterpriseVAT – Value Added Tax

In the second half of the year, Serbia’s economy is still expressing divergent trends. On the one hand, the mo-derate growth of economic activity and the reduction of foreign deficit is continuing, while on the other, the financial position of companies, banks and the state is getting worse, investments and employment are decli-ning, and high inflation is replaced by deflation. It is our estimate that the GDP growth in 2013 will be around 2%, inflation by the end of the year will be around 2%, balance of payments deficit around 5% of GDP, while unemployment will stagnate at a high level of around 25%. GDP growth is still concentrated in just a few ac-tivities, while most of the economy is in recession. Do-minance of recession tendencies is confirmed by deflati-on that Serbia has been facing since the middle of this year. Deterioration of the financial position of companies is expressed through a reduction in real value of loans, increased percentage of bad loans, reduced tax discipline, and increased freezing of accounts. The negative tenden-cies in the economy are transferred to banks as well, and the government spending on the recovery of companies and banks is growing.
In the following year, we expect Serbian economy to stagnate, with an assessment that a decline in economic activity is more probable than its growth. The growth of Serbian economy this year has been slightly higher than of the economies in the Region, but Serbia’s prospects for the following year are weaker than those of surrounding countries.
Factors on the supply side (recovery of agricultural pro-duction, production growth of FIAT and NIS) that have been driving economic activity throughout this year are depleted, while no new drivers of growth have emerged. On the demand side, a decline in personal and government spending is expected, a slow-down in the growth of exports and a modest increase of inves-tments. Reduction in government and private spending is a necessary consequence of adjusting local spending to the available GDP, and any attempt to use government spending to jump-start the economy would be counter-productive. In the previous issue of QM, we estimated that the economy could realise some growth in the co-ming year only if there is a significant growth of inves-tment. Now, it is almost certain that earlier announced
large investments will not be realised next year or at best, they might be realised on a much smaller scale. Also, the economic system reforms, even if implemented at the end of this and the beginning of next year, wouldn’t have a considerable impact on the growth of investment and economic activity in the coming year.
Formal employment is still moderately declining, which is in line with the recession tendencies in most of the eco-nomy. In the coming year, a significant decline of formal employment is expected as a result of lay-offs in compa-nies undergoing restructuring, caps on public sector em-ployment, and stagnation of the private sector. Labour market reforms together with other reforms could influ-ence an increase of employment, but not before 2015.
At the beginning of the fourth quarter, inflation reached a record low year-on-year level, while Serbia has been facing deflation as of June. Deflation is predominantly the result of decline in domestic demand and the recessi-on in most parts of the economy, but it is deepening the recession tendencies in return. Dinar exchange rate has mostly been stable since the middle of the year, mostly due to decisive policies of NBS to prevent sudden depre-ciation or appreciation of dinar by intervening on the fo-reign exchange market. Stability of dinar combined with high dinar interest rates yields high real profit in short term, which has attracted speculative capital. Deflation of prices, recession in most parts of the economy, decli-ne in bank lending activity, and high illiquidity of the business sector create a need for reduced restrictiveness of the monetary policy. Mild depreciation of dinar and bringing inflation back on target track are necessary not only for the credibility of the target inflation model, but for mitigating recession as well.
Trends in the current account balance of payments are extremely positive – current account balance of payments deficit will be halved compared to the previous year, alt-hough it will still be at a high 5% of GDP. Reduction of deficit is predominantly the result of growth of exports, but to some extent of the decline in domestic demand as well. Coverage of imports by exports in Q3 reached a historic high of 82%, but the share of Serbian exports in GDP is still low compared to countries of similar size. While the trends in the current account balance of payment can be characterised as positive, this is not the
From the Editor

case with the capital account. Businesses and banks are still deleveraging, inflow of foreign direct investment is very low, and most of the inflow of foreign capital is di-rected to financing the state deficit, while more than half of the borrowing is used for financing current spending. Since the beginning of October, government financing is largely based on short-term securities, which are an expensive and very risky source of financing. After a long time, the current account balance of payments deficit in 2013 is lower than the fiscal deficit, which means that the entire foreign deficit is directly or indirectly the result of fiscal deficit.
In the following year, a continuation in the improvement of current account balance of payments is expected, but at a slower pace than this year. Exports will have a slower growth, while low domestic demand will prevent a fast growth of imports. For an improvement in the trends on capital account, it is crucial that reforms be implemented that will improve the economic environment and attract foreign direct investment, while the state should reduce the fiscal deficit and foreign borrowing.
According to international methodology, the fiscal deficit in 2013 will be 6.5% of GDP. Fiscal deficit this year will be approximately at the level of last year’s deficit, which means it will be almost twice as high as planned. Incre-ase of fiscal deficit is mostly the result of significantly lower revenue compared to the planned one, which is due to several factors, most important being: overestimated revenue, faster decline of domestic demand and inflation than planned, deterioration of fiscal discipline (growth of grey economy and tax debts).
For 2014, the Government has planned a fiscal deficit of 7.1% of GDP, which means that the deficit will be by 0.6% of GDP higher than this year. The growth of fiscal deficit is the result of mitigating the announced austerity measures (wages), delaying certain reforms (pensions, Srbijagas), as well as emergence of new expenditures. In order to ensure credibility of the fiscal consolidation pro-gramme and returning of public finances to a sustainable track, it is necessary to implement additional savings of around 1% of GDP in 2014, as well as adopt reforms of the public sector that would guarantee continued re-duction of the fiscal deficit in the coming years as well. From the standpoint of fiscal consolidation, it is especi-ally important to adopt the following reforms as early as next year: fundamental pension reform, programme of systematic rationalisation of the number of public sector employees, programme of restructuring of Srbijagas and other public enterprises, measures for combating grey economy, etc. In order for the Government to have cre-dibility, it is important to be consistent in the implemen-tation of the already adopted reforms, such as resolving the status of companies undergoing restructuring.
Reduction of fiscal deficit to 6.1-6.3% in the following year would make fiscal consolidation plans for 2015-2016 realistically achievable. On the contrary, if the fis-cal deficit in 2014 is 7.1% of GDP, it is highly improba-ble that the fiscal deficit in 2015 would be reduced to 5.2% of GDP, and in 2016 to 3.2% of GDP. Additional government savings, which would lead to reduced fiscal deficit in 2014, as well as to its decline in the following years, are necessary not only from the standpoint of pu-blic finances, but from the standpoint of economic re-covery as well. In conditions when investors suspect a possibility of public debt crisis in Serbia, the growth of domestic demand generated through fiscal deficit is com-pletely neutralised by the decline in private investment and private spending. In highly indebted economy such as Serbian, increase of fiscal deficit has no effect on GDP growth, it rather reduces it. Fiscal multipliers in a small open economy with flexible foreign exchange rate are ge-nerally low, and in the periods of high indebtedness they become negative.
The main obstacles to economic growth are on the supply side, i.e. in the weaknesses of the economic system that destimulate investment and entrepreneurship, such as financial indiscipline, administrative barriers, inefficient judiciary, bad infrastructure, rigid labour market, etc. That is why the key to economic growth are reforms and not stimulating domestic demand through the increase of fiscal deficit. In addition to fiscal consolidation and re-forms, it is necessary to take measures for improving the dramatically bad condition of economy’s liquidity. Mea-sures for improving liquidity could help solvent compa-nies that are faced with temporary financial difficulty to overcome the crisis, while an efficient bankruptcy pro-cedure would ensure elimination of insolvent companies from the market.
This issue of QM, in addition to regular analyses, also contains four Highlights and one Spotlight On. Highli-ght 1 (by Arsić and Ranđelović) analyses fiscal policy for the period 2014-2016 and gives suggestions for its correc-tion; Highlight 2 (by Gligorić) analyses foreign direct in-vestment in Serbia and surrounding countries before and during the crisis, with a special focus on the efficiency of direct subsidies in attracting investments; Highlight 3 (by Arsić) denies claims that bad privatisation is the most important reason behind reduced employment over the last two decades; Highlight 4 (by Handjinski, Še-stović, and Šljivančanin) analyse the role of Turkey in the economic trends of Southeast Europe. This issue also contains Spotlight On (by Molnar) which analyses the trends in decentralisation in EU member states, as well as their impact on economic growth.
From the Editor

Tren
ds
7Quarterly Monitor No. 34 • July–September 2013
Tren
ds
7
TRENDS
1. Review
Basic macroeconomic indicators which characterize the entire 2013 are additionally emphasized: 1) a solid year-on-year economic growth of about 3.2% is the largest in the last five years, but it is also unsustainable, 2) inflation is not only halted but the prices in Q3 fell for 0.5%, and 3) the current account deficit dropped to record low 2.1% of GDP. Evaluation of these trends is not too favourable. Achieved GDP growth is a consequence of extremely high growth rates of a small part of the economy (agriculture, electric energy, FAS), and it’s by far largest part is in recession. This recession is one of the most important reasons inflation and current account deficit are at such low levels. Due to the essential recession trend of the economy, other indicators are worse-ning as well: labour market trend, number of non-performing loans, number of companies with blocked bank accounts, tax compliance, private investments and other.Available economic policy measures for reducing negative effects are very limited. Priority of fiscal policy must be a short-term and mid-term deficit reduction because the alternative to that is a public debt crisis and macroeconomic instability. In these frameworks, however, it would be worthwhile to take targeted and limited fiscal measures to increase the liquidity of the economy. Monetary policy should also be moving faster in the direction of loosening of restrictiveness – although this area of loosening is not so large as long as macroeconomic risks exist, above all, a large fiscal deficit. So, if the economic policy would be thoughtfully guided, coordinated and determined, it could somewhat mitigate the adverse trends - but could not revers them. As a consequence of above mentioned, a look forward is not so bright. Economic growth in the following year would formally enter stagnation or recession because there will no longer be a high growth of agriculture (which in 2013 is mostly a consequence of comparison with drought 2012) nor will there be a multiple growth of production of the Fiat Automobili Srbija Company (FAS). Neither the economies of the EU and neighbouring countries, with which the domestic economy is closely linked, would give a noticeable positive impulse to the economic growth of Serbia in 2014. In conditions of expected stagnation or recession the unemployment will conti-nue to grow and the state of the banking sector would probably worsen to somewhat extent. The stage for economic activity in 2014 is already set in 2013 and at this moment much of it cannot be changed. The Government in 2013 missed the chance to carry out the largest number of reforms planned in the Fiscal strategy from November of 2012 (pension system reform, Labour Law, building permits, public enterprises and other), but also to attract some large investments projects. In this regard, the reform measures that the Government has once again announced in its Fiscal strategy for 2014 but also the potential arrival of large investors, if they occur, can have significant positive impact on the growth of the economy only in 2015.According to the preliminary SORS estimate, the y-o-y GDP growth in Q3 stood at a relatively high 3.2%, and compared to Q2 seasonally adjusted GDP grew by about 1.1%. This growth is however a consequence of many temporary factors, which will not be able to continue in the co-ming quarters, - and thus is not sustainable. Thus, compared to Q2, the production of electricity had the largest growth of as much as 18% seasonally adjusted, which by its nature has a high volatility and it is impossible to continue with similar growth in the coming quarters. There is also a construction which is still in crisis but in Q3 it recorded better results compared to, we would say, incidental fall in Q2 (which the official statistic estimated at 42.5% y-o-y). In additi-on, we also expect a positive contribution to growth by agriculture in Q3 which will evidently be missing in 2014 (see Section 2. “Economic activity”).Observed by use of GDP, growth is still driven by a strong growth of exports which is probably the most positive trend in 2013. In the first ten months of 2013, exports of goods recorded a
Tren
ds
8 1. Review
growth of 26,5% compared to the same period of the previous year and in Q3 even 38,5%. Alt-hough a growth of motor vehicles still leads in Q3, agriculture products are coming close to it, as the export of this year’s better crop is starting, but also a wide range of other products. Price competitiveness of domestic economy, measured by unit labour costs in euros is satisfying (see Graph T2-5), and so we expect that the exports will have solid (but still significantly lower than now) growth when the full capacity of exports of cars is achieved. The contribution of exports to the economic activity in mid-term would be higher, and economic recovery faster, if the export oriented part of the economy is more developed. We have noticed that despite of growth in the previous years share of exports in GDP in Serbia is still lower than in comparable countries (see Section 4 “Balance of Payments and Foreign Trade”). This is unfortunately the price of long-term reliance to the domestic demand growth as the main generator of economic growth and conduct of inadequate economic policies (overestimated dinar exchange rate until autumn of 2008, slow implementation of reforms on the supply side, etc.). The large decline in investments, on the other hand, is one of the worst trends that marked Q3 and the entire 2013. We estimate that in 2013 they will have a fall of over 10%. The state in 2013 lowered the public investments by about 150 millions of euros compared to 2012, partly because of insufficient efficiency of their realisation, and partly as a savings measure because of a worsening in fiscal flows. Private sector is not investing, because it has no resources of its own and because, as a consequence of financial problems it faces, domestic and foreign banks are not willing to credit it. Beside all this, the level of foreign direct investments (FDI) in first three quarters of 2013 was relatively low – around 500 million of euros. Investments are important not only because they directly increase the rate of GDP growth but also because they increase the capacity for future economic growth. Thus, for example, investments of FAS and NIS di-rectly influenced economic growth in 2011 and slightly less in 2012, but more importantly they enabled increase in the production of these companies which, from the second half of 2012, has increased the GDP.Private and state consumption in Q3 and entire 2013 are falling and this fall will also continue in the mid-term. Although the private consumption was the main generator of economic growth until 2008, in the last five years there has been a turnaround. Private consumption from 2008 until the mid-2013 has achieved a real fall which reached almost 10%. Despite this, share of private, but also of state consumption is still too high in comparison to the level of development of domestic economy and thus further adjustment will have to continue. More precisely, in 2013 and the following years, private and state consumption will have to fall in real terms because the rate of economic growth will not be high. We come to the same conclusion also by analysing the sources which finance consumption. Private consumption declined in 2013 because in real terms wage mass, pensions and loans to households are declining, and state consumption because in real terms government spending on salaries and the purchase of goods and services are declining. As there are no indications of recent significant changes in most of the mentioned indicators, we expect that the private and state consumption will continue to decrease in real terms in the next few years. As a consequence of a high growth of exports and a fall in domestic demand (and consequently lower growth of imports) current account deficit decreased significantly. In 2013, current acco-unt deficit fell to about 5% of GDP from 10.6% of GDP from 2012, and in Q3 it was at a record low 2.1% (see Section 4 “Balance of Payments and Foreign Trade”). Unfavourable tendencies of reduced capital inflows are still present in the capital-financial part of the Balance of Payments. As we already mentioned, the level of FDI is, for Serbia, at a relatively low level – in the first ten months of 2013 it amounted to about 500 millions of euros which is, for example, 2.5 times less than in the same period of 2011. In addition to low FDI, domestic economy and banks are repaying debts to foreign countries, but this repaying is not a consequence of strengthening of the local economy, but rather the opposite - a recession that contains the largest part of the eco-nomy and the sharp reduction in company investments. Low capital inflows in Q3, beside strong reduction of the current part of the balance of payments, were not sufficient to cover the current account deficit and foreign exchange reserves fell by 160 million euros.
Tren
ds
9Quarterly Monitor No. 34 • July–September 2013
Negative trends in the labour market continue. Available data indicate that formal employment is still decreasing and we will have more details when the October Labour Force Survey is published. In the next year we expect further decrease of employment and a growth of unem-ployment, which will be a consequence of economic stagnation, and partly as a consequence of planned ending of the restructuring process. QM redaction, however, fully supports the comple-tion of the restructuring process even at the cost of employment reduction because economically those jobs were lost a decade ago and their artificial maintenance has greater costs than benefits for the Serbia’s economy. A topic of special interest in this edition of QM is announced change of the Labour Law. Our opinion is that it would be useful to increase the flexibility of the labour market by 1) modifying the provision that defines severance pay for full employment record, because it leads to discrimination against people with more experience in the labour market and opens up the possibility for abuse in the public sector, 2) increasing the flexibility of conclusion of fixed-term contracts and 3) regulating the operation of private temporary employment agencies (see Section 3 “Employment and Wages”).Low domestic demand accompanied by stable dinar exchange rate and a fall in the prices of agriculture products, is one of the reasons why the inflation is at a record low level. Since January until the end of October inflation was just 2.6%, and from June until the end of October we even recorded a deflation of 0.3%. Inflation at the end of the year could amount to just 2.5% which is its lowest level in recent history. NBS has lowered the key policy rate by 0.5% in October and November but it is still very high compared to inflation and amounts to 10%. Although in Serbia macroeconomic risks are still high, we estimate that it is necessary to additionally lower the restrictiveness of the monetary policy – inflation is below the target band of NBS, dome-stic demand decreases strongly, a large part of the economy is in recession and the illiquidity is emphasized (see Section 7 „Monetary Flows and Policy“).While we are aloof towards the policy of high key policy rate, we support the NBS intervention on the interbank foreign exchange market in November. Namely, NBS during November pre-vented the dinar exchange rate appreciation through purchasing of large quantity of euros, which would certainly be temporary and could negatively affect the economy. The practice of economic policy so far was to value more the short-term impact of dinar strengthening on the increase in living standards than its simultaneous effect on the reduction of price competitiveness of the domestic economy. This is why in the past even a sharp and short-term dinar strengthening was not prevented, even when conditions for this existed. Current dinar value (about 115 dinars for one euro) is realistically at the same level as at the end of 2011, i.e. at the end of 2007, and favourable foreign trade trends and price competitiveness of the domestic economy (euro-ULC) indicate that the dinar exchange rate is close to its equilibrium level. Economic growth in 2014, but also in the following years, will crucially depend on the exports trend because, as we saw, the area for the domestic demand growth is limited. Therefore, a responsible economic policy implies avoiding “traps” of re-appreciations, and a slight real depreciation will be desirable for the competitiveness of the Serbian economy, especially when there are no inflationary pressures. Banking sector in Serbia is already showing signs of slackening which are reflected in the loss of a third bank license to operate in a very short period of time. The costs of deposit guaranteeing and securities which repaired the consequences of extinguishing the three banks in the past two years exceed the amount of 800 million euros. However, there is a risk that the similar fate will be experienced by some other, small, banks in 2014 which will be additional cost for the state. Big problem in the banking sector is a high growth of non-performing loans which especially escalated since the beginning of 2013 (see Graph T7-10). Share of non-performing loans (by QM definition) in total loans at the end of October has reached even 24.6%, but this is the ave-rage value that applies to the entire banking sector and we believe that this ratio in some banks exceeds 50%. Just in 2013 the share of non-performing loans in total loans increased by 8.5 p.p.Fiscal flows in 2013 were much deteriorated. Instead of consolidated deficit of 3.6% of GDP, which was planned at the beginning of the year, deficit of around 6.5% of GDP will be achieved (including expenditures “below the line”). Reasons for such increase of the fiscal deficit is a high

Tren
ds
10
under-run of public revenues, while public expenditure have been successfully kept under control - even decreased in relation to the plan from the beginning of the year. Our analysis shows that revenues in 2013 failed for several reasons: 1) optimistic planning during the budgeting process, 2) unforeseen changes in the macroeconomic environment, primarily almost complete halt of inflation and 3) most important, increase of the shadow economy and financial indiscipline (see Section 6 “Fiscal Flows and Policy”). High fiscal deficit will lead to the approaching of the public debt at the end of 2013 to the level of 65% of GDP.At the beginning of December parliamentary debate on the Law on the Budget for 2014 and a set of accompanying laws began (the increase of the lower rate of VAT, the solidarity tax on wages over 60,000 dinars, etc.). One of the changes brought by the new Ministry of Finance is the inclusion in the deficit of government expenditures to cover the costs of unsuccessful opera-tions of public enterprises and failed banks - we consider this methodologically and economically correct. Including these expenditures, a planned government deficit in 2014 is as much as 7.1% of GDP. This means that the deficit, despite the savings measures and increase of the lower rate of VAT from 8 to 10%, will actually be increase in comparison to 2013, and the public debt will continue to grow maybe even above the level of 70% of GDP. QM estimate is that such a deficit is too high and that it should be reduced as much as possible – and we think that decrease by about 1% of GDP is feasible. Also, increasing trend of public debt and the risks associated with the financing of state obligations, which on the annual level exceed five billion euros, indicate that it is necessary to make a new arrangement with the IMF as soon as possible.
1. Review
Serbia: Selected Macroeconomic Indicators, 2005 - 2013
2012 2013
Q1 Q2 Q3 Q4 Q1 Q2 Q3
Economic GrowthGDP (in billions of dinars) 1,683.5 1,962.1 2,276.9 2,661.4 2,720.1 2,881.9 3208.6 3384.636 … … … … … … …GDP 5.4 3.6 5.4 3.8 -3.5 1.0 1.6 -1.7 -2.7 -0.1 -2.1 -2.1 2.7 0.2 3.2
Non-agricultural GVA 5.8 4.9 6.1 4.1 -4.2 1.6 1.5 1 -0.1 2.6 0.7 0.7 1.2 -1.3 …Industrial production 0.6 4.2 4.1 1.4 -12.6 2.5 2.2 -2.9 -5.5 -2.8 -3.6 -0.6 5.2 3 10.8
Manufacturing -1.0 4.5 4.7 1.1 -16.1 3.9 -0.4 -1.8 -6.7 0.2 -3.8 1.5 5.4 3.2 8.8Average net wage (per month, in dinars)2) 17,478 21,745 27,785 29,174 31,758 34,159 … … 39,068 41,664 41,187 43,625 41,419 44,248 43,939Registered Employment (in millions) 2.056 2.028 1.998 1.997 1.901 1.805 … … 1.734 1.7300 1.7260 1.7240 1.724 1,724 1,720
Fiscal dataPublic Revenues 42.1 42.4 42.1 41.5 38.6 -1.5 1.7 4.8 -0.8 -3.2 -5.8 -3.2 -2.4Public Expenditures 39.7 42.7 42.8 43.7 42.7 -1.7 10.3 9.2 -2.9 1.5 -10.8 -6.6 2.1
Overall fiscal balance (GFS definition)3) 14.8 -33.5 -58.2 -68.9 -121.8 -136.4 -54.9 -57.0 -36.5 -69.0 -37.0 -43.8 -58.7
Balance of PaymentsImports of goods4) -8,286 -10,093 -12,858 -15,917 -11,096 -12,176 -13,758 -14,272 -3,403 -3,577 -3,430 -3,862 -3,413 -3,705 -3,791
Exports of goods4) 4,006 5,111 6,444 7,416 5,978 7,402 8,440 8,822 1,854 2,282 2,244 2,442 2,260 2,710 3,101
Current account5) -1,805 -3,137 -4,994 -7,054 -2,084 -2,082 -2,870 -3,155 -1,176 -740 -546 -694 -627 -281 -175
in % GDP 5) -8.6 -12.9 -17.2 -21.6 -7.2 -7.4 -9.1 -10.6 -17.0 -9.8 -7.3 -8.7 -8.2 -3.3 -2.1
Capital account5) 3,863 7,635 6,126 7,133 2,207 1,986 2,694 2,988 1,120 685 490 692 612 226 86
Foreign direct investments 1,248 4,348 1,942 1,824 1,372 860 1,827 242 -362 234 117 253 155 139 224NBS gross reserves (increase +)
1,675 4,240 941 -1,687 2,363 -929 1,801 -1,137 -916 -1,100 -340 1,218 859 -886 -164
Monetary dataNBS net own reserves6) 175,288 302,783 400,195 475,110 578,791 489,847 606,834 656,347 615,234 583,121 608,235 656,347 673,147 674,731 701,822
NBS net own reserves6), in mn of euros 2,050 3,833 5,051 5,362 6,030 4,609 5,895 5,781 5,376 5,037 5,225 5,781 6,025 5,917 6,122
Credit to the non-government sector 518,298 609,171 842,512 1,126,111 1,306,224 1,660,870 1,784,237 1,958,084 1,897,034 1,938,662 1,999,697 1,958,084 1,933,868 1,929,205 1,911,059
FX deposits of households 190,136 260,661 381,687 413,766 565,294 730,846 775,600 909912 834,253 888,372 890,782 909,912 907,288 924,684 933,170
M2 (y-o-y, real growth, in %) 20.8 30.6 27.8 2.9 9.8 1.3 2.7 -2.2 10.1 12.0 3.4 -2.2 -2.6 -4.7 1
Credit to the non-government sector (y-o-y, real growth, in %)Credit to the non-government sector, in % GDP 29.6 28.6 35.0 42.0 45.8 53.8 56.2 59.9 59.3 60.2 61.6 59.9 57.3 60.3 53
Prices and the Exchange Rate
Consumer Prices Index7) 16.5 6.5 11.3 8.6 6.6 10.2 7.0 12.2 3.4 5.4 10.3 12.2 11.2 9.7 5Real exchange rate dinar/euro (average 2005=100)8) 100.0 92.1 83.9 78.5 83.9 88.0 80.43 85.3 84.6 87.7 87.3 81.5 79.5 79.5 81Nominal exchange rate dinar/euro8) 82.92 84.19 79.97 81.46 93.90 102.90 101.88 113.03 108.01 113.67 117.02 113.44 111.69 112.15 114
28.6 25.2
20082006 2007
10.3 24.9
in % of GDP
in billions of dinars
in millions of euros, flows
in millions of dinars, e.o.p. stock
y-o-y, real growth
20122011
Y-o-y growth
2005
Quarterly DataAnnual Data
y-o-y, real growth
0.5
2010
13.9
2009
-2.110.55,2 -9-9.25.98.1-2.1 -8.2
Source: FREN.1) Unless indicated otherwise.2) Data for 2008 represent adjusted figures based on a wider sample for calculating the average wage. Thus, the nominal wages for 2008 are comparable with nominal wages for 2009 and 2010, but are not comparable with previous years.3) We monitor the overall fiscal result (overall fiscal balance according to GFS 2001) – Consolidated surplus/deficit adjusted for “budgetary lending” (lending minus repayment according to the old GFS).4) The Statistical Office of the Republic of Serbia has changed its methodology for calculating foreign trade. As from 01/01/2010, in line with recommendations from the UN Statistics Depart-ment, Serbia started applying the general system of trade, which is a broader concept that the previous one, in order to better adjust to criteria given in the Balance of Payments and the System of National Accounts. A more detailed explanation is given in QM no. 20, Section 4, “Balance of Payments and Foreign Trade”.5) The National Bank of Serbia changed its methodology for compiling the balance of payments in Q1 2008. This change in methodology has led to a lower current account deficit, and to a smaller capital account balance. A more detailed explanation is given in QM no. 12, Section 6, “Balance of Payments and Foreign Trade”.6) The NBS net own reserves represent the difference between the NBS net foreign currency reserves and the sum of foreign currency deposits of commercial banks and of the foreign currency deposits of the government. More detailed explanations are given in the Section Monetary Flows and Policy.7) Data for 2004, 2005 and 2006 are based on the Retail Prices Index. SORS has transferred to the calculation of the Consumer Price Index from 2007. 8) The calculation is based on 12-m averages for annual data, and the quarterly averages for quarterly data.
Tren
ds
11Quarterly Monitor No. 34 • July–September 2013
2. Economic activity
We expect that the growth of economic activity in 2013 will amount to about 2%, which is a solid result when we observe the region in which Srbija is situated. This growth, however, is not sustainable as it is driven by one-off growth of agriculture of over 20% (due to the re-covery from 2012 drought) and a strong growth in only a few companies (FAS, NIS). If we would only exclude agriculture and Fiat Automobiles Serbia from the economic activity in 2013, the growth of the rest of the economy would be negative and would amount to -1%. Because of this we expect that the growth in 2014 will be lower than the one from 2013, and the question which we are trying to answer in this QM issue is - for how much. In order to determine that, it is necessary to see what changes in 2014 are already certain and what fo-undations for the growth in the next year are laid down in 2013. First, as already mentioned, in 2014 there will not be a high growth of agriculture or substantial increase in production of the FAS company. Second, investments in 2013, which should be the base for a growth in 2014, are in a sharp decline of over 10%. Third, private consumption, as the largest ex-penditure component of GDP, will continue to fall in real terms in 2014 as the wage mass in private sector is still under the unfavourable trends on the labour market and the state, as well, plans to really decrease pensions and wages. There are, however, some positive trends. So, for example, the price competitiveness of the economy in 2013 considerably improved as indicated by the euro-ULC and it may contribute to further growth in exports in 2014. The government could also positively influence a further growth in exports if planned growth of public investments and announced reforms (Law on Labour, acceleration in the issuance of building permits process, the restructuring of state and public companies, etc) are realized. Taking all this into account, we believe that the economy in 2014 will most likely be stagnant (growth around 0%), but also that there are serious risks of entering into a new recession.
Gross domestic product
According to the preliminary, flash, SORS estimate, the real y-o-y GDP growth in Q3 was about 3.2%. This growth is higher than all those recorded in 2013 and indicates a significant acceleration of the economic activity in Q3, because achieved y-o-y growth in Q2 was just 0.2%. It is interesting to notice that a y-o-y growth of over 3% was last time recorded in Q3 2008. However, in this general assessment we would have to take into account that a relatively strong annual growth in Q3 is largely a consequence of comparison with Q3 2012 when there was a drought, and thus, some parts of the economy, such as agriculture and power generation (hydro-electric power plants), had a very low production.If official statistic confirms preliminary assessment of GDP in Q3, it would mean that a real GDP growth of exactly 2% was achieved in first three quarters of 2013, compared to the same period of the previous year. This is a clear indication of how high the overall growth of the eco-nomy in 2013 will approximately be, since it involves three of four quarters and it is unlikely that Q4 will see such significant changes that will substantially change the overall result. However, for now, we are still cautious in a precise estimation of the economic growth in 2013 as SORS tends to perform considerable revision of the preliminary GDP estimates (as an example, in Q2 flash estimate of GDP growth was 0.7% and the final official estimate has reduced the growth for 0.5 percentage points, i.e. to 0.2%). Graph T2-1 shows seasonally adjusted GDP growth indices which provide better illustration of the changes in an economic activity on a quarterly basis. Seasonally adjusted indices of GDP growth confirm that there was a considerable acceleration in economic activity in Q3 compared to Q2, as we anticipated while analyzing only the y-o-y growth rates. Preliminary data for Q3 indicate that compared to the previous quarter there was a relatively high growth of seasonally adjusted GDP of 1.1% (Graph T2-1). Since the annualized value of a quarterly growth of 1.1% is
Year-on-year growth of GDP in Q3 of
about 3.2%
In 2013 GDP growth of about 2% most
probable
Seasonally adjusted data confirm growth
acceleration in Q3

Tren
ds
12
Tren
ds
12 2. Economic Activity
more than 4.5%1, we asked whether a lasting economic recovery that will be maintained in the coming quarters started in Q3. The answer to this question is, unfortunately - no.We have analyzed the available data on individual sectors of the economy in Q3 to see what con-tributed the most to the relatively high seasonally adjusted GDP growth. In the first place it was industrial production, which recorded seasonally adjusted increase of 4.8% contributing to the overall growth of GDP with 0.9 percentage points. However, within the industrial production, electricity production recorded extremely high seasonally adjusted growth in Q3 - almost 20%, but this production has large quarterly fluctuations and will certainly not permanently realize unusually high growth recorded in Q3. In Q3, manufacture of motor vehicles is still growing solidly, but already in a considerably slower pace compared to the beginning of the year, because the FAS is coming closer to the full exploitation of its production capacity. Therefore, we expect that the growth in production of motor vehicles will slow down in the coming months. Maybe only for the food industry, which is, due to a better agricultural season, again in the rise, we could say that it will probably continue to grow considerably in the coming quarters, but this will not be able to sustain the seasonally adjusted growth of total industrial production from Q3. In addition to industrial production, construction recorded a relatively high seasonally adjusted
growth in Q3 compared to Q2 and we estimate that growth to be around 6 %. The reason for this strong recovery of construction, we, however, find in the extraordinary low construction acti-vity in Q2, and not in the essential shift in this branch of economy–and thus, this growth is also considered as one-off partial recovery compared to the minimum from Q2. On the other hand, the observed negative trends, such as those that the trade is deepening the decline (further drop in retail sales), will probably be something more permanent. Taking everything into account, it can be concluded that the relatively high output growth in Q3 was, however, temporary and that it will probably not continue in Q4.
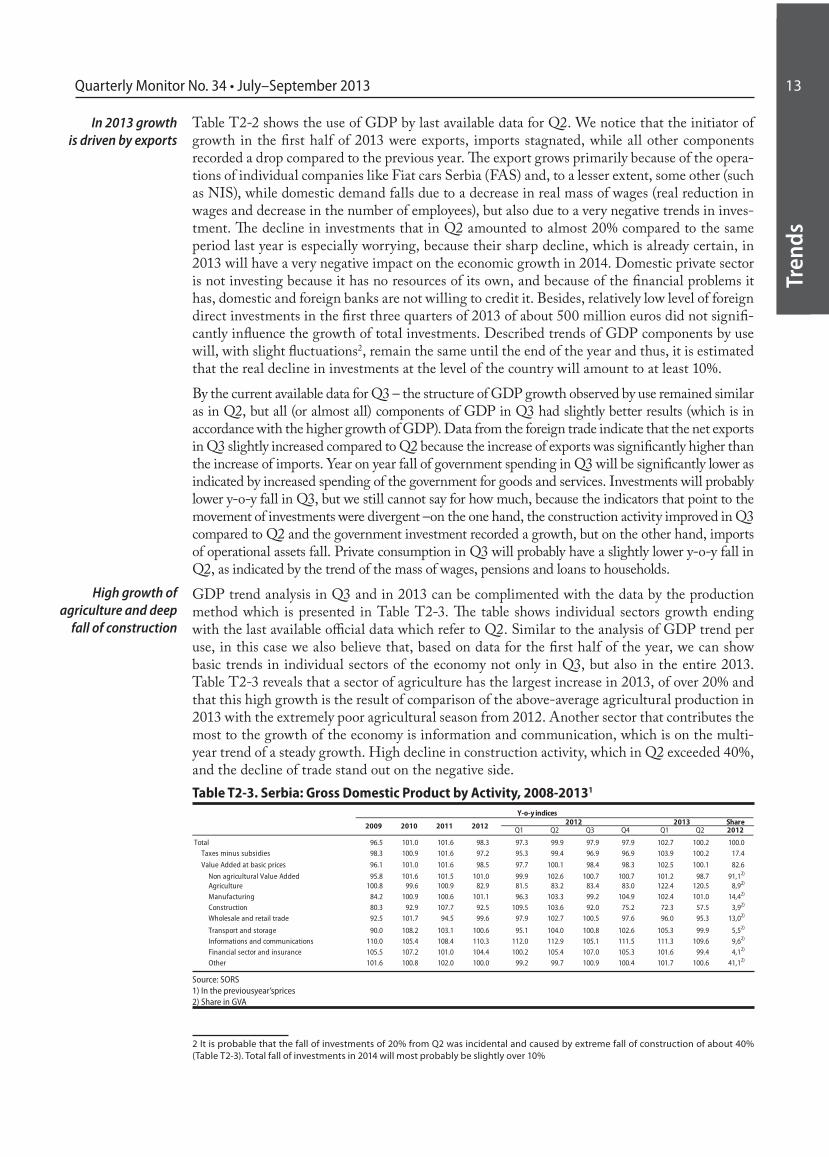
Graph T2-1 indicates that in Q3 seasonally adjusted GDP almost reached its average value from 2008 (which we defined as pre-crisis level of economic activity). Reaching this level after five years is important information, but it is also important to indicate that observing only total level of GDP somewhat blurs the facts about large and durable changes in the economy of Serbia which happened after 2008. These changes are easier to see in Table T2-2 which shows GDP movement by expenditure method. Thus it is evident that private consumption (which is consi-stent with the dominant perception of citizens about the decline in standard) is in real terms in 2013 still almost 10% lower when compared to 2008, while export is higher by as much as 26%. Growth initiators of the economy are, therefore, completely changed in the previous five years. The positive thing is that the exports are becoming an increasingly important initiator of growth, but it is worrisome, from the standpoint of sustainable growth, that investments are declining.
Table T2-2. Serbia: GDP by expenditure method, 2008-2012Y-o-y indices
2012 2013Q1 Q2 Q3 Q4 Q1 Q2
GDP 96.5 101.0 101.6 98.3 97.3 99.9 97.9 97.9 102.7 100.2
Private consumption 97.2 99.1 98.9 98.1 97.1 97.3 99.8 98.1 98.2 98.8
State consumption 98.1 100.4 101.0 101.8 103.6 105.8 100.4 97.7 97.0 93.4
Investment 77.9 94.5 108.4 96.6 99.8 103.4 98.5 87.2 97.1 81.5
Export 92.0 115.3 103.4 104.5 94.9 111.5 105.5 105.8 113.1 109.1
Import 80.9 103.1 107.0 104.2 102.2 109.4 103.7 101.9 100.7 99.5
2009 2010 2011 2012
Source: SORS
1 Precisely calculated seasonally adjusted quarterly growth in Q3 is rounded up to 1.1%, but is slightly larger and amounted to 1.144%, which is why annualized growth rate is higher
Growth in Q3 started
by industrial production
Pre-crisis level of production almost
reached...
... but with a big change in the structure
92.0
94.0
96.0
98.0
100.0
102.0
Graph T2-1. Serbia: Seasonally adjusted GDP growth (2008=100)
Source: QM estimates based on SORS data
Tren
ds
13Quarterly Monitor No. 34 • July–September 2013
Tren
ds
13
In 2013 growth is driven by exports
High growth of agriculture and deep
fall of construction
Table T2-2 shows the use of GDP by last available data for Q2. We notice that the initiator of growth in the first half of 2013 were exports, imports stagnated, while all other components recorded a drop compared to the previous year. The export grows primarily because of the opera-tions of individual companies like Fiat cars Serbia (FAS) and, to a lesser extent, some other (such as NIS), while domestic demand falls due to a decrease in real mass of wages (real reduction in wages and decrease in the number of employees), but also due to a very negative trends in inves-tment. The decline in investments that in Q2 amounted to almost 20% compared to the same period last year is especially worrying, because their sharp decline, which is already certain, in 2013 will have a very negative impact on the economic growth in 2014. Domestic private sector is not investing because it has no resources of its own, and because of the financial problems it has, domestic and foreign banks are not willing to credit it. Besides, relatively low level of foreign direct investments in the first three quarters of 2013 of about 500 million euros did not signifi-cantly influence the growth of total investments. Described trends of GDP components by use will, with slight fluctuations2, remain the same until the end of the year and thus, it is estimated that the real decline in investments at the level of the country will amount to at least 10%.By the current available data for Q3 – the structure of GDP growth observed by use remained similar as in Q2, but all (or almost all) components of GDP in Q3 had slightly better results (which is in accordance with the higher growth of GDP). Data from the foreign trade indicate that the net exports in Q3 slightly increased compared to Q2 because the increase of exports was significantly higher than the increase of imports. Year on year fall of government spending in Q3 will be significantly lower as indicated by increased spending of the government for goods and services. Investments will probably lower y-o-y fall in Q3, but we still cannot say for how much, because the indicators that point to the movement of investments were divergent –on the one hand, the construction activity improved in Q3 compared to Q2 and the government investment recorded a growth, but on the other hand, imports of operational assets fall. Private consumption in Q3 will probably have a slightly lower y-o-y fall in Q2, as indicated by the trend of the mass of wages, pensions and loans to households.GDP trend analysis in Q3 and in 2013 can be complimented with the data by the production method which is presented in Table T2-3. The table shows individual sectors growth ending with the last available official data which refer to Q2. Similar to the analysis of GDP trend per use, in this case we also believe that, based on data for the first half of the year, we can show basic trends in individual sectors of the economy not only in Q3, but also in the entire 2013.Table T2-3 reveals that a sector of agriculture has the largest increase in 2013, of over 20% and that this high growth is the result of comparison of the above-average agricultural production in 2013 with the extremely poor agricultural season from 2012. Another sector that contributes the most to the growth of the economy is information and communication, which is on the multi-year trend of a steady growth. High decline in construction activity, which in Q2 exceeded 40%, and the decline of trade stand out on the negative side.Table T2-3. Serbia: Gross Domestic Product by Activity, 2008-20131
2012 2013 ShareQ1 Q2 Q3 Q4 Q1 Q2 2012
Total 96.5 101.0 101.6 98.3 97.3 99.9 97.9 97.9 102.7 100.2 100.0Taxes minus subsidies 98.3 100.9 101.6 97.2 95.3 99.4 96.9 96.9 103.9 100.2 17.4
Value Added at basic prices 96.1 101.0 101.6 98.5 97.7 100.1 98.4 98.3 102.5 100.1 82.6
Non agricultural Value Added 95.8 101.6 101.5 101.0 99.9 102.6 100.7 100.7 101.2 98.7 91,12)
Agriculture 100.8 99.6 100.9 82.9 81.5 83.2 83.4 83.0 122.4 120.5 8,92)
Manufacturing 84.2 100.9 100.6 101.1 96.3 103.3 99.2 104.9 102.4 101.0 14,42)
Construction 80.3 92.9 107.7 92.5 109.5 103.6 92.0 75.2 72.3 57.5 3,92)
Wholesale and retail trade 92.5 101.7 94.5 99.6 97.9 102.7 100.5 97.6 96.0 95.3 13,02)
Transport and storage 90.0 108.2 103.1 100.6 95.1 104.0 100.8 102.6 105.3 99.9 5,52)
Informations and communications 110.0 105.4 108.4 110.3 112.0 112.9 105.1 111.5 111.3 109.6 9,62)
Financial sector and insurance 105.5 107.2 101.0 104.4 100.2 105.4 107.0 105.3 101.6 99.4 4,12)
Other 101.6 100.8 102.0 100.0 99.2 99.7 100.9 100.4 101.7 100.6 41,12)
2009 2010 2011 2012
Y-o-y indices
Source: SORS1) In the previousyear’sprices2) Share in GVA
2 It is probable that the fall of investments of 20% from Q2 was incidental and caused by extreme fall of construction of about 40% (Table T2-3). Total fall of investments in 2014 will most probably be slightly over 10%
Tren
ds
14
Tren
ds
14 2. Economic Activity
Based on the available monthly data, we estimate that there will be certain changes in the structure of growth by sector in Q3, compared to Q2. We expect y-o-y growth of manufacturing to be over 5%, increase in growth of agriculture and decrease in a fall of construction. On the other hand, data on trends in a retail trade show that the trade will probably further deepen its decline in Q3 compared to Q2, i.e. to continue with a declining trend that started in mid-2012. Other sectors will likely have similar growth rates as in Q2.It has already become a common QM practice to give an independent forecast of the expected developments in economic activity in the coming year at the end of the current year. Our fore-casts from previous years tended to be for a few percentage points lower than the official (go-vernment, NBS), but in most cases proved to be closer to the actual achievements of the economy (2011, especially in 2012). It is interesting that with the projections of economic growth in 2013 there were no major differences in the estimates of QM and state institutions - the government has predicted growth of 2% and we only slightly lower of about 1.5% (with an option to go up to 2%)3. In anticipation of the trends of economic activity in 2014 we return to the (usual) greater range of differences in the estimates as the government expects economic growth of about 1%, the NBS of about 1.5%, and QM stagnation.First we must clarify that stagnation, i.e. zero economic growth in 2014 does not mean the essential worsening of trends compared to 2013. Namely, if we excluded the results of agriculture and FAS from the economic activity, the remaining part of the economy would record a fall of 1% in 2013. As we cannot expect the similar growth of agriculture in the following year and FAS will have a lesser contribution to the growth because it came close to its full production capacity – in 2014 we enter with recession, not growth. Therefore, even the stagnation in 2014 would represent a positive shift in relation to a hidden but real trend that exists in a large part of the economy.Private consumption trend in 2014 is estimated on the basis of the assessment of the components’ trend from which the consumption is financed – wages, pensions, social assistance, consumer loans, remittances and other. Based on the existing trends on the labour market and planned state spending on wages and pensions in 2014, it is concluded that the most important funds for financing private consumption – wages and pensions – are going to decrease in real terms compared to 2013. (See Employment and Wages section and Highlights 1). This is a primary reason why the total private consumption will decrease in real terms compared to 2013. When we include the additional components of the assessment (loans, social assistance), we come to the conclusion that private consumption in 2014 could have a real decline of about 1.7%.This component of GDP should be the easiest to be estimated, because there are precise plans of the State for 2014 in the Fiscal strategy document. Based on these data we conclude that the real decline in government spending in 2014 could amount to 2.3%. We however note that in the previous two years (primarily) expenditures for the purchase of goods and services significantly deviated from the plan. And so in 2012 for this purpose considerably more resources were spent than it was previously planned, and in 2013 considerably less.In the coming year it is difficult to expect a greater investment recovery. Besides the “South Stream” (for which there are still no clear plans for 2014) there is no notice of other major in-vestments. In the previous period, precisely these large investments were crucial for the overall flow, and the best example for that is 2011 in which the FAS and NIS crucially contributed to a high growth in total investment. The State’s plans are to increase share of public investments for 0.3% of GDP in 2014 which would contribute to the overall growth of investment by about 1.5 percentage points - if this would happen. We note, however, that the state capital expenditures in the recent years, almost as a rule, are not realized completely and therefore it is unlikely that
3 Although the growth in the 2013 will probably be closer to 2% than 1.5% we think that it was reasonable to predict the lower growth, probably below 1.5%. Specifically, the prediction of QM at the end of 2012 we assumed the growth of agriculture in 2013 of about 15%, which would mean a return to the average season after the drought from 2012 (see QM30). Season, however, was above average and the agriculture in 2013 will achieve a growth of over 20%, which is why the overall rate of growth in 2013 is likely to be closer to 2% than 1.5%. The trend of agriculture is totally unpredictable so in all forecasts we use its average level that is rarely achieved. Note, however, that the growth of GDP would be lower than 1.5% in 2013 if an average growth of the agricultural season was realised.
In Q3 industry accelerates
In 2014 zero growth
rateprobable
Stagnation in 2014 is in fact not a derogation
compared to 2013
Private consumption will record a real fall between 1.5 and 2%
Government consumption will decrease by 2.3%
Investments will probably have a growth of 3-4%

Tren
ds
15Quarterly Monitor No. 34 • July–September 2013
Tren
ds
15
the plan will be realized in 2014. It would be hard to expect from the rest of the economy and the population a launch of a number of new projects that would reverse the negative trends from 2013. This is primarily indicated by a drop in credit activities to the private sector. Also, a signi-ficant reduction of state subsidies for investment and employment and investment tax credits4 will temporarily reduce private investment, and it will last as long as investors do not recognize the improvement of the economic environment in Serbia. Taking all this into account it is possi-ble that there will be a slight increase in investment in 2014 compared to 2013, we estimate not higher than 3-4%, but the growth will not nearly be enough to offset the decline in investment from 2013 of over 10%.Until now all projections that we stated were in accordance with official projections of the Go-vernment published in its Fiscal strategy document (we were only slightly more conservative in estimating investment growth). The main reason our estimate the economy growth in 2014 is lower is therefore in the estimate of net exports trend. In order to realize the prognosis of the Government, trade deficit in 2014 would have to be reduced by over 600mil. euro compared to 2013, and this needs to be done through growth of exports - which will be difficult because the FAS already in 2013 came close to its full export capacity. We especially emphasize that the results of export in 2014 should exclude the expected high growth in exports of agricultural pro-ducts that will occur due to the high growth of this economy sector in 2013. Agricultural pro-duction has already entered the GDP in 2013 when it happened and so its inclusion in the export in 2014 would be double counting of the same production. Methodologically, it would be correct that a surplus of agricultural production in 2013 is recorded as an increase in inventories and as such included in GDP from 2013 in national accounts, and in no way included once again throu-gh the increase of net exports in 2014. So, taking all this into consideration, QM estimate is that it would be great if twice lower growth in net exports would be achieved (excluding agricultural products) of about 300 million euros in 2014 compared to the current official forecasts - which is why our estimate of growth is by about 1 percentage point lower than what the government has presented in its Fiscal strategy document.Unit Labour Costs5 (ULC) measured in dinars continue to decrease in Q3. The trend can be easily seen in Graph 4. When we compare ULC with the same quarter of the previous year -
we see that they are in decline of about 6%. ULC indicate the quantity of the labour costs participating in the production unit and whether the productivity is growing fa-ster or slower than the growth of real wages. In Q3 the main trigger for the reduction of ULC was reduction in wages which were in nominal and real terms decreased in Q3 compared to Q2 (in the sample that we observe - without Public Administration). When we add to this figure the previously described acceleration of economic activity with unchanged number of employees - the result is a substantial reduction of ULC.
Unit labour costs measured in euros (euro-ULC) are an indicator of the price competitiveness of the Serbian economy as they define the greatest national cost component (labour costs) in relation to the added value. We calculate euro-ULC for the manufacturing sector (that produces by far the greatest share of tradable goods), and for the economy as a whole6, as shown in Graph T2-5).
4 The abolition of these subsidies and the implementation of reforms that will improve the business environment are good measures of economic policy.5 Unit Labor Costs in dinars are calculated for the economy (excluding the Agriculture and Public Administration sectors) and industry.6 Excluding the Public Administration and Agriculture sectors.
Net exports will continue to grow,
but this growth will be much lower
than in 2013
Unit Labour Costs continue to decrease
85
91
97
103
109
115
121
127
Base
indi
ces
2012
=10
0
economy
Source: QM based on SORS and NBS data
Graph T2-4. Serbia: Real Unit Labor Costs in the Economy and Industry, 2005-2013
Tren
ds
16
Tren
ds
16 2. Economic Activity
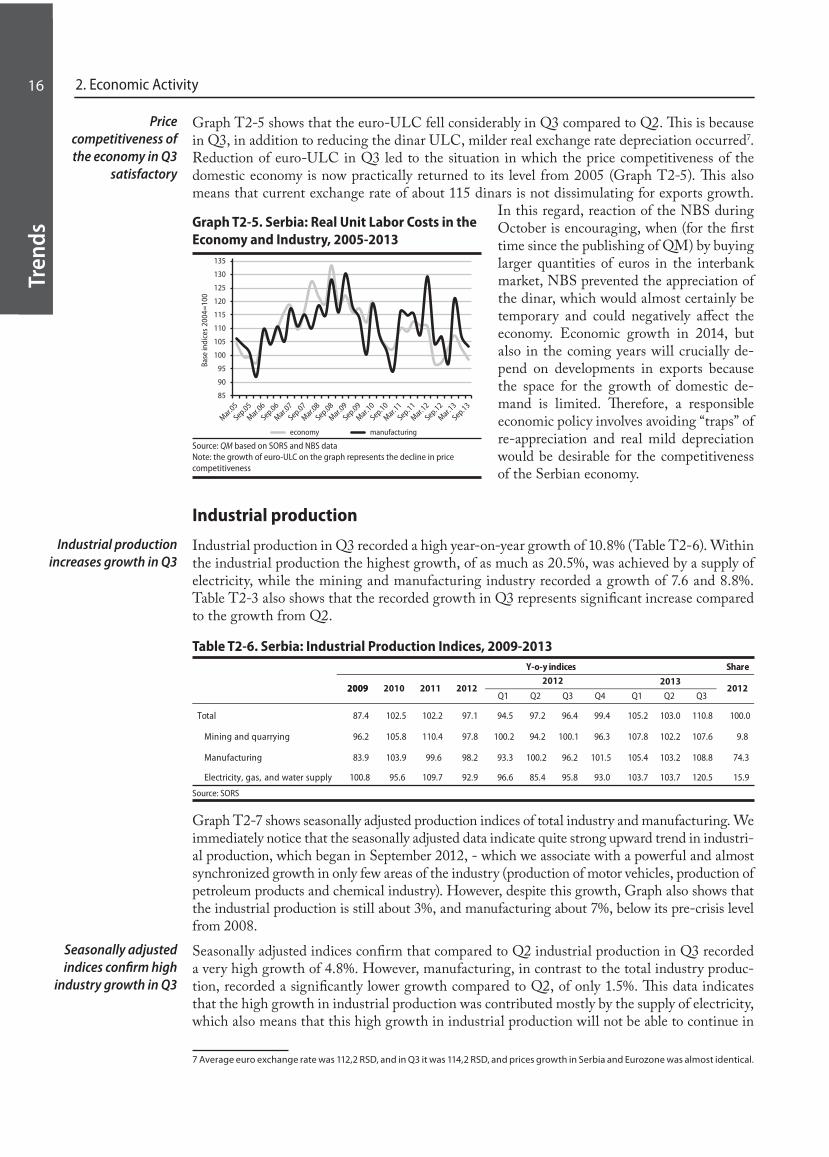
Graph T2-5 shows that the euro-ULC fell considerably in Q3 compared to Q2. This is because in Q3, in addition to reducing the dinar ULC, milder real exchange rate depreciation occurred7. Reduction of euro-ULC in Q3 led to the situation in which the price competitiveness of the domestic economy is now practically returned to its level from 2005 (Graph T2-5). This also means that current exchange rate of about 115 dinars is not dissimulating for exports growth.
In this regard, reaction of the NBS during October is encouraging, when (for the first time since the publishing of QM) by buying larger quantities of euros in the interbank market, NBS prevented the appreciation of the dinar, which would almost certainly be temporary and could negatively affect the economy. Economic growth in 2014, but also in the coming years will crucially de-pend on developments in exports because the space for the growth of domestic de-mand is limited. Therefore, a responsible economic policy involves avoiding “traps” of re-appreciation and real mild depreciation would be desirable for the competitiveness of the Serbian economy.
Industrial production
Industrial production in Q3 recorded a high year-on-year growth of 10.8% (Table T2-6). Within the industrial production the highest growth, of as much as 20.5%, was achieved by a supply of electricity, while the mining and manufacturing industry recorded a growth of 7.6 and 8.8%. Table T2-3 also shows that the recorded growth in Q3 represents significant increase compared to the growth from Q2.
Table T2-6. Serbia: Industrial Production Indices, 2009-2013Y-o-y indices Share
2013
Q1 Q2 Q3 Q4 Q1 Q2 Q3
Total 87.4 102.5 102.2 97.1 94.5 97.2 96.4 99.4 105.2 103.0 110.8 100.0
Mining and quarrying 96.2 105.8 110.4 97.8 100.2 94.2 100.1 96.3 107.8 102.2 107.6 9.8
Manufacturing 83.9 103.9 99.6 98.2 93.3 100.2 96.2 101.5 105.4 103.2 108.8 74.3
Electricity, gas, and water supply 100.8 95.6 109.7 92.9 96.6 85.4 95.8 93.0 103.7 103.7 120.5 15.9
2012201220092009 2010 2011 2012
Source: SORS
Graph T2-7 shows seasonally adjusted production indices of total industry and manufacturing. We immediately notice that the seasonally adjusted data indicate quite strong upward trend in industri-al production, which began in September 2012, - which we associate with a powerful and almost synchronized growth in only few areas of the industry (production of motor vehicles, production of petroleum products and chemical industry). However, despite this growth, Graph also shows that the industrial production is still about 3%, and manufacturing about 7%, below its pre-crisis level from 2008.Seasonally adjusted indices confirm that compared to Q2 industrial production in Q3 recorded a very high growth of 4.8%. However, manufacturing, in contrast to the total industry produc-tion, recorded a significantly lower growth compared to Q2, of only 1.5%. This data indicates that the high growth in industrial production was contributed mostly by the supply of electricity, which also means that this high growth in industrial production will not be able to continue in
7 Average euro exchange rate was 112,2 RSD, and in Q3 it was 114,2 RSD, and prices growth in Serbia and Eurozone was almost identical.
Industrial production increases growth in Q3
Seasonally adjusted indices confirm high
industry growth in Q3
85
90
95
100
105
110
115
120
125
130
135
Base
indi
ces
2004
=10
0
economy manufacturing
Source: QM based on SORS and NBS dataNote: the growth of euro-ULC on the graph represents the decline in price competitiveness
Graph T2-5. Serbia: Real Unit Labor Costs in the Economy and Industry, 2005-2013
Price competitiveness of the economy in Q3
satisfactory

Tren
ds
17Quarterly Monitor No. 34 • July–September 2013
Tren
ds
17
the coming quarters (this industrial area has a large volatility in its production under the influence of climatic factors).Observed by purpose (Table T2-8), in Q3 we notice divergent trends of various spe-cial-purpose product groups. On the one hand, high growth was recorded by produc-tion of energy and production of investment goods, while production of consumer and production of intermediate goods are in sta-gnation or slight decline. We would come to a similar conclusion about the divergent movements of different special purpose gro-ups of industrial production if we observe
the entire 2013 in the same Table, and not just Q3. This additionally confirms that industrial production growth is not really widespread and that despite the overall growth, a large part of industry is recording a decline in 2013. Even within the same special-purpose group, it is po-ssible that the results of only one company blur the results of the entire group. Thus, the high growth in production of investment goods is mismatched with the wider trend of a deep decline of investment activity, and the reason for this is that this group includes the manufacture of motor vehicles (FAS).
Table T2-8. Serbia: Components of Industrial Production by Use , 2009-2013Y-o-y indices
2012 2013
Q1 Q2 Q3 Q4 Q1 Q2 Q3
Total 87.4 102.5 102.1 97.1 94.5 97.2 96.4 99.4 105.2 103.0 110.8
Energy 98.8 97.7 106.2 93.6 95.8 88.3 91.4 98.7 108.6 109.7 131.6
Investment goods 79.3 93.6 103.2 103.8 92.0 105.4 113.7 104.2 132.3 130.2 140.5
Intermediate goods 78.4 109.2 102.2 91.2 89.4 96.3 89.1 90.0 94.7 93.1 101.9
Consumer goods 86.8 102.1 95.4 103.2 97.8 104.5 104.6 106.1 107.0 101.5 97.4
201220092009 2010 2011
Source: SORS
Since the growth of industrial production in Q3 was under a great impact of some temporary trends, Q4 will see a slowdown in the pace of its growth. First of all, the growth of electricity supply by about 20% y-o-y and 18% seasonally adjusted to the previous quarter is unsustainable. In addition, we expect the production of motor vehicles to continue to slow down its growth as FAS is coming closer to its full capacity production, while the food industry will accelerate its growth started in Q3, as a consequence of good agricultural season. We believe that there is a reason for concern despite the fact that industrial production will have a relatively high growth in 2013. Because, we still do not see which areas of industry will extend this high growth onto 2014 when the current, limited sources of growth of industrial production – will deplete.
Growth generated by only a few companies
causes divergent movements of
individual special-purpose groups
By the end of the year probable slowdown in
industrial production
70
74
78
82
86
90
94
98
102
106
110
seas
onal
ly a
djus
ted
indi
ces
Ø20
08=
100
Industry total Manufacturing total
Source: SORS
Table T2-7. Serbia: Seasonally Adjusted Industrial Production Indices, 2008-2013
Tren
ds
18
Tren
ds
18 2. Economic Activity
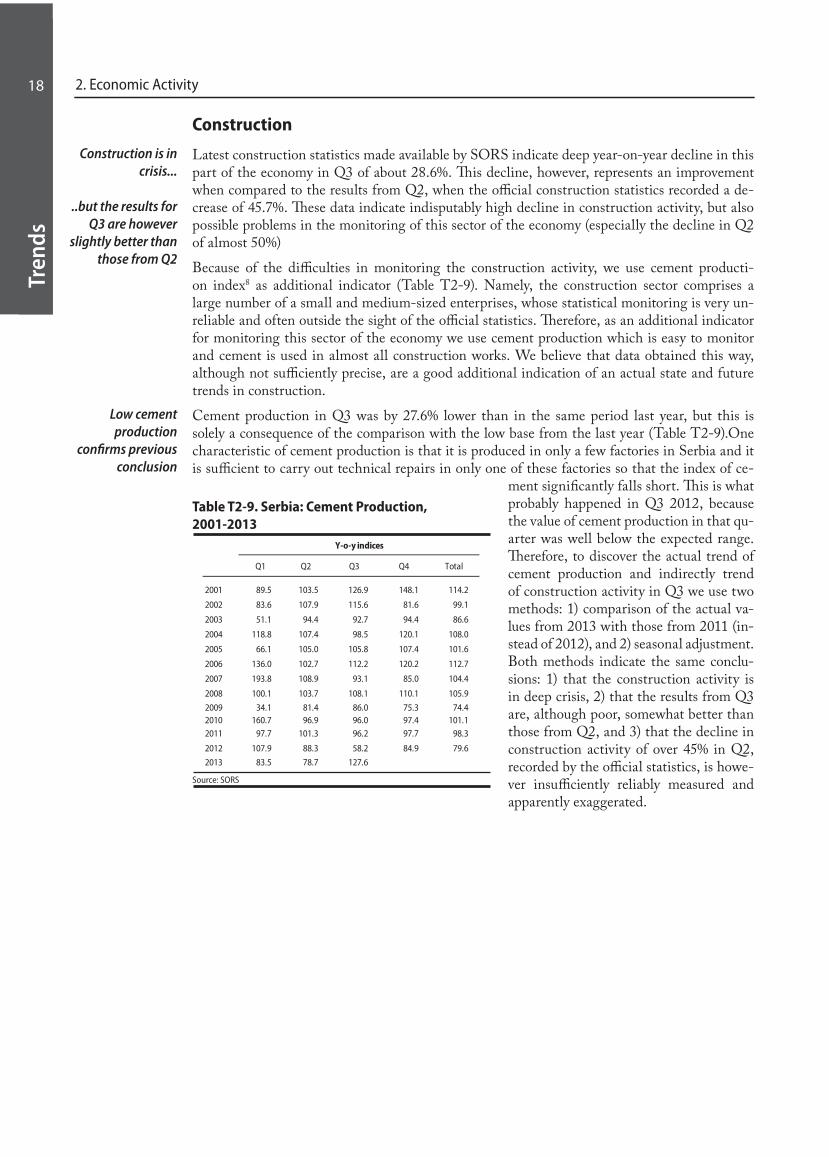
Construction
Latest construction statistics made available by SORS indicate deep year-on-year decline in this part of the economy in Q3 of about 28.6%. This decline, however, represents an improvement when compared to the results from Q2, when the official construction statistics recorded a de-crease of 45.7%. These data indicate indisputably high decline in construction activity, but also possible problems in the monitoring of this sector of the economy (especially the decline in Q2 of almost 50%)Because of the difficulties in monitoring the construction activity, we use cement producti-on index8 as additional indicator (Table T2-9). Namely, the construction sector comprises a large number of a small and medium-sized enterprises, whose statistical monitoring is very un-reliable and often outside the sight of the official statistics. Therefore, as an additional indicator for monitoring this sector of the economy we use cement production which is easy to monitor and cement is used in almost all construction works. We believe that data obtained this way, although not sufficiently precise, are a good additional indication of an actual state and future trends in construction. Cement production in Q3 was by 27.6% lower than in the same period last year, but this is solely a consequence of the comparison with the low base from the last year (Table T2-9).One characteristic of cement production is that it is produced in only a few factories in Serbia and it is sufficient to carry out technical repairs in only one of these factories so that the index of ce-
ment significantly falls short. This is what probably happened in Q3 2012, because the value of cement production in that qu-arter was well below the expected range. Therefore, to discover the actual trend of cement production and indirectly trend of construction activity in Q3 we use two methods: 1) comparison of the actual va-lues from 2013 with those from 2011 (in-stead of 2012), and 2) seasonal adjustment. Both methods indicate the same conclu-sions: 1) that the construction activity is in deep crisis, 2) that the results from Q3 are, although poor, somewhat better than those from Q2, and 3) that the decline in construction activity of over 45% in Q2, recorded by the official statistics, is howe-ver insufficiently reliably measured and apparently exaggerated.
8 Cement consumption would be the most appropriate indicator, but data on cement consumption are not available at the quarterly level. Studies have shown that cement production approximates consumption with relative reliability
Low cement production
confirms previous conclusion
Q1 Q2 Q3 Q4 Total
2001 89.5 103.5 126.9 148.1 114.2
2002 83.6 107.9 115.6 81.6 99.1
2003 51.1 94.4 92.7 94.4 86.6
2004 118.8 107.4 98.5 120.1 108.0
2005 66.1 105.0 105.8 107.4 101.6
2006 136.0 102.7 112.2 120.2 112.7
2007 193.8 108.9 93.1 85.0 104.4
2008 100.1 103.7 108.1 110.1 105.9
2009 34.1 81.4 86.0 75.3 74.42010 160.7 96.9 96.0 97.4 101.12011 97.7 101.3 96.2 97.7 98.3
2012 107.9 88.3 58.2 84.9 79.6
2013 83.5 78.7 127.6
Y-o-y indices
Source: SORS
Table T2-9. Serbia: Cement Production, 2001-2013
Construction is in crisis...
..but the results for Q3 are however
slightly better than those from Q2

Tren
ds
19Quarterly Monitor No. 34 • July–September 2013
Tren
ds
19
3. Employment and Wages
Results of the October Labour Force Survey (LFS) haven’t been published yet, but according to the data of the RAD survey, formal employment has continued to drop in the second half of 2013. Observed by sectors, the biggest drop in employment has been recorded in construc-tion and manufacturing industries. According to the records of the National Employment Service, the number of unemployed people has dropped by 17,000 from March to September, which is a usual seasonal trend during this time of year. Average monthly net wages in Q3 were 43,939 RSD or 385 EUR. At the year-on-year level, average monthly gross wages were nominally higher by 5.9% and lower by 0.9% in real terms. Observed by sectors, the highest decline in wages in the amount of 11.5% was realised in administrative and support servi-ces. Companies in the field of information and communication recorded the biggest growth in net wages, which increased at the year-on-year level by 14.6%. In Box we deal with the new Labour Code with a special focus on provisions on which there are major disagreements between ministries, trade unions and employers. In the coming year, we expect a reduction in the number of employed workers due to several factors: the announced reform of enter-prises in restructuring where most of them will probably be shut down, a hiring freeze in the public sector, and the stagnant economy.
Employment
Results of the October Labour Force Survey (LFS) haven’t been published yet, so we are basing our analysis of the labour market trends on the RAD survey, which focuses on formal em-ployment. In Table 3-1 we see that formal employment in September compared to March this year has dropped by 5,000 due to the reduction of employees in private companies. Compared to the same period last year, the drop translates into 4,000 workers which is in line with the stagnation/decline of the economic activity in most of the business sector.
Table T3-1. Serbia: Employment and Unemployment According to the Labor Force Survey1), 2008−2013
Entrepreneurs
TotalNo. of
entrepreneurs
No. of employees
with entrepreneurs
1 (=2+3) 2 3 (=4+5) 4 5 6 (=2+5) 7
2008 March
September
2009 March
September
2010 March
September
2011 March
September
2012 March
September
2013 March
September
Number of unemployed
(NES)
Total no. of employed
Employees in legal
entities2)
Total no. of employees
2,006 1,432 574 245 329 1,761 795
1,993 1,425 568 245 323 1,748 726
1,911 1,411 500 210 290 1,701 758
1,868 1,383 485 211 274 1,657 737
1,817 1,362 455 199 257 1,618 778
1,775 1,348 427 183 244 1,592 721
1,755 1,349 405 204 201 1,550 774
1,738 1,337 401 203 198 1,535 743
1,730 1,339 391 203 188 1,527 783
1,724 1,343 381 213 168 1,511 751
1,725 1,347 378 213 165 1,512 776
1,720 1,342 378 213 165 1,507 759Source: SORS – The semi-annual report on employed persons and wages of the employed persons RAD-1/P; the update to the semi-annual survey RAD-1; Semi-annual survey on private entrepreneurs and their employed workers RAD-15; the National Employment Service. Note: Data from October 2012 are corrected based on the Semiannual research -1/P for September 2012. Individual data on the number of private entrepre-neurs and the number of employees are taken from of Monthly Statistical Bulletin 2/2013 of the NES.Footnotes: 1) By the registered number of employed, we refer to the formal economy, i.e. those employees with employment contracts and for whom social security contributions are being paid. 2) By the registered number of unemployed, we refer to those persons that have registered with the National Employment Service (NES). NES moved from monitoring the number of job seekers to the number of unemployed persons in September 2004. This is why we do not have these data for the previous period (column 7).3) Figures do not include employees of the Ministry of Defense and Ministry of Interior.
Formal employment continues to drop in Q3
of this year

Tren
ds
20 3. Employment and Wages
Tren
ds
20
The biggest drop of employment since
2010 in construction and manufacturing
industries
If we look at the trends of overall formal employment since the beginning of the crisis (Octo-ber 2008), we see that employment declined the fastest in the first two years. From September 2008 to September 2010, the number of employees declined by slightly over 200,000, while in the following two years, that number was significantly lower, i.e. 50,000 persons. These tren-ds correspond to our earlier assumptions that the significantly higher decline of employment compared to the drop in GDP during the crisis in Serbia is the result of laying off previously accumulated surplus of employees in private companies (for more details, see Highlights 4). The announced finalisation of the process of restructuring in the coming year will cause reduction of formal employment by several tens of thousands of people, even though the workers in these companies have economically lost their jobs over a decade ago (See Highlights 4). Observed by sectors, the highest decline was recorded in manufacturing industry where the number of employees was reduced by 2000, while in the fields of construction, trade, finance, information, state administration and education, the number of employees dropped by one tho-usand each. Increase in the number of employees was only recorded in the sector of water supply and waste wanter management, as well as administrative and support services (by 1000 workers each; Table TP-5). Observed since March 2010, since the existing classification of activities has been introduced, employment dropped the most in construction 9.5%, manufacturing industry 6.8%, while in other activities the drop was around 5%. What is especially disconcerting is that private sector dominates the areas recording a decline in employment (Graph T3-1). What can also be obser-ved is a decline in the number of employees in the financial sector, which is opposite to the situ-ation of ten years ago when the number of employees in this sector grew rapidly. The combined impact of the crisis and possible oversize of this sector after several new large banks had entered the Serbian market led to a continues decline in employees in this sector year in, year out.
On the other hand, employment increased the most in administrative and support service acti-vities, as much as 17%. This group includes companies dealing in rental and leasing, hiring, such as temporary employment agencies, as well as tourist agencies and security agencies. From the standpoint of a healthy employment growth, an unfavourable circumstance is the fact that four out of six sectors where the formal employment has grown are dominated by the state.
-12 -10
Construction
Manufacturing
Transport and storage
Finance and insurance
Other services
Mining
Accomodation and food
Wholesale and retail
-8 -6 -4 -2 -0
Graph T3-1 Sectors recording employment decline since 2010, in %
Source: RAD survey, Statistical Office of the Republic of Serbia
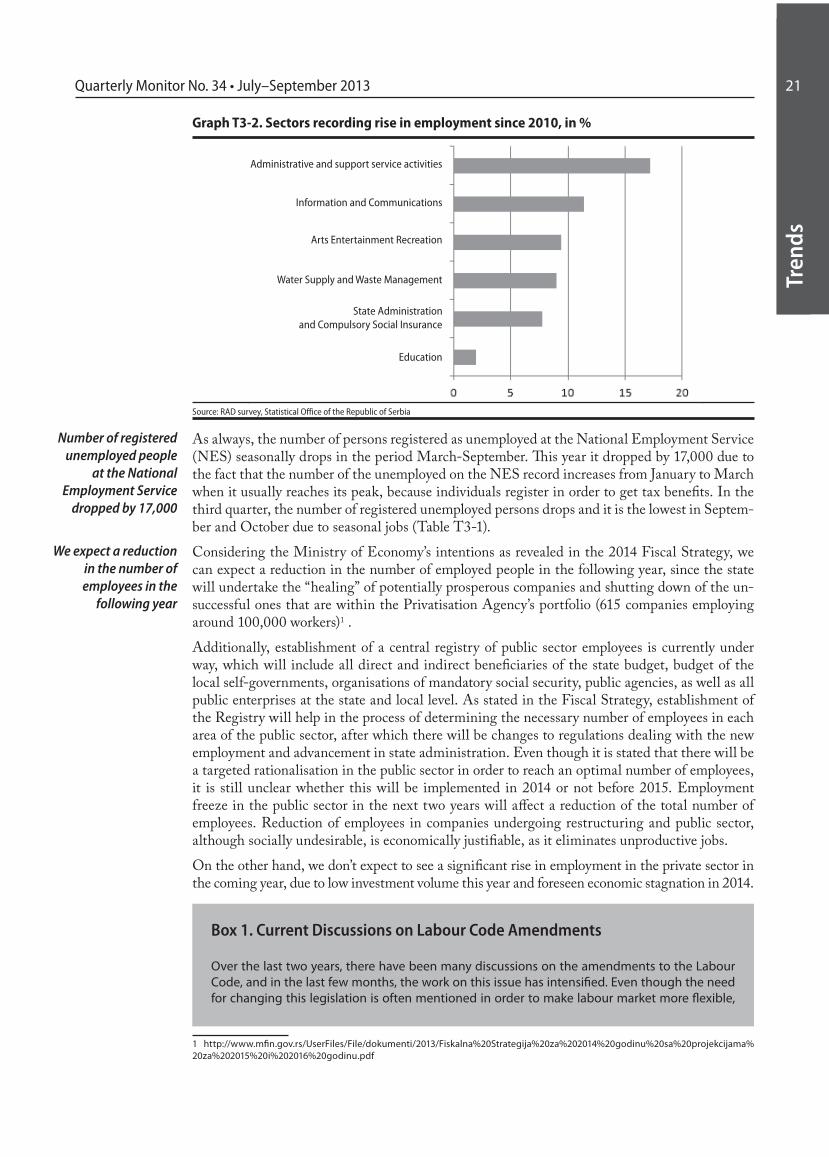
Tren
ds
21Quarterly Monitor No. 34 • July–September 2013
Tren
ds
21
Graph T3-2. Sectors recording rise in employment since 2010, in %
Administrative and support service activities
Information and Communications
Arts Entertainment Recreation
Water Supply and Waste Management
State Administrationand Compulsory Social Insurance
Education
Source: RAD survey, Statistical Office of the Republic of Serbia
As always, the number of persons registered as unemployed at the National Employment Service (NES) seasonally drops in the period March-September. This year it dropped by 17,000 due to the fact that the number of the unemployed on the NES record increases from January to March when it usually reaches its peak, because individuals register in order to get tax benefits. In the third quarter, the number of registered unemployed persons drops and it is the lowest in Septem-ber and October due to seasonal jobs (Table T3-1). Considering the Ministry of Economy’s intentions as revealed in the 2014 Fiscal Strategy, we can expect a reduction in the number of employed people in the following year, since the state will undertake the “healing” of potentially prosperous companies and shutting down of the un-successful ones that are within the Privatisation Agency’s portfolio (615 companies employing around 100,000 workers)1 . Additionally, establishment of a central registry of public sector employees is currently under way, which will include all direct and indirect beneficiaries of the state budget, budget of the local self-governments, organisations of mandatory social security, public agencies, as well as all public enterprises at the state and local level. As stated in the Fiscal Strategy, establishment of the Registry will help in the process of determining the necessary number of employees in each area of the public sector, after which there will be changes to regulations dealing with the new employment and advancement in state administration. Even though it is stated that there will be a targeted rationalisation in the public sector in order to reach an optimal number of employees, it is still unclear whether this will be implemented in 2014 or not before 2015. Employment freeze in the public sector in the next two years will affect a reduction of the total number of employees. Reduction of employees in companies undergoing restructuring and public sector, although socially undesirable, is economically justifiable, as it eliminates unproductive jobs. On the other hand, we don’t expect to see a significant rise in employment in the private sector in the coming year, due to low investment volume this year and foreseen economic stagnation in 2014.
1 http://www.mfin.gov.rs/UserFiles/File/dokumenti/2013/Fiskalna%20Strategija%20za%202014%20godinu%20sa%20projekcijama% 20za%202015%20i%202016%20godinu.pdf
Number of registered unemployed people
at the National Employment Service
dropped by 17,000
We expect a reduction in the number of employees in the
following year
Box 1. Current Discussions on Labour Code Amendments
Over the last two years, there have been many discussions on the amendments to the Labour Code, and in the last few months, the work on this issue has intensified. Even though the need for changing this legislation is often mentioned in order to make labour market more flexible,
Tren
ds
22 3. Employment and Wages
Tren
ds
22
the World Bank1 and OECD2 research put Serbia somewhere in the middle according to the va-lue of the so-called Employment Protection Index (EPI). The relatively high employment in the so-called grey economy and the limited inspection capacities in the official sector contribute, without a doubt, to the reduced impact of the formal regulations on the performance of the labour market, thus improving Serbia’s relative position in the latest comparison of OECD coun-tries and perhaps even the SEE countries. In its analysis, OECD additionally relativises its findings for Serbia, emphasising that there are strong indications that the implementation of certain legal provisions, which are nominally quite strict, is actually far from universal. For example, even though the law prescribes that a person can have temporary employment with one employer for a maximum duration of one year, this provision is massively ignored, mostly with no repercu-ssions for the employers not respecting this provision.
It is exactly this provision, related to temporary employment, that is the subject of dispute among the members of the working group drafting the law, and it was also subject of dispute in the past between unions, employers and the Government. It is unclear whether the Government has a unified stand on this issue, especially regarding the division of roles between the Ministry of Economy and the Ministry of Labour and Employment. Also, now, as in past debates, there are differences of opinions regarding the method of distributing severance payments, only this time there is also the foundation of a temporary employment agency added to the list.
Regarding severance payments, the draft of the new law suggested by the Ministry of Economy foresees severance payments to be done according to the years of employment with the last employer, instead of the previous practice which was based on total years of service. The unions feel this change will only facilitate lay-offs. However, even though this provision was probably directed at preventing unconscientious employers not meeting their obligations to the workers who have had many years of service with their predecessors, it is our opinion that severance payments formulated in such a way not only reduce job supply, since they serve as a substitute for early retirement, but also reduce job demand having in mind that employers wish to avoid high costs of terminating employment contracts with workers that have many years of experi-ence. This provision has been under constant criticism by the Foreign Investors Council, which rightfully emphases that, among other things, it is inciting potential discrimination in hiring older persons, i.e. persons with many years of working experience (White Book, 2010). So for example, if employer wishes to hire a person with 20 years of working experience, they are faced with a fact that, in case of termination, this individual will have to be paid at least 5.5 monthly salaries. For a company in financial difficulty, this is a very high cost and this will either deter it from hiring experienced workers or force it to reduce the labour force and maybe even declare bankruptcy, since it is unable to pay out such high severance payments. So, until now, all em-ployers (especially in the private sector) were very careful in hiring workers with many years of experience. On the other hand, it has opened up a possibility of abuse, especially in the public sector, where there has been an emergence of “severance chasers” - people who transfer from one position to another within the public sector in relatively short intervals, each time getting a full amount of severance according to the law or even more favourable special programme. In order to avoid all possible consequences of the current solution, we feel it is necessary to adopt a provision through the new law whereby the severance would be paid according to the years of service with the last employer only.
Another provision of the law, often disputed between the members of the working group in charge of amending the law, relates to the duration of the temporary contract. Since 2010, the Foreign Investors Council has been advocating to extend this type of contract from the current 12 months to 3 years, and soon the Employers Association joined in on this request as well. On the other hand, the unions are opposing any extensions of these types of contracts. In the draft of the new law, this is one of the issues that has the largest number of alternatives: keeping the option of concluding a temporary contract only in special circumstances (seasonal work, project work), but also abandoning this option so as not to limit the cases where it is possible to conclu-de a temporary contract. As for the duration, it would seem that maximum duration of 2 years for a temporary contract will be adopted.
1 World Bank (2005b). Doing Business 2006. Washington, DC.2 OECD, 2008. Serbia: A Labour Market in Transition, Paris: OECD
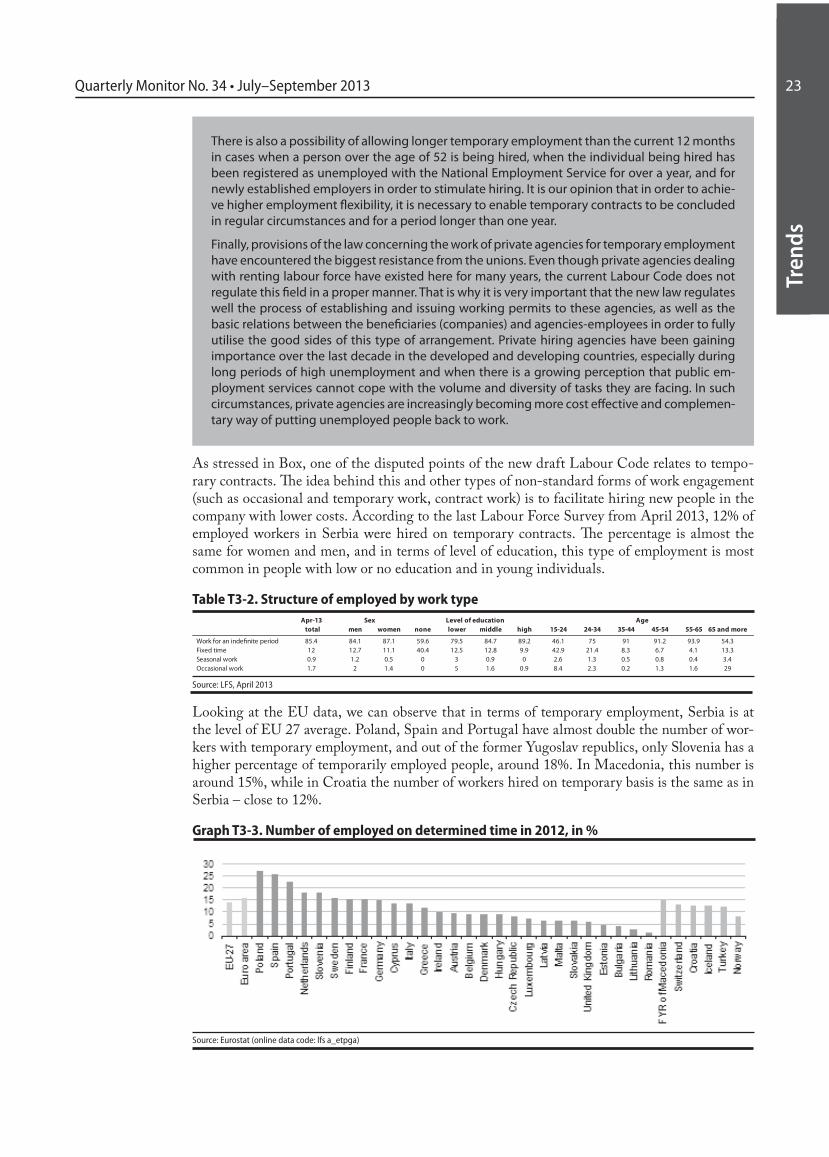
Tren
ds
23Quarterly Monitor No. 34 • July–September 2013
Tren
ds
23
As stressed in Box, one of the disputed points of the new draft Labour Code relates to tempo-rary contracts. The idea behind this and other types of non-standard forms of work engagement (such as occasional and temporary work, contract work) is to facilitate hiring new people in the company with lower costs. According to the last Labour Force Survey from April 2013, 12% of employed workers in Serbia were hired on temporary contracts. The percentage is almost the same for women and men, and in terms of level of education, this type of employment is most common in people with low or no education and in young individuals.
Table T3-2. Structure of employed by work typeApr-13 Sex Level of education Age
total men women none lower middle high 15-24 24-34 35-44 45-54 55-65 65 and more
Work for an inde�nite period 85.4 84.1 87.1 59.6 79.5 84.7 89.2 46.1 75 91 91.2 93.9 54.3Fixed time 12 12.7 11.1 40.4 12.5 12.8 9.9 42.9 21.4 8.3 6.7 4.1 13.3Seasonal work 0.9 1.2 0.5 0 3 0.9 0 2.6 1.3 0.5 0.8 0.4 3.4Occasional work 1.7 2 1.4 0 5 1.6 0.9 8.4 2.3 0.2 1.3 1.6 29
Source: LFS, April 2013
Looking at the EU data, we can observe that in terms of temporary employment, Serbia is at the level of EU 27 average. Poland, Spain and Portugal have almost double the number of wor-kers with temporary employment, and out of the former Yugoslav republics, only Slovenia has a higher percentage of temporarily employed people, around 18%. In Macedonia, this number is around 15%, while in Croatia the number of workers hired on temporary basis is the same as in Serbia – close to 12%.
Graph T3-3. Number of employed on determined time in 2012, in %
Source: Eurostat (online data code: lfs a_etpga)
There is also a possibility of allowing longer temporary employment than the current 12 months in cases when a person over the age of 52 is being hired, when the individual being hired has been registered as unemployed with the National Employment Service for over a year, and for newly established employers in order to stimulate hiring. It is our opinion that in order to achie-ve higher employment flexibility, it is necessary to enable temporary contracts to be concluded in regular circumstances and for a period longer than one year.
Finally, provisions of the law concerning the work of private agencies for temporary employment have encountered the biggest resistance from the unions. Even though private agencies dealing with renting labour force have existed here for many years, the current Labour Code does not regulate this field in a proper manner. That is why it is very important that the new law regulates well the process of establishing and issuing working permits to these agencies, as well as the basic relations between the beneficiaries (companies) and agencies-employees in order to fully utilise the good sides of this type of arrangement. Private hiring agencies have been gaining importance over the last decade in the developed and developing countries, especially during long periods of high unemployment and when there is a growing perception that public em-ployment services cannot cope with the volume and diversity of tasks they are facing. In such circumstances, private agencies are increasingly becoming more cost effective and complemen-tary way of putting unemployed people back to work.

Tren
ds
24 3. Employment and Wages
Tren
ds
24
Wages
According to the Statistical Office of the Republic of Serbia, average monthly gross wages at the year-on-year level are nominally higher by 5.9%, and lower by 0.9% in real terms (Table T3-2). Average monthly net wages in the third quarter of this year were 43,939 RSD or 385 EUR.
Table T3-3. Serbia: average monthly wages and y-o-y indices, 2008-2013
Average Monthly Wage1) Average Gross Monthly
Wage Index2)
1 2 3 4 5 6
2008 47,882 29,174 586 357 117.8 104.82009 52,090 31,758 554 337 108.8 100.62010 55,972 34,159 543 332 107.5 101.22011
Q1 57,539 35,108 553 338 110.1 97.7Q2 62,177 37,994 623 381 111.1 97.7Q3 63,386 38,760 622 380 112.3 101.5Q4 65,749 40,139 644 393 111.1 102.9Dec 72,056 43,887 700 426 111.2 103.9
2012Q1 63,846 39,068 591 362 111.0 106.0Q2 68,140 41,664 600 367 109.6 105.3Q3 67,457 41,187 577 352 106.4 98.4Q4 71,452 43,625 630 384 108.7 96.8Dec 76,830 46,923 677 413 106.6 95.1
2013Q1 67,704 41,419 606 371 106.0 94.6Q2 72,143 44,248 644 395 105.9 95.9Q3 71,469 43,939 626 385 105.9 99.1
Total labour costs,
in euros
Net wage, in euros
nominal realTotal labour
costs3), in dinars
Net wage, in dinars
Source: SORSNotes: 1) Data for 2008 are adjusted on the basis of a wider sample to calculate the average wage, which includes the salaries of employees of entrepreneurs.2) Y/y wage indices of average monthly gross earnings for 2008 were calculated on the basis of average earnings in 2007 and 2008 and the old sample that does not include those employed by entrepreneurs. However, these indices are comparable with the indices for 2009, given the fact that the expansion of the sample of earnings preserved their growth dynamics and only reduced their nominal value by about 12%. 3) Total labor costs (TLCs) comprise employer’s total average expense per worker, including all taxes and social security contributions. TLCs stand at around 164.5% of the net wage. Gross wage growth indices are equal to total labor cost indices, because the average TLC is greater than the average gross wage by a fixed 17.9% of employer based social security contributions.
In the following year, wages in the public sector will be adjusted in April by 0.5%, while an increase of 1% is planned for October, which will be implemented only if by mid next year wage scales are introduced in the public sector. One of the goals of establishing a central registry of public sector employees is to enable centra-lised calculation of personal earnings for the employees in the state administration and public service. However, the precondition to that is to implement a reform of wage policy and other earnings in public sector through introducing standardised wage scales, coefficient correction and the way of promoting and awarding employees. Observed by sectors, as seen in table T3-3, net wages have increased in Q3 2013 in five out of nineteen sectors, but quite modestly. The biggest increase of 4.1% was recorded in the financial and insurance sector, while the net wages in real-estate, mining and other service sectors have increased by slightly more than 2% in Q3 compared to Q2.The biggest decline of wages in the amount of 3% was recorded in the field of agriculture, followed by 2.7% in information sector, and 1.6% in companies in the field of art, entertainment
Average monthly gross wages are
lower by 0.9% in real terms compared to
the same quarter last year
Observed by sectors, compared to the
previous quarter, the wages have increased
the most in the financial sector
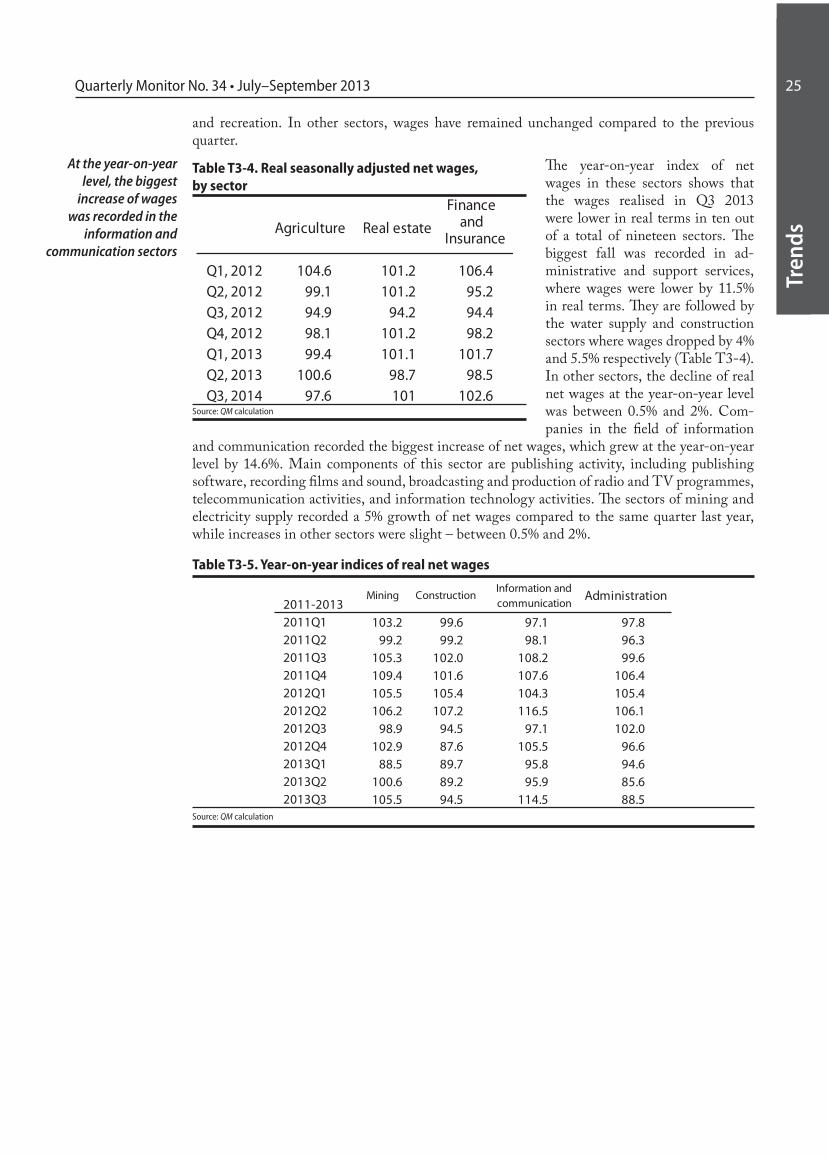
Tren
ds
25Quarterly Monitor No. 34 • July–September 2013
Tren
ds
25
and recreation. In other sectors, wages have remained unchanged compared to the previous quarter.
The year-on-year index of net wages in these sectors shows that the wages realised in Q3 2013 were lower in real terms in ten out of a total of nineteen sectors. The biggest fall was recorded in ad-ministrative and support services, where wages were lower by 11.5% in real terms. They are followed by the water supply and construction sectors where wages dropped by 4% and 5.5% respectively (Table T3-4). In other sectors, the decline of real net wages at the year-on-year level was between 0.5% and 2%. Com-panies in the field of information
and communication recorded the biggest increase of net wages, which grew at the year-on-year level by 14.6%. Main components of this sector are publishing activity, including publishing software, recording films and sound, broadcasting and production of radio and TV programmes, telecommunication activities, and information technology activities. The sectors of mining and electricity supply recorded a 5% growth of net wages compared to the same quarter last year, while increases in other sectors were slight – between 0.5% and 2%.
Table T3-5. Year-on-year indices of real net wages
2011-2013Mining Construction
Information and communication
Administration
2011Q12011Q22011Q32011Q42012Q12012Q22012Q32012Q42013Q12013Q22013Q3
103.2 99.6 97.1 97.899.2 99.2 98.1 96.3
105.3 102.0 108.2 99.6109.4 101.6 107.6 106.4105.5 105.4 104.3 105.4106.2 107.2 116.5 106.1
98.9 94.5 97.1 102.0102.9 87.6 105.5 96.6
88.5 89.7 95.8 94.6100.6 89.2 95.9 85.6105.5 94.5 114.5 88.5
Source: QM calculation
At the year-on-year level, the biggest
increase of wages was recorded in the
information and communication sectors
Agriculture Real estateFinance
and Insurance
Q1, 2012Q2, 2012Q3, 2012Q4, 2012Q1, 2013Q2, 2013Q3, 2014
104.6 101.2 106.499.1 101.2 95.294.9 94.2 94.498.1 101.2 98.299.4 101.1 101.7
100.6 98.7 98.597.6 101 102.6
Table T3-4. Real seasonally adjusted net wages, by sector
Source: QM calculation

Tren
ds
26
Tren
ds
26 4. Balance of Payments and Foreign Trade
4. Balance of payments and foreign trade
In Q3 2013 a record low current account balance of payments deficit was recorded (175 milli-on euros, i.e. 2.1% of GDP). This improvement of the current account is the result of strong acceleration of exports growth (primarily automobile exports) with modest increase of im-ports (due to still low domestic demand). That is, during Q3, despite the effects of real appre-ciation of dinar at the beginning of the year, the exports recorded a strong growth of 38.5%, and imports a growth of 10.1% at the year-on-year level, which brought the value of exports significantly closer to the value of imports. Thus, the quarterly level of the trade deficit in Q3 was especially low in the amount of 690 million euros (8.2% of GDP), while the coverage of imports by exports is still growing and reached a record high of 82%. Even though the value of current transfers exceeded the value of foreign trade deficit, there was an increase of deficit on the income account, which undermined the achievement of positive results in the current part of the balance of payments. Having in mind current trends, it is our estimate that the current deficit in 2013 will be 5% of GDP, which, although quite high, is still the lowest deficit in the last 10 years. On the other hand, in the capital-financial part, there is still an unfavourable tendency of net outflow of capital. Net inflow of FDI, although slightly on the rise, is still modest, and it wasn’t enough to cover the net outflow of capital from portfolio and other investments. Still, by October, an increase of portfolio investments has been re-corded, due to the possibility of high profits from investing in state bonds and NBS repos. The trend of private sector’s deleveraging of financial loans - continuously present since the beginning of last year - continued in Q3, and probably in Q4. We believe it is necessary to further reduce the fiscal deficit to restore credibility to the country and encourage the in-flow of private capital. Redirecting foreign capital from financing government spending to private sector investments would set a sound basis for increasing employment and economic growth in the long term. During Q3 2013, the current account recorded a significant improvement. Current account de-ficit was 175 million euros (2.1% of the quarterly GDP, see Table T4-1) and it was significantly lower than its previous quarterly levels. This is mainly the result of the reduction of foreign trade deficit due to continued fast growth of exports (primarily exports of automobiles, agricultural and food products) accompanied by moderate growth of imports - since the effect of the drop in domestic demand on imports was dominant in relation to the effect of the delayed appreciation of dinar, recorded at the beginning of the year. Having in mind the existing trends, it is our esti-mate that the current deficit in 2013 will be extremely low, i.e. approximately 5% of GDP, which is twice as low as last year when it was 10.6% (Table T4-1). Therefore, the value of the fiscal de-ficit is for the first time higher than the value of the current account balance of payments deficit. This is a quite alarming state – the inflow of foreign capital is financing government spending, and mostly current spending at that, while there is an outflow of capital from the private sector. Pronounced improvement in trade during Q3 was the main factor of the recorded reduced imba-lance on the current account (Graph T4-2). The value of exports was extremely high (for the first time in any quarter, it has exceeded 3 billion euros), which puts it significantly closer to the value of imports. To be more exact, goods in the value of 3,101 million euros were exported (36.7% of GDP), while imports were in the amount of 3,791 million euros (44.9% of GDP). Thus, the quarterly level of trade deficit was record low compared to all previous values of this deficit and it was 690 million euros (8.2% of GDP). Therefore, the coverage of imports by exports is still growing, reaching a high 82% (Graph T4-3).
Significant improvement of the
current account in Q3…
…as a result of strong growth of exports and
moderate growth of imports
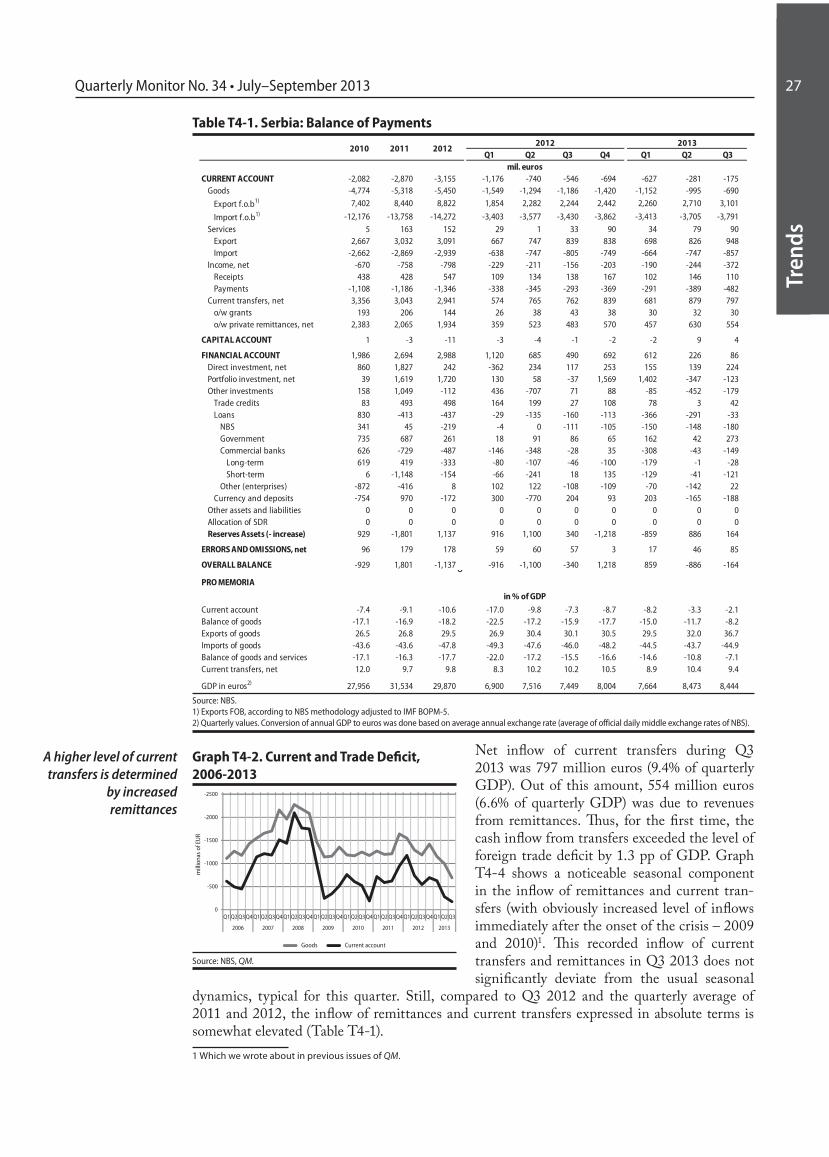
Tren
ds
27Quarterly Monitor No. 34 • July–September 2013
Tren
ds
27
Table T4-1. Serbia: Balance of Payments2012 2013
Q1 Q2 Q3 Q4 Q1 Q2 Q3mil. euros
CURRENT ACCOUNT -2,082 -2,870 -3,155 -1,176 -740 -546 -694 -627 -281 -175Goods -4,774 -5,318 -5,450 -1,549 -1,294 -1,186 -1,420 -1,152 -995 -690
Export f.o.b1) 7,402 8,440 8,822 1,854 2,282 2,244 2,442 2,260 2,710 3,101
Import f.o.b1) -12,176 -13,758 -14,272 -3,403 -3,577 -3,430 -3,862 -3,413 -3,705 -3,791Services 5 163 152 29 1 33 90 34 79 90
Export 2,667 3,032 3,091 667 747 839 838 698 826 948Import -2,662 -2,869 -2,939 -638 -747 -805 -749 -664 -747 -857
Income, net -670 -758 -798 -229 -211 -156 -203 -190 -244 -372Receipts 438 428 547 109 134 138 167 102 146 110Payments -1,108 -1,186 -1,346 -338 -345 -293 -369 -291 -389 -482
Current transfers, net 3,356 3,043 2,941 574 765 762 839 681 879 797o/w grants 193 206 144 26 38 43 38 30 32 30o/w private remittances, net 2,383 2,065 1,934 359 523 483 570 457 630 554
CAPITAL ACCOUNT 1 -3 -11 -3 -4 -1 -2 -2 9 4
FINANCIAL ACCOUNT 1,986 2,694 2,988 1,120 685 490 692 612 226 86Direct investment, net 860 1,827 242 -362 234 117 253 155 139 224Portfolio investment, net 39 1,619 1,720 130 58 -37 1,569 1,402 -347 -123Other investments 158 1,049 -112 436 -707 71 88 -85 -452 -179
Trade credits 83 493 498 164 199 27 108 78 3 42Loans 830 -413 -437 -29 -135 -160 -113 -366 -291 -33
NBS 341 45 -219 -4 0 -111 -105 -150 -148 -180Government 735 687 261 18 91 86 65 162 42 273Commercial banks 626 -729 -487 -146 -348 -28 35 -308 -43 -149
Long-term 619 419 -333 -80 -107 -46 -100 -179 -1 -28Short-term 6 -1,148 -154 -66 -241 18 135 -129 -41 -121
Other (enterprises) -872 -416 8 102 122 -108 -109 -70 -142 22Currency and deposits -754 970 -172 300 -770 204 93 203 -165 -188
Other assets and liabilities 0 0 0 0 0 0 0 0 0 0Allocation of SDR 0 0 0 0 0 0 0 0 0 0Reserves Assets (- increase) 929 -1,801 1,137 916 1,100 340 -1,218 -859 886 164
ERRORS AND OMISSIONS, net 96 179 178 59 60 57 3 17 46 85
OVERALL BALANCE -929 1,801 -1,137 -916 -1,100 -340 1,218 859 -886 -1640PRO MEMORIA
in % of GDP
Current account -7.4 -9.1 -10.6 -17.0 -9.8 -7.3 -8.7 -8.2 -3.3 -2.1Balance of goods -17.1 -16.9 -18.2 -22.5 -17.2 -15.9 -17.7 -15.0 -11.7 -8.2Exports of goods 26.5 26.8 29.5 26.9 30.4 30.1 30.5 29.5 32.0 36.7Imports of goods -43.6 -43.6 -47.8 -49.3 -47.6 -46.0 -48.2 -44.5 -43.7 -44.9Balance of goods and services -17.1 -16.3 -17.7 -22.0 -17.2 -15.5 -16.6 -14.6 -10.8 -7.1Current transfers, net 12.0 9.7 9.8 8.3 10.2 10.2 10.5 8.9 10.4 9.4
GDP in euros2) 27,956 31,534 29,870 6,900 7,516 7,449 8,004 7,664 8,473 8,444
2010 2011 2012
Source: NBS.1) Exports FOB, according to NBS methodology adjusted to IMF BOPM-5.2) Quarterly values. Conversion of annual GDP to euros was done based on average annual exchange rate (average of official daily middle exchange rates of NBS).
Net inflow of current transfers during Q3 2013 was 797 million euros (9.4% of quarterly GDP). Out of this amount, 554 million euros (6.6% of quarterly GDP) was due to revenues from remittances. Thus, for the first time, the cash inflow from transfers exceeded the level of foreign trade deficit by 1.3 pp of GDP. Graph T4-4 shows a noticeable seasonal component in the inflow of remittances and current tran-sfers (with obviously increased level of inflows immediately after the onset of the crisis – 2009 and 2010)1. This recorded inflow of current transfers and remittances in Q3 2013 does not significantly deviate from the usual seasonal
dynamics, typical for this quarter. Still, compared to Q3 2012 and the quarterly average of 2011 and 2012, the inflow of remittances and current transfers expressed in absolute terms is somewhat elevated (Table T4-1). 1 Which we wrote about in previous issues of QM.
A higher level of current transfers is determined
by increased remittances
-2500
-2000
-1500
-1000
-500
0Q1 Q2 Q3 Q4 Q1 Q2 Q3 Q4 Q1 Q2 Q3 Q4 Q1 Q2 Q3 Q4 Q1 Q2 Q3 Q4 Q1 Q2 Q3 Q4 Q1 Q2 Q3 Q4 Q1 Q2 Q3
2006 2007 2008 2009 2010 2011 2012 2013
Goods Current account
mill
iona
s of
EU
R
Graph T4-2. Current and Trade Deficit, 2006-2013
Source: NBS, QM.

Tren
ds
28
Tren
ds
28 4. Balance of Payments and Foreign Trade
During Q3, a surplus of 90 million euros was realised on the account of services. So, the foreign trade deficit in Q3 was 600 million euros, i.e. 7.1% of quarterly GDP. Imports of goods and ser-vices was 55%, while exports of goods and services reached 48%. Exports of goods and services will probably reach a historic maximum in 2013. Still, it will be lower compared to other coun-tries, primarily: Hungary (in 2012 had exports of goods and services of 94.8% of GDP), Bulgaria (66.6% of GDP in 2012) and the Czech Republic (78.0% of GDP in 2012).A net outflow of 372 million euros was registered on the income account (Table T4-1). On this account of the current part of the balance of payments, an increase of spending was recorded, which is primarily the result of increased payments for direct investments, , although there was also an increase in the outflow of portfolio investments. Thus, the spending was higher by 64.3% compared to the same period in 2012. Portfolio investments during October and November increased primarily due to investments in government bonds. Therefore, we feel that the coming period will see a growth trend in spending on the income account (which we also pointed out in the previous issue of QM) as a result of an increase in interest payments. Compared to Q3 2012, the current deficit is lower by 68%, i.e. by 371 million euros (Table T4-1). Quarterly level of trade deficit is 41.8% below the level realised in Q3 last year. Exports recorded a year-on-year growth of 38.2%, while imports were 10.3% above the value of Q3 2012. Income account deficit, observed year-on-year, was higher by 139%, considering a 64.3% increase in spending with reduced revenues of 20.1% in the observed period. Revenue from remittances in Q3 2013 was by 15% higher than revenues from Q3 2012, which affected the year-on-year growth of current transfers of 4.5%.
Net outflow of capital continued in Q3 as well (Table T4-1 & Graph T4-5). Still, unlike the previous quarter when net outflow was 651 million euros, it is significantly lower now in the amount of 74 million euros. Such a result in the capital-financial part of the balance of payments is the result of net outflows on the account of portfolio and other investments on the one hand, and realised net outflow of FDIs on the other. Withdrawal of portfolio investors continued in Q3, but slightly slower than in the previous quarter (-123 million euros in Q3, compared to
-347 million euros in Q2). Observed since the beginning of the year, on the portfolio investment account, despite the expressed distrust of investors and consequent withdrawal of capital during Q2 and Q3, a net inflow of 932 million euros was recorded. Such a cumulative result in the first nine months of 2013 was the result of the emission of state bonds in Q1. As of the middle of
Although at a historic high, the exports
are still significantly lower in relation to
comparable countries
Increase of net outflow on the income account
Current deficit 68% lower than last year’s
Net outflow of capital continues
Variability of portfolio investments
30
40
50
60
70
80
90
Q1Q2Q3Q4Q1Q2Q3Q4Q1Q2Q3Q4Q1Q2Q3Q4Q1Q2Q3Q4Q1Q2Q3Q4Q1Q2Q3Q4Q1Q2Q3Q4Q1Q2Q3Q4Q1Q2Q3Q4Q1Q2Q3Q4Q1Q2Q3Q4Q1Q2Q3
2001 2002 2003 2004 2005 2006 2007 2008 2009 2010 2011 2012 2013
in %
Coverage of imports by exports
Graph T4-3. Serbia: Coverage of Imports by Exports, quarterly, 2001-2013
Source: SORS, NBS, QM.
00
200
400
600
800
1,000
1,200
Q1 Q2 Q3 Q4 Q1 Q2 Q3 Q4 Q1 Q2 Q3 Q4 Q1 Q2 Q3 Q4 Q1 Q2 Q3 Q4 Q1 Q2 Q3
2008 2009 2010 2011 2012 2013
mill
ions
of E
UR
Current transfers Remittances
Graph T4-4. Inflow of Current Transfers and Remittances, 2008-2013
Source: NBS, QM.
00
200
400
600
800
1,000
1,200
Q1 Q2 Q3 Q4 Q1 Q2 Q3 Q4 Q1 Q2 Q3 Q4 Q1 Q2 Q3 Q4 Q1 Q2 Q3 Q4 Q1 Q2 Q3
2008 2009 2010 2011 2012 2013
milli
ons o
f EUR
Current transfers Remittances
Graph T4-4. Capital and Financial Account, 2008-2013
Source: NBS, QM.

Tren
ds
29Quarterly Monitor No. 34 • July–September 2013
Tren
ds
29
the year, there has been an extreme variability of net inflows of portfolio investments, because after the fall, there was again a rise in October and November. In the coming period, we expect further growth of capital inflows on this basis, having in mind the possibility of quick profit from investing in state bonds and NBS repos. Inflow of FDIs, as the most desirable form of inflow of foreign capital, is still quite low. Net inflow of FDIs during Q3 was 224 million euros, and to a lesser extent, it exceeds the rea-lised amounts from the previous two quarters. Cumulatively observed, FDI inflow since the beginning of the year was a modest 518 million euros. This result largely reflects the negative regional tendencies regarding the movement of capital in this respect2, which are additionally influenced by the increased macroeconomic instability in the country – due to an extremely high level of fiscal deficit and consequent growth of public and total foreign debt. The realised low level of FDIs in 2013 will certainly have a negative effect on the economic growth of next year. Net outflow on the account of other investments was 179 million euros, due to the negative ba-lance of net financial loans (33.5 million euros) and net outflow on the Cash and Deposits account (188 million euros). On the other hand, an inflow of trade loans in the net amount of 42 million euros was realised (Table T4-1).In Q3 2013 the tendency of constant net deleveraging of financial loans of residents (which be-gan back in Q1 2012) continued. Observed since the beginning of last year, NBS, the banks and companies have been reducing their foreign debt, while the public sector keeps borrowing. We estimate this tendency to be negative not only because of the additional borrowing of the public sector, but also because of the fact that the private sector, which should be the driver of economic growth, has been “asleep” for a long time now. Cross-border loans, which local companies took out excessively in the period before the crisis, even though they represented a growth of their foreign debt (by still more favourable conditions than in-country borrowing), meant an increase of investments as well as production. Therefore, the fact that the business sector is net delevera-ging, that credit exposure of local banks is falling and the percentage of non-performing loans is growing, indicates major problems of local companies and lack of significant new investments, which will certainly have a negative impact on economic growth and increase of employment in the coming period. Deleveraging of the banking sector recorded in Q3 is consistent with the fact that currently there is a trend within the banking sector in the region of withdrawing funds from banks by their parent banks abroad. In Q3 the trend of continuous deleveraging (which has been present for several quarters in a row) of NBS and the banking sector continued, with the exception of the business sector (which slightly increased borrowing – by 22 million euros net). National Bank of Serbia deleveraged 180 million euros net, mostly due to paying off the IMF debt (175.3 million euros were paid for these purposes in Q3). Additionally, the banks deleveraged 149 million euros (28 million euros for long-term and 121 million euros for short-term loans). Growth of public sector debt during Q3 of 273 million euros net was primarily the result of withdrawing first part of the loan approved by the Russian Government as support to the Serbian budget3.Forex reserves during Q3 2013 have been reduced by 164 million euros (Table T4-1), where the increase of forex reserves in July (66 million euros) was accompanied by a smaller reduction in august (61 million euros). September saw a considerable decline in foreign-exchange reserves (170 million euros). One of the reasons behind the reduction of forex reserves in Q3 was the payment of the IMF debt (outflow from forex reserves for these purposes was: 23 million euros in July, 100 million euros in August, and 52 million euros in September4). In Q3, the NBS in-tervened on the foreign exchange market by selling foreign currency in July (30 million euros) and in September (90 million euros), while there were no interventions in August. In October,
2 For more details on the analysis of FDIs in Serbia, see Highlight 2.3 Total loan was approved in April in the amount of 500 million dollars, for the duration of ten years with a two-year grace period. The loan has a fixed annual interest rate of 3.50%. The first amount (300 million dollars) was paid on September 9, 2013. 4 http://www.nbs.rs/internet/cirilica/scripts/showContent.html?id=6773&konverzija=no http://www.nbs.rs/internet/cirilica/scripts/showContent.html?id=6710&konverzija=no http://www.nbs.rs/internet/cirilica/scripts/showContent.html?id=6651&konverzija=no
Inflow of FDIs is still very low
Net outflow of other investments...
...determined by deleveraging of
financial loans...
...and by outflow on the Cash and Deposit
account
In Q3, a continued trend of constant
deleveraging of NBS and the banks...
…stagnation in deleveraging of
companies...
…and public sector borrowing
Forex reserves reduced by 164 million euros

Tren
ds
30
Tren
ds
30 4. Balance of Payments and Foreign Trade
the NBS intervened in the opposite direction due to the appreciation pressures, so it purchased securities in the amount of 165 million euros.
Exports
After a fast growth in the first half of the year, an exceptionally high year-on-year growth of exports of 38.5% was recorded in Q3 (Table T4-6). As in the first half of the year, such a high result is mainly due to the automobile industry’s exports. Still, compared to previous two qu-arters, there was a noticeable accelerated growth of exports excluding road vehicles (22.0% in Q3, compared to 8.2% in Q1 and 3.4% in Q2), despite the delayed effect of real appreciation of the domestic currency at the beginning of 2013. Accelerated Exports excluding road vehicles are explained by eurozone countries getting out of the recession. There was a recovery of exports of agricultural and food products in Q3, due to a relatively good agricultural season. In the coming period, we expect the recovery of EU countries to continue, which will have a positive impact on local economy’s exports, but also on the export structure, as it will affect accelerated recovery of growth of all export components.
Table T4-6. Serbia: Exports, year-on-year growth rates, 2011–20132012 2013 2012 2013
Q1 Q2 Q3 Q1 Q2 Q3 Q1 Q2 Q3 Q1 Q2 Q3
in % mil. euros in %
Total 100.0 8,441 8,836 1,862 2,283 2,255 2,265 2,728 3,125 -5.2 5.8 4.5 21.7 19.5 38.5Total excluding road vehicles 94.7 8,253 8,367 1,822 2,228 2,151 1,972 2,304 2,623 -5.2 5.9 1.7 8.2 3.4 22.0
Energy 3.4 310 303 64 86 65 95 131 145 1.1 -26.7 -6.0 49.4 53.6 125.3Intermediate products 36.2 3,980 3,199 739 878 812 838 981 1,012 -25.0 -7.1 -19.8 13.5 11.7 24.5Capital products 18.9 1,001 1,667 268 365 410 570 761 859 35.6 25.5 63.9 112.8 108.3 109.4
Capital products excluding road vehicles 13.5 813 1,197 228 310 306 278 337 358 48.0 62.3 47.9 21.6 8.7 17.0Durable consumer goods 4.5 347 395 78 100 106 104 136 142 5.0 12.3 18.5 32.9 35.9 33.8Non-durable consumer goods 25.2 2,118 2,231 478 543 598 503 560 675 2.5 13.2 4.6 5.3 3.1 12.8Other 11.8 686 1,042 235 312 264 154 160 292 32.6 69.3 60.6 -34.3 -48.8 10.7
Exports share in 2012 20111) 20121)
Source: SORS.1) data expressed in millions of euros, as well as year-on-year growth rates were calculated based on data from the Statistical Office of the Republic of Serbia, calculated according to the new methodology. For details, see QM #20, Box 1 “Change in Foreign Trade Methodology of the Statistical Office of the Republic of Serbia”.
Energy exports recorded a very high year-on-year growth of 125.3%. However, contribution of exports of these products to total exports is low, having in mind that their share in total exports value of 2012 was less than 5% (Table T4-6). The recorded Energy growth indicates that the effects of NIS’ investments into new production capacities (which the company undertook last year) somewhat affected the exports of oil derivatives – even though there was a much bigger effect on the reduction of exports of these types of products.Exports of Capital Products excluding road vehicles recorded a year-on-year growth at the rate
of 17.0%. This represents an accelerated growth compared to the previous quarter, but a slow-down compared to the value of exports of these products in Q1 2013. Exports of Non-durable Consumer Goods also accelerated growth compa-red to the beginning of the year. On the other hand, exports of Durable Consumer Goods were 33.8%, which is somewhat lower compared to the growth realised in the previous quarter. Af-ter a reduction over the last two quarters, a po-sitive result was realised in Q3 in the exports of products classified under Other Exports – a year-on-year growth of 10.7%. We expect that the recovery of the eurozone will especially have a
positive impact on the growth of exports of the stated groups of products in the coming period (Table T4-6).
Strong growth of exports of 38.5%
recorded in Q3
High growth of exports of energy products
Eurozone recovery will have a positive impact
on the growth of all export groups
600800
100012001400160018002000220024002600280030003200
Q1 Q2 Q3 Q4 Q1 Q2 Q3 Q4 Q1 Q2 Q3 Q4 Q1 Q2 Q3 Q4 Q1 Q2 Q3 Q4 Q1 Q2 Q3 Q4 Q1 Q2 Q3 Q4 Q1 Q2 Q3 Q4 Q1 Q2 Q3
2005 2006 2007 2008 2009 2010 2011 2012 2013
mill
ions
of E
UR
Seasonally adjusted exports
Graph T4-7. Serbia: Seasonally Adjusted Exports, quarterly, 2005-2013
Source: NBS, SORS, QM.

Tren
ds
31Quarterly Monitor No. 34 • July–September 2013
Tren
ds
31
By observing seasonally adjusted values, a
pronounced growth of exports can be seen
Strong growth of exports is especially evident if we observe its seasonally adjusted values (Graph T4-7). That is, the exports are by 13.1% higher than in the previous quarter, which represents an extremely high rate of 63.8% on an annual level. This kind of quarterly increase of seasonally adjusted exports has significantly surpassed the growth realised in Q1 2013, compared to Q4 2012 of 6% (26.2% annualised), and growth in Q2 compared to Q1 2013 of 5.1% (22.1% annua-lised). Even though growth of exports in Q3 was to be expected, this high growth has exceeded all expectations. In 2014, we foresee a slowdown in the growth of exports. It is our estimate that exports of FIAT vehicles, with existing capacities, is close to maximum, which is why we expect a significantly slower growth of car exports in 2014. It is expected that the good agricultural production in 2013 will be one of the main drivers of exports in the first half of next year.
Imports
Even though the year-on-year growth during Q3 was 10.1%, which means the imports recorded an accelerated growth compared to the previous two quarters of 2013 (stagnation in Q1, mild growth in Q2 of 3.2%, see Table T4-8), we still estimate such a result to be moderate. This esti-mate is based on the realised strong growth of exports during Q3 (38.5%, see previous section “Exports”). Additionally, import structure indicates that the main driver of growth of imports in the third quarter of 2013 was the growth of imports of Capital Products and Other Imports which include components for FIAT car production. Increase of imports was also affected by the over-flow of real appreciation of dinar at the beginning of the year, which was significantly mitigated by the extremely low level of domestic demand.
Table T4-8. Serbia: Imports, year-on-year growth rates, 2011–20132012 2013 2012 2013
Q1 Q2 Q3 Q1 Q2 Q3 Q1 Q2 Q3 Q1 Q2 Q3
in % mil. euros in %
100.0 14,250 14,782 3,524 3,704 3,554 3,528 3,822 3,913 5.5 5.9 1.6 0.1 3.2 10.1Total 17.5 2,846 2,585 817 553 535 548 485 563 6.4 -12.9 -10.6 -32.9 -12.3 5.3
Energy 34.8 5,030 5,146 1,157 1,382 1,301 1,144 1,292 1,321 3.9 0.7 -0.7 -1.2 -6.5 1.5Intermediate products 20.3 2,812 3,007 637 744 726 774 931 913 -8.5 2.0 5.8 21.5 25.2 25.7Capital products 2.2 320 323 77 83 80 75 77 70 15.2 15.0 0.5 -2.9 -7.0 -12.9Durable consumer goods 14.7 2,176 2,171 475 518 551 502 539 558 8.8 3.5 -5.0 5.6 4.1 1.3Non-durable consumer goods 10.5 1,066 1,551 361 425 360 486 498 489 39.8 101.2 47.6 34.8 17.2 35.7
Imports excluding energy 82.5 11,404 12,197 2,707 3,151 3,019 2,981 3,336 3,350 5.2 10.1 4.1 10.1 5.9 11.0
Imports share 2012 20111) 20121)
Source: SORS.1) data expressed in millions of euros, as well as year-on-year growth rates were calculated based on data from the Statistical Office of the Republic of Serbia, calculated according to the new methodology. For details, see QM #20, Box 1 “Change in Foreign Trade Methodology of the Statistical Office of the Republic of Serbia”.
After four consecutive quarters of year-on-year reduction of value, the Energy imports in Q3 recorded an increase of 5.3%. Still, the imported value is significantly below the level of energy imports before NIS’ investment into production capacities. Thus, the imports excluding energy realised an 11% growth compared to Q3 2012.Imports of Intermediary Goods, after three quarters of year-on-year decline, recorded a modest year-on-year growth of 1.5%. Also, a modest growth of imports was recorded in Non-durable Consumer Goods (1.3% year-on-year). Imports of Durable Consumer Goods was significantly below the last year’s, i.e. 12.9% below the imports of these products in Q3 2012. Such import values of these three groups of products indicates a lack of considerable recovery of local economy, i.e. its still low level as a result of low economic activity and high unemployment. In the coming period, considering the level of domestic demand, it will almost certainly maintain a low level, which will affect the lack of considerable recovery of imports of products classified under these three groups and their modest contribution to the growth of total imports. The biggest contribution to imports in Q3 was made by Capital Products (year-on-year growth of 25.7%) and Other Imports (year-on-year growth of 35.7%, Table T4-8). As mentioned in pre-vious issues of QM, components imported by FIAT for their car production are classified under these two groups of products. Therefore, despite the evident fast growth of these products, Q3
Imports have been accelerating growth
since the beginning of the year
Energy imports recorded a low year-on-
year growth
Modest growth of imports of
Intermediary Goods and Durable Consumer
Goods compared to Q3 2012...
…and significantly lower imports of
Durable Consumer Goods compared
to Q3 2012
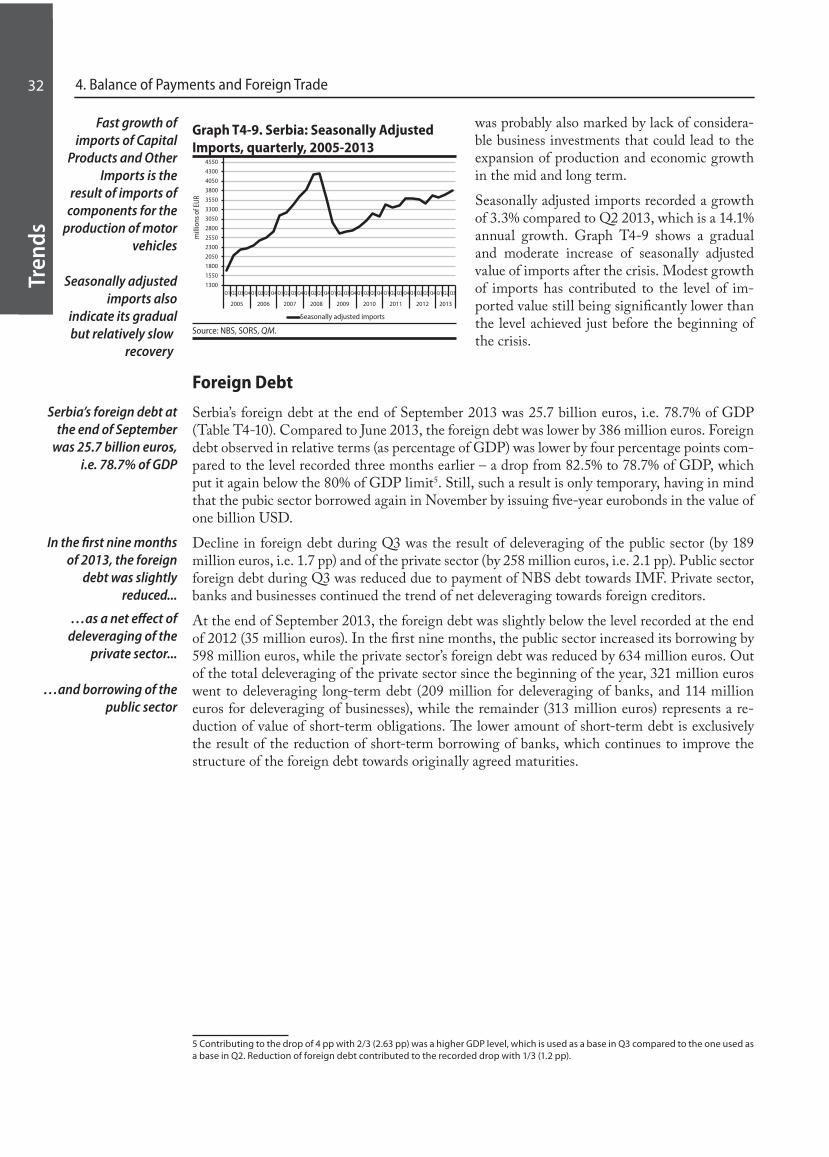
Tren
ds
32
Tren
ds
32 4. Balance of Payments and Foreign Trade
was probably also marked by lack of considera-ble business investments that could lead to the expansion of production and economic growth in the mid and long term. Seasonally adjusted imports recorded a growth of 3.3% compared to Q2 2013, which is a 14.1% annual growth. Graph T4-9 shows a gradual and moderate increase of seasonally adjusted value of imports after the crisis. Modest growth of imports has contributed to the level of im-ported value still being significantly lower than the level achieved just before the beginning of the crisis.
Foreign Debt
Serbia’s foreign debt at the end of September 2013 was 25.7 billion euros, i.e. 78.7% of GDP (Table T4-10). Compared to June 2013, the foreign debt was lower by 386 million euros. Foreign debt observed in relative terms (as percentage of GDP) was lower by four percentage points com-pared to the level recorded three months earlier – a drop from 82.5% to 78.7% of GDP, which put it again below the 80% of GDP limit5. Still, such a result is only temporary, having in mind that the pubic sector borrowed again in November by issuing five-year eurobonds in the value of one billion USD. Decline in foreign debt during Q3 was the result of deleveraging of the public sector (by 189 million euros, i.e. 1.7 pp) and of the private sector (by 258 million euros, i.e. 2.1 pp). Public sector foreign debt during Q3 was reduced due to payment of NBS debt towards IMF. Private sector, banks and businesses continued the trend of net deleveraging towards foreign creditors. At the end of September 2013, the foreign debt was slightly below the level recorded at the end of 2012 (35 million euros). In the first nine months, the public sector increased its borrowing by 598 million euros, while the private sector’s foreign debt was reduced by 634 million euros. Out of the total deleveraging of the private sector since the beginning of the year, 321 million euros went to deleveraging long-term debt (209 million for deleveraging of banks, and 114 million euros for deleveraging of businesses), while the remainder (313 million euros) represents a re-duction of value of short-term obligations. The lower amount of short-term debt is exclusively the result of the reduction of short-term borrowing of banks, which continues to improve the structure of the foreign debt towards originally agreed maturities.
5 Contributing to the drop of 4 pp with 2/3 (2.63 pp) was a higher GDP level, which is used as a base in Q3 compared to the one used as a base in Q2. Reduction of foreign debt contributed to the recorded drop with 1/3 (1.2 pp).
Serbia’s foreign debt at the end of September
was 25.7 billion euros, i.e. 78.7% of GDP
In the first nine months of 2013, the foreign
debt was slightly reduced...
…as a net effect of deleveraging of the
private sector...
…and borrowing of the public sector
1300
1550
1800
2050
2300
2550
2800
3050
3300
3550
3800
4050
4300
4550
Q1 Q2 Q3 Q4 Q1 Q2 Q3 Q4 Q1 Q2 Q3 Q4 Q1 Q2 Q3 Q4 Q1 Q2 Q3 Q4 Q1 Q2 Q3 Q4 Q1 Q2 Q3 Q4 Q1 Q2 Q3 Q4 Q1 Q2 Q3
2005 2006 2007 2008 2009 2010 2011 2012 2013
mill
ions
of E
UR
Seasonally adjusted imports
Graph T4-9. Serbia: Seasonally Adjusted Imports, quarterly, 2005-2013
Source: NBS, SORS, QM.
Fast growth of imports of Capital
Products and Other Imports is the
result of imports of components for the
production of motor vehicles
Seasonally adjusted imports also
indicate its gradual but relatively slow
recovery
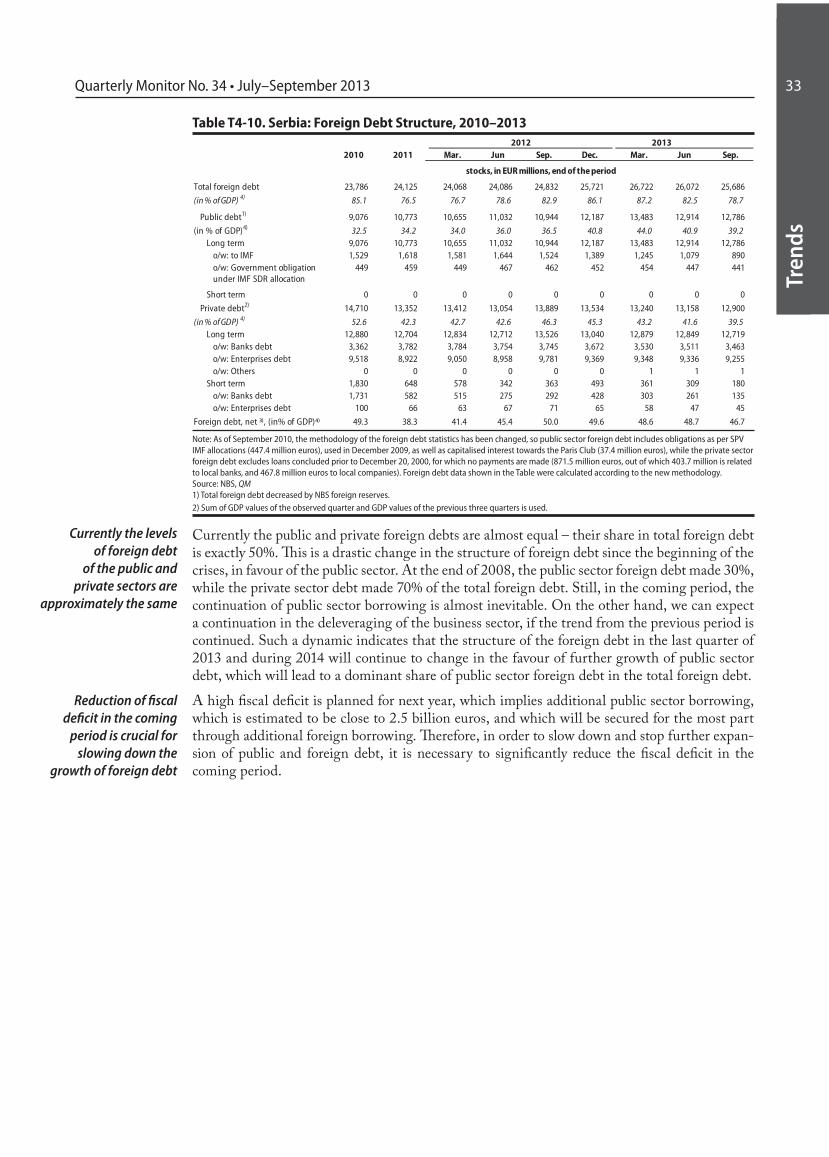
Tren
ds
33Quarterly Monitor No. 34 • July–September 2013
Tren
ds
33
Table T4-10. Serbia: Foreign Debt Structure, 2010–20132012 2013
Mar. Jun Sep. Dec. Mar. Jun Sep.
stocks, in EUR millions, end of the period
Total foreign debt 23,786 24,125 24,068 24,086 24,832 25,721 26,722 26,072 25,686
(in % of GDP) 4) 85.1 76.5 76.7 78.6 82.9 86.1 87.2 82.5 78.7
Public debt1) 9,076 10,773 10,655 11,032 10,944 12,187 13,483 12,914 12,786
(in % of GDP)4) 32.5 34.2 34.0 36.0 36.5 40.8 44.0 40.9 39.2Long term 9,076 10,773 10,655 11,032 10,944 12,187 13,483 12,914 12,786
o/w: to IMF 1,529 1,618 1,581 1,644 1,524 1,389 1,245 1,079 890o/w: Government obligation under IMF SDR allocation
449 459 449 467 462 452 454 447 441
Short term 0 0 0 0 0 0 0 0 0
Private debt2) 14,710 13,352 13,412 13,054 13,889 13,534 13,240 13,158 12,900
(in % of GDP) 4) 52.6 42.3 42.7 42.6 46.3 45.3 43.2 41.6 39.5Long term 12,880 12,704 12,834 12,712 13,526 13,040 12,879 12,849 12,719
o/w: Banks debt 3,362 3,782 3,784 3,754 3,745 3,672 3,530 3,511 3,463o/w: Enterprises debt 9,518 8,922 9,050 8,958 9,781 9,369 9,348 9,336 9,255o/w: Others 0 0 0 0 0 0 1 1 1
Short term 1,830 648 578 342 363 493 361 309 180o/w: Banks debt 1,731 582 515 275 292 428 303 261 135o/w: Enterprises debt 100 66 63 67 71 65 58 47 45
Foreign debt, net , (in% of GDP) 49.3 38.3 41.4 45.4 50.0 49.6 48.6 48.7 46.7
2010 2011
Note: As of September 2010, the methodology of the foreign debt statistics has been changed, so public sector foreign debt includes obligations as per SPV IMF allocations (447.4 million euros), used in December 2009, as well as capitalised interest towards the Paris Club (37.4 million euros), while the private sector foreign debt excludes loans concluded prior to December 20, 2000, for which no payments are made (871.5 million euros, out of which 403.7 million is related to local banks, and 467.8 million euros to local companies). Foreign debt data shown in the Table were calculated according to the new methodology. Source: NBS, QM1) Total foreign debt decreased by NBS foreign reserves. 2) Sum of GDP values of the observed quarter and GDP values of the previous three quarters is used.
Currently the public and private foreign debts are almost equal – their share in total foreign debt is exactly 50%. This is a drastic change in the structure of foreign debt since the beginning of the crises, in favour of the public sector. At the end of 2008, the public sector foreign debt made 30%, while the private sector debt made 70% of the total foreign debt. Still, in the coming period, the continuation of public sector borrowing is almost inevitable. On the other hand, we can expect a continuation in the deleveraging of the business sector, if the trend from the previous period is continued. Such a dynamic indicates that the structure of the foreign debt in the last quarter of 2013 and during 2014 will continue to change in the favour of further growth of public sector debt, which will lead to a dominant share of public sector foreign debt in the total foreign debt. A high fiscal deficit is planned for next year, which implies additional public sector borrowing, which is estimated to be close to 2.5 billion euros, and which will be secured for the most part through additional foreign borrowing. Therefore, in order to slow down and stop further expan-sion of public and foreign debt, it is necessary to significantly reduce the fiscal deficit in the coming period.
Currently the levels of foreign debt
of the public and private sectors are
approximately the same
Reduction of fiscal deficit in the coming
period is crucial for slowing down the
growth of foreign debt
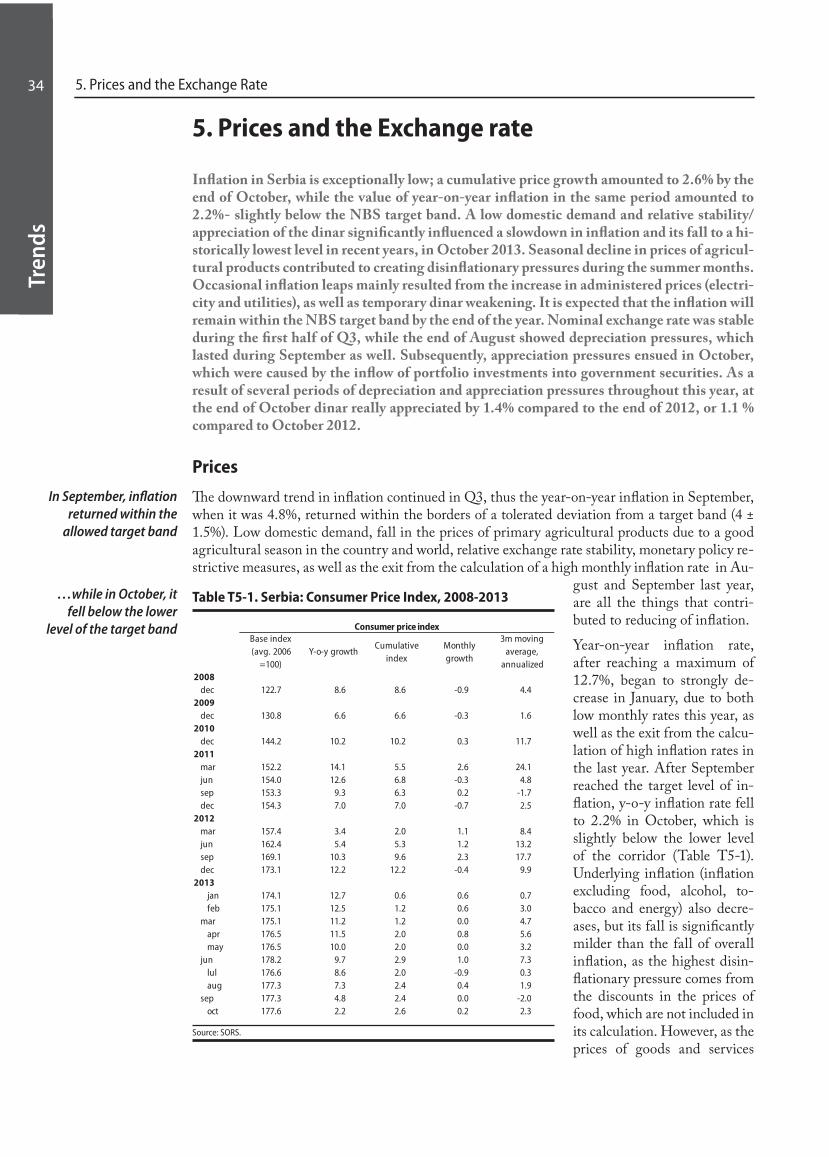
Tren
ds
34
Tren
ds
34 5. Prices and the Exchange Rate
5. Prices and the Exchange rate
Inflation in Serbia is exceptionally low; a cumulative price growth amounted to 2.6% by the end of October, while the value of year-on-year inflation in the same period amounted to 2.2%- slightly below the NBS target band. A low domestic demand and relative stability/ appreciation of the dinar significantly influenced a slowdown in inflation and its fall to a hi-storically lowest level in recent years, in October 2013. Seasonal decline in prices of agricul-tural products contributed to creating disinflationary pressures during the summer months. Occasional inflation leaps mainly resulted from the increase in administered prices (electri-city and utilities), as well as temporary dinar weakening. It is expected that the inflation will remain within the NBS target band by the end of the year. Nominal exchange rate was stable during the first half of Q3, while the end of August showed depreciation pressures, which lasted during September as well. Subsequently, appreciation pressures ensued in October, which were caused by the inflow of portfolio investments into government securities. As a result of several periods of depreciation and appreciation pressures throughout this year, at the end of October dinar really appreciated by 1.4% compared to the end of 2012, or 1.1 % compared to October 2012.
Prices
The downward trend in inflation continued in Q3, thus the year-on-year inflation in September, when it was 4.8%, returned within the borders of a tolerated deviation from a target band (4 ± 1.5%). Low domestic demand, fall in the prices of primary agricultural products due to a good agricultural season in the country and world, relative exchange rate stability, monetary policy re-strictive measures, as well as the exit from the calculation of a high monthly inflation rate in Au-
gust and September last year, are all the things that contri-buted to reducing of inflation. Year-on-year inflation rate, after reaching a maximum of 12.7%, began to strongly de-crease in January, due to both low monthly rates this year, as well as the exit from the calcu-lation of high inflation rates in the last year. After September reached the target level of in-flation, y-o-y inflation rate fell to 2.2% in October, which is slightly below the lower level of the corridor (Table T5-1). Underlying inflation (inflation excluding food, alcohol, to-bacco and energy) also decre-ases, but its fall is significantly milder than the fall of overall inflation, as the highest disin-flationary pressure comes from the discounts in the prices of food, which are not included in its calculation. However, as the prices of goods and services
Source: SORS.
In September, inflation returned within the
allowed target band
…while in October, it fell below the lower
level of the target band
Table T5-1. Serbia: Consumer Price Index, 2008-2013
Consumer price indexBase index (avg. 2006
=100)Y-o-y growth
Cumulative index
Monthly growth
3m moving average,
annualized2008
dec 122.7 8.6 8.6 -0.9 4.42009
dec 130.8 6.6 6.6 -0.3 1.62010
dec 144.2 10.2 10.2 0.3 11.72011
mar 152.2 14.1 5.5 2.6 24.1jun 154.0 12.6 6.8 -0.3 4.8sep 153.3 9.3 6.3 0.2 -1.7dec 154.3 7.0 7.0 -0.7 2.5
2012mar 157.4 3.4 2.0 1.1 8.4jun 162.4 5.4 5.3 1.2 13.2sep 169.1 10.3 9.6 2.3 17.7dec 173.1 12.2 12.2 -0.4 9.9
2013jan 174.1 12.7 0.6 0.6 0.7feb 175.1 12.5 1.2 0.6 3.0
mar 175.1 11.2 1.2 0.0 4.7apr 176.5 11.5 2.0 0.8 5.6may 176.5 10.0 2.0 0.0 3.2
jun 178.2 9.7 2.9 1.0 7.3lul 176.6 8.6 2.0 -0.9 0.3aug 177.3 7.3 2.4 0.4 1.9
sep 177.3 4.8 2.4 0.0 -2.0oct 177.6 2.2 2.6 0.2 2.3
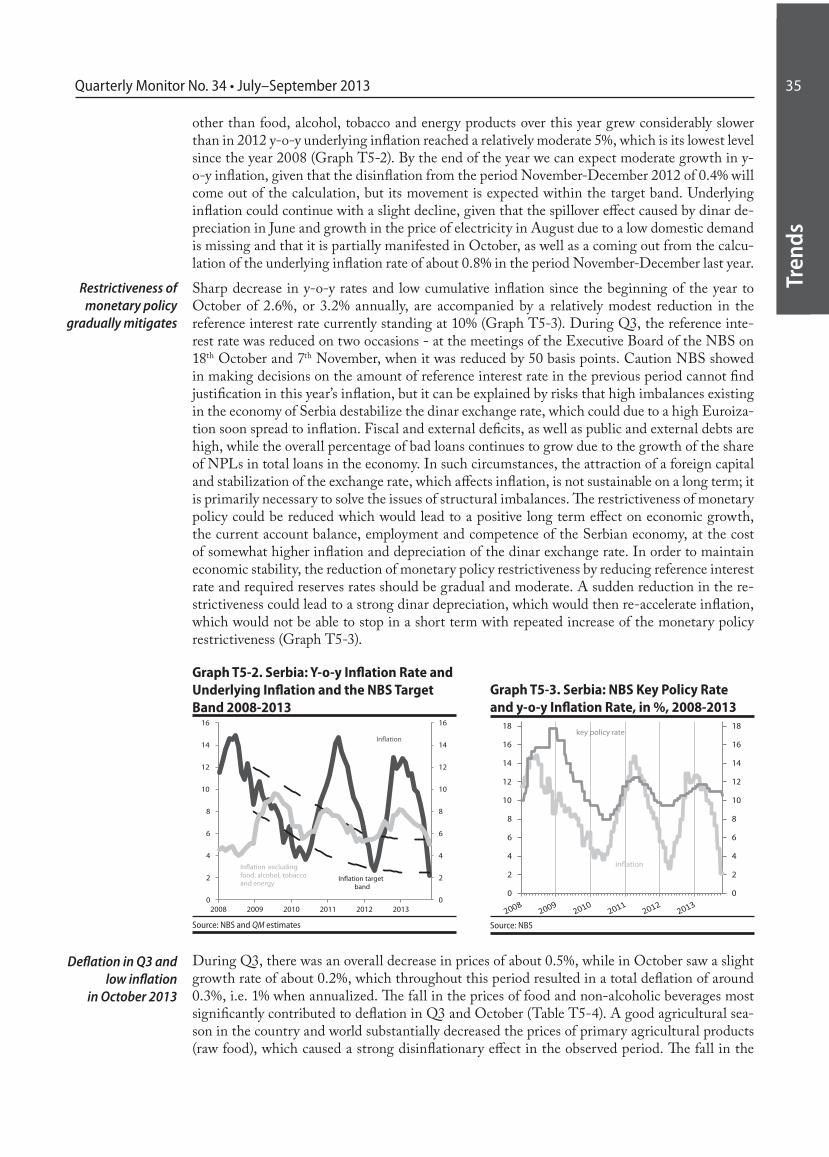
Tren
ds
35Quarterly Monitor No. 34 • July–September 2013
Tren
ds
35
other than food, alcohol, tobacco and energy products over this year grew considerably slower than in 2012 y-o-y underlying inflation reached a relatively moderate 5%, which is its lowest level since the year 2008 (Graph T5-2). By the end of the year we can expect moderate growth in y-o-y inflation, given that the disinflation from the period November-December 2012 of 0.4% will come out of the calculation, but its movement is expected within the target band. Underlying inflation could continue with a slight decline, given that the spillover effect caused by dinar de-preciation in June and growth in the price of electricity in August due to a low domestic demand is missing and that it is partially manifested in October, as well as a coming out from the calcu-lation of the underlying inflation rate of about 0.8% in the period November-December last year. Sharp decrease in y-o-y rates and low cumulative inflation since the beginning of the year to October of 2.6%, or 3.2% annually, are accompanied by a relatively modest reduction in the reference interest rate currently standing at 10% (Graph T5-3). During Q3, the reference inte-rest rate was reduced on two occasions - at the meetings of the Executive Board of the NBS on 18th October and 7th November, when it was reduced by 50 basis points. Caution NBS showed in making decisions on the amount of reference interest rate in the previous period cannot find justification in this year’s inflation, but it can be explained by risks that high imbalances existing in the economy of Serbia destabilize the dinar exchange rate, which could due to a high Euroiza-tion soon spread to inflation. Fiscal and external deficits, as well as public and external debts are high, while the overall percentage of bad loans continues to grow due to the growth of the share of NPLs in total loans in the economy. In such circumstances, the attraction of a foreign capital and stabilization of the exchange rate, which affects inflation, is not sustainable on a long term; it is primarily necessary to solve the issues of structural imbalances. The restrictiveness of monetary policy could be reduced which would lead to a positive long term effect on economic growth, the current account balance, employment and competence of the Serbian economy, at the cost of somewhat higher inflation and depreciation of the dinar exchange rate. In order to maintain economic stability, the reduction of monetary policy restrictiveness by reducing reference interest rate and required reserves rates should be gradual and moderate. A sudden reduction in the re-strictiveness could lead to a strong dinar depreciation, which would then re-accelerate inflation, which would not be able to stop in a short term with repeated increase of the monetary policy restrictiveness (Graph T5-3).
During Q3, there was an overall decrease in prices of about 0.5%, while in October saw a slight growth rate of about 0.2%, which throughout this period resulted in a total deflation of around 0.3%, i.e. 1% when annualized. The fall in the prices of food and non-alcoholic beverages most significantly contributed to deflation in Q3 and October (Table T5-4). A good agricultural sea-son in the country and world substantially decreased the prices of primary agricultural products (raw food), which caused a strong disinflationary effect in the observed period. The fall in the
Restrictiveness of monetary policy
gradually mitigates
Deflation in Q3 and low inflation
in October 2013
0
2
4
6
8
10
12
14
16
0
2
4
6
8
10
12
14
16
2008 2009 2010 2011 2012 2013
Inflation excluding food, alcohol, tobacco and energy
Inflation
Inflation target band
Graph T5-2. Serbia: Y-o-y Inflation Rate and Underlying Inflation and the NBS Target Band 2008-2013
Source: NBS and QM estimates
0
2
4
6
8
10
12
14
16
18
0
2
4
6
8
10
12
14
16
18key policy rate
inflation
Graph T5-3. Serbia: NBS Key Policy Rate and y-o-y Inflation Rate, in %, 2008-2013
Source: NBS
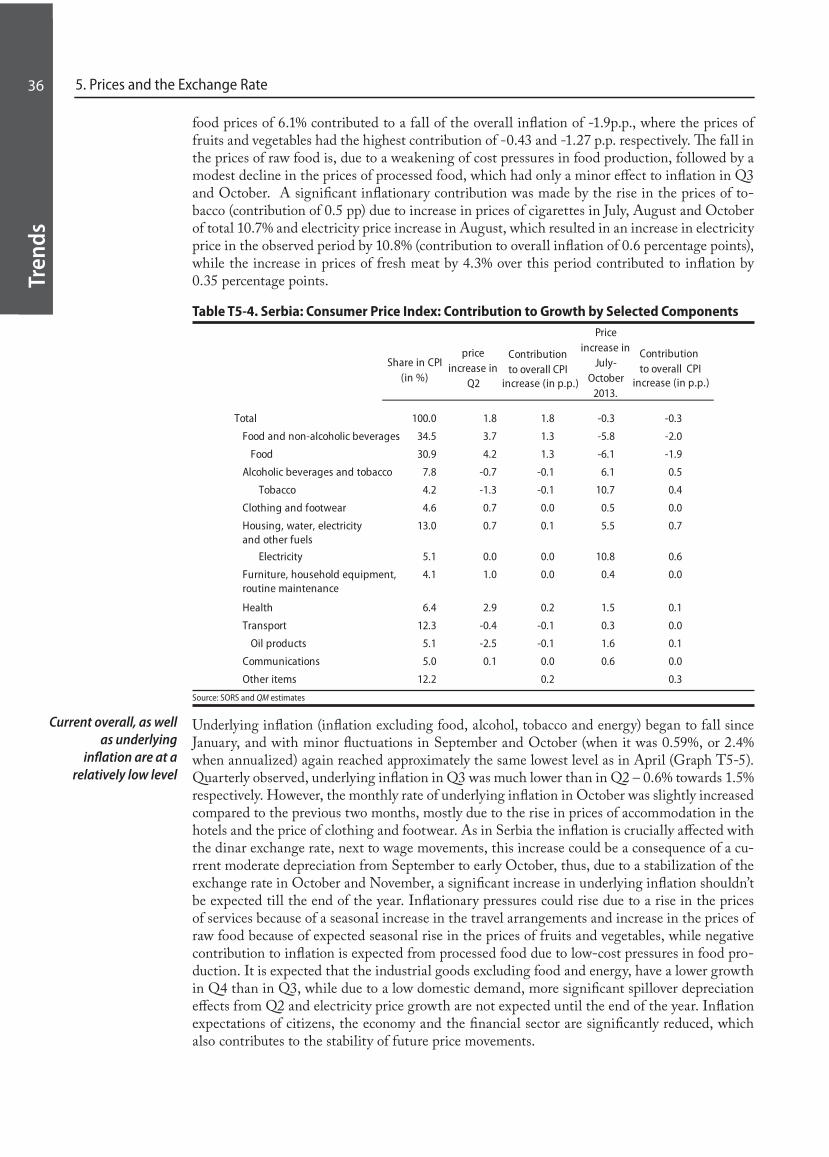
Tren
ds
36
Tren
ds
36 5. Prices and the Exchange Rate
food prices of 6.1% contributed to a fall of the overall inflation of -1.9p.p., where the prices of fruits and vegetables had the highest contribution of -0.43 and -1.27 p.p. respectively. The fall in the prices of raw food is, due to a weakening of cost pressures in food production, followed by a modest decline in the prices of processed food, which had only a minor effect to inflation in Q3 and October. A significant inflationary contribution was made by the rise in the prices of to-bacco (contribution of 0.5 pp) due to increase in prices of cigarettes in July, August and October of total 10.7% and electricity price increase in August, which resulted in an increase in electricity price in the observed period by 10.8% (contribution to overall inflation of 0.6 percentage points), while the increase in prices of fresh meat by 4.3% over this period contributed to inflation by 0.35 percentage points.
Table T5-4. Serbia: Consumer Price Index: Contribution to Growth by Selected Components
Share in CPI (in %)
price increase in
Q2
Contributionto overall CPI
increase (in p.p.)
Price increase in
July-October
2013.
Contributionto overall CPI
increase (in p.p.)
Total 100.0 1.8 1.8 -0.3 -0.3
Food and non-alcoholic beverages 34.5 3.7 1.3 -5.8 -2.0
Food 30.9 4.2 1.3 -6.1 -1.9
Alcoholic beverages and tobacco 7.8 -0.7 -0.1 6.1 0.5
Tobacco 4.2 -1.3 -0.1 10.7 0.4
Clothing and footwear 4.6 0.7 0.0 0.5 0.0
Housing, water, electricity and other fuels
13.0 0.7 0.1 5.5 0.7
Electricity 5.1 0.0 0.0 10.8 0.6
Furniture, household equipment,routine maintenance
4.1 1.0 0.0 0.4 0.0
Health 6.4 2.9 0.2 1.5 0.1
Transport 12.3 -0.4 -0.1 0.3 0.0
Oil products 5.1 -2.5 -0.1 1.6 0.1
Communications 5.0 0.1 0.0 0.6 0.0
Other items 12.2 0.2 0.3
Source: SORS and QM estimates
Underlying inflation (inflation excluding food, alcohol, tobacco and energy) began to fall since January, and with minor fluctuations in September and October (when it was 0.59%, or 2.4% when annualized) again reached approximately the same lowest level as in April (Graph T5-5). Quarterly observed, underlying inflation in Q3 was much lower than in Q2 – 0.6% towards 1.5% respectively. However, the monthly rate of underlying inflation in October was slightly increased compared to the previous two months, mostly due to the rise in prices of accommodation in the hotels and the price of clothing and footwear. As in Serbia the inflation is crucially affected with the dinar exchange rate, next to wage movements, this increase could be a consequence of a cu-rrent moderate depreciation from September to early October, thus, due to a stabilization of the exchange rate in October and November, a significant increase in underlying inflation shouldn’t be expected till the end of the year. Inflationary pressures could rise due to a rise in the prices of services because of a seasonal increase in the travel arrangements and increase in the prices of raw food because of expected seasonal rise in the prices of fruits and vegetables, while negative contribution to inflation is expected from processed food due to low-cost pressures in food pro-duction. It is expected that the industrial goods excluding food and energy, have a lower growth in Q4 than in Q3, while due to a low domestic demand, more significant spillover depreciation effects from Q2 and electricity price growth are not expected until the end of the year. Inflation expectations of citizens, the economy and the financial sector are significantly reduced, which also contributes to the stability of future price movements.
Current overall, as well as underlying
inflation are at a relatively low level
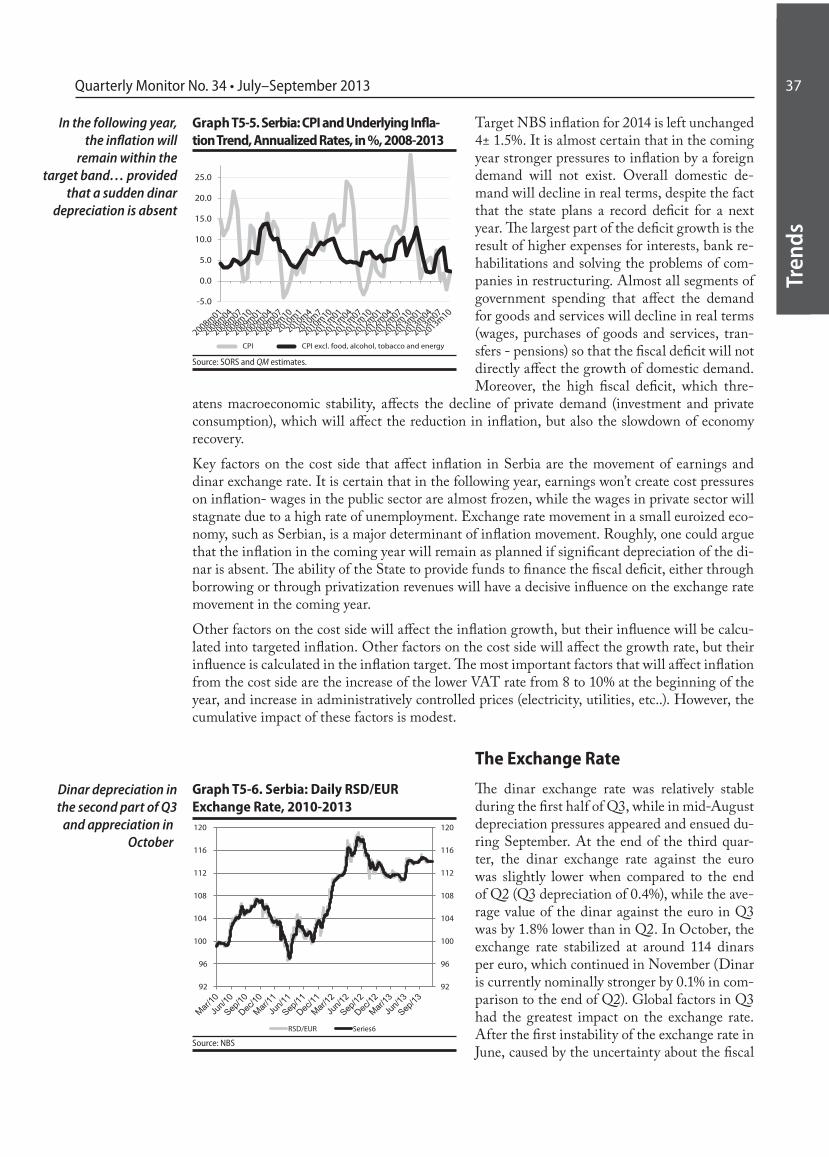
Tren
ds
37Quarterly Monitor No. 34 • July–September 2013
Tren
ds
37
Dinar depreciation in the second part of Q3
and appreciation in October
Target NBS inflation for 2014 is left unchanged 4± 1.5%. It is almost certain that in the coming year stronger pressures to inflation by a foreign demand will not exist. Overall domestic de-mand will decline in real terms, despite the fact that the state plans a record deficit for a next year. The largest part of the deficit growth is the result of higher expenses for interests, bank re-habilitations and solving the problems of com-panies in restructuring. Almost all segments of government spending that affect the demand for goods and services will decline in real terms (wages, purchases of goods and services, tran-sfers - pensions) so that the fiscal deficit will not directly affect the growth of domestic demand. Moreover, the high fiscal deficit, which thre-
atens macroeconomic stability, affects the decline of private demand (investment and private consumption), which will affect the reduction in inflation, but also the slowdown of economy recovery.Key factors on the cost side that affect inflation in Serbia are the movement of earnings and dinar exchange rate. It is certain that in the following year, earnings won’t create cost pressures on inflation- wages in the public sector are almost frozen, while the wages in private sector will stagnate due to a high rate of unemployment. Exchange rate movement in a small euroized eco-nomy, such as Serbian, is a major determinant of inflation movement. Roughly, one could argue that the inflation in the coming year will remain as planned if significant depreciation of the di-nar is absent. The ability of the State to provide funds to finance the fiscal deficit, either through borrowing or through privatization revenues will have a decisive influence on the exchange rate movement in the coming year. Other factors on the cost side will affect the inflation growth, but their influence will be calcu-lated into targeted inflation. Other factors on the cost side will affect the growth rate, but their influence is calculated in the inflation target. The most important factors that will affect inflation from the cost side are the increase of the lower VAT rate from 8 to 10% at the beginning of the year, and increase in administratively controlled prices (electricity, utilities, etc..). However, the cumulative impact of these factors is modest.
The Exchange Rate
The dinar exchange rate was relatively stable during the first half of Q3, while in mid-August depreciation pressures appeared and ensued du-ring September. At the end of the third quar-ter, the dinar exchange rate against the euro was slightly lower when compared to the end of Q2 (Q3 depreciation of 0.4%), while the ave-rage value of the dinar against the euro in Q3 was by 1.8% lower than in Q2. In October, the exchange rate stabilized at around 114 dinars per euro, which continued in November (Dinar is currently nominally stronger by 0.1% in com-parison to the end of Q2). Global factors in Q3 had the greatest impact on the exchange rate. After the first instability of the exchange rate in June, caused by the uncertainty about the fiscal
In the following year, the inflation will
remain within the target band… provided
that a sudden dinar depreciation is absent
-5.0
0.0
5.0
10.0
15.0
20.0
25.0
CPI CPI excl. food, alcohol, tobacco and energy
Graph T5-5. Serbia: CPI and Underlying Infla-tion Trend, Annualized Rates, in %, 2008-2013
Source: SORS and QM estimates.
92
96
100
104
108
112
116
120
92
96
100
104
108
112
116
120
RSD/EUR Series6
Graph T5-6. Serbia: Daily RSD/EUR Exchange Rate, 2010-2013
Source: NBS

Tren
ds
38
Tren
ds
38 5. Prices and the Exchange Rate
position of the country and decisions regarding the policy of FED’s quantitative easing, foreign exchange market stabilized in July. During this first period of instability, the NBS intervened in the foreign exchange market and by the end of Q2 sold a total of 275 million euros. During Q3
National Bank of Serbia continued to intervene in the foreign exchange market with total sales of 120 million euros at the beginning and at the end of July and mid-September. With interven-tions in the foreign exchange market, the NBS has sent a message to investors that it is ready and able to maintain the stability of the exchan-ge rate, at least in the short term. Such messages of NBS in combination with high dinar interest rates on treasury securities and REPO securi-ties encouraged portfolio investors to increase their investments in Serbia, in order to take ad-vantage of the possibility of high profits. The inflow of portfolio investment combined with the favorable trends in the current account ba-lance has contributed to a slight strengthening of the dinar against the euro (Graph T5-6).
Throughout Q3, the dinar depreciated in real terms against the euro by 1.1%, which, together with the depreciation of the second half of Q2, reduced the real appreciation from the beginning of the year (a cumulative effect by the end of September is appreciation of 0.7%). However, due to a large inflow of foreign currency in October, caused by the positive tendencies in foreign trade exchange and growth of economy’s borrowing abroad, the dinar strengthened on real terms by additional 0.7%, so that at the end of October, the real exchange rate is by about 1.4% stronger than the one in December (Graph T5-7). Low rate of inflation in the previous period also con-tributed to a stabilization of a real exchange rate (if the inflation was higher, the real appreciation would be also higher for the same nominal values). Historically, the real exchange rate today is roughly the same as in late 2011, or the end of 2007 (Graph T5-7).Affordable trends in foreign trade and current account balance suggest that the real value of the dinar probably does not deviate significantly from the equilibrium level. This conclusion is confirmed by the movement of the real exchange rate, and unit labor costs expressed in euros (see Chapter 2). However, external deficits, although reduced, remain high and their funding largely depends on the ability of the country to borrow abroad. Improvement of the external balance is largely a consequence of the high fall in private domestic demand, particularly the fall in private investment, which is unsustainable on a long-term from the standpoint of the growth in the production and employment. Therefore, mild real depreciation of the dinar would affect the continued reduction in external deficits and thus to reduction of the need to finance them. Also, a lower real value of the dinar would support low external deficit after recovery of domestic demand. In a long term, a lower real dinar value, which makes Serbian production competitive in the world, has a positive effect to a employment growth in Serbia. Eventual strengthening of the real value of the dinar would be undesirable from the standpoint of competitiveness of the Serbian economy, and with monetary policy NBS should discourage such trends (by reducing the repo rate and direct interventions in the foreign exchange market).
Real depreciation reached maximum at
the end of Q3
Mild real depreciation would improve the competitiveness of the economy, with affordable costs in
inflation and borrowing costs
75
80
85
90
95
100
105
110
115
120
70
75
80
85
90
95
100
105
110
115
real exchange rate, Aug 2005=100 (lhs) nominal rate (rhs)
Graph T5-7. Serbia: Nominal and Real RSD/EUR Exchange Rate, Monthly Averages, 2005-2013
Source: NBS, SORS, Eurostat and QM estimatesNote: an increase represents depreciation
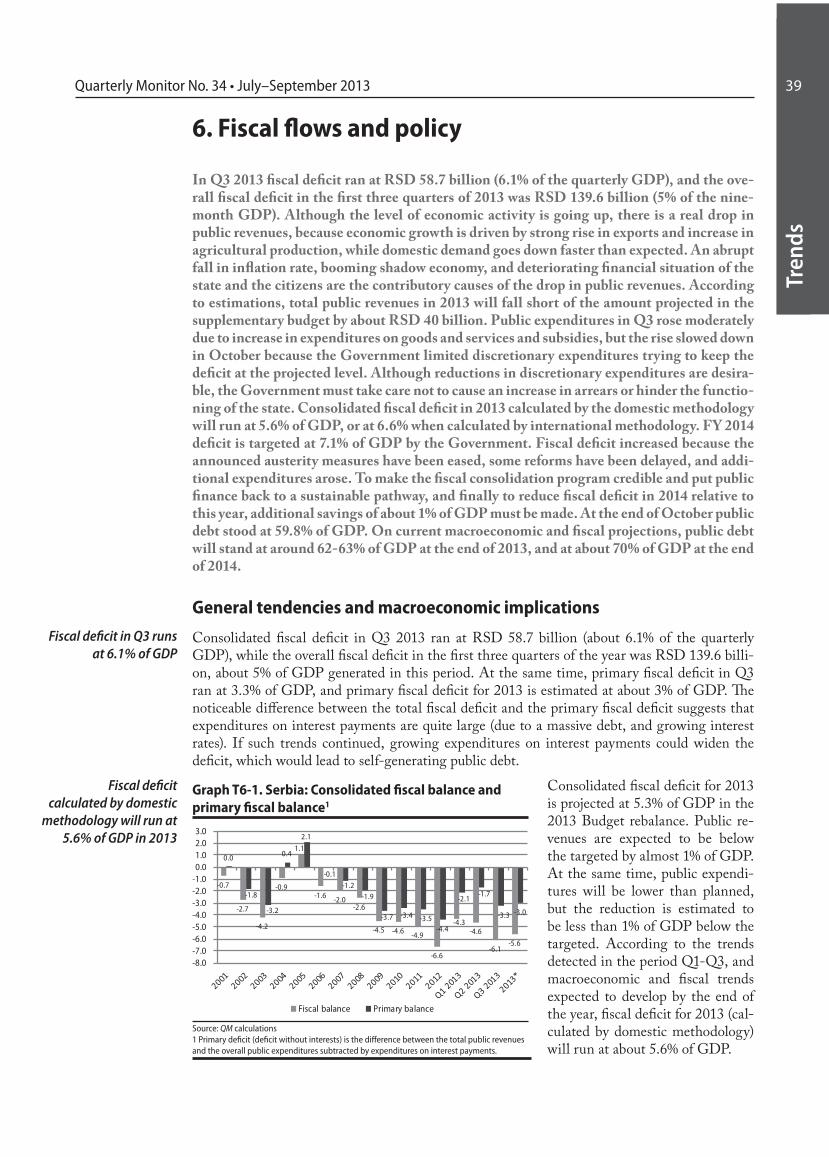
Tren
ds
39Quarterly Monitor No. 34 • July–September 2013
Tren
ds
39
6. Fiscal flows and policy
In Q3 2013 fiscal deficit ran at RSD 58.7 billion (6.1% of the quarterly GDP), and the ove-rall fiscal deficit in the first three quarters of 2013 was RSD 139.6 billion (5% of the nine-month GDP). Although the level of economic activity is going up, there is a real drop in public revenues, because economic growth is driven by strong rise in exports and increase in agricultural production, while domestic demand goes down faster than expected. An abrupt fall in inflation rate, booming shadow economy, and deteriorating financial situation of the state and the citizens are the contributory causes of the drop in public revenues. According to estimations, total public revenues in 2013 will fall short of the amount projected in the supplementary budget by about RSD 40 billion. Public expenditures in Q3 rose moderately due to increase in expenditures on goods and services and subsidies, but the rise slowed down in October because the Government limited discretionary expenditures trying to keep the deficit at the projected level. Although reductions in discretionary expenditures are desira-ble, the Government must take care not to cause an increase in arrears or hinder the functio-ning of the state. Consolidated fiscal deficit in 2013 calculated by the domestic methodology will run at 5.6% of GDP, or at 6.6% when calculated by international methodology. FY 2014 deficit is targeted at 7.1% of GDP by the Government. Fiscal deficit increased because the announced austerity measures have been eased, some reforms have been delayed, and addi-tional expenditures arose. To make the fiscal consolidation program credible and put public finance back to a sustainable pathway, and finally to reduce fiscal deficit in 2014 relative to this year, additional savings of about 1% of GDP must be made. At the end of October public debt stood at 59.8% of GDP. On current macroeconomic and fiscal projections, public debt will stand at around 62-63% of GDP at the end of 2013, and at about 70% of GDP at the end of 2014.
General tendencies and macroeconomic implications
Consolidated fiscal deficit in Q3 2013 ran at RSD 58.7 billion (about 6.1% of the quarterly GDP), while the overall fiscal deficit in the first three quarters of the year was RSD 139.6 billi-on, about 5% of GDP generated in this period. At the same time, primary fiscal deficit in Q3 ran at 3.3% of GDP, and primary fiscal deficit for 2013 is estimated at about 3% of GDP. The noticeable difference between the total fiscal deficit and the primary fiscal deficit suggests that expenditures on interest payments are quite large (due to a massive debt, and growing interest rates). If such trends continued, growing expenditures on interest payments could widen the deficit, which would lead to self-generating public debt.
Consolidated fiscal deficit for 2013 is projected at 5.3% of GDP in the 2013 Budget rebalance. Public re-venues are expected to be below the targeted by almost 1% of GDP. At the same time, public expendi-tures will be lower than planned, but the reduction is estimated to be less than 1% of GDP below the targeted. According to the trends detected in the period Q1-Q3, and macroeconomic and fiscal trends expected to develop by the end of the year, fiscal deficit for 2013 (cal-culated by domestic methodology) will run at about 5.6% of GDP.
Fiscal deficit in Q3 runs at 6.1% of GDP
Fiscal deficit calculated by domestic
methodology will run at 5.6% of GDP in 2013
-0.7
-2.7
-4.2
-0.9
1.1
-1.6 -2.0-2.6
-4.5 -4.6 -4.9
-6.6
-4.3-4.6
-6.1-5.6
0.0
-1.8
-3.2
0.4
2.1
-0.1
-1.2-1.9
-3.7 -3.4 -3.5-4.4
-2.1-1.7
-3.3 -3.0
-8.0-7.0-6.0-5.0-4.0-3.0-2.0-1.00.01.02.03.0
Fiscal balance Primary balance
Graph T6-1. Serbia: Consolidated fiscal balance and primary fiscal balance1
Source: QM calculations1 Primary deficit (deficit without interests) is the difference between the total public revenues and the overall public expenditures subtracted by expenditures on interest payments.

Tren
ds
40
Tren
ds
40 6. Fiscal Flows and Policy
Public revenues continue to slow
down and are below the targeted
...although they went up in Q3, public expenditures in 2013
will be lower than planned
Domestic methodology does not recognize spending on financial rehabilitation of banks and covering the losses incurred by state-owned and public enterprises (by meeting their liabiliti-es, repaying state guaranteed loans, giving soft loans that will never be repaid etc.) as public expenditures nor includes them in fiscal deficit. International methodology (GFS) recognizes these transactions as expenditures, so they should be included in fiscal deficit. Consolidated fiscal deficit for 2013 inclusive of these expenditures is estimated at about 6.6% of GDP, which is extremely large, both in absolute value and relative to other European states. Primary fiscal deficit, calculated by international methodology, will run at 4% of GDP in 2013. Real drop in public revenues continued in Q3, both relative to the same period last year and to Q2 (excluding the effect of seasonal factors). Public revenues dynamics detected in the period July-October suggest that the consolidated public revenues for 2013 will be by about RSD 40 billion below the amount targeted in the supplementary budget, primarily because revenues from consumption tax and social security contributions failed to meet the projections. Public revenues dynamics depend on trends in relevant macroeconomic tax bases (income and consumption), trends in macroeconomic indicators (inflation, exchange rate, balance of payment etc.), changes in the parameters of the tax system, and the level of shadow economy and financial discipline. The real fall in domestic demand and inflation in 2013 is somewhat steeper than projected, which can be a contributory cause of the decrease in public revenues. Besides, the revenue plan contained in the supplementary budget was over-optimistic by RSD 15 billion.1 However, we believe that the public revenues fell short of the targeted primarily due to deteriorating financial situation of Serbian economy and growth in shadow economy. Decreased credit activity of banks and rise in bad loans indicate that the financial situation of Serbian economy (liquidity and sol-vency) is worsening seriously. Growth in shadow economy can be attributed to: high tolerance for tax evasion in the form of periodical rescheduling and partial write-off of tax liabilities, tolerance for obvious manifestations of shadow economy (widespread avoidance of fiscal receipt issuing, sales of new industrial products on markets) etc.; and inadequate response from the Tax Admi-nistration. Repeated assurance from the Tax Administration representatives that “tax collection goes according to the plan or even better than planned”, even though the data shows that it is far below the targeted level, could be a reason why the Government haven’t taken prompt measures to improve tax collection. Since the budget rebalance was adopted in June, public revenues deviation from the projected amount by 1% of GDP over a six-month period is considered extremely big and suggests that the process of public revenue planning needs to be improved considerably. Accordingly, adoption of practices used in developed countries (Austria, Germany, Great Britain etc.) which imply grea-ter (practical and formal) coordination between relevant institutions (National Bank of Serbia, Ministry of Finance, Fiscal Council) in the process of making microeconomic projections and, based on them, fiscal projections, should be considered. There was a real rise in consolidated public expenditures in Q3 relative to the same period last year, and to Q2 this year (excluding the effect of seasonal factors). This increase is caused prima-rily by a considerable rise in expenditures on goods and services, and subsidies, and, to a lesser extent, by rise in capital expenditures. Public expenditures in Q3 this year were higher than in the same period last year partly because they are compared against a low base, meaning that in Q3 2012 during the government-forming period there was a limited liquidity and only the most necessary expenditures were financed. October saw a moderate slowdown in expenditures (real seasonally adjusted expenditures went down by 3.8% relative to September), primarily because the Ministry of Finance set the limit on discretionary expenditures by the end of the year, in response to a significant deviation of public revenues from the projected amounts. Although additional measures aimed at tackling 2013 fiscal deficit are necessary, the Government must take care not to cause an increase in arrears or hinder the functioning of the state by setting the limit on discretionary expenditures. 1 See the Fiscal Council (June 2013) „Assessment of 2013 budget rebalance, structural reforms proposal and future fiscal trends“
... or about 6.6% of GDP when calculated by international methodology
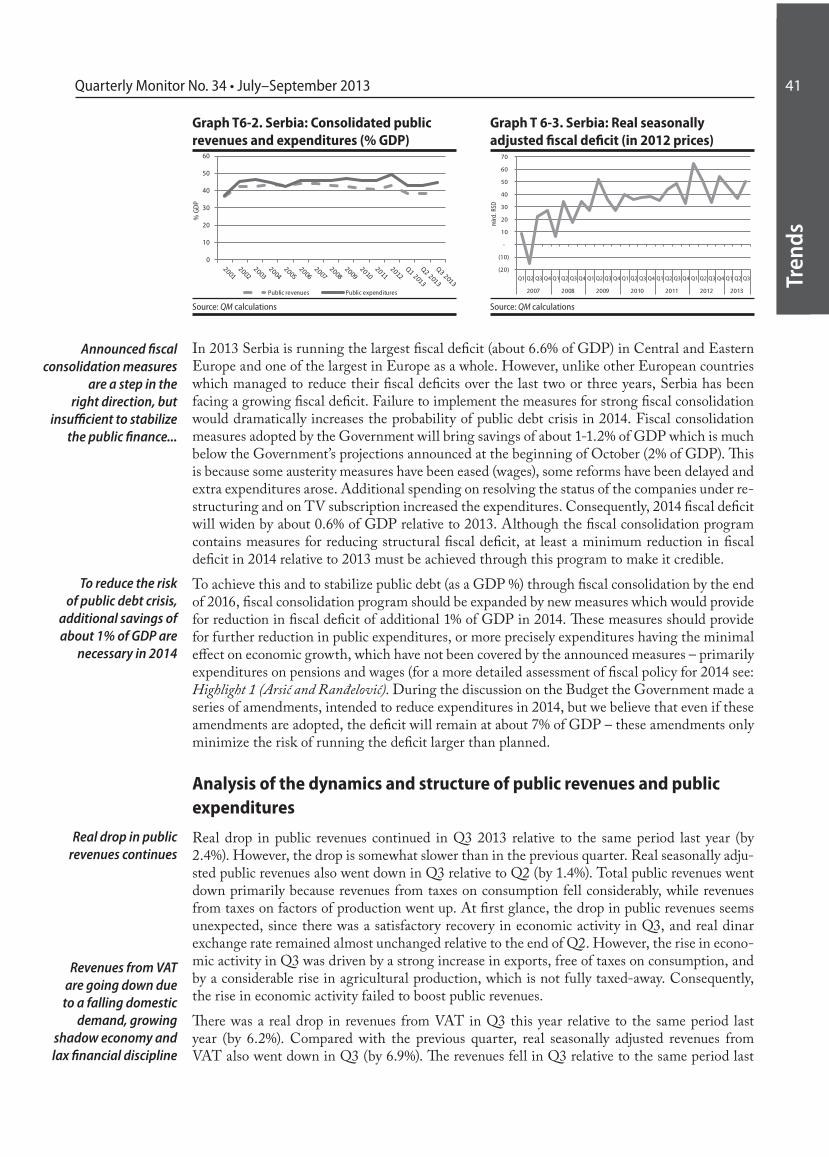
Tren
ds
41Quarterly Monitor No. 34 • July–September 2013
Tren
ds
41
In 2013 Serbia is running the largest fiscal deficit (about 6.6% of GDP) in Central and Eastern Europe and one of the largest in Europe as a whole. However, unlike other European countries which managed to reduce their fiscal deficits over the last two or three years, Serbia has been facing a growing fiscal deficit. Failure to implement the measures for strong fiscal consolidation would dramatically increases the probability of public debt crisis in 2014. Fiscal consolidation measures adopted by the Government will bring savings of about 1-1.2% of GDP which is much below the Government’s projections announced at the beginning of October (2% of GDP). This is because some austerity measures have been eased (wages), some reforms have been delayed and extra expenditures arose. Additional spending on resolving the status of the companies under re-structuring and on TV subscription increased the expenditures. Consequently, 2014 fiscal deficit will widen by about 0.6% of GDP relative to 2013. Although the fiscal consolidation program contains measures for reducing structural fiscal deficit, at least a minimum reduction in fiscal deficit in 2014 relative to 2013 must be achieved through this program to make it credible. To achieve this and to stabilize public debt (as a GDP %) through fiscal consolidation by the end of 2016, fiscal consolidation program should be expanded by new measures which would provide for reduction in fiscal deficit of additional 1% of GDP in 2014. These measures should provide for further reduction in public expenditures, or more precisely expenditures having the minimal effect on economic growth, which have not been covered by the announced measures – primarily expenditures on pensions and wages (for a more detailed assessment of fiscal policy for 2014 see: Highlight 1 (Arsić and Ranđelović). During the discussion on the Budget the Government made a series of amendments, intended to reduce expenditures in 2014, but we believe that even if these amendments are adopted, the deficit will remain at about 7% of GDP – these amendments only minimize the risk of running the deficit larger than planned.
Analysis of the dynamics and structure of public revenues and public expenditures
Real drop in public revenues continued in Q3 2013 relative to the same period last year (by 2.4%). However, the drop is somewhat slower than in the previous quarter. Real seasonally adju-sted public revenues also went down in Q3 relative to Q2 (by 1.4%). Total public revenues went down primarily because revenues from taxes on consumption fell considerably, while revenues from taxes on factors of production went up. At first glance, the drop in public revenues seems unexpected, since there was a satisfactory recovery in economic activity in Q3, and real dinar exchange rate remained almost unchanged relative to the end of Q2. However, the rise in econo-mic activity in Q3 was driven by a strong increase in exports, free of taxes on consumption, and by a considerable rise in agricultural production, which is not fully taxed-away. Consequently, the rise in economic activity failed to boost public revenues. There was a real drop in revenues from VAT in Q3 this year relative to the same period last year (by 6.2%). Compared with the previous quarter, real seasonally adjusted revenues from VAT also went down in Q3 (by 6.9%). The revenues fell in Q3 relative to the same period last
Announced fiscal consolidation measures
are a step in the right direction, but
insufficient to stabilize the public finance...
To reduce the risk of public debt crisis,
additional savings of about 1% of GDP are
necessary in 2014
Real drop in public revenues continues
Revenues from VAT are going down due to a falling domestic
demand, growing shadow economy and lax financial discipline
0
10
20
30
40
50
60
% G
DP
Public revenues Public expenditures
(20)
(10)
-
10
20
30
40
50
60
70
Q1 Q2 Q3 Q4 Q1 Q2 Q3 Q4 Q1 Q2 Q3 Q4 Q1 Q2 Q3 Q4 Q1 Q2 Q3 Q4 Q1 Q2 Q3 Q4 Q1 Q2 Q3
2007 2008 2009 2010 2011 2012 2013
mlrd
. RSD
Graph T6-2. Serbia: Consolidated public revenues and expenditures (% GDP)
Graph T 6-3. Serbia: Real seasonally adjusted fiscal deficit (in 2012 prices)
Source: QM calculations Source: QM calculations
Tren
ds
42
Tren
ds
42 6. Fiscal Flows and Policy
Excise revenues are falling – probably due
to rise in illegal sales of excise goods
...so do the customs revenues
Revenues from personal income tax are going
down, and revenues from social security
contributions are rising
year because they are compared against a quite high base, since there was an increase in sales in September 2012, prior to the announced increase in VAT rate as of October 2012. The drop in revenues from VAT in Q3 relative to Q2 can partly be attributed to the Ministry of Finance’s decision to abolish the practice of transferring a part of VAT refund to the following calendar month, starting from September. However, even when this effect is excluded, real seasonally adjusted revenues from VAT in Q3 went down (by 1.7%) relative to the previous quarter. There
was a slight rise in real seasonally adjusted re-venues from VAT in October (by 0.8%) relative to the average of the preceding three months, which indicates a significant recovery in these revenues. These downward trends in revenues from VAT are attributed to a significant rise in exports, slowdown in domestic consumption and imports, growth in shadow economy and lax financial discipline. By not taking systema-tic actions against shadow economy in 2013 but waiting for online fiscal cash registers to produ-ce great effects, starting from Q1 2014, the Go-vernment runs the risk of collecting less VAT revenues in the meanwhile.
Real seasonally adjusted excise revenues fell considerably in Q3 2013 relative to Q2 (by 4.8%), and there was a large real drop in these revenues when compared with the same period last year (by 10.9%). The data shows that these trends continued in October (real seasonally adjusted exci-se revenues fell by 4.7% relative to the average of the previous quarter). Since the real exchange rate did not appreciate, and the excise due date for the second half of September did not fall on weekend, the drop in excise revenues in Q3 is probably caused by the rise in illicit sale of excise goods (primarily cut tobacco and tobacco products), and possibly by decline in consumption of these goods. Customs revenues (real, seasonally adjusted) fell slightly in Q3 (by 2.5%) relative to the previous quarter, which is a continuation of the trend lasting for several years. When compared with the same period 2012, real drop in customs revenues is even larger (16.9%). Continuous loss of customs revenues (relative to the previous quarter) under a stable real exchange rate is a consequ-ence of a slowdown in import, especially from the countries with which Serbia has not signed a free trade agreement. Revenues from personal income tax (real, seasonally adjusted) fell considerably (by 9.2%) in Q3 relative to the previous quarter, and real seasonally adjusted revenues from social security contributions went up significantly (by 8%). Similar trends were detected relative to the same period last year – real revenues from personal income tax dropped largely (by 18.8%), and reve-
nues from social security contributions went up considerably (by 7.3%). The divergent trends in revenues from personal income tax and social security contributions, substantially having the same assessment base, are due to the reduction in wage tax and increase in the rate of pension and disability insurance contributions in June 2013. Taking as a whole, real seasonally adju-sted revenues from personal income tax and social security contributions rose significantly in Q3 relative to Q2 (by 3.1%), which is partly attributed to the increase in wages in the public sector in April (paid from May). Real seasonally adjusted revenues from personal income tax and
0
20
40
60
80
100
120
140
160
180
Q1 Q2 Q3 Q4 Q1 Q2 Q3 Q4 Q1 Q2 Q3 Q4 Q1 Q2 Q3 Q4 Q1 Q2 Q3 Q4 Q1 Q2 Q3 Q4 Q1 Q2 Q3
2007 2008 2009 2010 2011 2012 2013
u m
lrd.
RSD
VAT Excise duties Custom
Graph T 6-4. Serbia: Trends in real consoli-dated seasonally adjusted revenues from taxes on consumption (in 2012 prices)
Source: QM calculations
0
20
40
60
80
100
120
140
160
180
Q1 Q2 Q3 Q4 Q1 Q2 Q3 Q4 Q1 Q2 Q3 Q4 Q1 Q2 Q3 Q4 Q1 Q2 Q3 Q4 Q1 Q2 Q3 Q4 Q1 Q2 Q3
2007 2008 2009 2010 2011 2012 2013
u m
lrd.
RSD
Personal income tax Contributions Corporate income tax
Graph T 6-5. Serbia: Trends in real consolida-ted seasonally adjusted revenues from taxes on factors of production (in 2012 prices)
Source: QM calculations
Tren
ds
43Quarterly Monitor No. 34 • July–September 2013
Tren
ds
43
social security contributions continued to rise in October (by 1.6% relative to the previous qu-arter), which could be an indication that the collection rate of personal income tax and social security contributions is increasing. However, a more reliable assessment will be possible after the data for the rest of the year is collected. Real seasonally adjusted revenues from corporate income tax increased in Q3 relative to Q2 (by 18.3%). There was a considerable rise in revenues from this tax in Q3 this year relative to the same period last year (by 39.6%). Revenues from corporate income tax went up primarily because corporate income tax rate was increased from 10% to 15%, and, although the profits made in 2013 will be taxed at this rate, this increase affects the amount of corporate income tax advance payments companies have to make in 2013. Other tax revenues (real seasonally adjusted) went up moderately in Q3 relative to Q2 (by 3.2%), which might be an indication that the local governments use direct and assigned public revenues more efficiently, since they lost a part of revenues from wage tax and other quasi-fiscal charges. Non-tax revenues (real seasonally adjusted) went up slightly in Q3 (by 1.4%), which could be due to different dynamics in collecting different types of non-tax revenues.
Real seasonally adjusted public expenditures went up by 2.6% in Q3 relative to Q2. There was a moderate real growth in these expenditures in Q3 this year relative to the same period last year (by 2.1%). Expenditures went up in Q3 relative to the previous quarter because they are compa-red against a low base (expenditures fell considerably in Q2), and because of increase in spending
on some items (primarily on goods and servi-ces and subsidies). Public expenditures went up in Q3 this year relative to the same period last year because they are compared against a low base, i.e. public spending was limited due to low liquidity during the government-forming peri-od (Q3 2012). To keep the fiscal deficit at the projected level the Ministry of Finance set the limit on discretionary expenditures for all direct budget users from the end of September till the end of 2013. Consequently, public expenditures (real seasonally adjusted) went down in October relative to the average of the preceding quarter by 5.4%.
Real seasonally adjusted expenditures on subsidies went up in Q3 relative to Q2 by 9.7%, and when compared with the same period 2012 these expenditures rose by 36.1%. Expenditures on subsidies in Q3 increased due to an unstable dynamics in spending on subsidies, unstable liqui-dity of the budget, and extraordinary subsidy payments to Simpo. Expenditures on goods and services (real seasonally adjusted) grew by 14.2% in Q3 relative to Q2. Real rise in these expenditures in Q3 this year is somewhat smaller than in the same pe-riod last year, but it is still quite large (9.5%). Expenditures on goods and services in Q3 may have increased because procurement of some items was put off in the previous quarters due to difficulties in enforcement of the Law on Public Procurement, and consequently the base for comparison was lower.
Capital expenditures (real seasonally adjusted) went up by 4.5% in Q3 relative to Q2. This could be caused by the dynamics in interim payments for the work carried out and does not indicate a systematic increase in public investments. Capital expenditures in Q3 amounted to about 3% of GDP, meaning that they went down considerably relative to the same period 2012 (by 17.4%). That makes half of the quarterly fiscal deficit, which indicates that the deterioration in the net asset position of the state continued in Q3, because more than a half of the borrowing intended to make up fiscal deficit was used to finance current consumption.
Revenues from corporate income tax
rose considerably in Q3, due to increase in corporate income tax
rate
Public expenditures are rising moderately in Q3
...primarily due to rise in expenditures on
subsidies
...and to rise in expenditures on goods
and services
Capital expenditures are going up slightly, but they are still low
(about 3% of the quarterly GDP)
- 50.0
100.0 150.0 200.0 250.0 300.0 350.0 400.0
Wages Goods and services SubsidiesInterest Pensions Capital expenditures
Q1 Q2 Q3 Q4 Q1 Q2 Q3 Q4 Q1 Q2 Q3 Q4 Q1 Q2 Q3 Q4 Q1 Q2 Q3 Q4 Q1 Q2 Q3 Q4 Q1 Q2 Q3
2007 2008 2009 2010 2011 2012 2013
Graph T 6-6. Serbia: Trends in consolidated seasonally adjusted public expenditures (in 2012 prices)
Source: QM calculations

Tren
ds
44
Tren
ds
44 6. Fiscal Flows and Policy
Expenditures on pensions (real seasonally adjusted) went up in Q3 relative to Q2 by 1.3%. This increase in expenditures on pensions in Q3 relative to Q2 was caused by pension indexation in April, and probably by retirement dynamics (the number of pensioners in Serbia is expected to increase by 1% annually if other conditions remain unchanged). Y-o-y rates of expenditures on pensions show that there was a slowdown in real y-o-y reduction in these expenditures in Q3 – from 4.8% and 4.1% in Q1 and Q2 respectively, to 1.6% in Q3. This came from the drop in in-flation, because a considerable slowdown in inflation leads to a slowdown in real y-o-y reduction in these expenditures.
Real seasonally adjusted expenditures on employees fell by 1% in Q3 relative to Q2, and when compared with Q3 last year, these expenditures fell by 3.8%. Slowdown in expenditures on wages primarily came from the reduction in expenditures on wages funded from the Health Insurance Fund of the Republic of Serbia, which is a consequence of specific dynamics in these payments in health care system.
Real seasonally adjusted expenditures on interest payments fell considerably in Q3 relative to Q2 (by 13.6%) because they were compared against a high base (massive payments of interest on euro-denominated bonds were made in Q2). However, there was a real rise in expenditures on interest payments in Q3 this year relative to the same period last year (by 9.5%), which came from rising public debt and average interest rate (the share of cheap liabilities in public debt, such as old foreign currency savings, is shrinking in favor of new, expensive loans).
Fiscal trends by government levels
There was a real drop in public revenues on all government levels in Q3 relative to the same period last year. Revenues collected by the Health Insurance Fund of the Republic of Serbia suffered the smallest decrease, while the drop in revenues collected in the Budget of the Republic of Serbia was much larger, and local governments suffered the largest loss of revenues. Sharper drop in revenues on the local level relative to other government levels came from the reduction in tax rate on wages and increase in non-taxable part of salary in June 2013 (which reduced the central budget revenues, as well), and the drop in other tax revenues, lag effect of abolition of quasi-fiscal charges in September 2012.
Real reduction in consolidated public expenditures in Q3 2013 relative to Q3 2012 came from moderate rise in the central government budget expenditures and the Republic Health Insurance Fund expenditures, and a marked reduction in local government expenditures. Divergent trends in expenditures on local relative to other government levels came from severe reduction in local government revenues. Reduction in local government expenditures, due to decrease in revenues, primarily came from a massive real reduction in capital expenditures (by almost 40% relative to Q3 2012) and consi-derable reduction in expenditures on social welfare, while expenditures on wages and goods and services went up moderately. These trends are in line with the dynamics in local expenditures in the period mid 2011-mid 2012, when the growth in revenues from wage tax was mostly used to increase expenditures on wages and goods and services, and only a small portion was spent on public investments by local self governments. Although revenues went down significantly in the period Q1-Q3 2013, unlike other government levels, local government budget was in surplus in that period – RSD 10.7 billion cumulatively. However, the data for the previous years show a strong seasonality in local expenditures, so these expenditures and local government deficit usually go up considerably in the last quarter. Accordingly, local governments will probably use the most of the accumulated funds (budget surplus from the previous quarters), so their effects on the consolidated fiscal deficit in 2013 could be none or slightly negative.
Real y-o-y reduction in expenditures
on pensions was slower due to fall in
inflation
Expenditures on employees are
going down slightly
Although expenditures on interest payments
are falling in Q3 relative to Q2, y-o-y
growth rates indicate continuation of the
upward trend in these expenditures
Revenues on all government levels
are falling, but local governments suffered
the largest drop of revenues
Unlike other government levels with
rising expenditures, local government expenditures are
going down...
...primarily due to a drastic reduction in
local public investments and social welfare
expenditures

Tren
ds
45Quarterly Monitor No. 34 • July–September 2013
Tren
ds
45
Analyses of trends in public debt
According to the official data released by the Ministry of Finance, at the end of October 2013 Serbia ran up public debt of EUR 19.3 billion (around 59.8% GDP), EUR 400 million higher than at the end of Q2. Rise in public debt in the period July-October expressed in relative terms (by 0.4% of GDP) is slower than in nominal terms (EUR 400 million, or about 1.3% of GDP), due to real appreciation of the dinar exchange rate and GDP growth. Rise in public debt at the end of October relative to the end of Q2 came from the fiscal deficit widening in this period, since indirect debt remained almost unchanged at the end of October relative to the end of June. However, the increase in public debt in the period July-October was smaller than the overall fiscal deficit in the period (about EUR 570 million), which suggests that the fiscal deficit in the period July-October was partly financed from the government deposits obtained through borrowing in the previous months. The data showing that the level of government deposits de-creased in the period July-October confirm this (see: Monetary flows and policy).
Table T6-7. Serbia: Public debt¹ 2000-2013
2000 2005 2006 2007 2008 2009 2010 2011 2012 Q1 2013 Q2 2013 Q3 2013 Oct. 2013
I. Total direct debt 14.17 9.62 8.58 8.03 7.85 8.46 10.46 12.36 15.07 16.61 16.0 16.2 16.4
Domestic debt 4.11 4.26 3.84 3.41 3.16 4.05 4.57 5.12 6.5 6.7 6.5 6.6 6.9
Foreign debt 10.06 5.36 4.75 4.62 4.69 4.41 5.89 7.24 8.6 9.9 9.5 9.6 9.6
II. Indirect debt - 0.66 0.80 0.85 0.93 1.39 1.71 2.11 2.60 2.78 2.9 2.9 2.9
III. Total debt (I+II) 14.17 10.28 9.38 8.88 8.78 9.85 12.17 14.47 17.67 19.39 18.9 19.1 19.3
Public debt / GDP² 169.3% 50.2% 36.2% 29.4% 25.6% 31.3% 41.5% 45.1% 59.3% 57.7% 57.4% 58.1% 58.5%
Public debt / GDP (QM)³ 169.3% 52.1% 37.8% 30.9% 29.2% 34.8% 44.6% 46.9% 59.4% 62.2% 60.2% 59.4% 59.8%
Amount at the end of period, in billions EUR
1) According to the Public Debt Law, public debt includes debt of the Republic related to the contracts concluded by the Republic, debt from issuance of the t-bills and bonds, debt arising from the agreement on reprogramming of liabilities undertaken by the Republic under previously concluded contracts, as well as the debt arising from securities issued under separate laws, debt arising from warranties issued by the Republic or counterwarranties as well as the debt of the local governments, guaranteed by the Republic. 2) Estimate of the Ministry of Finance of the Republic of Serbia 3) QM estimate (Estimated GDP equals the sum of nominal GDP in the current quarter and three previous quarters)Source: Ministry of Finance of Serbia and QM calculations
After more than five years, there was no rise in indirect debt in Q3 2013 (and in October) re-lative to the preceding quarter, which is judged positively because rise in state-guaranteed lo-ans, granted mostly to public companies, makes up almost one fifth of the rise in public debt in the period end 2008-end Q3 2013. The rise in indirect public debt was stopped probably be-cause the process of government restructuring lasted quite long, and a considerable amount of state guaranteed loans was granted to the lar-gest borrowers (Srbijagas, Železara etc.) at the beginning of 2013, so there was no need to
issue new state guarantees in Q3. However, issuance of new state guarantees was announced in October (primarily on loans to Srbijagas). To stop the rise in indirect debt permanently, the government must finish the process of public companies restructuring, the biggest borrowers of state guaranteed loans (primarily Srbijagas). Direct debt increased by EUR 300 million in the period July-October, primarily due to trea-sury bill issuance. Foreign investors’ great interest in Serbian treasury bills comes from stable exchange rate and quite high interest rate on treasury bills, which guarantee a quite high rate of return. However, since the mobility of this capital is high, increase in fiscal risks could cause its withdrawal, so the government cannot rely on this source of finance in the following period. Similar to the previous period, in November 2013 Serbia was among the Central and Eastern European countries with the highest risk on the government bonds, measured by Emerging
At the end of October 2013 Serbia was
burdened with public debt of EUR 19.3 billion
(59.8 % of GDP)
Although the rise in indirect debt is stopped
temporarily, the process of public companies
restructuring must be finished in short term to
curb it permanently
Risk on the Government Bonds of the Republic
of Serbia is going down slightly, and for a more
noticeable reduction the announced
austerity measures must be implemented and the arrangement
with IMF must be made
52.1
37.8
30.9 29.2 34.8
44.6 46.9
59.4 62.2 60.2 59.4
62-63
0
10
20
30
40
50
60
70
Graph T 6-8: Trends in public debt - Serbia (% BDP)
Source: QM calculations

Tren
ds
46
Tren
ds
46 6. Fiscal Flows and Policy
Markets Bond Index (EMBI) – risk premium is higher only on the government bonds of Ukraine and Belarus. However, EMBI index for Serbia fell by 11% relative to August 2013, because there was a drop in this index for Central and Eastern European countries in general (by 8%), and the Ministry of Finance announced the measures for fiscal consolidation at the beginning of Octo-ber. The announced package of measures for fiscal consolidation did not cause a more noticeable drop in this index for Serbia probably because the government often failed to implement most of the announced measures over the previous years. Immediate implementation of the announced measures and the arrangement with IMF through further development of the fiscal consolida-tion program are necessary for a more noticeable drop in this index (excluding the possibility of microeconomic shocks in Europe or in the world). In November 2013 Serbia issued euro-denominated bonds worth EUR 1 billion, with 5.875% interest rate (and 6.125% yield) and maturity of five years. These bonds were sold under less fa-vorable conditions than in January, because the Fed and the European Central Bank turned to a less expansionary monetary policy as of May 2013, and because it was clear as early as mid 2013 that the fiscal deficit will be larger than planned. Yield on Serbia’s euro-denominated bonds with maturity of five years is higher than on relevant bonds issued by other countries in the region (from 3.5% in Romania to 6% in Slovenia). The rate of interest on euro-denominated bonds in Serbia is therefore largely attributed to the widening fiscal deficit and rising risk of public debt crisis. High interest rates, with stable short term exchange rate, produce high yield to investors (see chapter 7), hence the big demand for treasury bills. Treasury bill issuance solves the problem of budget liquidity, but also increases the risks and level of public debt. Increase in the absolute amount of short-term public debt and its share in overall public debt increases the risk of a sud-den withdrawal of investors. In that case, the government would probably be unable to provide the necessary funds for payment of matured short-term securities, which would be additional discouragement to investors. Besides that, interest rates on short-term loans are high, which will increase expenditures on interest payments and make it harder to reduce the fiscal deficit in the future.
Although public debt went up by EUR 1.6 billion (about 5% of GDP) from the beginning of 2013, in relative terms (as a GDP %) this increase was much smaller (0.45% of GDP), due to a considerable appreciation of the dinar exchange rate, and a moderate growth in GDP. With fiscal deficit within the projected levels by the end of the year, and with other macroeconomic variables in line with official projections (real growth in GDP of 2%, average y-o-y inflation rate about 5% at the end of the year), with steady real dinar-euro exchange rate, and with unchanged dynamics in indirect debt, Serbia’s public debt at the end of 2013 may amount to about 62-63% of GDP. If any of these variables deviated from the projections, public debt would deviate from the targeted percentage. Additional borrowing of about EUR 2.5 billion in 2014 is necessary to finance the fiscal deficit of about 7% of GDP. Reduction in fiscal deficit of 1% of GDP in 2014 would result in EUR 300 million less borrowing. With the aforementioned fiscal deficit, the government can borrow less
Treasury bill issuance solves the problem of
budget liquidity, but increases the risks and
level of public debt
Public debt will amount to 62-63% of GDP at the
end of 2013
Dec-12 April 2013 Aug-13 Nov-13
0100200300400500600700800900
1.000
Graph T6-9. Serbia and the selected Central and East European countries: EMBI
Graph T6-10. Serbia: Trends in EMBI in the period August-November 2013
Source: web page www.cbonds.info Source: web page www.cbonds.info
Tren
ds
47Quarterly Monitor No. 34 • July–September 2013
Tren
ds
47
Further reductions in fiscal deficit, more
restrictive policy on state guarantees
on loans, and rigorous selection
of infrastructure projects to be financed through borrowing are
necessary for public debt stabilization
only if they sell Telekom Srbija, but a firm line on this issue has not been taken yet. Under large fiscal deficit and stagnant economy, public debt of Serbia is estimated at about 70% of GDP at the end of 2014. Privatization of Telekom would decrease public debt-to-GDP ratio by a few percentage points. However, a possible depreciation of the dinar exchange rate could increase public debt to GDP ratio. To slow down the growth in public debt (as a GDP %) in the following years, the government must reduce the fiscal deficit to less than 2% of GDP in the following three years, and develop a more restrictive policy on state guarantees. Additionally, it is necessary to, using cost-benefit analyses, estimate profitability of many projects for which loans have already been granted or are in the process of negotiation, and finance the most profitable ones. Financing of many pro-jects (road and railway infrastructure, construction of healthcare and energy facilities etc.) was arranged in the previous decade, but most of the funds have not been used due to lack of project documentation. Withdrawal of these funds in the following period would increase public debt by dozens of percentage points of GDP, which would almost certainly lead to public debt crisis. Accordingly, financing priorities should be sorted out again, so that only economically and soci-ally most profitable projects are financed through loans. Total value of these projects would have to be several times lower than the value of all projects considered in the previous period.
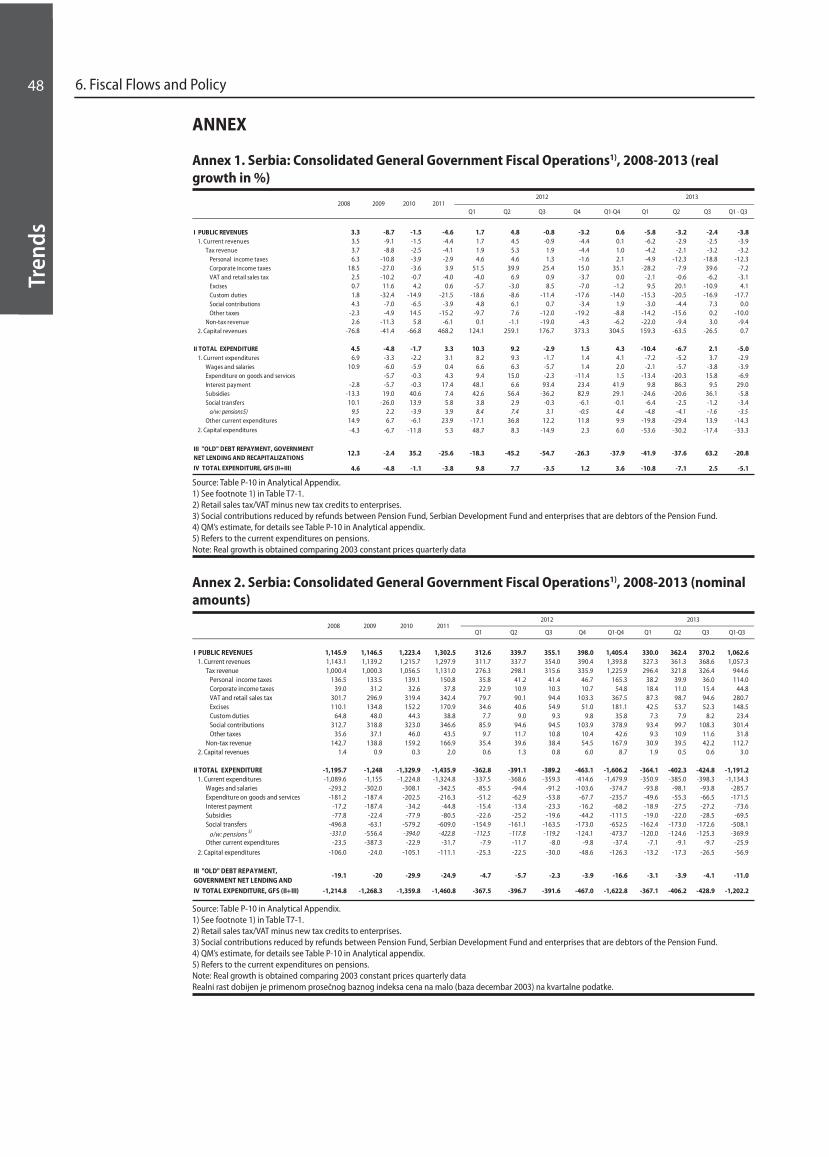
Tren
ds
48
Tren
ds
48 6. Fiscal Flows and Policy
ANNEX
Annex 1. Serbia: Consolidated General Government Fiscal Operations1), 2008-2013 (real growth in %)
Q1 Q2 Q3 Q4 Q1-Q4 Q1 Q2 Q3 Q1 - Q3
I PUBLIC REVENUES 3.3 -8.7 -1.5 -4.6 1.7 4.8 -0.8 -3.2 0.6 -5.8 -3.2 -2.4 -3.81. Current revenues 3.5 -9.1 -1.5 -4.4 1.7 4.5 -0.9 -4.4 0.1 -6.2 -2.9 -2.5 -3.9
Tax revenue 3.7 -8.8 -2.5 -4.1 1.9 5.3 1.9 -4.4 1.0 -4.2 -2.1 -3.2 -3.2Personal income taxes 6.3 -10.8 -3.9 -2.9 4.6 4.6 1.3 -1.6 2.1 -4.9 -12.3 -18.8 -12.3Corporate income taxes 18.5 -27.0 -3.6 3.9 51.5 39.9 25.4 15.0 35.1 -28.2 -7.9 39.6 -7.2VAT and retail sales tax 2.5 -10.2 -0.7 -4.0 -4.0 6.9 0.9 -3.7 0.0 -2.1 -0.6 -6.2 -3.1Excises 0.7 11.6 4.2 0.6 -5.7 -3.0 8.5 -7.0 -1.2 9.5 20.1 -10.9 4.1Custom duties 1.8 -32.4 -14.9 -21.5 -18.6 -8.6 -11.4 -17.6 -14.0 -15.3 -20.5 -16.9 -17.7Social contributions 4.3 -7.0 -6.5 -3.9 4.8 6.1 0.7 -3.4 1.9 -3.0 -4.4 7.3 0.0Other taxes -2.3 -4.9 14.5 -15.2 -9.7 7.6 -12.0 -19.2 -8.8 -14.2 -15.6 0.2 -10.0
Non-tax revenue 2.6 -11.3 5.8 -6.1 0.1 -1.1 -19.0 -4.3 -6.2 -22.0 -9.4 3.0 -9.42. Capital revenues -76.8 -41.4 -66.8 468.2 124.1 259.1 176.7 373.3 304.5 159.3 -63.5 -26.5 0.7
II TOTAL EXPENDITURE 4.5 -4.8 -1.7 3.3 10.3 9.2 -2.9 1.5 4.3 -10.4 -6.7 2.1 -5.01. Current expenditures 6.9 -3.3 -2.2 3.1 8.2 9.3 -1.7 1.4 4.1 -7.2 -5.2 3.7 -2.9
Wages and salaries 10.9 -6.0 -5.9 0.4 6.6 6.3 -5.7 1.4 2.0 -2.1 -5.7 -3.8 -3.9Expenditure on goods and services -5.7 -0.3 4.3 9.4 15.0 -2.3 -11.4 1.5 -13.4 -20.3 15.8 -6.9Interest payment -2.8 -5.7 -0.3 17.4 48.1 6.6 93.4 23.4 41.9 9.8 86.3 9.5 29.0Subsidies -13.3 19.0 40.6 7.4 42.6 56.4 -36.2 82.9 29.1 -24.6 -20.6 36.1 -5.8Social transfers 10.1 -26.0 13.9 5.8 3.8 2.9 -0.3 -6.1 -0.1 -6.4 -2.5 -1.2 -3.4
o/w: pensions5) 9.5 2.2 -3.9 3.9 8.4 7.4 3.1 -0.5 4.4 -4.8 -4.1 -1.6 -3.5Other current expenditures 14.9 6.7 -6.1 23.9 -17.1 36.8 12.2 11.8 9.9 -19.8 -29.4 13.9 -14.3
2. Capital expenditures -4.3 -6.7 -11.8 5.3 48.7 8.3 -14.9 2.3 6.0 -53.6 -30.2 -17.4 -33.3
III "OLD" DEBT REPAYMENT, GOVERNMENT NET LENDING AND RECAPITALIZATIONS
12.3 -2.4 35.2 -25.6 -18.3 -45.2 -54.7 -26.3 -37.9 -41.9 -37.6 63.2 -20.8
IV TOTAL EXPENDITURE, GFS (II+III) 4.6 -4.8 -1.1 -3.8 9.8 7.7 -3.5 1.2 3.6 -10.8 -7.1 2.5 -5.1
20132008 2009 2010 2011
2012
Source: Table P-10 in Analytical Appendix.1) See footnote 1) in Table T7-1.2) Retail sales tax/VAT minus new tax credits to enterprises.3) Social contributions reduced by refunds between Pension Fund, Serbian Development Fund and enterprises that are debtors of the Pension Fund.4) QM’s estimate, for details see Table P-10 in Analytical appendix.5) Refers to the current expenditures on pensions.Note: Real growth is obtained comparing 2003 constant prices quarterly data
Annex 2. Serbia: Consolidated General Government Fiscal Operations1), 2008-2013 (nominal amounts)
I PUBLIC REVENUES 1,145.9 1,146.5 1,223.4 1,302.5 312.6 339.7 355.1 398.0 1,405.4 330.0 362.4 370.2 1,062.61. Current revenues 1,143.1 1,139.2 1,215.7 1,297.9 311.7 337.7 354.0 390.4 1,393.8 327.3 361.3 368.6 1,057.3
Tax revenue 1,000.4 1,000.3 1,056.5 1,131.0 276.3 298.1 315.6 335.9 1,225.9 296.4 321.8 326.4 944.6Personal income taxes 136.5 133.5 139.1 150.8 35.8 41.2 41.4 46.7 165.3 38.2 39.9 36.0 114.0Corporate income taxes 39.0 31.2 32.6 37.8 22.9 10.9 10.3 10.7 54.8 18.4 11.0 15.4 44.8VAT and retail sales tax 301.7 296.9 319.4 342.4 79.7 90.1 94.4 103.3 367.5 87.3 98.7 94.6 280.7Excises 110.1 134.8 152.2 170.9 34.6 40.6 54.9 51.0 181.1 42.5 53.7 52.3 148.5Custom duties 64.8 48.0 44.3 38.8 7.7 9.0 9.3 9.8 35.8 7.3 7.9 8.2 23.4Social contributions 312.7 318.8 323.0 346.6 85.9 94.6 94.5 103.9 378.9 93.4 99.7 108.3 301.4Other taxes 35.6 37.1 46.0 43.5 9.7 11.7 10.8 10.4 42.6 9.3 10.9 11.6 31.8
Non-tax revenue 142.7 138.8 159.2 166.9 35.4 39.6 38.4 54.5 167.9 30.9 39.5 42.2 112.72. Capital revenues 1.4 0.9 0.3 2.0 0.6 1.3 0.8 6.0 8.7 1.9 0.5 0.6 3.0
II TOTAL EXPENDITURE -1,195.7 -1,248 -1,329.9 -1,435.9 -362.8 -391.1 -389.2 -463.1 -1,606.2 -364.1 -402.3 -424.8 -1,191.21. Current expenditures -1,089.6 -1,155 -1,224.8 -1,324.8 -337.5 -368.6 -359.3 -414.6 -1,479.9 -350.9 -385.0 -398.3 -1,134.3
Wages and salaries -293.2 -302.0 -308.1 -342.5 -85.5 -94.4 -91.2 -103.6 -374.7 -93.8 -98.1 -93.8 -285.7Expenditure on goods and services -181.2 -187.4 -202.5 -216.3 -51.2 -62.9 -53.8 -67.7 -235.7 -49.6 -55.3 -66.5 -171.5Interest payment -17.2 -187.4 -34.2 -44.8 -15.4 -13.4 -23.3 -16.2 -68.2 -18.9 -27.5 -27.2 -73.6Subsidies -77.8 -22.4 -77.9 -80.5 -22.6 -25.2 -19.6 -44.2 -111.5 -19.0 -22.0 -28.5 -69.5Social transfers -496.8 -63.1 -579.2 -609.0 -154.9 -161.1 -163.5 -173.0 -652.5 -162.4 -173.0 -172.6 -508.1
o/w: pensions 5) -331.0 -556.4 -394.0 -422.8 -112.5 -117.8 -119.2 -124.1 -473.7 -120.0 -124.6 -125.3 -369.9Other current expenditures -23.5 -387.3 -22.9 -31.7 -7.9 -11.7 -8.0 -9.8 -37.4 -7.1 -9.1 -9.7 -25.9
2. Capital expenditures -106.0 -24.0 -105.1 -111.1 -25.3 -22.5 -30.0 -48.6 -126.3 -13.2 -17.3 -26.5 -56.9
III "OLD" DEBT REPAYMENT, GOVERNMENT NET LENDING AND
-19.1 -20 -29.9 -24.9 -4.7 -5.7 -2.3 -3.9 -16.6 -3.1 -3.9 -4.1 -11.0
IV TOTAL EXPENDITURE, GFS (II+III) -1,214.8 -1,268.3 -1,359.8 -1,460.8 -367.5 -396.7 -391.6 -467.0 -1,622.8 -367.1 -406.2 -428.9 -1,202.2
Q42011
Q1 Q2 Q3
2012
Q32010
Q2Q1 Q1-Q3
2013
Q1-Q42008 2009
Source: Table P-10 in Analytical Appendix.1) See footnote 1) in Table T7-1.2) Retail sales tax/VAT minus new tax credits to enterprises.3) Social contributions reduced by refunds between Pension Fund, Serbian Development Fund and enterprises that are debtors of the Pension Fund.4) QM’s estimate, for details see Table P-10 in Analytical appendix.5) Refers to the current expenditures on pensions.Note: Real growth is obtained comparing 2003 constant prices quarterly data Realni rast dobijen je primenom prosečnog baznog indeksa cena na malo (baza decembar 2003) na kvartalne podatke.

Tren
ds
49Quarterly Monitor No. 34 • July–September 2013
Tren
ds
49
Annex 3. Serbia: Real annual rates of growth in public revenues and public expenditures, by the levels of government
Consolidated budget
Budget of Republic
Health Fund
Local self-governments
A Total public revenues (I)+(II) -2.5 -6.0 -0.9 -6.8I Current revenues (1)+(2) -2.6 -6.0 -0.5 -10.4
1. Tax revenues -3.2 -6.6 -2.0 -14.41.1. Customs -17.0 -17.0 - - 1.2. Personal income tax -18.8 -19.1 - -18.61.3. Corporate income tax 39.6 39.0 - - 1.4. VAT -6.2 -6.2 - - 1.5. Excise duties -10.9 -10.9 - - 1.6. Property taxes -100.0 - 5.71.9.Other taxes 0.2 5.4 - -11.21.10. Social security contributions 7.3 - -2.0 -
2. Non-tax revenues 2.9 -0.3 140.6 3.2II Capital revenues -26.5 - 48.0 122.9III Transfers from the other levels of government - - -1.9 3.5IV Donations 133.3 14.9 303.3
B Total public expenditures (I)+(II)+(III)+(IV) 2.5 4.3 4.8 -7.7I Current expenditures 3.7 0.9 4.8 0.6
1.1 Wages -3.8 -0.7 -14.2 2.51.2. Goods and services 15.8 7.8 27.2 3.01.3 Interest payments 9.5 10.3 -91.9 -6.61.4 Subsidies 36.1 56.7 0.0 0.41.5 Social insurance and social assistance -1.2 15.2 14.6 -12.61.6 Transfers to the other levels of government - -12.1 - - 1.7 Other current expenditures 13.9 -3.5 1007.6 18.9
II Capital expenditures -17.4 59.6 6.8 -39.6III Strategic reserves - 3273.0 - -2.9IV Net lending 63.2 69.8 - 59.4
Q3 2013/Q3 2012
Source: QM calculationsCPI (Q3 2013/Q3 2012)
Tren
ds
50 7. Monetary Flows and Policy
7. Monetary Trends and Policy
The July to October period saw a continued reduction of inflation with the y-o-y inflation in October reaching a historic minimum of 2.2% which was below the lower interval goal set by the Serbian National Bank of Serbia (NBS). The NBS reduced the key policy rate by 0.5 per-centage points in October and November but it is still extremely high compared to inflation and stands at 10%. Although macro-economic risks in Serbia are still high, we believe that the restrictive monetary policy needs to be reduced further – domestic demand has dropped strongly, a large part of the economy is in recession and insolvency is high. More room to ease the restrictive monetary policy will be created only after additional measures are introduced to reduce the fiscal deficit and reduce the risks in the economy. We feel that the symmetric interventions by the NBS on the foreign currency market are positive, first preventing the sudden depreciation of the Dinar in September and October and then its excessive stren-gthening in November. Stopping the depreciation of the Dinar removed the risk of a po-ssible speculative attack while the preventing of the strengthening of the Dinar prevented a deterioration of the price competitiveness of the economy. The money at y-o-y level saw a rise but the trend of reducing credit to the enterprises continued in Q3, the y-o-y drop stood at –11.8%. In Q3 alone, the enterprises repaid a total of 265 million Euro of its debts to do-mestic banks while the households saw a positive rise of credit by 62 million Euro. The drop in placement to the enterprises and constant growth of bad credits means that the banking sector in Serbia is showing signs of slowing down which are reflected in the loss of the work permit of a third bank in a year and there is a risk of other smaller banks faring the same.
Central Bank: Balance and Monetary Policy
The trend of low monthly inflation rates continued in Q3 which means that the y-o-y inflation rate in October was lower that the NBS target for the period. Despite that the NBS did not change its decision on the height of the key policy rate in the entire third quarter and corrected it with a reduction of 0.5 percentage points in October (Table T7-1). Following a second correction of 0.5 percentage points in November, the key policy rate stands at 10% which we believe is still high given the stable Dinar exchange rate and extremely low monthly inflation rates. This NBS policy affected an increase in REPO placements in this period. The real yield rate on REPO placements in Q3 was higher compared to similar alternatives in the region thanks to a stable Dinar exchange rate and low inflation and that caused business banks to show interest in this form of short-term placement with a low risk level. Inflation is expected to stabilize within the target framework and the NBS will have room to further ease monetary policy in the next peri-od. Bearing in mind that this will reduce the profitability of REPO placements, the question is how business banks will react when we know that changes in credit placement to the enterprises have been constantly negative over the past few years.The NBS intervened strongly on the foreign currency market in the September-October period to maintain the stability of the Dinar exchange rate. To prevent a sudden depreciation of the Dinar, the NBS sold 90 million Euro on the inter-banking foreign exchange (forex) market in September. That removed the risk of a possible speculative strike that could lower the value of the Dinar in the short term. October saw changes in the pressure on the exchange rate and the NBS reacted with buying 165 million Euro on the forex market to prevent an excessive strengthening of the Dinar (in Q2, the NBS sold foreign currency with a net worth of 225 million Euro, Table T7-1). By selling foreign currency, the NBS prevented a strengthening of the real value of the Dinar and lowering of the price competitiveness of the Serbian economy. Quite obviously, the strong NBS interventions on the foreign currency market represent more than “the prevention of excessive daily oscillations of the Dinar exchange rate”. Given the high level of Euroisation of the Serbian economy, the NBS interventions on the forex market are important to achieve in-flation stability but also to prevent high losses or profits based on changes in credit and property
Despite low inflation …
… the NBS is very cautious in reducing the
key policy rate
NBS intervened strongly on the foreign currency
market to maintain exchange rate stability
Net own reserves increased in Q3 because
of purchases of foreign currency on forex market

Tren
ds
51Quarterly Monitor No. 34 • July–September 2013
value. That indicates that the official model for target inflation in Serbia is being implemented in specific conditions which means that the Dinar exchange rate is a key lever which the NBS uses to influence inflation.By making strong interventions on the forex market over the past few months, the NBS has sent the message that it will preserve the stability of the Dinar (at the very least over a period of months), while the foreign currency reserves that it has are a guarantee that it can do just that. The expected stability of the Dinar combined with high interest rates on state bonds and NBS REPO bonds have attracted speculative capital which has an opportunity to earn high short term profits. The Dinar interest rate of 9-10% means that real earnings in foreign currency are high even if the Dinar depreciates by 2-3% because then the real earnings would still be 6-8% a year. Although Serbia’s public debt is high, investors believe that Serbia will manage to finance it next year (the state is saying things about a possible arrangement with the IMF, sale of the Telekom, loan from the Emirates, etc.) and they are prepared to buy state issue bonds. The state, which currently has no access to cheap ways of financing the deficit, is taking out loans at high interest rates to ensure the liquidity of the budget. We should bear in mind that this manner of financing is not only expensive but also very risky in the case of a country like Serbia. All it takes is certain information or a real problem for speculative investors to start pulling out of Serbia. In that case, Serbia would have to secure large funding in a short time to service its public debt while the Na-tional Bank of Serbia (NBS) would see that as an outflow of foreign currency in the short term. Similarly, high NBS REPO rates would not only decrease the surplus liquidity in the domestic banking system but would also attract speculative capital and this is another argument in favor of reducing the REPO rate.
Table T7-1. Serbia: NBS interventions and foreign currency reserves 2011-20132011 2012 2013
Mar Jun Sep Dec Mar Jun Sep Dec Mar Jun Sep
Repo stock (in milions of euros) 549.77 746.09 1,000.42 1,174.84 1,055.98 111.98 2.29 354.16 678.86 663.82 832.03
NBS interest rate 12.25 12.00 11.25 9.75 9.50 10.00 10.50 11.25 11.75 11.00 11.00
NBS interest rate -9.74 6.76 12.59 7.15 1.11 -2.77 -5.74 1.11 6.95 3.31 13.24
NBS interest rate 25.66 28.86 5.17 2.61 -18.43 -7.27 -6.50 -3.99 19.25 12.85 12.83
NBS interventions on FX market (in milions of euros)
5.00 -30.00 -30.00 -30.00 -498.50 -1288.80 -1348.30 -1343.3010.00 -215.00 -140.00
INCREASE
NBS own resreves2) -8.9 14.0 26.8 73.9 -17.6 -45.4 -35.6 -6.0 12.5 7.1 17.9
NDA -0.7 -15.5 -28.6 -51.8 2.4 61.3 65.8 41.3 -15.3 -3.9 -16.2
Government, dinar deposits3) -4.6 -3.3 3.6 2.7 -5.1 6.1 4.3 -4.3 1.0 -1.2 -4.7
Repo transactions4) -6.9 -15.3 -32.2 -47.5 2.2 53.7 59.3 40.2 -16.0 -14.7 -23.8
Other items , net5) 10.9 3.1 0.0 -7.0 5.3 1.5 2.3 5.4 -0.3 12.0 12.4
H -9.6 -1.5 -1.8 22.1 -15.2 15.9 30.2 35.3 -2.8 3.3 1.7
o/w: currency in circulation -5.8 -4.2 1.3 12.4 -3.3 -4.0 -1.4 -1.6 -3.9 -0.7 1.0
o/w: excess liquidity -3.8 2.5 -5.5 6.3 -13.6 -1.6 -1.1 5.4 0.6 2.1 -1.4
NBS, net 56 282 1,374 2,203 -1070.60 -2087.45 -2383.97 -1050.95 30.01 -992.01 -1041.50
Gross foreign reserves 16 308 1,426 2,334 -1138.11 -2090.09 -2536.57 -1324.15 -385.77 -1576.91 -1822.60
Foreign liabilities 41 -26 -52 -131 67.51 2.64 152.60 273.20 415.78 584.90 781.10
IMF 37 -32 -59 -132 58.24 -6.44 138.99 258.95 401.14 568.40 759.83
Other liabilities 4 6 7 1 9.27 9.07 13.61 14.25 14.65 16.50 21.27
NBS, NET RESERVES-STRUCTURE
1. NBS, net 56 282 1,374 2,203 -1070.60 -2087.45 -2389.97 -1050.95 30.01 -992.01 -1041.50
1.1 Commercial banks deposits 22 226 109 -462 459.45 740.45 1030.19 907.59 911.80 967.01 1058.25
1.2 Government deposits -232 -258 -1,009 -455 263.40 488.43 683.75 28.63 -811.79 47.05 209.55
1.3 NBS own reserves -154 250 474 1,286 -347.74 -858.58 -670.03 -114.73 130.02 22.06 226.30
cumulative, in % of initial M21)
in millions of euros, cumulative from the beginning of the year
Source: NBS.1) “Initial M2“ denotes state of primary money at start of current ie end of previous year.2) Definition of net own reserves NBS is given in section 8 „Monetary trends and policy“, Frame 4, QM no. 5.3) „State“ includes all levels of government: republic and local.4) This category includes NBS treasury bonds and repo operations.5) Other domestic net assets include: domestic credits (net debts to banks not including treasury bonds and repo transactions; net owings by economy) together with other assets (capital and reserves; and balance items: other assets) and corrected by changes to exchange rate.
The fact that the NBS in Q3 was a net buyer of foreign currency on the inter-banking forex mar-ket had a positive effect on the level of NBS net foreign currency reserves which were increased by about 204 million Euro (in Q2 the NBS net own reserves dropped by 109 million Euro). The growth of net own reserves was also caused by the conversion of the state foreign currency
High interest rates and a stable
exchange rate attract speculative capital
Net own reserves increased in Q3 because
of purchases of foreign currency on forex market

Tren
ds
52 7. Monetary Flows and Policy
deposits with the NBS in Q3 which also caused an increase in the Dinar liquidity in the system. Compared to the level of primary money at the start of the year, Q3 recorded a drop in net do-mestic assets by 12.3% because of an increase of investments by business banks in REPO which caused a drop of 1.59% in the level of primary money in Q3.
Monetary System: Structure and Trends of the Money Mass
The nominal growth of the money mass M2 continued in Q3 and stood at 2.8% at quarterly level while the money mass increased by 3.9% from the start of the year. The noted rise is the consequ-ence of the growth of net foreign assets by 2.5% in Q3 which is due solely to the depreciation of the Dinar in September. On the other hand, credit activity to the private sector dropped by 0.8% in Q3 which neutralized the positive effect of the spending of state deposits on net domestic assets. Unlike the previous quarter, net domestic assets rose in Q3 by a modest 0.3% (growth of net domestic assets in Q2 stood at 6.8% of the value of the initial M2).
The money mass M21 recorded a nominal growth in Q3 which stands at 6.1% y-o-y despite the negative credit growth rate to the private sector of –4.1% y-o-y (in Q2 the y-o-y growth rate of the M2 stands at 4.5% Table T7-4). The real growth rate of the M2 is positive again after three quarters and stands at 1.2% y-o-y with a highly negative trend of a real drop of credit to the non-government sector which in Q3 stands at –8.9% y-o-y (in Q2 credits to the non-government sec-tor saw a drop of –9.2% y-o-y). The drop in Q3 of the real level of credit to the non-government sector has been dropping for a full year but if we look at the data corrected by changes to the exchange rate, we see that loans to the non-government sector have been dropping for more than a year. The biggest reason for the drop in credit to the non-government sector, is a drop within credit to the enterprises which stood at –11.8% in real terms y-o-y in Q3. This high rate of drop in credit activity to the enterprises is the consequence of the combined effects of the end to the program of subsidized credits and de facto recession in the largest part of the Serbian economy which the authors of economic policy still have no solution for. Since we can expect lower state spending in the next period, the drop in aggregate demand will make doing business in Serbia even more difficult in order to maintain the budget deficit at a sustainable level. The practical re-duction of sources of the current production cycle financing coupled with the high percentage of bad debts is threatening to launch a bankruptcy cycle which could spill over into a banking crisis.The greatest contribution to the 6.1% nominal y-o-y growth of the money mass M2 is owed to the monetary aggregate M1 of 4.25 percentage points which represents the continuing of the trend from the previous quarter. The growth of the M1 was achieved through higher state spen-ding in this and the previous quarter. Besides the increase of the M1 in Q3, we noted a nominal rise in foreign currency deposits of 2.87% y-o-y which in previous periods (not including Q2)
1 Monetary aggregate M2 in section Monetary trends and policy include the lesser aggregate M1, savings and timed deposits as well as foreign currency deposits in business banks. The aggregate M2 which we are monitoring is equal to the monetary aggregate M3 in NBS reports.
… as consequence of
increased net foreign assets
M2 recorded real growth at y-o-y level …
...but credits to the enterprises
continue to drop
5.00
10.00
15.00
20.00
25.00
30.00
35.00
Q1 Q1 Q3 Q4 Q1 Q1 Q3 Q4 Q1 Q1 Q3 Q4 Q1 Q1 Q3 Q4 Q1 Q1 Q3 Q4 Q1 Q1 Q3 Q4 Q1 Q1 Q3 Q4 Q1 Q2 Q3 Q4 Q1 Q2 Q3
2005 2006 2007 2008 2009 2010 2011 2012 2013
in %
Real M2/GDP Dinar part of M2
Graph T7-2. Serbia: money mass trends as percentage of GDP 2005-2013
Source: QM calculation
150,000
250,000
350,000
450,000
550,000
650,000
750,000
850,000
950,000
Q1 Q1 Q3 Q4 Q1 Q1 Q3 Q4 Q1 Q1 Q3 Q4 Q1 Q1 Q3 Q4 Q1 Q1 Q3 Q4 Q1 Q1 Q3 Q4 Q1 Q1 Q3 Q4 Q1 Q2 Q3 Q4 Q1 Q2 Q3
2005 2006 2007 2008 2009 2010 2011 2012 2013
in m
ilion
s of
eur
os
M2 in constant prices Dinar part of M2
Graph T7-3. State of money mass in permanent prices 2005–2013
Source: QM calculation
Q3 records nominal growth
of M2 …

Tren
ds
53Quarterly Monitor No. 34 • July–September 2013
were the biggest generators of growth of the M2 (the 9.98% rise in foreign currency deposits in 2012). Dinar savings and time deposits had a negative effect on the overall growth of the M2 as they did in the past year with the y-o-y contribution in Q3 standing at –1.01 percentage points.
Table T7-4. Serbia: growth of money and contributing aggregates 2011–20132011 2012 2013
Mar Jun Sep Dec Mar Jun Sep Dec Mar Jun Sep
M21) 8.0 3.7 8.1 10.1 14.0 18.1 13.8 9.6 8.2 4.5 6.1
Credit to the non-government sector2) 19.3 11.6 8.3 7.7 14.4 14.0 16.6 9.8 1.9 -0.5 -4.4
Credit to the non-government sector2), adjusted3) 16.7 13.0 11.8 8.1 8.6 4.6 7 3.8 1.6 0.6 -4.1
Households 25.1 20.6 17.8 5.7 5.7 3.3 3 2.5 3.0 2.9 2.9Enterprises 12.8 9.4 8.8 9.3 10.1 5.3 9.1 4.4 0.9 -0.6 -7.6
M21) -5.4 -8.0 -1.2 2.7 10.1 12.0 3.4 -2.2 -2.6 -5 1.191211
Credit to the non-government sector2) 4.5 -1.0 -1.1 0.5 10.5 8.1 5.9 -2.0 -8.2 -9.2 -8.86103
Credit to the non-government sector2), adjusted3) 1.8 0.2 2.2 0.9 4.9 -1.2 -3.6 -8.1 -8.7 -8.2 -8.5
Households 9.2 7.0 7.8 -1.3 2.0 -2.4 -7.2 -9.2 -7.5 -6.1 -1.9Enterprises -1.6 -3.0 -0.4 2.1 6.3 -0.5 -1.7 -7.5 -9.3 -9.3 -11.8
M21) 1,315.6 1,344.8 1,412.2 1,498.0 1,499.7 1,588.6 1,607.6 1,641.7 1622.7 1659.8 1705.8
M21) dinars 382.7 402.0 433.8 486.5 445.0 444.6 467.4 480.6 478.8 492.5 519.5
Fx deposits (enterprise and housholds) 932.9 942.8 978.3 1,011.5 1,054.7 1,144.0 1,140.2 1,161.1 1143.8 1167.3 1186.3
M21) -3.3 -1.2 3.8 10.1 0.1 6.1 7.3 9.6 -1.2 1.1 3.9NFA, dinar increase -1.9 -1.4 9.5 11.9 -5.6 -4.5 -7.9 0.2 7.2 2.7 5.2NDA -1.4 0.2 -5.7 -1.8 5.7 10.5 15.2 9.4 -8.4 -1.6 -1.3
cumulative, in % of opening M24)
in bilions of dinars, end of period
real y-o-y, in %
y-o-y, in %
Source: NBS1) Money mass: components – see Analytical and Notation Conventions QM.2) Credits to private sector – credits to enterprises (including local government) and households.3) Trends are corrected by exchange rate changes. Corrections are made under assmption that 70% of loans to private sector (and households and the enter-prises) are indexed in Euro.4) Initial M2 denotes state of M2 at start of current ie end of previous year.
Banking sector: Placements and Sources of Financing
Unlike the previous quarter which saw a drop in overall placements of 292 million Euro, the banking sector increased its placements by 102 million Euro in Q3 (Table T7-5). The unfavorable structure of placements from the previous quarter did not change in Q3 and banks placed their sur-plus liquidity once again in REPO and treasury bonds. Much greater cause for concern comes from the fact that credits to the enterprises and the households have once again recorded a drop which stood at 102 million Euro in Q3 (in Q2 placements to the enterprises and the households dropped by 325 million Euro). This drop of placements is the result of a pronounced decrees in placement to the enterprises of 265 million Euro in Q3, which was somewhat compensated by an increase in the debts of the households of 62 million Euro. The negative trend of a drop in credit placements to the enterprises has been ongoing for a year and at the end of September the enterprises repaid a total of 923 million Euro in debts to domestic banks. Bearing in mind the fact that the NBS revoked the license of the Privredna Bank Belgrade in October which means its dues were not included in the banking sector balance, and the fact that since March there have been no subsidized loans for turnover funds and liquidity which were a significant generator of credit activity, we can expect the negative trend of repayment by the enterprises to continue to the end of the year.In regard to the question of the enterprises taking loans abroad, the situation is just slightly better compared to the previous quarters. In Q3 cross-border credits increased by 22 million Euro (in Q2 140 million Euro of debts were repaid abroad and in Q1 70 million Euro) which is progress compared to the period of more than a year of repayments but still not enough bearing in mind the drop in credit placements from domestic sources. Currently there are no concrete measures which the authors of monetary or fiscal policy have identified as crucial to solving problems in a majority of the economy which is having an increasingly hard time in gaining access to sources of financing their production.Following the stagnation in Q2, business banks have once again increased their placement in REPO by an additional 173 million Euro (in Q2 a drop in REPO stock of 2 million Euro, in Q1 a growth of 321 million Euro). Bearing in mind that the NBS did not correct its key policy rate
… while banks have been placing surplus
funds into treasury bonds and REPO papers
Currently no fresh indications that debt repayment trend will
stop soon
The enterprises have been constantly
repaying their debts for a year …

Tren
ds
54 7. Monetary Flows and Policy
Although third bank lost its license …
… deposits by the households and the
enterprises in Q3 are rising
for a full three months despite the weakening of the y-o-y inflation rate, we should not be sur-prised by the interest of business banks in placing surplus liquidity in this way. Besides placement in REPO, a part of the liquidity of business banks was used to buy treasury bonds for around 470 million Euro, form which 100 million is new debt while the rest was used to pay for bonds which fell due in the meantime. During Q3, three auctions for treasury bond denominated in Euro were held with bonds worth a total of 114.4 million Euro were sold and 90% of the amount used to pay out earlier issues of bonds in Euro.
Table T7-5. Serbia: bank operations – sources and structure of placements, corrected1) trends, 2011-2013
2011 2012 2013
Mar Jun Sep Dec Mar Jun Sep Dec Mar Jun Sep
Funding(-, increase in liabilities) 603 69 -822 -1,083 672 692 472 -384 109 341 213
Domestic deposits 206 -148 -844 -1,169 589 146 15 -459 4 -56 -325
Households deposits -92 -295 -483 -655 -49 -189 -296 -578 -87 -132 -252
dinar deposits 24 13 -68 -182 30 69 36 11 16 -34 -110
fx deposits -116 -308 -416 -473 -79 -258 -332 -589 -102 -98 -141
Enterprise deposits 298 147 -361 -513 638 336 311 120 91 76 -73
dinar deposits 176 13 -128 -350 362 304 230 99 -11 -11 -109
fx deposits 122 134 -233 -164 275 31 81 21 102 87 36
Foreign liabilities 580 634 678 545 3 345 335 127 357 406 588
Capital and reserves -183 -416 -656 -459 80 200 123 -52 -252 -9 -50
Gross foreign reserves(-,decline in assets) -720 -674 -517 -923 -199 371 164 284 -278 -104 84
Credits and Investment1) 309 1,270 2,158 2,771 409 -424 201 521 123 -169 -67
Credit to the non-government sector, total 216 1,030 1,554 1,940 309 136 784 589 -23 -348 -551
Enterprises 191 766 1,189 1,607 375 161 741 552 -71 -463 -728
Households 25 263 365 333 -36 -25 42 37 48 115 177
Placements with NBS (Repo transactions and treasury bills)
86 268 529 720 -28 -944 -1,052 -701 321 319 492
Government, net2) 7 -28 75 111 128 385 470 632 -175 -140 -8
MEMORANDUM ITEMS
Required reserves and deposits -157 -429 -210 391 -552 -418 -451 -265 -17 -87 -443
Other net claims on NBS3) 17 123 2 110 -199 -20 -42 58 -154 -85 118
o/w: Excess reserves 22 123 -3 100 -187 45 54 10 -151 -96 60
Other items4) -136 -195 -246 -601 150 222 56 146 100 50 54
Effective required reserves (in %) 5) 23 21 21 24 22 23 23 23 25 24 22
in millions of euros, cumulative from the beginning of the year
Source: NBS1) Calculating growth is done with the assumption that 70% of the overall placements are indexed in Euro. Growth for original Dinar values of deposits are calculated based on the average exchange rate for the period. For foreign currency deposits – as the difference of the state calculated under the exchange rate at the ends of the periods. Capital and reserves calculated under exchange rate at ends of periods and do not include effects of exchange rate changes on recalculation of balance remainder. 2) NBS Bonds include state bonds and NBS treasury bonds sold at repo rates and rates set by market in terms of permanent auction sale with a due date longer than 14 days.3) Net loan to state: credits approved to state decreased by state deposit in business banks; negative prefix signifies higher growth of deposits against credits. State includes all levels of government: republic to local level. 4) Other NBS debts (net): difference between NBS debts to banks on basis of cash and free reserves and debts to NBS.5) Items in bank balances: other assets, deposits by companies in bankruptcy, inter-banking relations (net) and other assets not including capital and reserves.6) Effective mandatory reserve is the participation of mandatory reserves and deposits in the overall deposits (of the households and enterprises) and bank debts abroad. The basis for the calculation of the mandatory reserves does not include subordinate debt which is unavailable
Sources of new placements for the banking sector increased by 128 million Euro in Q3 as the consequence of growth of domestic deposits (in Q2 the drop of new placements stood at 234 million Euro, Table T7-5). The greatest contribution to the recorded growth was by deposits from the enterprises which increased by 149 million Euro of which two thirds were deposited in Dinars and the rest in foreign currency. The households increased its deposits with business banks in the same period by 120 million Euro with a similar currency structure as the enter-prises. The side of contribution to growth of sources of new placements includes an increase in capital and reserves of business banks which stood at 128 million Euro in Q3. On the other hand, the negative contribution to growth is due to the decision by banks to reduce their debts to foreign creditors, which led to banks repaying 182 million Euro of debts in Q3. Unlike the previous quarter when we could attribute part of the negative credit placements to the reduction of sources for their financing, we can conclude in Q3 that this is not the case and that business banks in Serbia are fairly restrained in terms of the placement of new credits to the enterprises which is not showing serious signs of recovery.The worrying speed of growth of non-performing loans in the banking sector in Serbia has been noted from the start of the year and it continued in Q3 at the end of which the participation of
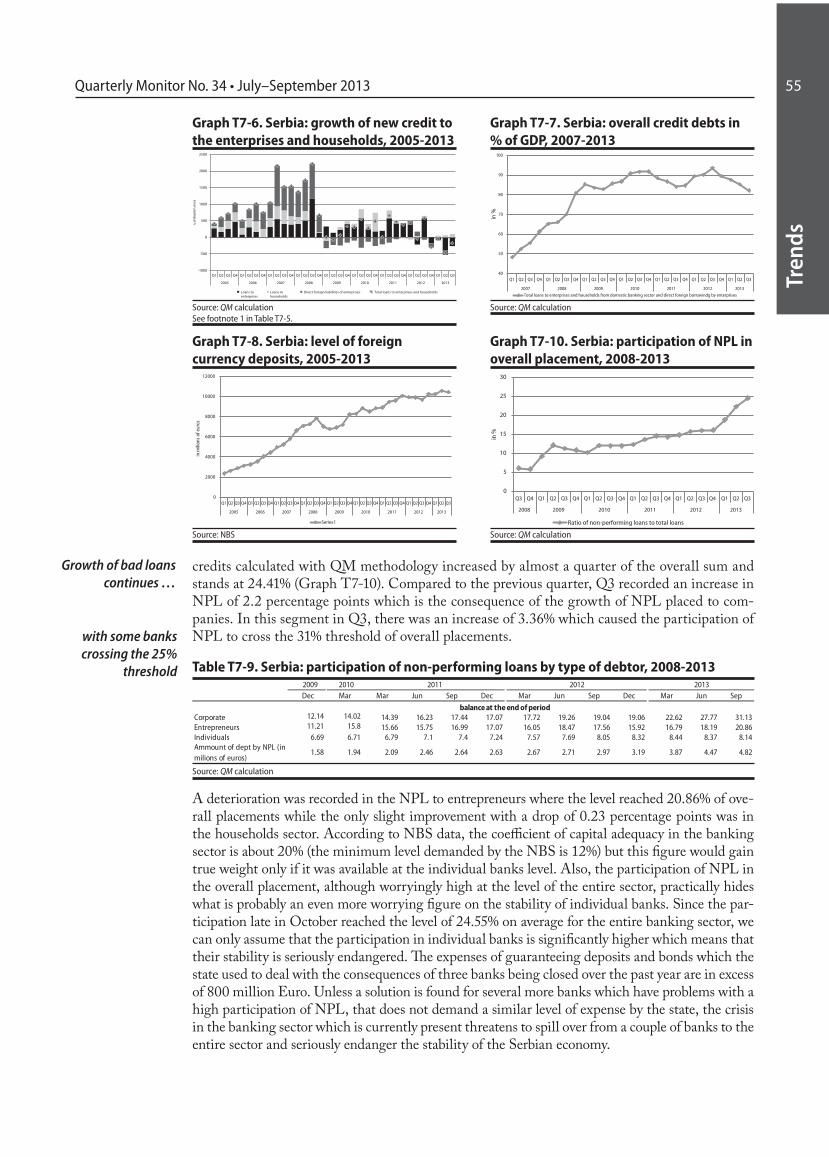
Tren
ds
55Quarterly Monitor No. 34 • July–September 2013
credits calculated with QM methodology increased by almost a quarter of the overall sum and stands at 24.41% (Graph T7-10). Compared to the previous quarter, Q3 recorded an increase in NPL of 2.2 percentage points which is the consequence of the growth of NPL placed to com-panies. In this segment in Q3, there was an increase of 3.36% which caused the participation of NPL to cross the 31% threshold of overall placements.
Table T7-9. Serbia: participation of non-performing loans by type of debtor, 2008-20132009 2010 2011 2012 2013Dec Mar Mar Jun Sep Dec Mar Jun Sep Dec Mar Jun Sep
Corporate 12.14 14.02 14.39 16.23 17.44 17.07 17.72 19.26 19.04 19.06 22.62 27.77 31.13Entrepreneurs 11.21 15.8 15.66 15.75 16.99 17.07 16.05 18.47 17.56 15.92 16.79 18.19 20.86Individuals 6.69 6.71 6.79 7.1 7.4 7.24 7.57 7.69 8.05 8.32 8.44 8.37 8.14Ammount of dept by NPL (in milions of euros)
1.58 1.94 2.09 2.46 2.64 2.63 2.67 2.71 2.97 3.19 3.87 4.47 4.82
balance at the end of period
Source: QM calculation
A deterioration was recorded in the NPL to entrepreneurs where the level reached 20.86% of ove-rall placements while the only slight improvement with a drop of 0.23 percentage points was in the households sector. According to NBS data, the coefficient of capital adequacy in the banking sector is about 20% (the minimum level demanded by the NBS is 12%) but this figure would gain true weight only if it was available at the individual banks level. Also, the participation of NPL in the overall placement, although worryingly high at the level of the entire sector, practically hides what is probably an even more worrying figure on the stability of individual banks. Since the par-ticipation late in October reached the level of 24.55% on average for the entire banking sector, we can only assume that the participation in individual banks is significantly higher which means that their stability is seriously endangered. The expenses of guaranteeing deposits and bonds which the state used to deal with the consequences of three banks being closed over the past year are in excess of 800 million Euro. Unless a solution is found for several more banks which have problems with a high participation of NPL, that does not demand a similar level of expense by the state, the crisis in the banking sector which is currently present threatens to spill over from a couple of banks to the entire sector and seriously endanger the stability of the Serbian economy.
Growth of bad loans continues …
with some banks crossing the 25%
threshold
Loans toenterprises
Loans to households
Direct foreign liabilities of enterprises Total loans to enterprises and households
-1000
-500
0
500
1000
1500
2000
2500
Q1 Q2 Q3 Q4 Q1 Q2 Q3 Q4 Q1 Q2 Q3 Q4 Q1 Q2 Q3 Q4 Q1 Q2 Q3 Q4 Q1 Q2 Q3 Q4 Q1 Q2 Q3 Q4 Q1 Q2 Q3 Q4 Q1 Q2 Q3
2005 2006 2007 2008 2009 2010 2011 2012 2013
u m
ilion
im e
vra
40
50
60
70
80
90
100
Q1 Q2 Q3 Q4 Q1 Q2 Q3 Q4 Q1 Q2 Q3 Q4 Q1 Q2 Q3 Q4 Q1 Q2 Q3 Q4 Q1 Q2 Q3 Q4 Q1 Q2 Q3
2007 2008 2009 2010 2011 2012 2013
in %
Total loans to enterprises and households from domestic banking sector and direct foreign borrowindg by enterprises
Graph T7-6. Serbia: growth of new credit to the enterprises and households, 2005-2013
Graph T7-7. Serbia: overall credit debts in % of GDP, 2007-2013
Source: QM calculationSee footnote 1 in Table T7-5.
Source: QM calculation
0
2000
4000
6000
8000
10000
12000
Q1 Q2 Q3 Q4 Q1 Q2 Q3 Q4 Q1 Q2 Q3 Q4 Q1 Q2 Q3 Q4 Q1 Q2 Q3 Q4 Q1 Q2 Q3 Q4 Q1 Q2 Q3 Q4 Q1 Q2 Q3 Q4 Q1 Q2 Q3
2005 2006 2007 2008 2009 2010 2011 2012 2013
in m
ilion
s of
eur
os
Series1
Graph T7-8. Serbia: level of foreign currency deposits, 2005-2013
Source: NBS
0
5
10
15
20
25
30
Q3 Q4 Q1 Q2 Q3 Q4 Q1 Q2 Q3 Q4 Q1 Q2 Q3 Q4 Q1 Q2 Q3 Q4 Q1 Q2 Q3
2008 2009 2010 2011 2012 2013
in %
Ratio of non-performing loans to total loans
Graph T7-10. Serbia: participation of NPL in overall placement, 2008-2013
Source: QM calculation

Tren
ds
56 8. International Environment
Tren
ds
56
8. International Environment
The global recovery is slower than expected because of the low growth level in developing countries. Developing countries are continuing their expansive monetary policies while the United States and the European Union are conducting fiscal consolidation. The FED has given up its plan to slow down the pace of quantitative easing after the interest rate on long-term bonds rose too quickly. The European Central Bank lowered its key policy rate to 0.25% because of the slow and fragile recovery of the economy and the low and falling inflation. Most of the developing countries do not have maneuvering room for an expansive fiscal po-licy and debt expenses are increasing as the FED approaches its exit strategy. The risks to global growth are political disagreements over fiscal policy in the US, a slowing down of the developing countries and perhaps the most significant risk is the possible sudden leap of interest rates. Inflation is dropping in the US and EU.
The World
According to International Monetary Fund predictions in October, global growth stands at 2.9% in 2013, rising to 3.6% in 2014. Developed countries will achieved a growth of around 2% in 2014 and developing countries a growth of 5.1%. The predicted rate for 2014 is reduced for China from 7.4% to 7.3%, for Brazil from 3.2% to 2.5%, for India from 6.2% to 5.1% and for Russia from 3.3% to 3%.The recovery continued in the European Union but although exports rose in peripheral area countries that was not enough to east the negative effects of low domestic demand. Also, no agreement was reached on resolving the problem of banks with bad balance sheets. The EU and China are planning to implement an agreement on investments to prevent the introduction of protectionist measures which usually have a negative effect for both sides and cut down economic growth. This agreement will most probably remove some of the barriers to investments and open the Chinese banking sector and make Chinese investments safer in the EU.The growth in developing countries slowed down again and the causes are partly cyclical and partly structural. According to the IMF, China needs to increase domestic demand and Brazil and India need to put their economic environments in order to increase foreign investments. The reduction of the expansion of FED monetary policy is a danger to countries with high budget deficits and inflation. The higher long-term interest rate in the US increased loan expenses while the withdrawal of capital weakens domestic currencies and increases import inflation.
Eurozone
The European Commission is predicting a drop in the eurozone GDP –0.4% in 2013 and a growth of 1.1% in 2014. The growth of seasonally adjusted quarterly GDP slowed down over the year from 0.3% in Q2 compared to Q1 to 0.1% in Q3 compared to Q2. At y.o.y. level, growth continued to be negative (0.4%). Recovery is still weak and will most probably continue at the same pace in Q4. In Germany growth in Q3 stood at 0.3% compared to the previous quarters while in France the GDP result in Q3 dropped compared to the previous quarter by –0.1%. Of the countries in the peripheral area of the EU, Spain was a surprise with a positive growth of 0.1% in the third quarter while in Italy in Q3, the GDP dropped compared to the previous quarters by –0.1%.Overall inflation in October in the eurozone dropped by 0.4 percentage points from 1.1% to 0.7% which is almost at the lowest level of the past four years. That drop was primarily caused by volatile components – food and fuel – but base inflation dropped by 0.2 percentage points to 0.8% which is proof that because of high unemployment domestic demand continues to have a negative effect on inflation. Although inflation rose in November by 0.9% it is not expected to speed up significantly.
Tren
ds
57Quarterly Monitor No. 34 • July–September 2013
Tren
ds
57
The European Central Bank lowered its REPO rate by 0.5 percentage points to 0.25% primarily because of the slow recovery of the eurozone economies as well as low and dropping inflation. The drop of those rates was not expected and is seen as a signal that the ECB will be prepared to continue with the other instruments of support to the recovery. The ECB balance, unlike the balances of other big central banks, has dropped over the past few months because commercial banks are getting rid of their debts which is lowering the demand and cutting down inflation. The ECB is expected to continue the programs which will raise the level of liquidity.Unemployment in the eurozone is relatively stable and increased in Q3 by 0.1 percentage points to reach 12.2%. The lowest level was in Austria (4.9%) and Germany (5.2%) while the highest was in Greece (27.6%) and Spain (26.6%). The fiscal deficit in the EU member states should be lower next year than this year because of fiscal consolidation which is being conducted in those countries. The planned fiscal deficit of the EU member states for next year stands at –2.5% instead of this year’s –3.1% of the GDP. Accor-ding to the latest data, the public debt of the eurozone member states has increased to 93.4% of the GDP. The greatest ratio of debt to GDP is in Greece (161.1%) Italy (133.3%), Ireland (125.7%) and the lowest in Estonia (9.8%) and Bulgaria (18%).In Q3 the trade surplus in the eurozone stood at 37.4 billion Euro which is less than in Q2 when it stood at 40.8 billion.
United States
In Q3 the United States had a growth of 1.6% at annual level which is the same as in Q2 but the growth at quarterly level speeded up (from 2.5% to 2.8%1). That growth had the contribution of accumulated stockpiles and net exports but domestic demand slowed down. State spending saw a growth following a year of decrease and private demand slowed down primarily because of the low investments in equipment and weak personal spending. The relatively low rate of growth in the US is the main reason why there is no significant rise in employment which makes the economy vulnerable to shocks and the political situation without an agreement on fiscal policy increases the risk of a future slowdown of the economy when the instruments of monetary policy will not have the effect they do now.The American FED has sent divergent signals on the monetary policy it intends to implement in the near future. The significant rise in long-term interest rates over the summer was followed by their decrease after the FED changed its view on the date to start cutting down the quantitative easing. Base inflation has stagnated at the level of about 1.7% since the summer while overall inflation dropped from 2% to 1% from August to October.Fiscal consolidation in the US is still being implemented in a bad way – through sequestration because the Republicans and Democrats have failed to reach and agreement. Political uncerta-inty is lowering investments. Capital investments currently account for some 50% of company profits which is significantly lower than the historic average which means that recovery will not be quicker until companies start investing more. Unfortunately, the political situation and disa-greements over fiscal policy are having a negative effect on the willingness of managers to invest. Unemployment dropped in Q3 – in June it stood at 7.6% and in October at 7.3%. However, those figures should not be viewed as too positive because even though unemployment is drop-ping, participation rate on the labor market is being reduced and now stands at less than 63%. If participation remained at the same level as before the crisis when it was at about 66% the unem-ployment rate now would be over 11%! Since the FED monetary policy is linked to two goals – maintaining employment and price stability – the low participation rate will cause a tightening of monetary policy even if the unemployment rate drops to less than 6.5%.
1 Saar – seasonally adjusted quarterly growth rate used in the USA

Tren
ds
58 8. International Environment
Tren
ds
58
Central and Eastern Europe
After the FED said it would not start implementing its monetary policy exit strategy soon, the expenses of debts in developing countries dropped compared to the level of before the summer but they are still significantly higher than early in the year. In Asia and South America, the es-cape of short-term capital in many countries caused a significant drop in the currencies2, a rise in the cost of debts, and sales of shares. Negative effects were less pronounced in the region3 because of stronger ties with the eurozone than with the US which invested less “hot” capital than in other developing countries. However, this should not lead to the conclusion that the region will certainly be more stable in the future because the countries of this region often have a bad public debt/GDP ratio and the greater need for financing. If, after the rise in interest rates next year, foreign investors change their views of the region, Serbia could be vulnerable because of the high public debt /GDP ratio.Since inflation in the countries of the region is dropping and the economies are either stagnating or recovering slowly, many central banks have been using that environment and have reduced the level of the key policy rates.Croatia had a negative growth of -0.6% in Q3, somewhat less than in Q2 (-0.7%) but that repre-sents an economic drop for the eighth quarter in a row. Probably the successful tourist season and slight recovery of personal spending helped growth but because Croatia left CEFTA its exports dropped and the drop in industrial production picked up pace. The European Commission is predicting a growth of 0.5% next year although these weak results in Q3 mean that it will proba-bly be close to zero in 2014. If investments are low in 2014, Croatia will be in recession for a sixth year in a row. Unemployment in 2014 will probably stay at similar levels as to date close to 17%.Croatia has also seen its inflation drop, and it dropped sharply from 1.1% in September to a record low of 0.2% in October. A single price rise is expected to happen because the lower VAT rate will be raised for some products and the higher duties on cigarettes. The national bank is maintaining the liquidity of banks and stimulating credit activity. The government presented its 2014 budget which includes a planned budget deficit of 5.5% which is a signal to investors that this government is not prepared to implement decisive reforms. The Finance Minister said before the budget plan was presented that Croatia will ask the IMF for help if circumstances do not improve next year. That provides guarantees to investors that Cro-atia will not hesitate to make a deal with the IMF like Hungary did but Croatia’s debt expenses are expected to rise because of a lack of political will to reduce public spending. Besides lower spending, the government should change the labor law to make the labor market more flexible.In Q3 Romania saw a growth higher than expected standing at 4/1% at annual level and 1.6% compared to the previous quarter. That growth was helped by exports, agriculture and industrial production and personal spending is recovering. The European Commission has predicted a growth of 2.2% for 2013 and 2.1% for next year. Economic growth was to some extent subject to political risks because of the presidential elections next year. Inflation in Romania in October was 1.9% at annual level. The central bank lowered its key policy rate by 0.25 percentage points to 4%.A new stand by arrangement is being planned with the IMF with the EU securing part of the funds as it did before. The Romanian president used his constitutional powers to prevent a rai-sing of the duties on fuel (which was part of the agreement with the IMF) because he felt that the measure would just raise inflation and lower demand. President Traian Basescu used the situation to clash with the government but that most probably will not endanger the arrange-ment with the IMF because, even if parliament adopts the demands of the president, the funds planned from the collection of duties will come from savings in some other place in the budget.
2 Brazil’s Real and India’s Rupee lost about 20% of their value since May and the South African rand and Turkish lira about 15% 3 Besides in the Ukraine and Turkey primarily because of high current deficits (Turkey is often put in the region of Central and Eastern Europe)

Tren
ds
59Quarterly Monitor No. 34 • July–September 2013
Tren
ds
59
Romania is implementing fiscal consolidation with a fair amount of success and the government is planning a budget deficit of 2.2% in 2014.Hungary’s growth in Q3 was higher than expected – 1.7% at annual level, 0.8% compared to the previous quarter. Agriculture saw a high level of growth due to bad weather conditions and low base effects, the construction industry was helped with EU funds and the processing industry started to use its new auto industry capacities. A positive effect on growth is expected from the central bank program of aid to small and medium sized enterprises which want to take inves-tment loans.Inflation continued dropping in Q3 and stood at 0.9% in October. Prices regulated by the go-vernment and local government caused a drop in inflation and a somewhat slower growth of food and fuel prices than last year. Since the prices of electricity and fuel were lowered administrati-vely again in November, the assessment is that inflation at annual level in December will stand at just 0.4%. Since the high base and administrative cuts effects will disappear next year, annual inflation at the end of the next year is predicted to stand at more than 2%. Since August last year, the Hungarian central bank has lowered its key policy rate from 7% to the current 3.2% to stimulate the economy and that rate is expected to drop further to 3% by the end of the year. However, due to the expected rise in inflation and long-term interest rates, the central bank can hardly be expected to leave the key policy rate at that high level next year.Hungary significantly lowered its budget deficit level this and last year and it intends to do the same next year with the government planning for a target of 2.9% which is below the level set in Mastricht. The effects of the rise in long-term interest rates is already being felt on the bonds market where the rate on 10 year Hungarian bonds is close to 6%. The public debt/GDP ratio is fairly high (80%) and a sudden leap in debt expenses could be risky. The government has secured the financing for the first half of 2014.
Hig
hlig
hts
Highlights60
in 2014, and remained within the levels projected in the fiscal strategy in 2015 and 2016, fiscal consolidation in Serbia would still be moderate, and not too sharp. From the aspect of economic recovery we think that a gradual fiscal consolidation would be more suitable for Serbia, because Serbian economy is facing a sharp reduction in credit activity. In edition to fiscal consolidation and reforms, it is ne-cessary to take measures for improving extremely poor liquidity of economy, through joint action of fiscal and monetary policy. Liquidity-focused measures would help solvent companies faced with temporary financial problems overcome the crisis, and efficient bankruptcy procedure would enable elimination of insolvent com-panies from the market. Of course, recovery in a small open economy like Serbia’s largely depends on the de-velopments in the region, and in the case of Serbia on economic trends in EU.Additional savings, which would reduce fiscal deficit in 2014 and in the following years, are necessary, not only from the aspect of public finance, but also from the as-pect of economic recovery. Because investors are aware of the possibility of public debt crisis in Serbia, rise in domestic demand through rise in fiscal deficit is cance-led out by fall in investments and private consumption. Consequently, GDP growth rate will stand at only 2% in 2013 in spite of very strong fiscal stimuli manife-sted through fiscal deficit at 6.6% of GDP. Economic growth of 2% in 2013 did not come from large fiscal deficit, or high domestic demand, but from the factors on the supply side – increase in agricultural production, and in FIAT and NIS production. Serbian economy is expected to stagnate in the next year, although fiscal de-ficit will run at as much as 7.1% of GDP. Even when do-mestic demand was by 20-25% higher than GDP, there was no significant growth in Serbian economy, which is understandable since this is a small open economy. In the period 2001-2012 Serbia was among Central and Eastern European states (CEE) with the largest surplus of domestic demand relative to GDP, but its economic growth was below the average in CEE states. This pro-ves conclusively that increase in fiscal deficit does not lead to growth in GDP, but it reduces it, under the exi-sting circumstances. Fiscal multipliers in a small open economy with flexible exchange rate are low in general, but under large indebtedness they become negative. Ne-gative fiscal multipliers are detected in countries with large public debt and low credit rating, which is the case of Serbia.
Highlight 1. Analysis and Evaluation of the Fiscal Policy for 2014-2016 Milojko Arsić 1, Saša Ranđelović 2
In this Highlight we will give a general evaluation of the adopted fiscal policy, analyze individual measures and challenge some of the alternative measures.
General remarks
The adopted fiscal policy for 2014-2016 does not attack the problems in Serbian public finances and economy adequately. The greatest weakness of this policy lies in the projected increase in fiscal deficit from already high 6.6% of GDP in 2013 to 7.1% of GDP in 2014. Increase in fiscal deficit in the first year of the announced shift in fiscal policy, and strong fiscal adjustments not before 2016 undermine the credibility of this policy. Credi-ble fiscal policy is important to Serbia in many ways. Credible fiscal policy, positively evaluated by IMF, wo-uld reduce costs of borrowing, and more importantly, alongside other policies and reforms it could reverse the downward trends in private investments and private consumption.We therefore think that additional savings of about 1% of GDP need to be made in the next year to make at le-ast a symbolic reduction in fiscal deficit in 2014 relative to this year. To produce effects on economy already in 2014, the austerity measures should be adopted as soon as possible, and side by side with short-term savings, a plan for reforms in public sector that would guarantee reduction in fiscal deficit in the years to come need to be implemented. This implies that the government must adopt a sweeping pension reform, plans for right-sizing the number of employees in the public sector, restructu-ring plan for Srbijagas and other public enterprises, effective measures against shadow economy, etc. To give credibility to the reform plans, the Government must fully implement the measures that have been adopted so far, such as the plan for settling the status of companies undergoing restructuring.Reduction in fiscal deficit to 6.1-6.3% in the next year would make fiscal consolidation plans for 2015-2016 fe-asible. However, with fiscal deficit at 7.1% of GDP in 2014, it would be quite unlikely to reduce fiscal deficit to 5.2% of GDP in 2015 and to 3.2% of GDP in 2016. If fiscal deficit narrowed to somewhat above 6% of GDP
1 Faculty of Economics, University of Belgrade2 Faculty of Economics, University of Belgrade
HIGHLIGHTS
Hig
hlig
hts
61Quarterly Monitor No. 34 • July–September 2013
Fiscal stimuli in Serbia are inefficient also because the main obstacles to economic growth are on the supply side, and not on the demand side. Main obstacles to eco-nomic growth are on the supply side, i.e. in the weakne-sses of economic system which discourage investment and entrepreneurship, such as lax financial discipline, administrative barriers, inefficient judiciary, poor infra-structure, rigid labor market etc. Domestic demand in Serbia, although declining steeply, is still much higher than GDP, but it does not stimulate economic growth. Although a strong fiscal consolidation which would lead to reduction in fiscal deficit in 2014 was announced af-ter reshuffling of the government, it was not carried out. Some of the announced measures have been eased con-siderably (savings on salaries), some have been put off (pension reform, Srbijagas, Železara Smederevo), and some additional expenditures were financed hastily (pu-blic broadcasting service funding). Additional expen-ditures related to settling the status of the companies undergoing restructuring (transition fund) are justified, because they are intended to solve some of the greatest structural problems in Serbian economy. From the as-pect of fiscal economy, it is good that these are one-time expenditures that will not cause a permanent increase in fiscal deficit. However, we believe that additional spen-ding does not justify increase in overall fiscal deficit.We believe that fiscal consolidation failed to meet the announcements primarily due to the structure of the government. The current government, similar to the previous ones, consists of many parties, so probability of early elections is increased, and they are constantly in election campaign mode. Consequently, ruling parties tend to shift the responsibility for unpopular measures to their coalition partners, so some key decisions are not being made, some are deferred, and the decisions that have been reached are suboptimal. Inefficient decision making process in the Government (consensus) is an especially big obstacle in the period of economic crisis when responses have to be quick, and many, often un-popular, measures have to be made. In broad coalition governments, such has been Serbian for the past 13 ye-ars, small parties are in good position because they have large influence on decision making process, but take only a small share of responsibility for overall perfor-mance of the Government.
Analysis of individual measures of fiscal policy
Regarding the structure of fiscal consolidation me-asures, approximately one half of these measures will be taken on the revenue side of the budget (increase in the lower VAT rate, abolition of investment tax credit, shadow economy curbing), and the other half of the
measures will be implemented on expenditure side of the budget (reduction in wages in public sector, reduc-tion in subsidies, reduction in expenditures on interest payments). Although this fiscal consolidation program has a more adequate structure than the one from 2012, which mostly relied upon increase in revenues, in a comprehensive fiscal consolidation program fiscal con-solidation must primarily be achieved through reducti-on in public expenditures. Comparative analyses show that the tax burden in Ser-bia is not small (as GDP %), and equals the average in CEE states, and that public expenditures (as GDP %) are above the average in CEE states. This suggests that the large fiscal deficit in Serbia does not come from low taxes but from high public expenditures, meaning that reduction in fiscal deficit should be driven primarily by reduction in public expenditures. By economic classifi-cation, expenditures on wages in public sector and pen-sions, and expenditures on subsidies are well above the average in CEE states, while other expenditures (on go-ods and services, social security, interest payments etc.) equal the average in CEE states or are below it (pu-blic investments). Although the foregoing measures are expected to bring savings of 1.2-1.5% of GDP in 2014, the final effects of many of these measures are uncertain (shadow economy curbing or reduction in expenditures on interest payments, and to a smaller extent, reduction in expenditures on subsidies). It is therefore necessary to prepare additional measures that would be taken if some of the implemented measures failed to produce the desired effects.Regarding the measures on the revenue side of the bud-get, we think that the increase in the lower VAT rate from 8% to 10% is inevitable, and the key advantage of this measure is that it will produce effects in short-term, and there is no sound reason to expect that it will reduce domestic demand and GDP. Arguments against incre-asing VAT, often heard in the public, are based on the claim that the increase in VAT rate from 18% to 20% in 2012 led to the drop in demand, and that something similar can be expected now. We find such claims eco-nomically unfounded, because the data show that the drop in domestic demand is steep and driven primarily by decreased willingness of foreign investors and cre-ditors, and domestic banks to fund private investments and private consumption. If VAT rate had not been increased, fiscal deficit would be even larger, and this would lead to further decrease in investments and pri-vate consumption. If the drop in demand was attributed to the rise in prices driven by VAT rate increase by 2 percentage points, price elasticity of demand in Serbia would prove much higher than in other countries, but there is no plausible explanation for this.
Hig
hlig
hts
Highlights62
Firstly, this measure should be imposed on employees earning a middle level of wages (about RSD 40,000 per month) as well, because these employees are believed to be the least productive (administrative personnel etc.). Additionally, expenditures on pensions make a larger share of the fiscal deficit than expenditures on wages, so it would be justified to impose this measure on pensions as well, all the more because the current amount of pen-sions came from extraordinary discretionary increases in 2008, which are not related to the years of service and similar. Extended scope of this measure, implying reduction in wages and pensions above RSD 40,000, would provide for equal fiscal effect (0.3% of GDP) through a lower rate (7-8%). Alternatively, it would be justified to include all wages in the public sector above the minimum (about RSD 23,000 per month), and all pensions above the average (RSD 23,000 per month) into the scope of this measure - 3-4% reduction in these items would provide for equal budget impact.
One of the measures on the revenue side of the budget is abolition of corporate income tax relieves (investment tax credit). Under a moderate tax rate (corporate inco-me tax rate in Serbia at 15% is still below the average in CEE states – 15.2%) tax relieves do not encourage investments, but increase tax expenditures, which total RSD 22 billion per year in Serbia. Accordingly, aboliti-on of this tax relief is economically justified and in line with the best tax practices, both in developed and de-veloping countries. However, abolition of this tax relief only few months before the beginning of the taxation period lowers the predictability of business environment in Serbia. The government therefore must make a strong commitment to announce important changes to tax system in advance and introduce them gradually af-terwards and thus leave the companies room to adjust. Fiscal consolidation program also includes measures for curbing shadow economy, which are expected to bring in revenues of 0.25% of GDP, and additional 0.1-0.15% of GDP from the reduction in illicit sale of excise go-ods in 2014. Shadow economy down by 0.3% of GDP annually can be achieved if the government starts a full implementation of a wide range of measures as of the beginning of 2014. Any reduction above this is consi-dered unrealistic. However, since it takes considerable time to implement some of these measures (the Tax Administration reform, intended to increase the level of inspection activities), and because there is no consensus about some of them (ban on sale of new industrial pro-ducts at green or flea markets), it is uncertain whether they will bring in the projected revenues in 2014. Since the battle against shadow economy is expected to bring a considerable increase in public revenues in 2014, in-termediate goals, i.e. amount of revenues to be collected by the Tax Administration by the end of each quarter in 2014, should be set, so that the level of accomplis-hment of that goal can be used as an important measure of performance of the Tax Administration employees and management. Solidarity tax, i.e. reduction in net earnings in public sector, is the key fiscal consolidation measure on the expenditure side of the budget proposed by the Go-vernment. Since massive expenditures on employees make a large share of Serbia’s huge fiscal deficit, we find the decision to reduce expenditures through reduction in these expenses good. High expenditures on employees in the public sector come from an excessive number of employees (the number of employees in the public sec-tor in Serbia is by 15% larger than needed), and quite high wages relative to GDP and relative to the wages in the private sector. Accordingly, we find the announced reduction in wages in the public sector necessary, but the plan for its implementation is wholly inappropriate.
Box 1. Why is the adopted “solidarity tax” model inappropriate?
In economic literature, the idea that taxation of broad base at low rate is more efficient than taxation of nar-row base at high rate won recognition, because in the second case taxes are less distortive. Accordingly, the adopted plan which envisages reduction only in wag-es and other earnings above RSD 60,000 by as much as 20%, or 25% (for earnings above RSD 100,000), will impair the efficiency of the public sector, and produce limited fiscal effects (fiscal deficit narrows by 1/20%). Because originally the scope of this measure was lim-ited, in its final draft it has been expanded, which will impair the efficiency in some segments of the public sector. This solidarity tax will be imposed on all month-ly earnings (not only wages) of the public sector em-ployees above RSD 60,000, which is quite discrimina-tory towards those public institutions which have to compete against private companies to earn a part of their revenues – for example, author’s royalties from books published by the Official Gazette of the Repub-lic of Serbia will be by 20-25% lower than the royalties from the same book published by a private publishing house. These institutions, which are up against a severe market competition, are thus being discriminated and punished for their competitiveness. Consequently, a part of their business operations will be transferred to the private sector (for example, private companies will be founded to compete for research and development projects, author’s royalties will be transferred to private publishing houses etc.), which will impair the perfor-mance and efficiency of these public institutions. Addi-tionally, equal treatment is given to public institutions
Hig
hlig
hts
63Quarterly Monitor No. 34 • July–September 2013
In addition to solidarity tax, it was proposed to stop filling vacancies (arising from retirements, resignations etc.) temporarily, by the end of 2015. Estimates show that approximately 5-6% of the public sector employees will go into retirement in the following two years. Some of these vacancies will have to be filled, but if a half of them remain unfilled, the number of employees will decline considerably, by about 10,000 in a two-year pe-riod. Although the number of surplus employees vari-es, estimates show that there are more than 5% surplus employees in most public institutions. This temporary measure is therefore justified and good. Employment freeze is a suboptimal temporary measure, which should be applied until accurate estimates of the surplus employees in all parts of public sector (admi-nistration, education, health care system, culture etc.) are made, and on the basis of them, employee right-si-zing plan, through which the number of public sector employees in Serbia (per 1,000 citizens) would approxi-mate the average in CEE states by the end of 2016, is formulated. Additional reduction in wage and pension indexation in 2015 and 2016 (by 0.5% in April and October both years) is envisaged in the draft amendment to the Law on Budget System. This measure is considered nece-ssary. However, reduction in the relative amount of pu-blic expenditures and fiscal deficit through this measure will largely depend on the trends in inflation. Under a considerable slowdown in inflation, this measure would produce less marked effects on fiscal consolidation than planned. In that case, measures implying complete free-ze on wages and pensions or their nominal reduction would have to be considered. Reduction in expenditures on subsidies of about 0.3% of GDP is planned in this package of measures, which is considered necessary because expenditures on direct and indirect subsidies in Serbia are among the highest in Europe. However, there is a risk that these savings could be smaller, i.e. that the fiscal deficit could wide-
ned if the local governments do not reduce subsidies to local public utility companies. It is therefore necessary to reduce subsidies to public utility companies both on the local and the central government level and establish an appropriate institutional framework for their self-su-stainable operating. The announced considerable reduction in subsidies on investments and employment is conceptually correct, because these subsidies are a price the government has been paying for an uncertain business environment. However, complete abolition of subsidies before the key reforms in business environment have been carried out (Labor Law, Planning and Construction Law, Ban-kruptcy Law etc.) could lead to drop in investments. We therefore believe that a gradual reduction in subsidies, side by side with the reforms in business environment would be a good solution. In some subsidy schemes (Ra-ilways, agriculture etc.) subsidy granting mechanisms should be changed, to improve their efficiency.In spite of the reduction in the direct subsidies, total ex-penditures on subsidies remain high, due to extremely large indirect subsidies (in domestic methodology they are recognized as below the line transactions, where-as in international methodology they are recognized as expenditures on subsidies). These are primarily budget payments for government-guaranteed loans to public and state-owned companies, and for financial rehabilitation of banks. Under the line expenditures, on liabilities that have been taken on previously, will amount to 1.7% of GDP (approximately EUR 500 million) in 2014, which is by 0.8% of GDP (EUR 240 million) higher than in 2013. This is one of the chief reasons why the fiscal deficit will widen in 2014 relative to 2013 in spite of the fiscal consolidation measures. Possible government interventi-on in some of state-owned banks, which are facing se-rious problems, could increase these expenditures above the targeted. Without a considerable reduction in these expenditures, all other fiscal consolidation measures will fail to produce a marked reduction in fiscal deficit.
competing in the market (for example, hospitals which are bidding for international research and development projects) and the public institutions which have been granted a monopoly (public agencies etc.). We also think that the proposal by which control of solidarity tax collection is put under the authority of the Tax Admin-istration is inadequate, because, this body is unable to collect the existing taxes efficiently with its present ca-pacities, and downward trends in public revenues and in VAT collection confirm this (the Fiscal Council, 2013). If solidarity tax collection is put under the authority of the Tax Administration, with its present capacities, it will lack the resources to control private taxpayers. Conse-
quently, this could boost shadow economy. We believe that the solution to the problem of quite high wages in the public sector (relative to the private sector) lies in a comprehensive reform in the wage system, through which all persons doing the same or similar job in any part of the public sector would earn approximately equal wage. However, reduction in public expenditures through this measure implies that it should on average bring the reduction in the sum of earnings in the public sector. Additionally, a limit should be put on earnings in public agencies, which are partly funded from their own revenues earned on the basis of a law-granted mo-nopoly.
Hig
hlig
hts
Highlights64
In 2014-2016 Fiscal Strategy it has been recognized how important it is to stop the rise in state-guaranteed debt and it has been announced that the restructuring of public companies, as the largest state-guaranteed loan borrowers, will be finished by mid 2014. The Law on the Budget of the Republic of Serbia for 2014 also envisages issuance of government-guarantees on lo-ans necessary to finance semiannual liabilities of the-se borrowers. Restructuring of these public companies (primarily Srbijagas) is a quite complex and time-con-suming process. However, mid 2014 is considered the deadline for restructuring, otherwise sustainability of the public debt would be jeopardized in spite of the pro-posed fiscal consolidation measures. If the process of Srbijagas restructuring missed the deadline, increase in public debt in 2014 based on the issued government gu-arantees could cancel out the effects of the adopted fis-cal consolidation measures. Additionally, state-owned bank management should be improved considerably, as well as private bank supervision system, to reduce fiscal risks based on government interventions in the banking sector. The announced measures for fiscal consolidation will affect the local government level as well, primarily by directing local governments (through system of tran-sfers) to reduce subsidies, and through reforms in the system of wages and employment. Additionally, tran-sfers to local governments could be partly conditioned by the degree of exploitation of the property tax revenue impact, which is considered a good measure. Howe-ver, frequent ad hock reforms have impaired the equity, efficiency and transparency of the system of transfers to local governments in Serbia compared with the pe-riod after the Law on Local Self-government Funding came into force in 2007. We therefore believe that the reform in the system of transfers to local governments in Serbia is necessary. The system could be designed on the basis of the system of transfers from 2007, which would be adapted to the changes that have occurred in the public finance in Serbia and the fact that local go-vernments have to rely largely on financing from direct and transferred public revenues. Drop in credit activities of banks, rise in bad debt, and extremely poor liquidity of economy dramatically impair economic recovery in Serbia. Use of limited and focused incentives to credit activity is justified and needed to prevent a drop in GDP during the process of fiscal consolidation. In the previo-us years, the Government of the Republic of Serbia paid subsidies on loans to reduce expenditures on interest payments and boost credit activity. This measure proved quite efficient because subsidies of RSD 4-5 billion lead to RSD 80 billion of granted loans. The Government decided to replace the program of subsidized loans with
the program of government guarantees on bank loans, and appropriated RSD 12 billion for this purpose. We think that these measures are a step back, from the as-pect of both credit activity impact and public expen-ditures. Government guarantees on loans cause moral hazard, which means that the banks will demand go-vernment guarantees on loans with above-average risk. Another problem is that the Guarantee Fund assets are not recognized as budget expenditures, meaning that real expenditures, and consequently the deficit, will be larger than projected by the amount of the repayment of the guaranteed debt.
Evaluation of some alternative measures for fiscal
consolidation
Statements that the government should not make sa-vings on wages and pensions or increase taxes, but that they should increase fiscal deficit to stimulate economy, could be heard in the public when the fiscal consoli-dation program was presented. We find such proposals utterly inappropriate and populist. These measures may be politically lucrative but they would lead to even larger drop in investments, economic activity, and to public debt crisis. Additionally, reduction in expenditures on interest payments through reduction in public debt, revenues from privatization and replacement of expensive credits with the cheap ones, are proposed as an alternative to savings on wages, pensions and subsidies and the tax increase. The data clearly show that savings from refi-nancing expensive loans by cheaper ones can bring only 5% reduction in fiscal deficit (in the following two ye-ars). We therefore find the statements that the budget can be balanced primarily by refinancing the expensi-ve credits with the cheaper ones, rather than through reduction in other current expenditures (wages, pensi-ons etc.), unfounded. Such analyses and claims impede the process of the public finance consolidation, because they are confusing to the public regarding the need for savings on wages, pensions, subsidies etc. As we wrote in the previous issue of the Quarterly Monitor, and the conditions under which the new issuance of euro-de-nominated bonds of the Republic of Serbia was done confirm this, refinancing of expensive credits by the cheaper ones under the market conditions is not possi-ble, but it can possibly be achieved through an inflow of considerable revenues from privatization or bilateral arrangements. Accordingly, possible arrangement of a cheaper loan with the UAE and/or considerable inflow of revenues from privatization totaling USD 2-3 billion would be positive, but it is still uncertain. These funds, if received, should be used to refinance the expensive
Hig
hlig
hts
65Quarterly Monitor No. 34 • July–September 2013
However, the extremely low inflow of FDI in Serbia since 2012 indicates a potential problem for the local economy from the standpoint of covering the current deficit, as well as considering the impact of FDI on the economic growth. Therefore, the question is whether the current poor inflow of FDI will continue in the coming period as well, which would be especially disconcerting having in mind both perspectives mentioned (balance of payments equilibrium and economic growth), what led to this (general factors or specific characteristics of Serbia and problems that the local economy is currently facing), and what are the possible solutions?
Graph 1. Serbia: Net FDI Inflow, 2001- Q3 2013
0
2
4
6
8
10
12
14
16
0
500
1000
1500
2000
2500
3000
3500
FDI (left scale) FDI/GDP (right scale)
in m
illio
ns o
f EU
R
in %
Source: NBS, QM.
Highlight 2. Low Inflow of Foreign Direct Investment: Regional Problem or a Specificity of Serbia? Mirjana Gligorić 1
This paper is going to compare the trends of foreign direct investment (FDI) in Serbia and the countries of Central and Eastern Europe (CEE) in the period 2001-2012. Even though the analysis covers the entire stated period, the focus of the analysis will be the trends of FDI during the crisis period and especially in the last two years. The latest period is especially analysed from the standpoint of the impact of subsidies on the FDI inflow. During 2012 and in the first nine months of 2013, in-flow of FDI in Serbia have significantly declined com-pared to the previous inflow levels, especially in the pe-riod before the crisis. That is why the focus of this paper is to examine to what extent this phenomenon is specific to Serbia and to what extent it is characteristic of coun-tries in the region and CEE. Graph 1 shows that FDI in Serbia have recorded significant amounts since 2001 (in 2006 they reached 14.4% of GDP). Also, the Graph shows that the FDI inflows have had a downward trend since the beginning of the global crisis, as well as that this trend was stopped in 2011, which means that even after the crisis, although reduced, the average FDI were for the most part kept at a solid level until the end of 2011 (average value of FDI inflow from 2009 to 2011 was 4.5% of GDP).
1 Faculty of Economics, Belgrade
credits or to cover the current fiscal deficit, depending on the difference between the current interest rates and the highest interest rates under which the earlier loans were granted. Claims that electronic control of fiscal receipt issuing will bring in additional tax revenues of highly unreali-stic EUR 1 billion lead to confusion as to whether the savings proposed in the fiscal consolidation program are necessary. Such statements made by government repre-sentatives cause confusion not only among the decision makers but also among the public. Although the re-presentatives of the Tax Administration probably have no intention of causing confusion, by these hasty state-ments they send a message that the proposed savings
on wages, pensions and subsidies etc. are not necessary, because simply introduction of modern fiscal cash regi-sters can bring EUR 1 billion increase in tax revenues.
Literature:
– European Economic Forecast, Autumn 2013 (2013), European Commission, Brussels– Fiscal Strategy for 2014 with the projections for 2015 and 2016, Ministry of Finance of the Republic of Ser-bia, Belgrade, 2013 – Evaluation of the Fiscal Strategy 2014-2016 and draft 2014 Budget, Fiscal Council, Belgrade, 2013
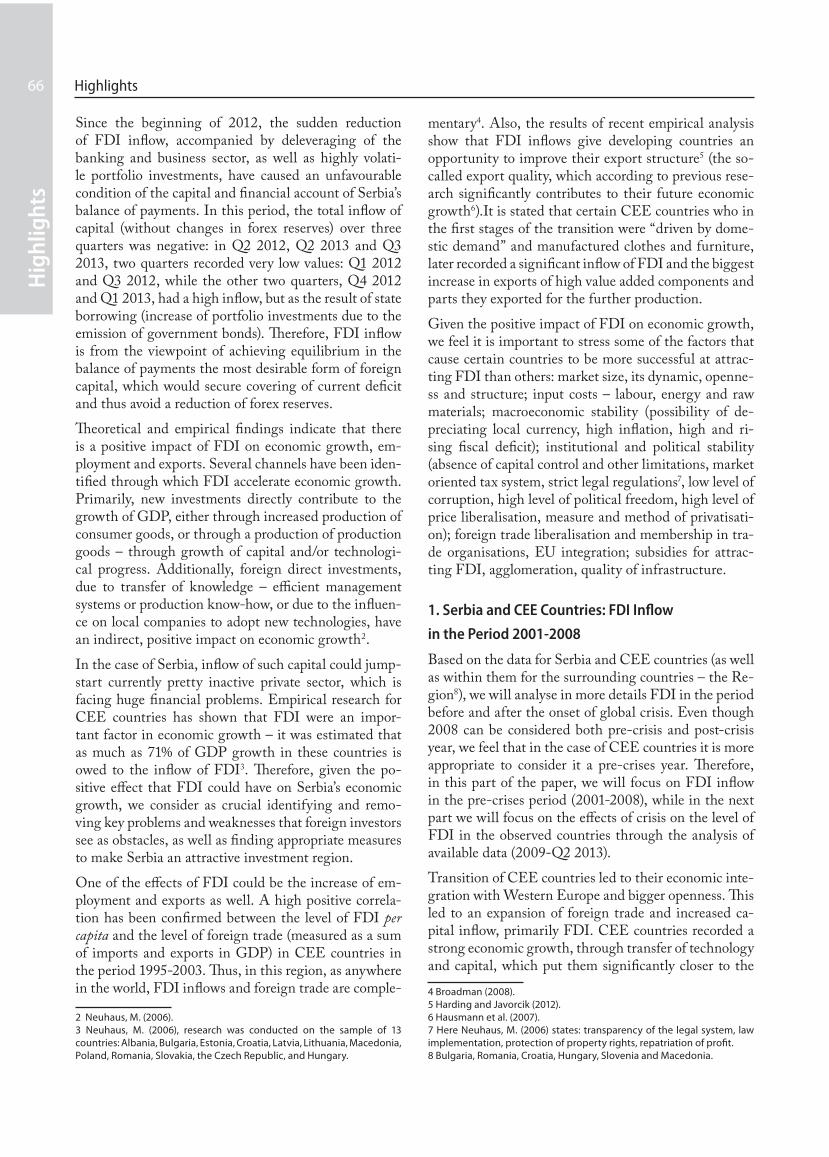
Hig
hlig
hts
Highlights66
Since the beginning of 2012, the sudden reduction of FDI inflow, accompanied by deleveraging of the banking and business sector, as well as highly volati-le portfolio investments, have caused an unfavourable condition of the capital and financial account of Serbia’s balance of payments. In this period, the total inflow of capital (without changes in forex reserves) over three quarters was negative: in Q2 2012, Q2 2013 and Q3 2013, two quarters recorded very low values: Q1 2012 and Q3 2012, while the other two quarters, Q4 2012 and Q1 2013, had a high inflow, but as the result of state borrowing (increase of portfolio investments due to the emission of government bonds). Therefore, FDI inflow is from the viewpoint of achieving equilibrium in the balance of payments the most desirable form of foreign capital, which would secure covering of current deficit and thus avoid a reduction of forex reserves. Theoretical and empirical findings indicate that there is a positive impact of FDI on economic growth, em-ployment and exports. Several channels have been iden-tified through which FDI accelerate economic growth. Primarily, new investments directly contribute to the growth of GDP, either through increased production of consumer goods, or through a production of production goods – through growth of capital and/or technologi-cal progress. Additionally, foreign direct investments, due to transfer of knowledge – efficient management systems or production know-how, or due to the influen-ce on local companies to adopt new technologies, have an indirect, positive impact on economic growth2.In the case of Serbia, inflow of such capital could jump-start currently pretty inactive private sector, which is facing huge financial problems. Empirical research for CEE countries has shown that FDI were an impor-tant factor in economic growth – it was estimated that as much as 71% of GDP growth in these countries is owed to the inflow of FDI3. Therefore, given the po-sitive effect that FDI could have on Serbia’s economic growth, we consider as crucial identifying and remo-ving key problems and weaknesses that foreign investors see as obstacles, as well as finding appropriate measures to make Serbia an attractive investment region. One of the effects of FDI could be the increase of em-ployment and exports as well. A high positive correla-tion has been confirmed between the level of FDI per capita and the level of foreign trade (measured as a sum of imports and exports in GDP) in CEE countries in the period 1995-2003. Thus, in this region, as anywhere in the world, FDI inflows and foreign trade are comple-
2 Neuhaus, M. (2006).3 Neuhaus, M. (2006), research was conducted on the sample of 13 countries: Albania, Bulgaria, Estonia, Croatia, Latvia, Lithuania, Macedonia, Poland, Romania, Slovakia, the Czech Republic, and Hungary.
mentary4. Also, the results of recent empirical analysis show that FDI inflows give developing countries an opportunity to improve their export structure5 (the so-called export quality, which according to previous rese-arch significantly contributes to their future economic growth6).It is stated that certain CEE countries who in the first stages of the transition were “driven by dome-stic demand” and manufactured clothes and furniture, later recorded a significant inflow of FDI and the biggest increase in exports of high value added components and parts they exported for the further production. Given the positive impact of FDI on economic growth, we feel it is important to stress some of the factors that cause certain countries to be more successful at attrac-ting FDI than others: market size, its dynamic, openne-ss and structure; input costs – labour, energy and raw materials; macroeconomic stability (possibility of de-preciating local currency, high inflation, high and ri-sing fiscal deficit); institutional and political stability (absence of capital control and other limitations, market oriented tax system, strict legal regulations7, low level of corruption, high level of political freedom, high level of price liberalisation, measure and method of privatisati-on); foreign trade liberalisation and membership in tra-de organisations, EU integration; subsidies for attrac-ting FDI, agglomeration, quality of infrastructure.
1. Serbia and CEE Countries: FDI Inflow
in the Period 2001-2008
Based on the data for Serbia and CEE countries (as well as within them for the surrounding countries – the Re-gion8), we will analyse in more details FDI in the period before and after the onset of global crisis. Even though 2008 can be considered both pre-crisis and post-crisis year, we feel that in the case of CEE countries it is more appropriate to consider it a pre-crises year. Therefore, in this part of the paper, we will focus on FDI inflow in the pre-crises period (2001-2008), while in the next part we will focus on the effects of crisis on the level of FDI in the observed countries through the analysis of available data (2009-Q2 2013).Transition of CEE countries led to their economic inte-gration with Western Europe and bigger openness. This led to an expansion of foreign trade and increased ca-pital inflow, primarily FDI. CEE countries recorded a strong economic growth, through transfer of technology and capital, which put them significantly closer to the 4 Broadman (2008).5 Harding and Javorcik (2012).6 Hausmann et al. (2007).7 Here Neuhaus, M. (2006) states: transparency of the legal system, law implementation, protection of property rights, repatriation of profit.8 Bulgaria, Romania, Croatia, Hungary, Slovenia and Macedonia.
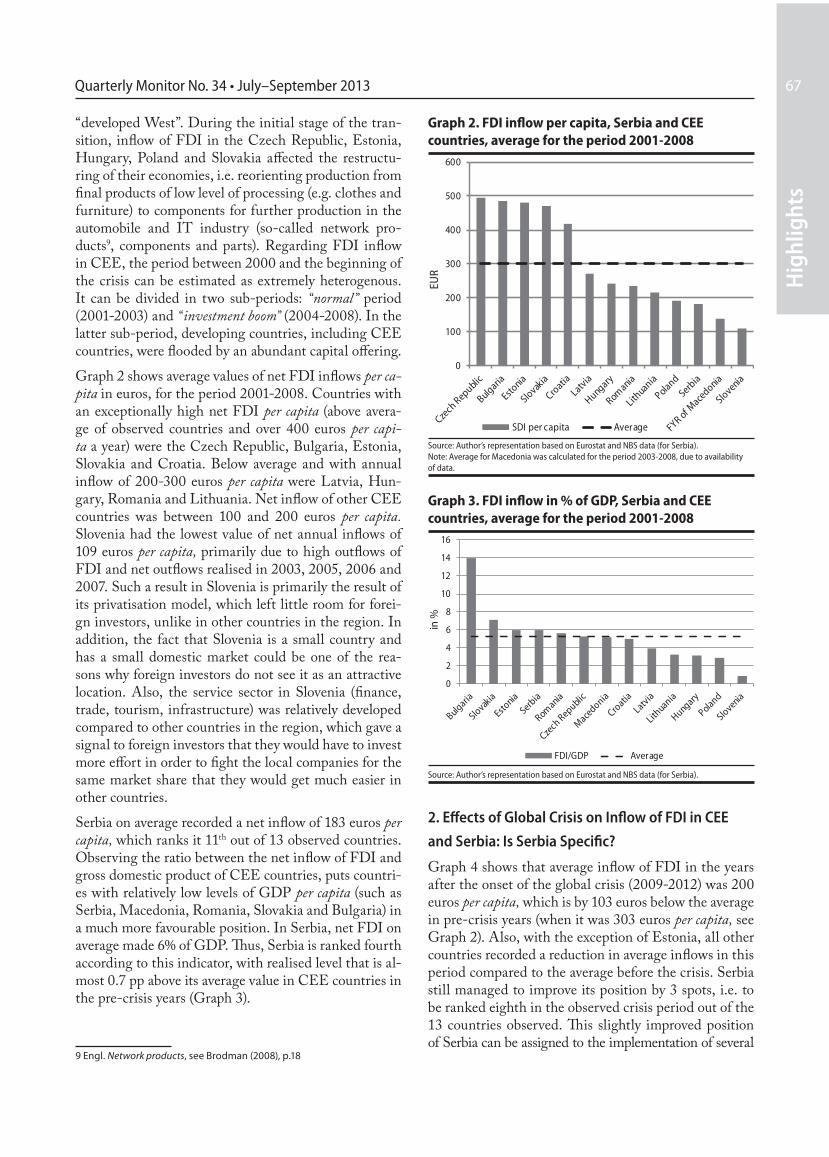
Hig
hlig
hts
67Quarterly Monitor No. 34 • July–September 2013
Graph 2. FDI inflow per capita, Serbia and CEE countries, average for the period 2001-2008
0
100
200
300
400
500
600
SDI per capita AverageEU
RSource: Author’s representation based on Eurostat and NBS data (for Serbia). Note: Average for Macedonia was calculated for the period 2003-2008, due to availability of data.
Graph 3. FDI inflow in % of GDP, Serbia and CEE countries, average for the period 2001-2008
0
2
4
6
8
10
12
14
16
FDI/GDP Average
in %
Source: Author’s representation based on Eurostat and NBS data (for Serbia).
2. Effects of Global Crisis on Inflow of FDI in CEE
and Serbia: Is Serbia Specific?
Graph 4 shows that average inflow of FDI in the years after the onset of the global crisis (2009-2012) was 200 euros per capita, which is by 103 euros below the average in pre-crisis years (when it was 303 euros per capita, see Graph 2). Also, with the exception of Estonia, all other countries recorded a reduction in average inflows in this period compared to the average before the crisis. Serbia still managed to improve its position by 3 spots, i.e. to be ranked eighth in the observed crisis period out of the 13 countries observed. This slightly improved position of Serbia can be assigned to the implementation of several
“developed West”. During the initial stage of the tran-sition, inflow of FDI in the Czech Republic, Estonia, Hungary, Poland and Slovakia affected the restructu-ring of their economies, i.e. reorienting production from final products of low level of processing (e.g. clothes and furniture) to components for further production in the automobile and IT industry (so-called network pro-ducts9, components and parts). Regarding FDI inflow in CEE, the period between 2000 and the beginning of the crisis can be estimated as extremely heterogenous. It can be divided in two sub-periods: “normal” period (2001-2003) and “ investment boom” (2004-2008). In the latter sub-period, developing countries, including CEE countries, were flooded by an abundant capital offering. Graph 2 shows average values of net FDI inflows per ca-pita in euros, for the period 2001-2008. Countries with an exceptionally high net FDI per capita (above avera-ge of observed countries and over 400 euros per capi-ta a year) were the Czech Republic, Bulgaria, Estonia, Slovakia and Croatia. Below average and with annual inflow of 200-300 euros per capita were Latvia, Hun-gary, Romania and Lithuania. Net inflow of other CEE countries was between 100 and 200 euros per capita. Slovenia had the lowest value of net annual inflows of 109 euros per capita, primarily due to high outflows of FDI and net outflows realised in 2003, 2005, 2006 and 2007. Such a result in Slovenia is primarily the result of its privatisation model, which left little room for forei-gn investors, unlike in other countries in the region. In addition, the fact that Slovenia is a small country and has a small domestic market could be one of the rea-sons why foreign investors do not see it as an attractive location. Also, the service sector in Slovenia (finance, trade, tourism, infrastructure) was relatively developed compared to other countries in the region, which gave a signal to foreign investors that they would have to invest more effort in order to fight the local companies for the same market share that they would get much easier in other countries. Serbia on average recorded a net inflow of 183 euros per capita, which ranks it 11th out of 13 observed countries. Observing the ratio between the net inflow of FDI and gross domestic product of CEE countries, puts countri-es with relatively low levels of GDP per capita (such as Serbia, Macedonia, Romania, Slovakia and Bulgaria) in a much more favourable position. In Serbia, net FDI on average made 6% of GDP. Thus, Serbia is ranked fourth according to this indicator, with realised level that is al-most 0.7 pp above its average value in CEE countries in the pre-crisis years (Graph 3).
9 Engl. Network products, see Brodman (2008), p.18

Hig
hlig
hts
Highlights68
large investments, primarily FAS and NIS. Aside from the investment projects related to these two companies, the especially high level of net FDI in Serbia in 2011 is also owed to the sale of “Delta Maxi”. On the other hand, the amount of FDI in Serbia in 2012 can be cha-racterised as specifically low (which is primarily the re-sult of FDI outflows due to repurchasing of “Telekom Srbija” stocks from the Greek telecoms company OTE and withdrawal of part of the Telenor capital, along with low inflow of FDI).
Graph 4. FDI inflow per capita, Serbia and CEE coun-tries, average for the period 2009-2012
0
100
200
300
400
500
600
SDI per capita Average
EUR
Source: Author’s representation based on Eurostat and NBS data (for Serbia).
Graph 5. FDI inflow in % of GDP, Serbia and CEE coun-tries, average for the period 2009-2012
0
1
2
3
4
5
6
FDI/GDP Average
in %
Source: Author’s representation based on Eurostat and NBS data (for Serbia).
Also, similar conclusions can be made if we observed the net inflow of FDI as % of GDP for Serbia and CEE countries in the period 2009-2012 (Graph 5). Average value of FDI share in GDP is 2.34%, which is by 2.9 pp below the average for the pre-crisis period. Despite the
significantly low inflow of FDI compared to the period before the crisis, Serbia is ranked third after the crisis in the observed group of countries. If we compare net inflow of FDI per capita and share of net inflow of FDI in GDP for Serbia and for the ave-rage of surrounding countries (the Region), as well as all CEE countries in the period 2001-2012, we can see that the inflow trend in Serbia was very similar to the trend in two observed groups (CEE and the Region, see Graph 6 and Graph 7). There is a notable increase of net FDI before the crisis, accompanied by their decrease in the crisis period and especially low values since the be-ginning of 2013. Assuming the recorded values of net FDI per capita remain at the same level until the end of 2013, it is our estimate that their “low” level in Serbia will probably be above average of CEE countries and especially the countries in the Region, which recorded a net outflow in the first half of the year. Graph 7 shows a notable decrease of FDI since the beginning of the year, i.e. pronounced net outflow of FDI realised in the countries of the Region and CEE in Q2 2013. Therefore, the insight into data for FDI per capita and FDI/GDP (Graph 6 and Graph 7) indicates that the in-flow of FDI in Serbia in the years since the beginning of the crisis (with the exception of particularly low level in 2012) has been quite in line with the trends in compa-rable countries. Additionally available data suggest that a modest level of FDI in Serbia in 2012 and first half of 2013 is not a specificity of the local economy, but rather the result of unfavourable trend present in the Region and CEE countries.
Graph 6. Net inflow of FDI per capita, average for the countries of CEE, the Region and Serbia, 2001-2013
-100
0
100
200
300
400
500
600
2001 2002 2003 2004 2005 2006 2007 2008 2009 2010 2011 2012 2013*
CEECRegionSerbia
3 per. Mov. Avg. (CEEC)3 per. Mov. Avg. (Region)3 per. Mov. Avg. (Serbia)
inEU
R
Source: Author’s representation based on Eurostat and NBS data (for Serbia). Note: 1) QM estimate for 2013 (calculated as double value of net inflow from the first half of the year). 2) CEE: Bulgaria, the Czech Republic, Estonia, Croatia, Latvia, Lithuania, Hungary, Poland, Romania, Slovenia, Slovakia, Macedonia; Region: Bulgaria, Croatia, Hungary, Romania, Slovenia, Macedonia.3) Net outflows were recorded in 2003, 2005, 2006, 2007 in Slovenia, 2009 in Lithuania, Slo-venia and Slovakia, in Q1 2013 in Estonia, Slovenia and Slovakia, and in Q2 2013 in Croatia, Lithuania, Poland, Hungary, Slovenia and Slovakia.
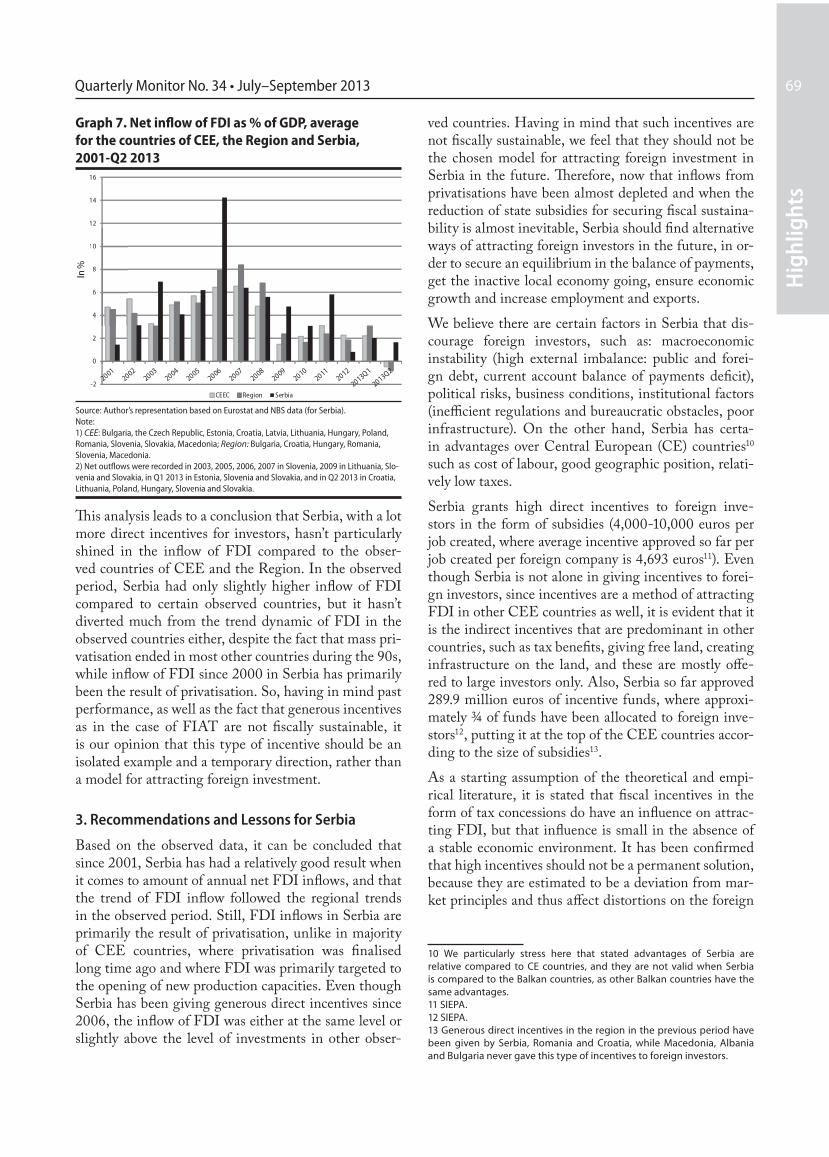
Hig
hlig
hts
69Quarterly Monitor No. 34 • July–September 2013
ved countries. Having in mind that such incentives are not fiscally sustainable, we feel that they should not be the chosen model for attracting foreign investment in Serbia in the future. Therefore, now that inflows from privatisations have been almost depleted and when the reduction of state subsidies for securing fiscal sustaina-bility is almost inevitable, Serbia should find alternative ways of attracting foreign investors in the future, in or-der to secure an equilibrium in the balance of payments, get the inactive local economy going, ensure economic growth and increase employment and exports. We believe there are certain factors in Serbia that dis-courage foreign investors, such as: macroeconomic instability (high external imbalance: public and forei-gn debt, current account balance of payments deficit), political risks, business conditions, institutional factors (inefficient regulations and bureaucratic obstacles, poor infrastructure). On the other hand, Serbia has certa-in advantages over Central European (CE) countries10 such as cost of labour, good geographic position, relati-vely low taxes. Serbia grants high direct incentives to foreign inve-stors in the form of subsidies (4,000-10,000 euros per job created, where average incentive approved so far per job created per foreign company is 4,693 euros11). Even though Serbia is not alone in giving incentives to forei-gn investors, since incentives are a method of attracting FDI in other CEE countries as well, it is evident that it is the indirect incentives that are predominant in other countries, such as tax benefits, giving free land, creating infrastructure on the land, and these are mostly offe-red to large investors only. Also, Serbia so far approved 289.9 million euros of incentive funds, where approxi-mately ¾ of funds have been allocated to foreign inve-stors12, putting it at the top of the CEE countries accor-ding to the size of subsidies13.As a starting assumption of the theoretical and empi-rical literature, it is stated that fiscal incentives in the form of tax concessions do have an influence on attrac-ting FDI, but that influence is small in the absence of a stable economic environment. It has been confirmed that high incentives should not be a permanent solution, because they are estimated to be a deviation from mar-ket principles and thus affect distortions on the foreign
10 We particularly stress here that stated advantages of Serbia are relative compared to CE countries, and they are not valid when Serbia is compared to the Balkan countries, as other Balkan countries have the same advantages. 11 SIEPA.12 SIEPA.13 Generous direct incentives in the region in the previous period have been given by Serbia, Romania and Croatia, while Macedonia, Albania and Bulgaria never gave this type of incentives to foreign investors.
Graph 7. Net inflow of FDI as % of GDP, average for the countries of CEE, the Region and Serbia, 2001-Q2 2013
-2
0
2
4
6
8
10
12
14
16
CEEC Region Serbia
4
6
8
10
In %
Source: Author’s representation based on Eurostat and NBS data (for Serbia). Note: 1) CEE: Bulgaria, the Czech Republic, Estonia, Croatia, Latvia, Lithuania, Hungary, Poland, Romania, Slovenia, Slovakia, Macedonia; Region: Bulgaria, Croatia, Hungary, Romania, Slovenia, Macedonia.2) Net outflows were recorded in 2003, 2005, 2006, 2007 in Slovenia, 2009 in Lithuania, Slo-venia and Slovakia, in Q1 2013 in Estonia, Slovenia and Slovakia, and in Q2 2013 in Croatia, Lithuania, Poland, Hungary, Slovenia and Slovakia.
This analysis leads to a conclusion that Serbia, with a lot more direct incentives for investors, hasn’t particularly shined in the inflow of FDI compared to the obser-ved countries of CEE and the Region. In the observed period, Serbia had only slightly higher inflow of FDI compared to certain observed countries, but it hasn’t diverted much from the trend dynamic of FDI in the observed countries either, despite the fact that mass pri-vatisation ended in most other countries during the 90s, while inflow of FDI since 2000 in Serbia has primarily been the result of privatisation. So, having in mind past performance, as well as the fact that generous incentives as in the case of FIAT are not fiscally sustainable, it is our opinion that this type of incentive should be an isolated example and a temporary direction, rather than a model for attracting foreign investment.
3. Recommendations and Lessons for Serbia
Based on the observed data, it can be concluded that since 2001, Serbia has had a relatively good result when it comes to amount of annual net FDI inflows, and that the trend of FDI inflow followed the regional trends in the observed period. Still, FDI inflows in Serbia are primarily the result of privatisation, unlike in majority of CEE countries, where privatisation was finalised long time ago and where FDI was primarily targeted to the opening of new production capacities. Even though Serbia has been giving generous direct incentives since 2006, the inflow of FDI was either at the same level or slightly above the level of investments in other obser-

Hig
hlig
hts
Highlights70
Literature:
Balasubramanyam, V. N. (2001) Foreign Direct Inves-tment in Developing Countries: Determinants and Impact. Presented at the OECD Global Forum on International Investment: New Horizons and Policy Challenges for Foreign Direct Investment in the 21st Century, 26-27 November 2001, Mexico.Broadman, H. G. (2005), From disintegration to reinte-gration - Eastern Europe and the former Soviet Union in international trade, Washington, DC: WorldBank.Harding, T. and B. S. Javorcik (2012), “Foreign Direct In-vestment and Export Upgrading”, The Review of Economics and Statistics, Vol. 94, No. 4, 964-980
Hausmann, R., Hwang, J. and D. Rodrik (2007), “What You Export Matters”,Journal of Economic Growth, Vol. 12, No.1, 1–25.
Neuhaus, M. (2006), The Impact of FDI on Economic Growth An Analysis for the Transition Countries of Central and Eastern Europe. Physica-VerlagHeidelberg, Gemany.
http://epp.eurostat.ec.europa.eu/portal/page/portal/sta-tistics/themeshttp://siepa.gov.rshttp://www.investslovenia.org/business-environment/fdi-in-slovenia/inward-investment-flows-stock/http://www.nbs.rs/internet/cirilica/80/index.html
Serbia, the current world economic crisis, bad economic environment, mistakes in economic policy, etc, did not affect the loss of jobs. Furthermore, from this claim follows that the reduction in the number of employees in companies that have not yet been privatized, as is the case of public companies or companies in restructuring, is caused by bad privatization!? Moreover, according to this logic a decrease in employment in the original pri-vate companies, which started with the beginning of the crisis, is attributed to the bad privatization!?
Highlight 3. Is Privatization First to Blame for Job Losses in Serbia?
Milojko Arsić 1
One criticism that is increasingly appearing in public refers to privatization as responsible for the loss of hun-dreds of thousands of jobs. According to some estimates privatization is responsible for loss of even 800 thou-sand jobs, which is approximately equal to total decrease in the number of jobs in the period between 1989 and 2013. Previously said implies, almost unbelievable cla-im, that bad privatization is solely responsible for the loss of jobs in Serbia, and that other factors such as the transitional recession, the collapse of the Yugoslavian market, the international sanctions, the bombing of
1 Faculty of Economics, University of Belgrade
capital market and reduction of efficiency14. We believe that the model of granting direct subsidies to foreign investors that Serbia is applying should be gradually abandoned, but making sure that business environment is improved at the same time, which primarily means reduction of costs and risks of doing business in Serbia. That is why Serbia should find alternative ways of attracting FDI, i.e. replace current costly incentives by a more attractive business environment for foreign inves-tments. If only subsidies are abolished, without imple-menting the reforms, FDI will decline. Reforms include improving business conditions, improving the efficiency of administration and judiciary, managing public finan-ces, and reducing the fiscal deficit and the public debt, upgrading infrastructure, reducing corruption. Whether or not a foreign investor decides to invest in a country depends on whether it is macroeconomically and politically stable, institutionally developed, market oriented, and open to foreign trade. Therefore, in order to make Serbia an attractive location for foreign inves-tments, a credible monetary and fiscal policy, a favou-rable business environment, which includes competitive domestic market, anti-monopoly regulations, transpa-rency of the legal system, implementation of the laws, protection of property rights, reduction of corruption, improvement of infrastructure, progress in European integrations, should be emphasised as priorities in the future development of Serbia, that would be based on healthy foundations.
14 Balasubramanyam (2001), p. 2 & 5.
Hig
hlig
hts
71Quarterly Monitor No. 34 • July–September 2013
en 1989 and 2001 productivity in the world grew since at that time the world was going through one of the most enduring expansions. Since the beginning of transition GDP in Serbia grows - cumulative growth in the period between 2000 and 2008 accumulated to 47% i.e. around 5% average per year. In the period of crises GDP in Serbia fell and so in 2012 it stood for about 2.5% below the level of 2008. Average growth rate in the whole period between 2000 and 2012 amounted to about 3% per year, which is sli-ghtly below the level of CEE countries (3.4%). If Serbia grew at an average rate as other CEE countries its cu-rrent level of development would be by about 5% higher.Since 2000 until now number of formal5 employees was reduced by 18%, or nearly 400.000. The largest decrease in employment happened in a period of economic crisis when the number of formally employed decreased by over 13%, or 270.000.6 The large decline in employment in the period of economic crisis is partly a consequence of the crisis while the other part is a consequence of the release of surplus workers in privatized companies. In the period between 2008 and 2012 unemployment rate in the EU increased by 3.4 percentage points, while in CEE countries the unemployment rate increased by 5.5 p.p. According to the Labour Force Survey the unem-ployment rate in Serbia in the period of crisis increased by 11 percentage points, but this decline contains highly un-credible evaluation of a fall in employment of indivi-dual farmers of about 100.000. Therefore, the corrected increase in the unemployment rate in the period betwe-en 2008 and 2012, which excludes the enormous decli-ne in the number of the employed individual farmers, would be between 8 and 9 p.p. Estimated increase in the unemployment rate of 8-9 p.p. in Serbia in the period of crisis is significantly higher than the average of the CEE countries and similar unemployment rate increase occurred only in Lithuania and Latvia.
5 While from the standpoint of the labor market and economic activities total employment is relevant, which besides formal includes agricultural producers as well as employed in the gray economy, from the point of privatization formal employment is relevant6 According to the Labour Force Survey, the number of formal and informal employment since the beginning of the crisis has been reduced by more than 400.000, but these results are suspicious because they contain the decline in employment in agriculture during the 2009 of nearly 100.000. It is obvious that the aforementioned decline in agricultural employment has not occurred, but that this is a consequence of certain methodological change as well as the changes in incentives for farmers to express their status. It is interesting that the increase in the number of formally unemployed and the number of unemployed by the survey is nearly identical and amounts to 270 and 275 thousand respectively - which further reinforces the suspicion that the number of employees, since the beginning of the crisis, fell by over 400.000.
To what extent is this claim absurd can best be noticed through a comparison of trends of the number of em-ployees, GDP and productivity. This method indicates when, and how many, jobs became uncompetitive i.e. when were jobs economically lost. This analysis is im-portant in the case of Serbia as legal restrictions and characteristics of state enterprises2 prevented real job lo-sses turn into formal employment decrease. Below we will present chronological sequence of events and pro-cesses which have influenced a significant reduction in real employment.In the period between 1990 and 1991, as a result of tran-sitional recession and a collapse of the integrated Yugo-slavian market, Serbia’s GDP fell for about 18% and employment by only 4%. As a consequence productivity fell for about 13% which means that at the level of pro-ductivity from 1989, which was not very high, Serbia’s GDP in 1991 could have been achieved with 300 thou-sand workers less. This means that except 150 thousand people which lost their jobs in the period between 1990 and 1991 further 300 thousand workers lost productive jobs but remained formally employed – which means that extremely large imbalance between formal and real employment emerged. In the period between 1992 and 1993, primarily as a consequence of the imposition of sanctions and par-tly due to the hyperinflation, Serbia’s GDP fell by as much as 50% while the number of employees decrea-sed by only 6%. Modest decline in employment despite the drastic drop in GDP was mainly a consequence of the adoption of decree which stated that dismissal of workers in the period of sanctions is forbidden. As a consequence of the discrepancy between the GDP trend and employment, productivity in the period between 1992 and 1993 declined by as much as 47%, which me-ans that at the level of productivity from 1989 GDP in 1993 could have been achieved with about 1.3 million employees, while the actual employment stood at 2.25 million. Thus in 1993 the number of unproductive, fic-tive, jobs reached almost 1.1 million.In the period between 1994 and 2001 GDP stagnated3 while the number of employees gradually decreased, mainly through retirement4. As a result of these proce-sses number of redundant employees in 2001 amounted to nearly 900,000, provided that productivity was at the level of 1989. It is relevant that the level of productivity in Serbia in 1989 was low and that in the period betwe-
2 A tendency of state enterprises to employ more workers than necessary exists for a long time, as well as a tendency to retain the accumulated surplus of workers in the company.3 Almost entire growth achieved between 1994 and 1998 was annulled with the GDP drop in 1999, which was a consequence of NATO bombarding. 4 Early retirement was at the time very common practice

Hig
hlig
hts
Highlights72
account productivity growth in the world during the pe-riod 1989-2012 the number of non-productive jobs in 2000 would amount to about 1.2 million, and using the same calculations even now there are hundreds of thou-sands of unproductive jobs in Serbia. Between 2000 and 2012 productivity in Serbia increased by 75%, of which about 70% is a consequence of the production growth and about 30% a consequence of the layoffs. Potential “responsibility” of the privatization could come down to the fact that new owners of the privati-zed companies have not made all unproductive jobs in their companies productive. However, it is almost im-possible to expect to make 900 thousand non-produc-tive jobs productive over a period of several years. If we would take into account that in 1989 there were some unproductive jobs in Serbia, and that in the meantime there was a strong growth of productivity in the world, we could conclude that the majority of jobs in Serbia in 2000 were unproductive. Almost all jobs in the sectors of exchangeable goods7 (industry, agriculture, etc.) have become unproductive, and that also means not competi-tive on the world market. In order to make existing jobs competitive investments of tens or perhaps hundreds of billions of Euros were needed, and to increase em-ployment even additional investments were necessary. It is certain that it was not possible to provide such inves-tments in the period 2001-2008, even without internal and external constraints. The beginning of the global economic crisis in 2008 further reduced the possibili-ties of Serbia to realize high investments, which were necessary in order to create new jobs and to preserve existing ones.
7 Productivity was preserved only in the services industry, such as education, health, etc, but the quality of services declined and so new investments in their modernization were necessary.
Graph 1
0.0
20.0
40.0
60.0
80.0
100.0
120.0
1989
1990
1991
1992
1993
1994
1995
1996
1997
1998
1999
2000
2001
2002
2003
2004
2005
2006
2007
2008
2009
2010
2011
2012
GDP and Employment trends (1989=100)
GDP Employment
Above average increase of the unemployment rate in Serbia is most likely a consequence of the elapsed time period in which the buyers of privatized companies were forbidden to release excess employees. Given that the pace of privatization was the fastest in the period between 2003 and 2005, start of the economic crisis overlapped with the expiration of the specified time li-mit for owners of privatized companies and therefore layoffs accelerated. However, from an economic point of view layoffs in that period were mainly the formalizati-on of the actual situation - that these jobs have become unproductive over the last two decades.Of the approximately 900 thousand non-productive jobs that existed in 2001 about 400.000 workers have lost their jobs or went into retirement, while about 400.000 workers were productively employed in privatized com-panies or in the original private sector, while around 100.000 jobs still remain unproductive. If we take into
0
200
400
600
800
1,000
1,200
1,400
1989
1991
1993
1995
1997
1999
2001
2003
2005
2007
2009
2011
thou
sand
s of
wor
kers
Surplus employees (productivity level from 1989)
0
20
40
60
80
100
120
1989
1990
1991
1992
1993
1994
1995
1996
1997
1998
1999
2000
2001
2002
2003
2004
2005
2006
2007
2008
2009
2010
2011
2012
Productivity trend (1989=100)
Graph 2.
Hig
hlig
hts
73Quarterly Monitor No. 34 • July–September 2013
A compelling majority of empirical research which exa-mine the results of privatization in Central and Eastern Europe suggest that privatization had positive or neu-tral influence on employment.8 Therefore, the question arises whether it is possible that only in Serbia privati-zation is main cause of the significant increase in unem-ployment? It should be also kept in mind that Serbia applied similar methods of privatization as other coun-tries in Central and Eastern Europe. Given that Serbia last entered the process of mass privatization she had at disposal the experience of other countries and has appli-ed methods which, in practice, proved to be most effec-tive. Therefore, it would be difficult to defend the view that the methods of privatization in Serbia were wea-ker than in other CEE countries. Another possibility is that commonly good methods of privatization were badly implemented in Serbia because of incompetence, corruption, etc. However, this explanation is not con-vincing because it is difficult to believe that the compe-tence of state administration was significantly lower and
8 A comprehensive review of the analysis which examines the effects of privatization on employment can be found in Estrin, S. at. all (2007)
the corruption higher in Serbia than in similar countri-es, such as Romania, Bulgaria and Croatia.Summarizing the above mentioned we estimate that the attribution of the majority of the lost jobs in Serbia in the period between 1990 and 2013 to privatization is deeply wrong, and that it is the consequences of delibe-rate or unintended omission of influence of other fac-tors, ranging from the breakup of the former Yugoslavia, through sanctions, to current economic crisis and mista-kes in economic policy and reforms.
Literature
1. Estrin, S. Hanousek, J., Kocenda, J i J. Svejnar (2007) “Efects of Privatization and Ownership in Transition Economics”, IPC, Working Paper No. 30
Highlight 4. Is Turkey Gaining in Economic Importance in the Southeastern Europe Region?
Borko Hanđiski, Lazar Šestović i Jovana Šljivančanin 1
Summary
Turkey is increasingly becoming an important market for SEE’s exporting firms. Exports from SEE to Tur-key have been rising faster than exports from the rest of the world, though their structure remained broadly the same. Intermediate goods continue to dominate SEE exports to Turkey with iron and steel products being the most important export precuts for these countries. The main driver of exports expansion to Turkey was increase in trade in products that were exported already. Between 2008 and 2012, additional USD 300 million of exports were generated from existing trade relationships, and about USD 170 million came from relationships that did not exist before. Imports from Turkey have mainta-ined a 3 percent share in total imports of SEE countries over the previous ten years.
1 This paper was written by Borko Handjiski (Senior Economist, AFTP2), Lazar Šestović (Senior Economist, ECSP2), and Jovana Šljivančanin (IMF).
Turkey invests abroad about USD 2.5 billion annually over the previous five years, of which only marginal share goes to the SEE region (around 3 percent). This represented about one percent of total inflow of FDI in the SEE. Preliminary data for 2012 show that capital inflows from Turkey fell even further to estimated USD 31 million. Even though Turkish investments in the SEE are relatively small, these are higher than Turkish investments in the EU New Member States and are increasing much faster than investments in other parts of Europe. In addition, recent Turkish investments in the banking sector, transport infrastructure and in me-tals industry could facilitate faster growth of trade over the medium-term.
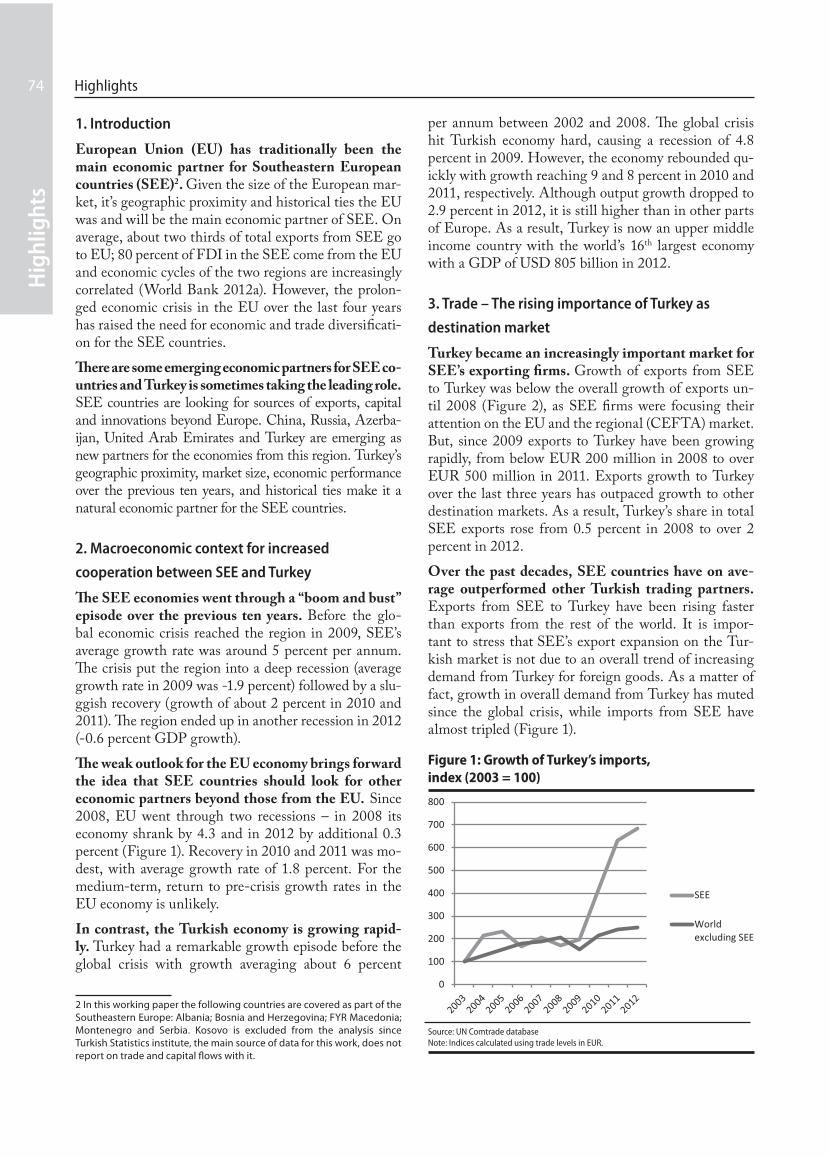
Hig
hlig
hts
Highlights74
per annum between 2002 and 2008. The global crisis hit Turkish economy hard, causing a recession of 4.8 percent in 2009. However, the economy rebounded qu-ickly with growth reaching 9 and 8 percent in 2010 and 2011, respectively. Although output growth dropped to 2.9 percent in 2012, it is still higher than in other parts of Europe. As a result, Turkey is now an upper middle income country with the world’s 16th largest economy with a GDP of USD 805 billion in 2012.
3. Trade – The rising importance of Turkey as
destination market
Turkey became an increasingly important market for SEE’s exporting firms. Growth of exports from SEE to Turkey was below the overall growth of exports un-til 2008 (Figure 2), as SEE firms were focusing their attention on the EU and the regional (CEFTA) market. But, since 2009 exports to Turkey have been growing rapidly, from below EUR 200 million in 2008 to over EUR 500 million in 2011. Exports growth to Turkey over the last three years has outpaced growth to other destination markets. As a result, Turkey’s share in total SEE exports rose from 0.5 percent in 2008 to over 2 percent in 2012.Over the past decades, SEE countries have on ave-rage outperformed other Turkish trading partners. Exports from SEE to Turkey have been rising faster than exports from the rest of the world. It is impor-tant to stress that SEE’s export expansion on the Tur-kish market is not due to an overall trend of increasing demand from Turkey for foreign goods. As a matter of fact, growth in overall demand from Turkey has muted since the global crisis, while imports from SEE have almost tripled (Figure 1).
Figure 1: Growth of Turkey’s imports, index (2003 = 100)
0
100
200
300
400
500
600
700
800
SEE
Worldexcluding SEE
Source: UN Comtrade databaseNote: Indices calculated using trade levels in EUR.
1. Introduction
European Union (EU) has traditionally been the main economic partner for Southeastern European countries (SEE)2. Given the size of the European mar-ket, it’s geographic proximity and historical ties the EU was and will be the main economic partner of SEE. On average, about two thirds of total exports from SEE go to EU; 80 percent of FDI in the SEE come from the EU and economic cycles of the two regions are increasingly correlated (World Bank 2012a). However, the prolon-ged economic crisis in the EU over the last four years has raised the need for economic and trade diversificati-on for the SEE countries.There are some emerging economic partners for SEE co-untries and Turkey is sometimes taking the leading role. SEE countries are looking for sources of exports, capital and innovations beyond Europe. China, Russia, Azerba-ijan, United Arab Emirates and Turkey are emerging as new partners for the economies from this region. Turkey’s geographic proximity, market size, economic performance over the previous ten years, and historical ties make it a natural economic partner for the SEE countries.
2. Macroeconomic context for increased
cooperation between SEE and Turkey
The SEE economies went through a “boom and bust” episode over the previous ten years. Before the glo-bal economic crisis reached the region in 2009, SEE’s average growth rate was around 5 percent per annum. The crisis put the region into a deep recession (average growth rate in 2009 was -1.9 percent) followed by a slu-ggish recovery (growth of about 2 percent in 2010 and 2011). The region ended up in another recession in 2012 (-0.6 percent GDP growth). The weak outlook for the EU economy brings forward the idea that SEE countries should look for other economic partners beyond those from the EU. Since 2008, EU went through two recessions – in 2008 its economy shrank by 4.3 and in 2012 by additional 0.3 percent (Figure 1). Recovery in 2010 and 2011 was mo-dest, with average growth rate of 1.8 percent. For the medium-term, return to pre-crisis growth rates in the EU economy is unlikely. In contrast, the Turkish economy is growing rapid-ly. Turkey had a remarkable growth episode before the global crisis with growth averaging about 6 percent
2 In this working paper the following countries are covered as part of the Southeastern Europe: Albania; Bosnia and Herzegovina; FYR Macedonia; Montenegro and Serbia. Kosovo is excluded from the analysis since Turkish Statistics institute, the main source of data for this work, does not report on trade and capital flows with it.

Hig
hlig
hts
75Quarterly Monitor No. 34 • July–September 2013
a result of rapidly growing exports of iron and steel, and oil. All SEE countries have witnessed a surge in exports of iron and steel since 2009. The growth of other export products has been more gradual. After iron and oil, the most important export groups are rubber, hides and skins, paper, machinery and mechanical equipment, and wheat.Iron and steel products3 were, on average, the most exported commodities from SEE to Turkey between 2003 and 2012 (Figure 3). They have been the dominant export commodities in Macedonia’s exports every year, and for Albania, Montenegro and Serbia almost every year over the past decade. BiH entry to the Turkish iron and steel market came much later: iron and steel became its top export category to Turkey only in 2011.
Figure 3: SEE’s exports to Turkey: Iron and steel vs. other products (in 000 EUR)
0
50000
100000
150000
200000
250000
300000
350000
400000
450000
2003 2004 2005 2006 2007 2008 2009 2010 2011 2012
Every�ng else
72
Source: UN Comtrade database
Who is exporting from the SEE region?
The big boost in exports over the past few years has come mostly from existing trade relationships, i.e. exporting more of the same products to the same co-untries. In the case of SEE and Turkey, however, it is important to note that new relationships have been
3 Article 72 in HS2002 nomenclature.
Trade with Turkey has deepened for all SEE coun-tries over the past decade, though at a different pace. Albania’s exports have risen the fastest, followed by Montenegro’s, partly owing to low starting point. In the other countries, export growth has been significant as well, including for Serbia which started from the rela-tively higher level (its export increased six fold over the previous ten years). FYR Macedonia’s exports recorded the slowest growth.
What is the structure of trade?
Exports from SEE to Turkey increased multifold between 2009 and 2011, but their structure remai-ned broadly the same. In terms of the type of product by stage of production, intermediate goods continue to dominate SEE exports to Turkey, accounting for more than half of total exports (Figure 2). Raw materials and consumer goods follow with more or less the same sha-res of around 1/4 of the total, while consumer goods are gaining in importance. Exports of capital goods have been historically marginal, although there was some increase in 2012 but it remains to be seen if it is susta-inable. Looking at export structure by product type, indu-strial products dominate. The share of agriculture exports has been stable and low. In 2011, oil exports rose substantially, after Serbia’s oil company NIS re-started some of its refineries. There are some variati-ons, however, across the countries. Over 90 percent of Montenegro’s exports and more than half of BiH’s come
from raw materials. BiH has a significant share of agri-culture exports, while Serbia is the only country that sells oil to Turkey (Figure 2).SEE exports to Turkey are becoming more concentra-ted. Since 2009, exports have become more concentra-ted: the top ten two-digit HS categories accounted for 84 percent of total exports in 2012. This trend comes as
Figure 2: SEE’s exports to Turkey, by product category (HS 2002 classification1 )
0
50000
100000
150000
200000
250000
300000
350000
400000
450000
2007 2008 2009 2010 2011 2012
Capital goods
Consumer goods
Intermediate goods
Raw materials
0
100000
200000
300000
400000
500000
600000
2007 2008 2009 2010 2011 2012
WTO H2 Oil Petroleum
WTO H2 Industrial
WTO H2 Agricultural
Source: UN Comtrade database

Hig
hlig
hts
Highlights76
significant as well. Between 2008 and 2012, additio-nal USD 300 million of exports were generated from existing trade relationships, and about USD170 million came from relationships that did not exist before. In pa-rallel, the volume of extinct relationships (products no longer being exported from a SEE country to Turkey) was below USD 30 million.From Turkey’s perspective, the importance of the SEE region as a trading partner has somewhat risen over the past few years. Exports to SEE rose sharply between 2006 and 2008, and then witnessed a sharp fall in 2009, but have continued to grow faster than exports to other partners. Nevertheless, the SEE mar-ket is not of high importance for Turkish exporters. Turkey’s exports in total reached EUR 120 billion in 2012, of which almost 40 percent went to the EU. On the other hand, the SEE market absorbs about 1 percent of Turkey’s exports. The structure of SEE imports from turkey remained unchanged before and after the global economic cri-sis. SEE countries import mostly consumer goods from Turkey as well as some intermediary products (Figure 4). The share of raw materials imports is below 10 percent. Industrial products account for the majority of imports, while imports of agriculture products and petroleum are marginal. The structure of imports is similar across the region, with the exception that Macedonia and Serbia have higher share of imports of intermediate goods.
4. Capital Flows from Turkey to SEE region
Although Turkey is not a major global investor, Turkish investments abroad are increasing steadily. As Turkish economy is growing rapidly, investments abroad are also increasing. Starting from just 0.1 per-cent of GDP in early 2000s, outward investment rose five-fold to 0.5 percent of GDP in 2012 (and ten-fold
in nominal terms). Still, Turkey’s outward investment remains small in global comparison.Turkish companies mainly invest in other European countries. Nearly two thirds of the total FDI outflow4 relates to investments in Europe, and then comes Asia (on average 25 percent of total outflows) and North America (6 percent of the total). When investing in European Union, Turkish companies almost exclusively focus on “old” member states of the EU (EU15).Turkish investors primarily invest in industry. More than half (55 percent) of the Turkish investments abroad over the past decade have been in industry. Remaining 45 percent went into services sectors, while negligi-ble amounts have gone into agriculture sector of other countries5. Within industry, nearly ¾ of investments abroad go to manufacturing (food and oil industry, in particular). Within services, Turkish investors are pri-marily looking for opportunities in the financial sector, transport, and real estate services.
Turkish Investments in the SEE
Turkish investments in the SEE are still relatively low, but have been on the rise over the previous couple of years. In nominal terms, Turkish investments in the SEE amounted about USD 58 million, annually, over the previous five years, 2007-2011 (Table 1). This was just over 1 percent of total FDI in the region. However, Turkish investments in this region have increased over time, from practically nonexistent to a peak of USD 97 million, in 2011. The maximum share of Turkish inves-tments in total FDI was in 2010 when these reached 2.2 percent of total FDI in the region. In 2012, according to preliminary data, there was a reverse in this trend when FDI from Turkey dropped to just USD 31 million.
4 Average 2007-2011. Source OECD.5 Annually about USD 8 million.
Figure 4: SEE’s imports from Turkey, by product category (HS 2002 classification)
0
200000
400000
600000
800000
1000000
1200000
1400000
1600000
2007 2008 2009 2010 2011 2012
Naftni derivati (WTO H2)
Industrijski proizvodi(WTO H2)
Poljoprivredni proizvodi(WTO H2)
0
200000
400000
600000
800000
1000000
1200000
2007 2008 2009 2010 2011 2012
kapitalni proizvodi
Proizvodi za širokupotrosnju
Međufazni proizvodi
Sirovine
Source: UN Comtrade database1) HS stands for Harmonized Systems which is an international nomenclature for the classification of products. It allows participating countries to classify traded goods on a common basis for customs purposes.

Hig
hlig
hts
77Quarterly Monitor No. 34 • July–September 2013
The real impact of Turkish investments on SEE eco-nomies might be underestimated. Official statistics, as represented in the Balance of Payments and reported here, shows only a flow of capital to be used as a sha-reholders’ equity in new projects. However, majority of investments are financed through banks’ or intra-com-pany loans. Therefore, once the amounts secured throu-gh loans are added, the actual impact of Turkish inves-tments on host economies is certainly much higher. In particular this is the case for countries in which Turkish banks operate – like Bosnia and Albania. Most of the Turkish investments in the SEE region went to Bosnia and Herzegovina and Macedonia. Since 2001, Turkey invested USD 309 million in the SEE, of which USD 137 million went to Bosnia and Herzegovina, while USD 82 million went to Macedo-nia (Table 2). This represents around 70 percent of total Turkish investments in the region – Bosnia accounts for 44 and Macedonia for 26 percent of the total stock of investments. However, once the country data is adjusted for the differences in the size of population it turns out that Turkish investments were most important for Ma-cedonia and least important for Serbia. Over time Turkish investments have gained impor-tance for all SEE countries except for Albania. Before the start of the international financial crisis (2001-2008)
Turkish investments accounted for a negligible 0.3 per-cent of the total inflow of investments in the SEE. However, its share increased to a much more significant 4.1 percent between 2009 and 2011. Turkey gained im-portance in Bosnia and Herzegovina and Macedonia, in particular. In Bosnia, Turkey accounted for 13.5 percent of all investments over that period. On the other hand, Turkey is losing in importance as an investor in Albania (its share in total FDI inflow halved in recent years). For Montenegro and Serbia, importance of Turkey among other investors remains broadly stable over the observed period.
Was 2012 a turning point?
Preliminary data for 2012 point to a significant drop of Turkish investment in SEE. Turkish businesses in-vested only USD 31 million in the SEE. This is a major drop compared to previous year since FDI from Turkey stood at just one-third of the previous year’s level. This is also in stark contrast to a general trend that Turkey increases investments abroad. As mentioned Turkish investments abroad in 2012 reach an estimated USD 4.3 billion which is a historical record high level. Macedonia and Bosnia recorded the highest loss of Turkish investor appetite. These two countries, otherwise the most common destination for Turkish
Table 2: Turkish investments per country, USD million
2001 2002 2003 2004 2005 2006 2007 2008 2009 2010 2011 Total
Albania 0.0 0.0 0.0 0.0 3.0 0.0 27.0 3.0 0.0 3.0 5.0 41.0
BiH 0.0 0.0 0.0 6.0 9.0 1.0 6.0 10.0 22.0 61.0 22.0 137.0
Macedonia, FYR 0.0 0.0 0.0 0.0 0.0 1.0 1.0 1.0 2.0 7.0 70.0 82.0
Montenegro 0.0 0.0 0.0 0.0 0.0 0.0 2.0 4.0 0.0 4.0 0.0 10.0
Serbia 0.0 0.0 0.0 0.0 0.0 0.0 11.0 22.0 3.0 3.0 0.0 39.0
Total 0.0 0.0 0.0 6.0 12.0 2.0 47.0 40.0 27.0 78.0 97.0 309.0Source: OECD
Table 3: Turkish outward FDI in 2012 (USD million)
Albania BiH Montenegro FYRoM Serbia Total SEE Europe World
Total 5 7 0 12 7 31 3,501 4,333
Table 1: Total and Turkish investments in the SEE, USD million
2001 2002 2003 2004 2005 2006 2007 2008 2009 2010 2011
Total FDI in SEE 967 1,063 2,085 2,402 3,040 6,402 7,835 6,525 4,899 3,595 5,226
o/w from Turkey 0 0 0 6 12 2 47 40 27 78 97
TK investments as % of the total 0.0 0.0 0.0 0.2 0.4 0.0 0.6 0.6 0.6 2.2 1.9
Source: OECD and WB staff estimates
Hig
hlig
hts
Highlights78
investments in the SEE region, saw a drop in Turkish investments (compared to 2011) by 82 and 68 percent, respectively. Investments in Albania and Montenegro remained flat, while Serbia managed to attract slightly more investments from Turkey than in previous years, though these are still are the negligible level of USD 7 million (Table 3).
5. Conclusions
Turkey is increasingly important for the SEE regi-on. Turkey, in contrast to much of the rest of Europe, has had a successful decade, and its economic outlook is positive. Turkey has close economic and political ties with the SEE countries, hence there is a potential for SEE to further strengthen their trade and investment relationship with Turkey. For SEE firms, Turkey can be an export destination, source of raw materials, and a potential investor.Trade with Turkey has already seen an upward trend in the post global crisis period. Since 2009, SEE’s exports to Turkey have been rising much faster than exports to the rest of the world. This trend is expected to continue if Turkey’s economy continues to grow rapidly. Much of the trade expansion since 2009 has come from
higher exports of metals and oil, while in the future the objective for SEE firms should penetrate other markets as well, in particular with final and/or higher value-ad-ded products.Turkey’s firms are increasingly eyeing the SEE region for investment. Turkish FDI to SEE, although small relative to total FDI received, was growing rapidly until 2011. The most interesting sectors for Turkish investors have been services, primarily in transport (roads and air transportation), banking and tourism. In 2012 the po-sitive trend of growing FDI from Turkey was reversed, but in medium-term Turkish investments are expected to continue to increase, judging by recent announce-ments from Turkish firms.
References
– Chad P. Bown: Trade Policy Flexibilities and Turkey - Tariffs, Antidumping, Safeguards, and WTO Dispute Settlement, The World Bank Policy Research Working Paper, 2013– World Bank, 2012a: Golden Growth: Restoring the Lustre of the European Economic Model– World Bank, 2012b: Doing Business
Spot
light
on:
1
79Quarterly Monitor No. 34 • July–September 2013
SPOTLIGHT ON:Is decentralisation good for economic growth?
1. Review of basic characteristics of fiscal decentralisation in EU countries
In many developed countries (including those that are members of the EU), there is a trend of delegating responsi-bility for basic functions of the public sector from the central (national) level to lower levels of territorial organisation (regions, sub-regions, local self-governments). The mentioned decentralisation could be reflected in transferring res-ponsibility for raising financial funds (revenue side), but also in performing and self-financing certain activities of the public sector (expenditure side). Based on the results of relevant research and studies1, and on Eurostat data, we will review in more detail the degree of decentralising spending by analysing share of revenue and expenditure of sub-national territorial entities/authorities in total revenue and expenditure of the central budget of EU member states.
1.1. Revenue decentralisation
Degree of revenue decentralisation can be measured by share of revenue at the sub-national level in total state budget revenue. There are two basic sources of revenue at the sub-national level2: (a) source revenue (primarily taxes) inde-pendently collected by the sub-national level, and (b) transfers from the central level. As can be seen in Table 1, in 2010 Denmark had the highest degree of revenue decentralisation (around 2/3 of total budget revenue were collected at the sub-national level or transferred from the national/central level). The same year, Spain and Sweden collected or transferred around half of total revenues to the sub-national level, while in many countries (10 of them) this percentage was around one third. On the other hand, in small countries (Cyprus, Malta), the sub-national level has a very small percentage of total budget revenues (only 5%). During the observed fifteen-year period (1995-2010), the share of sub-national level in total budget revenues has increased in most of the EU member states (in 20 out of 27 countries). When it comes to revenue structure at the sub-national level in EU member states, the situation is as follows3: own revenues account for about 50% of revenue at the sub-national level in Sweden, Germany, Austria and Latvia, while in Finland, Spain, Estonia, Slovakia, the Czech Republic, Slovenia and Italy, own revenues (taxes, etc.) account for
* Economic Faculty of the University of Belgrade 1 See: European Commmission (2012), Report on Public finances in EMU 2012, European Economy 4|2012, Economic and Financial Affairs.2 Here, source revenues and transferred funds are observed together as sub-national budget revenues. 3 According to: European Commmission (2012), Report on Public Finances in EMU 2012, European Economy 4|2012, Economic and Financial Affairs, p.178.
In the last few years, there has been an increased interest from the creators of economic policy for economic and especially fiscal performances of sub-national entities/levels of government (provinces, regions, sub-regions, local self-governments), since the realisa-tion of planned goals of fiscal policy, as well as economic growth at the national level, de-pends on them as well. This issue additionally gains importance in conditions when most of the countries are promoting decentralisation as a preferable organisation model for public administration, with the aim of ensuring higher democracy and motivating eco-nomic activity. This paper is dedicated to the analysis of the degree of fiscal decentrali-sation in EU member states, as well as to the analysis of influences that decentralisation, primarily fiscal one, has on economic performance (economic growth) of certain coun-tries (EU, OECD, Central and Eastern Europe). The goal of the paper is also to review in more detail the degree of fiscal decentralisation in Serbia, and to determine where our country ranks according to this indicator compared to other countries, as well as draw certain lessons from managing public policy in this area. The paper will also focus on a dynamic analysis of revenues and expenditure at the sub-national levels of government in EU member states in the period 1995-2010.
Dejan Molnar *

Spot
light
on:
1
Is Decentralisation Good for Economic Growth?80
40-50% of total revenues at the sub-national level. On the other side are countries where share of own revenue in total revenues is far lower: 0% (Malta), less than 10% (Greece, the Netherlands, Bulgaria), 10-20% (Romania, Great Britain, Ireland, Hungary and Belgium). In 14 EU member states, the transfers from the central level “fill up” the sub-national budgets by more than 50%. It should also be mentioned that in 13 states, including those that are more decentralised (Sweden, Finland, Denmark, Germany), around 70% of total tax revenue collected at the sub-national level comes from income tax and wealth tax, including property tax.
Table 1. Share of revenue at the sub-national level in EU
Country 1995 2010relative change
(%)
absolute change
(pp)1995 2010
relative change
(%)
absolute change (pp)
Austria 34.1 31.6 -7.33 -2.50 17.2 15.2 -11.63 -2Belgium 34.9 38.5 10.32 3.60 16.6 18.8 13.25 2.2Bulgaria 22.4 19.8 -11.61 -2.60 8.4 6.9 -17.86 -1.5Cyprus 3.7 5.4 45.95 1.70 1.2 2.2 83.33 1
Czech Republic 30.3 29 -4.29 -1.30 12.2 11.4 -6.56 -0.8Germany 36.8 38.8 5.43 2.00 16.7 16.9 1.20 0.2Denmark 57.8 66.3 14.71 8.50 32.6 36.8 12.88 4.2
Estonia 24.8 25.2 1.61 0.40 10.5 10.3 -1.90 -0.2Greece 5.2 6.6 26.92 1.40 1.9 2.6 36.84 0.7Spain 37.6 49 30.32 11.40 14 17.8 27.14 3.8
Finland 36.1 41.7 15.51 5.60 20 21.9 9.50 1.9France 18.8 23.2 23.40 4.40 9.2 11.5 25.00 2.3
Hungary 28.2 25.9 -8.16 -2.30 13.3 11.7 -12.03 -1.6Ireland 33.2 19.2 -42.17 -14.00 12.9 6.8 -47.29 -6.1
Italy 28.3 32.5 14.84 4.20 12.7 14.9 17.32 2.2Lithuania 24.3 33.7 38.68 9.40 8 11.4 42.50 3.4
Luxembourg 13.5 11.8 -12.59 -1.70 5.7 4.9 -14.04 -0.8Latvia 19.7 31.3 58.88 11.60 7.3 11.3 54.79 4Malta 1.7 1.8 5.88 0.10 0.6 0.7 16.67 0.1
Netherlands 48.3 35.3 -26.92 -13.00 22.8 16.3 -28.51 -6.5Poland 23.1 36.3 57.14 13.20 10 13.6 36.00 3.6
Portugal 13.4 15.1 12.69 1.70 4.9 6.3 28.57 1.4Romania 13.1 28.5 117.56 15.40 4.2 9.7 130.95 5.5Sweden 42.2 48 13.74 5.80 24.3 25.3 4.12 1Slovenia 17.7 22.1 24.86 4.40 7.8 9.8 25.64 2Slovakia 6.9 17 146.38 10.10 3.1 5.5 77.42 2.4
Great Britain 28.9 34.2 18.34 5.30 11 13.8 25.45 2.8EU-27 (average) 25.37 28.44 12.10 3.07 11.49 12.38 7.75 0.89
The share of revenues on the subnational level in total government
revenues
The share of revenues on the subnational level in GDP (%)
Source: European Commission (2012), Report on Public Finances in EMU 2012, European Economy 4|2012, Economic and Financial Affairs, p.175 (with changes by Author).
Trends in share of source and shared revenues of local self-governments in consolidated state budget were between 12.5% in 2002 and 20.9% in 2011. Having in mind that share of transfers in total revenue of local self-governments in the period between 2002 and 2011 was on average around 19%4, it can be concluded that share of revenue from the local level in total state revenue has been constantly growing, reaching up to 25% in the observed interval. In that context, it can be concluded that there is a high degree of fiscal decentralisation in our country in the sense of decentralised revenue (compare data in Table 1). During the period 2002-2011, source revenue in Serbia was around 38% of total revenue of local self-governments. Source revenue began to increase its share in the structure of local revenues after the adoption of the Law on Financing Local Self-Governments in 2006, and mostly due to the change in treatment of property tax (it became source instead of shared revenue), as well as to increased land usage fees. However, the aforementioned share of source revenue in total revenues of local self-governments began to decline after 2011, after the Law on Changes and Amendments to the Law on Financing Local Self-Governments (2011) was adopted, due to the increase in income tax that belongs to the local level (from 40% to 80%; this tax is characterised as shared revenue). This change caused a reduction in the share of source revenues in total revenues of cities and municipalities. 4 See: Bisić, M. and G. Radosavljević (2012), “Degree of Fiscal Decentralisation in the Republic of Serbia: Indicators and Comparisons”, FINANSIJE Magazine for finance theory and practice, year 67, no. 1−6/2012, p.53. Average share of source revenue of local self-governments in their total revenues in the same period was around 38%, so it can be concluded that shared revenue on average (2002-2011) had a share of around 43%, ibid, p.50.

Spot
light
on:
1
81Quarterly Monitor No. 34 • July–September 2013
1.2. Expenditure decentralisation
Degree of decentralisation of public expenditures can be measured as share of expenditures that exist in sub-national5 budgets in the total expenditures of the central (state) budget. Table 2 shows the aforementioned share of budget expenditures of sub-national territorial entities in total state budget expenditures and total GDP during the period 1995-2010, as well as relevant changes during the observed period. Based on data presented (see Table 2), it is evident that according to this indicator, EU member states significantly differ. In 2010, Denmark was ranked first on the list, considering that 63.4% of total expenditure in this country was decentralised. It was followed by Spain and Sweden with the percentage of expenditure decentralisation of around 47-48%. These were followed by a group of countries where this indicator was around 30-40% (Finland, Germany, Belgium, the Netherlands, Poland, Austria, Italy). On the other side are countries where the degree of expenditure decentralisation was at a very low level: Malta (1.6%), Cyprus (4.8%), Greece (5.6%), Luxembourg (11.5%), Portugal (13.8%), Slovakia (16%), and Bulgaria (18.2%). The data leads to a conclusion that the degree of expenditure de-centralisation doesn’t only depend on the institutional framework in the country, but also on geographic (size) and demographic (population) characteristics. It is interesting to note that degree of expenditure decentralisation is not relatively higher only in federally organised states (Austria, Belgium, Germany, Spain), but also in those that can be classified as unitary (Scandinavian countries, the Netherlands, Poland). Observed dynamically, it is evident that in most of the EU member states (as many as 22 countries), during the observed time interval (1995-2010), there has been an increase in the degree of expenditure decentralisation.
Table 2. Share of expenditures at the sub-national level in EU
Country 1995 2010relative
change (%) absolute
change (pp)1995 2010
relative change (%)
absolute change (pp)
Austria 31.4 34.5 9.87 3.10 17.7 18.1 0.02 0.4Belgium 33 37 12.12 4.00 17.2 19.7 0.15 2.5Bulgaria 23.7 18.2 -23.21 -5.50 10.8 6.9 -0.36 -3.9Cyprus 4.2 4.8 14.29 0.60 1.4 2.2 0.57 0.8
Czech Republic 19.2 27 40.63 7.80 10.2 11.9 0.17 1.7Germany 33.2 37.5 12.95 4.30 18.2 18 -0.01 -0.2Denmark 53.7 63.4 18.06 9.70 31.8 36.9 0.16 5.1
Estonia 26.7 24.6 -7.87 -2.10 11 10 -0.09 -1Greece 4.2 5.6 33.33 1.40 1.9 2.8 0.47 0.9Spain 33.1 47.9 44.71 14.80 14.7 22 0.50 7.3
Finland 30.5 39.9 30.82 9.40 18.7 22.1 0.18 3.4France 17.6 20.5 16.48 2.90 9.6 11.6 0.21 2
Hungary 23.5 25.4 8.09 1.90 13.1 12.6 -0.04 -0.5Ireland 31.1 10.2 -67.20 -20.90 12.7 6.8 -0.46 -5.9
Italy 24.1 30.7 27.39 6.60 12.6 15.4 0.22 2.8Lithuania 24.1 27.6 14.52 3.50 8.3 11.3 0.36 3
Luxembourg 13.4 11.5 -14.18 -1.90 5.3 4.9 -0.08 -0.4Latvia 19.2 26.6 38.54 7.40 7.4 11.8 0.59 4.4Malta 1.5 1.6 6.67 0.10 0.6 0.7 0.17 0.1
Netherlands 40.2 33.3 -17.16 -6.90 22.7 17.1 -0.25 -5.6Poland 18.9 32.5 71.96 13.60 11 14.8 0.35 3.8
Portugal 11.6 13.8 18.97 2.20 4.8 7.1 0.48 2.3Romania 12 23.9 99.17 11.90 4.1 9.8 1.39 5.7Sweden 37.8 47.5 25.66 9.70 24.6 25.1 0.02 0.5Slovenia 14.5 20.4 40.69 5.90 7.6 10.2 0.34 2.6Slovakia 13.1 16 22.14 2.90 6.4 6.4 0.00 0
Great Britain 25.8 27.4 6.20 1.60 11.3 13.8 0.22 2.5EU-27 (average) 23.01 26.27 14.17 3.26 11.69 12.96 0.11 1.27
The share of expenditures on the subnational level in GDP (%)
The share of expenditures on the subnational level in total government expenditures
Source: European Commission (2012), Report on Public Finances in EMU 2012, European Economy 4|2012, Economic and Financial Affairs, p.168 (with changes by Author).
5 In this paper, sub-national territorial entities are considered all forms of territorial organisation “below” the national level (i.e. regions, sub-regions and local self-governments). This approach can be found in many relevant studies and scientific articles dealing with this topic.
Spot
light
on:
1
Is Decentralisation Good for Economic Growth?82
The following criteria can be found in literature for the classification of countries according to the level of (de)centra-lisation6, thus grouping the EU member states (in 2010):• very decentralised: if over 50% of public spending is realised at the levels below the central one (Denmark); • decentralised: if 40-50% of public spending is realised at the levels below the central one (Spain, Finland, Swe-
den); • semi-centralised: if more than 30% and less than 40% of public spending is realised at the levels below the cen-
tral one (Austria, Belgium, Germany, Italy, the Netherlands, Poland); • centralised: if 20-30% of public spending is realised at the levels below the central one (the Czech Republic,
Estonia, France, Hungary, Lithuania, Latvia, Romania, Great Britain, Slovenia); • very centralised: if less than 20% of public spending is realised at the levels below the central one (Slovakia,
Portugal, Malta, Luxembourg, Ireland, Greece, Cyprus, Bulgaria). Share of expenditure of local self-government units in total consolidated expenditure of the state, in the period 2005-2011 in Serbia was on average around 14.5%7. Compared to other countries, the share of expenditures of the local level in total expenditure of the state in Serbia is among the lowest and our country can be grouped together with Slovakia, Portugal and Ireland. In our country, this share is far smaller than in Denmark, Germany, Austria, Spain, etc. The conclusion is that according to this indicator of the degree of fiscal decentralisation, Serbia cannot be grouped with countries with a high degree of fiscal decentralisation. Comparing this conclusion with the one referred to by indicators that measure the relative importance of revenues, it can be observed that the scope of real responsibilities of the local self-governments is at odds with their scope of revenue.
1.3. Coverage of expenditures by source revenue at the sub-national level – Vertical fiscal (im)balance
The prevailing opinion in the relevant literature dealing with the study of fiscal decentralisation is that own revenues at the sub-national level (primarily taxes collected at the sub-national level) are a much more efficient form of finan-cing sub-national expenditures than transfers from the central level. If the majority of expenditure of the lower level of government is financed through own (source) revenue, then the production of goods and services of the public sector at the sub-national level is financed by those who have direct benefit from their use. Contrary to that, in a situation when public goods and services that are needed at the sub-national level are financed by funds transferred from the central level, an irrational spending of limited resources occurs and for at least two reasons. First, the ex-penditures are not completely internalised at the sub-national level, because expenses are partly born by those who are “outside” of the particular region. Second, the responsible people at the sub-national level, as a rule, expect that, in the cases when the expenditures at the sub-national level exceed revenues, the difference, i.e. the deficit will be co-vered by the central government, which then results in the so-called “soft budgetary limitations” at the sub-national level, which could have negative effect on the fiscal balance of the national (central) budget. However, there are numerous arguments in favour of the claim that not all expenditures at the sub-national level should be financed by own revenues of the sub-national level. Some of them being: (a) economy of scale and com-plexity of administrating certain taxes, (b) spatial mobility of the tax base, e.g. capital and investments, and the consequent possibility of “tax wars” between sub-national entities trying to attract them, (c) reduced stability of tax revenue at the sub-national level, (d) the need at the central level to lead a policy of equal territorial development, which includes redistribution of funds from richer to poorer sub-national areas, etc. Naturally, the strength of these arguments is relative and depends on form of tax. In literature there can be found a high degree of consensus regar-ding the taxing of personal and corporate revenues being centralised, as well as administrating the Value Added Tax, while immovable taxes (such as property tax, etc.) can be collected at the sub-national level. Having this in mind, the following Table 3 shows the degree of expenditures at the sub-national level in EU coun-tries being covered by their own (source) revenues. The assumption is that the smaller the difference between sub-national expenditures and revenues, i.e. the smaller the dependency of the sub-national level on the transfers from the central level, the more efficient the relationship between the various levels of the state administration regarding
6 See: Miňana Simó, J.S. (1999), “Fiscal Decentralisation in Europe”, Departamento de Economia Aplicada, Univerzitat de Valencia, p.117 According to: Bisić, M. and G. Radosavljević (2012), “Degree of Fiscal Decentralisation in the Republic of Serbia: Indicators and Comparisons”, FINANSIJE Magazine for finance theory and practice, year 67, no. 1−6/2012, p.59.

Spot
light
on:
1
83Quarterly Monitor No. 34 • July–September 2013
the fiscal discipline, i.e. responsible and rational spending of scarce resources. The basic conclusion that can be drawn based on the available data is that there is not a pronounced high degree of coverage of expenditures by revenues at the sub-national level – only in two countries this coverage was above 50% in 2010 (Sweden and Germany)8. Ob-served dynamically, in the period 1995-2010, even though there was no rule among EU member states, there was a notable decrease of the aforementioned coverage in as many as 13 states (it was pronounced the most in Romania, Lithuania, Latvia, Bulgaria) and it was higher than the increase in the other group of countries where the coverage of expenditures had increased as well (Spain, Italy, Slovakia, see Table 3).
Table 3. Coverage of sub-national expenditure by own revenue
Country 1995 2010absolute
change (pp)Austria 42.2 48.6 6.4
Belgium 15.1 19.9 4.8Bulgaria 32.4 8.7 -23.7Cyprus 28.6 22.7 -5.9
Czech Republic 41.2 40.3 -0.9Germany 50.9 51.7 0.8Denmark 48.6 34.1 -14.5
Estonia 43.5 46 2.5Greece 10 7.1 -2.9Spain 26.9 37 10.1
Finland 49.8 45.8 -4France 45.5 36.4 -9.1
Hungary 20.6 18.9 -1.7Ireland 6.3 13 6.7
Italy 24 38.9 14.9Lithuania 61.4 28.3 -33.1
Luxembourg 39 30.2 -8.8Latvia 75.6 47.5 -28.1Malta 0 0 0
Netherlands 5.2 8.1 2.9Poland 42.7 26.7 -16
Portugal 33.3 30.6 -2.7Romania 59.5 11.2 -48.3Sweden 57.5 62.5 5Slovenia 31.2 39.2 8Slovakia 25 37 12
Great Britain 11 12.9 1.9EU-27 (average) 34.33 29.75 -4.58
Source: European Commission (2012), Report on Public Finances in EMU 2012, European Economy 4|2012, Economic and Financial Affairs, p.179.
The review showed that there is a trend in EU of increased fiscal decentralisation in most of the countries, when it comes to observing both expenditures and revenues, although solutions by individual countries are not unified.
8 The mentioned state was to be expected, having in mind that it is not economically efficient to administrate the most important forms of tax (VAT, income tax, social contributions, tax on profit, excise) at the sub-national level. Lower territorial entities/regions, as forms of own revenue, are left with tax on income, various fees, etc. (and they don’t yield generous contributions to the balance sheet).

Spot
light
on:
1
Is Decentralisation Good for Economic Growth?84
2. Effects of fiscal decentralisation on economic growth
The aim of this part of the paper is to clarify more closely the relationship between the degree of fiscal decentralisa-tion and economic growth. This issue deserves appropriate attention for at least two reasons9. First, stimulating eco-nomic growth is one of the most common arguments presented by the proponents of decentralisation. Second, one of the most important functions of the creators of economic policy and holders of power is to create an institutional framework and adopt policies that will stimulate economic progress. Based on the analysis of relevant literature, we will try to answer the question whether a higher degree of fiscal decentralisation contributes to an increase in gross domestic product at the national level. First, we will review the mentioned inter-dependency from a theoretic aspect, and then we will present the results of relevant empirical research (conducted on samples of various countries/groups of countries over the last decade) with the aim of systematising possible answers. The main argument cited in favour of fiscal decentralisation is that it improves efficiency of public sector and thus contributes to the economic growth in the long term. Economic efficiency is higher, because the local level of government (local authorities) know better the business conditions, specific circumstances and preferences of the local population and economy than some distant central authority does, primarily due to physical and institutional proximity10. This argument is especially important in less developed countries where, due to lack of market possibi-lities, the population is “condemned” to getting aid from central level government, which is not very familiar with the local needs. Therefore, one of the initial premises is that decentralisation contributes to the mobilisation of local resources11. This fact allows the local level to secure better and higher quality goods and service of the public sector at lower prices. The aforementioned allocative efficiency is particularly evident, as Oates noticed back in 1972, in con-ditions of high degree of concord between decentralisation of expenditure and revenue. Likewise, in a situation when government expenditure is decentralised and in line with preferences of the local levels, there is a higher degree of social welfare, which in turn has a positive impact on economic performance12. Because, when preferences for public goods and services vary across regions and local communities, centrally governed public policies, which are usually unified, lead to suboptimal solutions (consumer inefficiency)13. In a situation when lower levels have an opportunity to independently reach decisions (when there is a fiscal decentralisation), there is competition between various levels of government which contributes to more efficient production of public goods and services. Finally, the literature points out one more important argument in favour of (fiscal) decentralisation – a process that stimulates democracy, citizen participation and thus contributes to transparency and responsibility of public authorities. Excessive centralisation reduces what is most important and valuable in any society and a system of decision making, and that is the ability to reach decisions that are in the interest of the majority of citizens and on the level that is “closest” to the citizens (this is the principle of democracy). When a large percentage of decisions is being made at the central level, it poses a risk of creating a “bottleneck”. And the results are misadjusted decisions, whose consequences are numerous missed economic opportunities and therefore reduced efficiency. In addition, excessive centralisation causes a whole range of other non-economic (social) negativities (excessive centralisation of the fiscal system is material basis for a concen-tration of social power). Still, it should also be stressed that decentralisation (autonomy) is not necessarily a guarantee of economic deve-lopment of the local community and national economy. The success is predominantly determined by institutional development, as well as the capacity of local communities (local leaders and their administration) to take over certain activities, but also responsibilities for results achieved. Before taking any concrete steps, potential risks should be considered that are related to the process of decentralisation. If basic conditions for its implementation haven’t been fulfilled, decentralisation could cause more damage than good. Unprepared local communities could face: reduction in quality and efficiency in performing public work, too great demands placed before unqualified government re-presentatives, conflict of priorities at the local level, nepotism and increased corruption, unnecessary enlargement of local administration, etc. When creating a decentralisation strategy, one has to take into account the capabilities of
9 Asatryan, Z. (2010), “Fiscal Decentralisation and Economic Growth in OECD Countries: A Bayesian Model Averaging Approach”, Humboldt-Univerzität zu Berlin, p.710 See: Gemmell, N Rich at all. (2009), “Fiscal Decentralisation and Economic Growth in OECD Countries: Matching Spending with Revenue Decentralisation“, P. T. N.o 6/09, p.8; Rodrigues-Pose, A. and A. Krøijer (2009), “Fiscal Decentralisation and Economic Growth in Central and Eastern Europe” LSE ’Europe in Question’ Discussion Paper Series, Paper No. 12/2009, p.111 Rodrigues-Pose, A. and R. Ezcurra (2010). “Is Fiscal Decentralisation Harmful for Economic Growth? Evidence from the OECD Countries“, Imdea Working Papers Series in Economics and Social Sciences 2010/09, Madrid, p.612 According to: Oates, W.E. (1999) “An Essay on Fiscal Federalism”, Journal of Economic Literature, n.º 37(2).13 See: Rodrigues-Pose, A. and A. Krøijer (2009), “Fiscal Decentralisation and Economic Growth in Central and Eastern Europe”, LSE ’Europe in Question’ Discussion Paper Series, Paper No. 12/2009, p.4
Spot
light
on:
1
85Quarterly Monitor No. 34 • July–September 2013
individuals, local organisations and institutions to perform transferred/assumed jobs and responsibilities. Success in the implementation of decentralisation depends on many factors. Certain analyses show that decentralisation could have positive effects only if the state has previously reached a certain level of development. Concerning potential risks (negativities) of decentralisation, it should be stressed that its quality fully depends on the critical mass of the population, the size of the territory, scope of economic activities, realised revenues, etc. Decentralisation will be more successful in populated countries where sub-national territorial units have bigger population. Theoretic opinions are not fully in favour of the higher degree of decentralisation either. First, increased fiscal decentralisation and competition between sub-national entities could lead to pronounced mobility of individuals, households and companies (which are the tax basis) in an attempt to secure a better treatment for themselves, which negatively affects territorial distribution of public resources (certain areas could be left without budget revenue, so they won’t be able to finance spending on public goods and services). This could have very negative implications on the dynamic of the economic growth, because expressed regional inequalities (in income, infrastructure, level of education of the population, level of healthcare, etc.) that occur as a result of fiscal capacity of different areas, have a negative impact on the growth rate of national economy. In less developed sub-national entities, there are no quality institutional or human capacities necessary for making quality developmental decisions and their implementation. In this context, public policies and public sectors that are more centralised could secure a higher territorial equality in the distribution of production (economic and non-economic) factors. Fiscal decentralisation could have negative effects on the economic growth due to the impossibility of adequate coordination in a situation when there are a lot of different entities making independent decisions on borrowing and spending and thus affect the state public finances. Likewise, the sub-national levels are often not big enough to use the economies of scale in the production of public goods and services, which leads to irrational spending, doubling of capacities, etc.14 The familiarity that exists on the lower levels between the government representatives and the private sector could be a fertile ground for corruption, nepotism, clientelism and thus hinder economic growth. Irresponsible and insufficiently cautious political elite at the sub-national level could create huge fiscal deficits that are then transferred to the national level, because their excessive borrowing, beyond the possibilities of repayment, burden the national budget that acts as a “saviour” (the national budget covers the debts of the sub-national one). Taking over responsibilities of certain sub-national autho-rities creates, on the one hand, a deficit at the central level, which is, on the other hand, contrary to the principle of fairness (socialisation of expenses/losses). Increase of expenditure of the central budget causes additional borrowing of the central government, which leads to increased inflation and macroeconomic instability, causing a decline of economic activity. Finally, if we sum up positive and negative effects of fiscal decentralisation on the economic growth, we can see that there are valuable arguments for both alternatives. That is why it shouldn’t be surprising that the results of empirical research didn’t contribute to a more decisive commitment to either one of them. On the contrary, the empirical litera-ture stresses the difference regarding the conclusions on the effects of decentralisation on economic growth, since the mentioned inter-dependency is predominantly determined by the context in which it is analysed. In that sense, there are opinions that fiscal decentralisation is a more adequate and a more desirable alternative in developed countries, and that it is more probable that in less developed and developing countries its influence on the economic growth would be negative. Hence, in territorial and geographically differentiated decentralisation, the key is the critical mass concept. In order for decentralised units to be efficient and make positive contribution to economic prosperity, they have to be large enough in the sense of population, as well as level of economic activities and their realised revenue. Theoretical considerations are clearly not sufficient to give a unified and unambiguous answer to the question: what is the relationship between the degree of fiscal decentralisation and the rate of economic growth? But, while theory is pointing to a possible positive relationship, the empirical research and literature do not offer any convincing argu-ments to this effect15. Below (in Table 4), we give a tabular presentation of empirical research and their basic findings.
14 Some authors, still, relativise this argument stating that if the fiscal decentralisation is adequately implemented/designed in the sense of control of borrowing of the lower levels of the government and stimulating cooperation of the lower levels on larger and more expensive infrastructure projects/capacities (functional regions; association by the function principle), then the stated negative aspects of fiscal decentralisation could be substantially avoided. 15 First empirical papers examining directly the influence of fiscal decentralisation on economic growth, appeared at the end of 1990s. See: Asatryan, Z. (2010), “Fiscal Decentralisation and Economic Growth in OECD Countries: A Bayesian Model Averaging Approach”, Humboldt-Univerzität zu Berlin, p.8.

Spot
light
on:
1
Is Decentralisation Good for Economic Growth?86
Table 4. Correlation between the degree of decentralisation and economic growth
Author (year)The sample on which the
test was performedTime period Main findings / results
Akai i Sakata (2002) U.S. 1988-1996 Positive and statistically significant relationship.
Baskaran i Feld (2009) 23 OECD countries 1975-2001 Negative, but not strong (expressed) relationship.
Davoodi i Zou (1998) 46 countries 1970-1989
developing countries: negative but insignificant relationship;
OECD countries: existence of a relationship not determined.
Limi (2005) 51 countries 1997-2001 Positive and statistically significant relationship.
Lin i Liu (2000) China 1970-1993 Positive and statistically significant relationship.
Rodrigues-Pose i Bwire (2004)Germany, India, Italy,
Mexico, Spain, United StatesDifferent periods
up to 2001
Mostly statistically insignificant relationship, with the exception of Mexico, the U.S. and partly India, where the
existence of a negative relationship was found.
Stansel (2005) SAD 1960-1990 Positive and statistically significant relationship.
Thieβen (2003) 26 countries 1973-1998 Connection type conversely "U".
Thornton (2007) 19 OECD countries 1980-2000 Statistically insignificant relationship.
Woller i Phillips (1998) 23 less developed countries 1974-1991 The existence of any relationship non found.
Zhang i Zou (2001) China 1980-1992 Negative and statistically significant relationship.Zhang i Zou (1998) China 1987-1993 Negative and statistically significant relationship.
Rodrigues-Pose i Ezcurra (2010) 21 OECD countries 1990-2005 Negative and statistically significant relationship.
Gemmell, Kneller i Sanz (2009) 23 OECD countries 1972-2005
Decentralization of expenditures has negative and decentralization of revenues positive impact on economic growth, convergence in the degree of decentralization of expenditures and revenues
positively influences the economic growth.
Zhang i Zou (1998) China 1986-1992If sub national expenditures are highly decentralized
additional decentralization stunts growth.
Rodrigues-Pose i Krøijer (2009)16 Central and Eastern
Europe countries1990-2004
The existence of a negative relationship between: (a) the degree of decentralization of expenditures and
economic growth, and (b) the share of transfers from the central level and economic growth.
A positive relationship exists between the volume of the original sub national income levels and economic
growth.
Enikolopov i Zhuravskaya (2003)21 developed and 70 developing countries
1975-2000 Positive relationship for less developed countries.
Source: Gemmell, N Rich at all. (2009), p.10-18; Rodrigues-Pose, A. and R. Ezcurra (2010), p.33; Asatryan, Z. (2010), p.17-22 (with modifications from the author – D.M.).
It could be said that the empirical literature in this field is divided: one group of research confirms a positive corre-lation between the decentralisation and the growth, while another group of papers claims that there is a negative correlation between the observed variables16. This is because there is no complete agreement or unified approach in measuring decentralisation and its impact on economic growth, and even when same methodologies are used, there is a difference in samples, approaches, as well as applied analytical methods. The researches were not conducted systematically, samples used to examine the inter-dependency were different, as well as the time intervals. All this leads to different results and warrants caution in drawing conclusions. Still, certain regularities can be drawn. Fiscal decentralisation gives better results: in developed countries, in condi-tions when there is a higher coverage of sub-national expenditure by own revenue, in conditions when own revenues have a significant share in the structure of total sub-national expenditures, when the sub-national level has the free-dom to independently determine the height of certain tax rates, fees, etc. and not only administrate/collect them, in a situation when there is a clear division of responsibilities when it comes to financing expenditures between various levels of the government, and when the division of responsibilities is done in line with the principle of efficiency in the production of public goods and services. On the other hand, in countries with “younger” democracies (e.g. where there has a been a centralised system in managing public sector for a long time), sudden implementation of decentra-lisation could cause more damage than good. This possibility becomes a probable outcome when the process of fiscal decentralisation starts with a strong delegation of revenue without the transfer of relevant responsibilities (expenses)
16 See: Rodrigues-Pose, A. and A. Krøijer (2009), “Fiscal Decentralisation and Economic Growth in Central and Eastern Europe”, LSE ’Europe in Question’ Discussion Paper Series, Paper No. 12/2009, p.4.
Spot
light
on:
1
87Quarterly Monitor No. 34 • July–September 2013
to the lower territorial units. Sudden transfer of administration (recording, collecting, using, etc.) of certain forms of fiscal revenues to the local levels could cause an economic inefficiency. Professional and technical unpreparedness, lack of a sufficient number of qualified personnel, corruption, and nepotism are just some of the reasons that cause the negative effect of decentralisation on economic growth.
Conclusion
Regionalisation and decentralisation foresee classification and division of responsibilities, rights and obligations between various levels – local, regional and national. The paper highlighted and analysed in more detail some of the advantages and disadvantages (dangers) of decentralisation, as well as its impact on economic performance. The arguments put forward could be helpful in considering possible alternatives available to the creators of economic policy. It should be clear, though, that the question is not whether there should be a decentralisation, but what is the best way of implementing it. In many cases, the real question is not whether a certain function should be performed by state, regional or local authorities, as the service has to be provided with the participation of all three levels of the government, but the real challenge lies in finding adequate ways of organising the three levels of government to jointly conduct that service. The paper compared Serbia with EU member states on the degree of fiscal decentralisation. It has been established that Serbia falls into group of countries that are more decentralised when we take as an indicator the share of own revenue of local self-governments in total revenue. According to this indicator, Serbia is ranked together with tra-ditionally highly decentralised countries, which shows that the process of fiscal decentralisation in our country has intensified over the last few years, at least when it comes to the scope and dynamic of revenue of the local self-go-vernments. On the other hand, share of expenditures of local self-governments in the total expenditures of the state is lower than the EU average. This fact relativises the success and quality of the started process of decentralisation in Serbia. The structure of the expenditures of the local self-governments in Serbia (dominated by current expen-ses – wages and subsidies) supports the conclusion that fiscal decentralisation has not improved efficiency of public spending. Since neither the economic theory nor practice provide unambiguous answers regarding the optimal level of fiscal decentralisation in a country, it remains to be concluded that for our country the alignment in the degree of decentralisation of revenues and expenditures is necessary. In a situation when there is a high degree of fiscal decen-tralisation of revenue and a low one of expenditures, the efficiency of public spending at the local level is jeopardised, and thus the fiscal balance at the central level as well, which further jeopardises economic growth. It is, therefore, necessary to review the existing system of financing local self-governments (revenue side), as well as consider the possibility of redistribution of responsibilities in order to transfer more power to local self-governments (expenditure side), with the main objective of ensuring the matching of revenues and responsibilities.
Spot
light
on:
1
Is Decentralisation Good for Economic Growth?88
Literature:
— Akai, N. and M. Sakata (2002), “Fiscal Decentralisation Contributes to Economic Growth: Evidence from State-Level Cross-Section Data for the United States”, Journal of Urban Economics 52.— Armstrong H and J. Taylor (2000). Regional Economics and Policy, Blackwell Publishing, Oxford.— Asatryan, Z. (2010), “Fiscal Decentralisation and Economic Growth in OECD Countries: A Bayesian Model Averaging Approach”, Humboldt-Univerzität zu Berlin.— Baskaran T. and L. P. Feld (2009), “Fiscal Decentralisation and Economic Growth OECD Countries: Is there a Relationship?”, CESIFO Working Paper NO. 2721.— Bisić, M. and G. Radosavljević (2012), “Degree of Fiscal Decentralisation in Serbia: Indicators and Compari-sons”, FINANSIJE Magazine for financial theory and practice, year 67, no. 1−6/2012. — Davoodi, H. and H. Zou (1998), “Fiscal Decentralisation and Economic Growth A Cross-Country Study”, Jour-nal of Urban Economics 43. — European Commission (2012), Report on Public Finances in EMU 2012, European Economy 4|2012, Economic and Financial Affairs.— Gemmell, N Rich at all. (2009), “Fiscal Decentralisation and Economic Growth in OECD Countries: Matching Spending with Revenue Decentralisation”, P. T. N.o 6/09.— Lin, J. Y. and Z. Liu (2000), “Fiscal Decentralisation and Economic Growth in China“, Economic Development and Cultural Change 49.— Miňana Simó, J.S. (1999), “Fiscal Decentralisation in Europe“, Departamento de Economia Aplicada, Univerzi-tat de Valencia (available at: https://www.google.rs/url?sa=t&rct=j&q=&esrc=s&source=web&cd=1&cad=rja&ved=0CDkQFjAA&url=http%3A%2F%2Fdialnet.unirioja.es%2Fdescarga%2Farticulo%2F3142318.pdf&ei=pPySUseOHMTfsgbEmIHACA&usg=AFQ jCNFEFw-bd24GoQ j3-o56wsH-YRt13A&sig2=YSUfvfHStyNs4p4Bmwch3A&bvm=bv.57127890,d.Yms), page viewed: (15.11.2013.).— Oates, W.E. (1999): “An Essay on Fiscal Federalism”, Journal of Economic Literature, n.º 37(2).— Rodrigues-Pose, A. and A. Krøijer (2009), “Fiscal Decentralisation and Economic Growth in Central and Ea-stern Europe”, LSE ’Europe in Question’ Discussion Paper Series, Paper No. 12/2009.— Rodrigues-Pose, A. and R. Ezcurra (2010). “Is Fiscal Decentralisation Harmful for Economic Growth? Evidence from the OECD Countries”, Imdea Working Papers Series in Economics and Social Sciences 2010/09, Madrid.— Stansel, D. (2005), “Local Decentralisation and Local Economic Growth: A Cross-Sectional Examination of US Metropolitan”, Journal of Urban Economics 57.— Thornton, J. (2007), “Fiscal Decentralisation and Economic Growth Reconsidered“, Journal of Urban Economics 61.— The Law on Financing Local Self-Governments (“RS Official Gazette”, no. 62/2006).— The Law on Changes and Amendments to the Law on Financing Local Self-Governments (“RS Official Ga-zette”, no. 47/2011).

Spot
light
on:
1
89Quarterly Monitor No. 34 • July–September 2013
CIP - Katalogizacija u publikacijiNarodna biblioteka Srbije, Beograd
33 (497.11)
QUARTERLY monitor of economic trends and policies in Serbia / Editor in Chief Milojko Arsić. - 2011, iss. 1 (january/july)- . - Belgrade (Kamenička 6) : The Foundation for the Advancement of Economics, 2005- (Belgrade : Alta Nova). - 30 cm
Dostupno i na: http://www.fren.org.yu. - Tromesečno. - Ima izdanje na drugom jeziku: Kvartalni monitor ekonomskih trendova i politika u Srbiji = ISSN 1452-2624 ISSN 1452-2810 = Quarterly monitor of economic trends and policies in Serbia COBISS.SR-ID 126940428