issn no. 2349-7165 non - performing assets and profitability: a...
TRANSCRIPT

20 UNNAYAN : International Bulletin of Management and EconomicsVolume - IX | July 2018
ABSTRACT
Ms. Ashima GabaResearch Scholar
Dept. of Commerce and Business StudiesJamia Millia Islamia – a Central University, New Delhi
E-mail- [email protected]
Dr. Ravinder KumarProfessor of Finance
Dept. of Commerce and Business StudiesJamia Millia Islamia – a Central University, New Delhi
E-mail- [email protected]
ISSN No. 2349-7165
Non - Performing Assets And Profitability: A Studyof Private Sector Banks In India
Banking system of a nation facilitates financial fine-tuning of the latter's economic activities; an
important device for the development and growth of an economy. Indian banking sector although has
significantly expanded and improved post liberalization, privatization and globalization (LPG) of Indian
economy, yet there are some glitchesimpinging on the smooth sailing of the system. Inparticular,one of
the challenging issuesor glitches seems to be prevalent in the contemporary banking sector of India is
management of their NPAs (non-performingassets).A high level of NPAs suggests alarge number of credit
defaults that besides liquidity, adversely affects the profitability and net worth of a bank.NPAs are like a
double-edged sword as it not only halts revenue generation for banks but also undermines capital
accruals, leading to a restricted lending capacity of the banks. Moreover, NPAsnot only affect the books
of banks and their performance but also adversely impact the economy as a whole.Present study attempts
tojudge the impact of NPAs of privatesector banks of India on their profitability. The trend of NPAs in
private sector banks has been exploredover the span of 15 years i.e. from 2001 to 2016 to reach the
conclusion. The study usesfinancial ratios as a measure of banks' performance and data has beenanalyzed
using the Pearson's Coefficient of Correlation and Regression technique through SPSS.
Keywords:Advances, Gross NPAs, Net NPAs,Profitability, Return on Assets
INTRODUCTION
Indian Banking industry is overshadowed by public sector banks since 1969 when Indian government
nationalized 14 largest commercial banks of the country. Though, soon after liberalizationprivate sector
banks emerged significantly. They have grown faster and expanded wellbytaking advantage of the latest
technology, contemporary tools and ingenious techniques.
bifurcate Indian private sector banks into two sets; old and
new. Existence of old private sector banks is marked before nationalization in 1969 but they
remainedindependent as they were not significant enough to be nationalized. On the other hand, new
private sector banks attained their banking license after liberalization of banking policy in the
1990s.Enormous competition in the banking industry has obligated private banks to serve their clients
with superior services. Private Banksface major competition from the public sector banks operating
nationwide along with the ones operating across the borders. Therefore, advancement in technology and
unparalleled services can enable aprivate sector bank to be distinct frompublic ones.
As a regulator and supervisor of the Indian
banking system, Reserve Bank of India (RBI)

21
ISSN No. 2349-7165
UNNAYAN : International Bulletin of Management and EconomicsVolume - IX | July 2018
The primary function of accepting deposits and lendingcredits is common to all banks whereas, what
enables a bank to stand out from other banks are its secondary functions which compriseof agency and
utility functions. In other words, to have an edge over its competitors, a bank must caterto its customers
with a service which other banksmight not afford to. This will enhance the relationship between bank and
customer. Over the years it has been held that private sector banks are better in comparison to public
sector banks in terms of overall performance. However, the myth of superior performance of the private
banks needs to be addressed well.
CONCEPTUAL FRAMEWORK
Non-performing assets(NPAs) as per
(issued by the RBI),are loans or advances where;
i. Interest and/or installment of principal remain overdue for a period of more than 90 daysin
respect of a term loan; or
ii. The account remains 'out of order' in respect of an Overdraft / Cash Credit (OD/CC); or
iii. The bill remains overdue for a period of more than 90 days in the case of bills purchasedand
discounted; or
iv. The installment of principal or interest thereon remains overdue for two crop seasonsfor short
duration crops and one crop season for long duration crops (in respect of agriculture loan); or
v. The amount of liquidity facility remains outstanding for more than 90 days in respect of
securitization transaction undertaken in terms of 'Guidelines on Securitization'issued by Reserve
Bank of India on February 1, 2006; or
vi. In respect of derivative transactions, the overdue receivables representing positive markto-market
value of a derivative contract, if these remain unpaid for a period of 90 days from the specified
due date for payment.
Thus it can be understood that Non-Performing Assets (NPAs) refers to a classification of loans and
advances in the books of financial institutions that are in default or scheduled payments of principal or
interest are in arrears. A loan or an advance is usually classified as non-performing when loan payments
have not been made within a period of 90 days of their maturity as 90 days of non-payment is the
standard period of time for classifying any asset as non-performing. However the duration of elapsed
time may be shorter or longer depending upon the terms and conditions set forth in each loan.
CATEGORIES OF NPAs
As per the said 'Master Circular'issued by the RBI on July 1,2015,banks are required to classify non-
performing assets into the following three categories based on the period for which the asset has remained
non-performing:
(1) Sub-standard Assets: With effect from 31 March 2005, a substandard asset would bethe one,
which has remained non-performing for a period less than or equal to 12 months. Such assets are
characterized by the possibility that if deficiencies are not corrected, banks will sustain some loss.
(2) Doubtful Assets: With effect from March 31, 2005, an asset would be classified as doubtful if it
has remained in the sub-standard category for a period of 12 months. Accordingly, aloan
classified as doubtful has all the weaknesses inherent in assets that were classified as substandard
with some additional risk.
Master Circular –Prudential Norms on Income Recognition, Asset
Classification and Provisioning pertaining to Advances
Non - Performing Assets And Profitability: A Studyof Private Sector Banks In India

22
ISSN No. 2349-7165
UNNAYAN : International Bulletin of Management and EconomicsVolume - IX | July 2018
Non - Performing Assets And Profitability: A Studyof Private Sector Banks In India
(3) Loss Assets:A loss asset is one where loss has been identified by the banks'internal or external
auditor(s) or the RBI inspection but the amount has not been written off completely. Such an asset
is considered uncollectible and is of such a little value that its continuance as a bankable asset is
not acceptable although it may have some salvage value.
CONTRIBUTING FACTORS TO NPAs
Some of the factors that contribute towards NPAs of the can be summarized as under:
1. Banks diversify funds for expansion, modernization and at times for helping their associate
banks. If this diversification of funds is coupled with recession then banks fail to tap adequate
capital from financial markets thereby contributing towards rise in non-performing assets.
2. Use of outdated technology, inappropriate machinery, technical problems, inefficient
management, business failures also lead to rise in NPAs.
3. Natural calamities, strained foreign relations, recession in foreign countries can also make assets
non-performing.
4. Poor execution of project can lead to time and cost overrun which becomes one of the reasons
behind NPAs of banks.
5. Any major change in government's financial policy affect competitiveness and profitability of
banks.
6. Inefficient management of banks, delay in releasing funds, subsidies and grants by the
government impact the success of banks.
7. Inappropriate and quick analysis of financial credibility of borrowers by banks is a prime reason
behind losses of banks. They either fail to recognize early warning signals or cause delay in
taking any corrective action for the assets that have become sub-standard or doubtful.
8. Bad economic conditions,rising prices, scarcity of raw material, power shortage cause more
number of dues.
9. Banks sometimes grant loan on the basis of instructions of government ignoring their own
financial interest as banks are sometimes bound to direct funds towards priority sector.
10. Management disputes, frauds, willful defaults, mismatching of funds,siphoning of funds also lead
to rise in the level of non-performing assets.
LITERATURE REVIEW
An attempt has been made here to provide a brief review of the relevant studies.
Reddy(2002)studied how other Asian countries had tackledthe problem of non-performing assets.The
country wise analysis was done among People's Republic of China (PRC), Thailand, Japan, Korea and
India to identify the differences among causes of NPAs and mechanism to solve the problem.Analysis
propounded that in terms of asset quality,financial health of Indian banking system has made evident
progress but still there is a need to learn from the foreign experiences so that an effective tailor-made
policy for better handling NPAs can be developed for India.
Bodla and Verma (2006)conducted a study titled “Determinants of Profitability of Banks in India: A
Multivariate Analysis” in context of public sector banks during the period of 1991-2004.In this study,
after conducting step-wise multivariate regression on time-based data it was establishedthat net profit of a
public sector bank is significantly affected by non-interest income, operating expenses, provisions and
contingencies spread.

23
ISSN No. 2349-7165
UNNAYAN : International Bulletin of Management and EconomicsVolume - IX | July 2018
Non - Performing Assets And Profitability: A Studyof Private Sector Banks In India
Dasand Ghosh (2006)investigated the performance of Indian commercial banking sector during the post-
reform period – 1992–2002. Non-parametric Data Envelopment Analysis (DEA) technique was used to
evaluate various efficiency estimates of individual banks. Variations in calculated efficiencies was linked
to a set of variables, i.e., bank size, ownership, capital adequacy ratio, non-performing loans and
management quality. It was witnessed that level of technical efficiency is more in medium-sized public
sector banks. A high degree of association was detectedamong efficiency and soundness as determined by
banks' capital adequacy ratio. The empirical results revealed that banks withless non-performing loans are
precisely efficient.
Vallabh et. al.(2007) studied the NPAs ofpublic, private, and foreign sector banks in India, by using model
that comprised of two broad sets of factors. One such factor setwas macroeconomic factors which
included GDP growth rate and excise duty and another set used in the model included bankspecific
parameters, such as Credit Deposit Ratio (CDR), loan exposure to priority sector, Capital Adequacy Ratio
(CAR), and liquidity risk. The results revealed that over the years movement in NPAs is effected by the
factors considered in the model. The factors incorporated in the model explained 97.1% and 76.9 % of
variations in NPAs of public and private banksrespectively. It was also observed that banks' that lended to
priority sector had lesser amount of NPAs.
Malyadri (2011) observed movement of NPAs in public as well as private sector banks during 2004-
10using compounded annual growth rate (CAGR) and percentage method. The researcher spotted that
NPAs have declined during the period of study leading to a conclusionthat management of NPAs in public
and private sector banks have improved over the years.
Balasubramaniam (2012) studied NPAsof selected public sector banks in conjunction with a few private
sector banks and established that magnitude of NPAs is high in all banks but appropriate efforts are being
initiated by banks to reduce themby means of implementing curative measures like better credit appraisal
procedures and effective internal control techniquesalong with the efforts to upgrade asset quality. The
study also provided suggestions regarding implementation of Basel III norms in public as well as private
sector banks.
Rajput, Gupta and Chauhan (2012) studied magnitude of NPAs in public sector banks and its impact on
banks' profitability.Throughthe analysis, authors observed that performance of banks is significantly
affected by NPAs as there exists an inverse relationship between profitability measure and NPAs of public
sector banks.
Srivastava and Bansal(2012)compared the trend and magnitude of NPAs and advances in public, private
and foreign banks using Gross NPAs and Gross Advances for the period of 2007-12.Through this study, it
was discovered thatstakeof public sector banks in total advances of the economy is nearly two-thirds.
Kumar (2013)in his study on “A Comparative study of NPAs of Old Private Sector Banks and Foreign
Banks”, has established that NPAs have become a matter of concern for old private sector banks and
foreign banks in the past several years.
NarulaandSingla (2014) in their study titled “Empirical study on non-performing assets of bank.”
assessed the impact of non–performing assets on the profitability with special reference to Punjab
National Bank (PNB).Further, relationship between total advances, Net profits, gross NPAsand
netNPAswas measured and it wasestablished that there existsa direct relationamongnet profits and NPAs
of PNB according to which any increase in profits will also increase NPAs of the bank.
Borse (2016) made an attempt to study the correlation between Net NPA and ROA of 11 major Indian
commercial Banks. Among selected sample of commercial banks there were 6 Public sector banks and 5

24
ISSN No. 2349-7165
UNNAYAN : International Bulletin of Management and EconomicsVolume - IX | July 2018
Non - Performing Assets And Profitability: A Studyof Private Sector Banks In India
Private sector banks. Period of study selected was 2010-11 and 2014-15.It was found that NPA increases
at a higher rate in public sector banks when compared to private sector banks. In this study a moderate
negative correlation between NPA and ROA was witnessed.
Jayakkodi and Rengarajan (2016) attempted to analyze the trend of NPA of selected private and public
sector banks. Author also studied the relationship between Gross NPA ratio and ROA of selected
banks.Study of period ranged from 2010-2015. The data was analyzedusing various ratios along with
correlation analysis. A high degree of negative correlation was found between GNPA ratio with ROA of
PNB, BOB, BOI, ICICI and HDFC .Whereas positive correlation was observed between GNPA ratio and
ROA of SBI, AXIS and FEDERAL Bank. Major reason identified behind different relationship among
GNPA Ratio and ROA of different banks was choice of customers. Through, analysis private sector banks
were found to be more efficient than the public sector banks.
The above literature review indicates that the problem of NPAs have been studied over the years to bring
insight into its causes, consequences and the probable solution. Although abundance of literature is
available on non-performing assets of public sector banks (PSBs), yetquite limited asregards NPAs of
private sector banks in India.Thus, present study aims to give insight towards the trend of non-performing
assets of private sector banks and also attempts to scrutinize its impact on the profitability of the latter.
OBJECTIVES OF THE STUDY
Objectives of the study are as follows;
1. To analyze and interpret trend of NPAs in 'Private Sector Banks of India'during 2001-16.
2. To scrutinize the impact of Gross NPA Ratio on the profitability (ROA) of private sector banks.
3. To examine the impact of Net NPA Ratio on the profitability (ROA) of private sector banks.
RESEARCH METHODOLOGY
Present study has been conducted in the context of privatesector banks of India. To analyze the trend of
NPAs in private sector banks period of study taken is from the year 2001 to16. Robust database of the
RBI and various RBI publications,particularly the annual reports on trend and progress of banking in
India and statistical tables relating to Indian banks has been used as a source of data for the purpose of
empirical analysis.Further,'Correlation Analysis' and 'Regression Technique' has been used to measure the
relationship and impact of NPAs on the profitability of Indian private sector banks.
The measure for non-performing assets used in the study are:
Gross NPA to Gross Advances ratio,also referred as 'Gross NPAratio',Net NPA to Net Advances
ratioreferred as 'Net NPA ratio'and Return on Assets(ROA) as a measure of profitability of private sector
banks. Profitability measure has been used as dependent variable in the study while measures of NPAs
has been used as independent variable in the regression model.
Regression Model was formed as below:
Y= ROA
X1=Gross NPA ratio
X2= Net NPA ratio
Here ROA is dependent variable and Gross NPA ratio and Net NPA ratio are independent variable.

25
ISSN No. 2349-7165
UNNAYAN : International Bulletin of Management and EconomicsVolume - IX | July 2018
Non - Performing Assets And Profitability: A Studyof Private Sector Banks In India
HYPOTHESES
The following null hypotheses were formulated and tested for the current study:
H : There is no relationship betweengrossNPA ratio and return on assets (ROA)of private sector banks 01
operating in India
H : There is no relationship between netNPA ratio and return on assets(ROA) of private sector banks 02
operating in India.
ANALYSIS AND INTERPRETATION
a) Trend of Gross and Net NPAs in the study period (from 2001-02 to2015-16)
Non-Performing Assets (NPAs) have been defined as loans or advances in respect of which payment of
interest or principal or both have remained unpaid as per agreed terms of the loan contract for more than
90 days. The definition of NPAs in theIndia is largely based on the status of loan repayment. NPAs are
reported in terms of Gross NPAs and Net NPAs.“Gross NPAs is the amount outstanding in the borrower's
account, in books of the bank besides the interest which has been accrued but not debited to the borrowers
account” whereas “Net NPAs is the amount of gross NPAs less (1) interest debited to borrowers and not
recovered and not recognized as income and kept in interest suspense (2) amount of provisions held in
respect of NPAs and (3) amount of claim received and not appropriated”.RBI has directed the banks to
compute their gross advances, net advances, gross NPAs and net NPAs as per the above format with effect
from September 2009.Due to the requirement of provisioning, NPAsnot only affects banks profitability
but also impact banks' ability to strengthen their capital position adversely.Hence, it is anticipated of the
banks to maintain high asset quality.
TABLE 1: Gross and Net NPAsof Private Sector Banks
(Amount in INR 100 Crores)
Year
Gross Advances
Gross NPAs
Gross NPA Ratio
Net Advances
Net NPAs
Net NPA Ratio
2001-02 1209.58 116.62 9.64 1164.73 66.76 5.73
2002-03 1460.47 117.82 8.07 1389.51 68.82 4.95 2003-04
1774.19
103.81
5.85
1707.54
48.58
2.85
2004-05
1978.32
87.82
4.44
1913.97
42.12
2.20
2005-06
3176.9
78.11
2.46
3129.62
31.71
1.01
2006-07
4201.45
92.56
2.20
4147.52
40.28
0.97
2007-08
5258.45
129.97
2.47
5184.03
56.47
1.09
2008-09
5850.65
169.26
2.89
5753.28
74.11
1.29
2009-10
6440.7
176.39
2.74
6324.94
65.05
1.03
2010-11
7323.1
181
2.47
7975.33
43
0.54
2011-12
8804.46
183.15
2.08
9664.02
43.35
0.45
2012-13
11591.43
207.63
1.79
11432.48
59.06
0.52
2013-14 13602.53 245.42 1.80 13428.35 88.61 0.66
2014-15 16073.39 341.06 2.12 15842.85 141.28 0.89
2015-16 19726.59 561.85 2.85 19393.09 266.77 1.38
(Source: RBI Publications)

26
ISSN No. 2349-7165
UNNAYAN : International Bulletin of Management and EconomicsVolume - IX | July 2018
Non - Performing Assets And Profitability: A Studyof Private Sector Banks In India
Over the years non-performing assets of Indian private sector banks have declined regularly. As exhibited
in Table 1, GrossNPA ratio reduced from 9.64% in 2001-02 to 2.85% in 2015-16, whereas, Net NPA ratio
reduced from 5.73% in 2001-02 to 1.38% in 2015-16.
The above analysis shows a diminishing trend inrespect of Gross NPA and Net NPAratio which enable us
to conclude that NPAs are declining over the years, which is a strongsign that effectivemeasures are being
adopted by the banks to control the risk created by NPAs. Growth of NPAs is a setback for any economy
thus it becomes imperative to control them. Non-performing assets distress the liquidity position of the
bank and develop a disparity among assets and liability which cause bank to raise resources at a high cost.
Rise in NPAs may spill over the banking system which can contract the money supply, and further affect
banks liquidity along with profitability.
B) Relationship between NPAs and Profitability of banks
To interpret the relationship between NPAs and profitability of banks Karl Pearson's Coefficient of
Correlation has been calculated using three ratios, two out of which are related to NPAs. These ratios are
Gross NPA ratio and Net NPA ratio along with ROA (Return on Assets).
Results of Correlation Analysis are as under:
27
ISSN No. 2349-7165
UNNAYAN : International Bulletin of Management and EconomicsVolume - IX | July 2018
Non - Performing Assets And Profitability: A Studyof Private Sector Banks In India
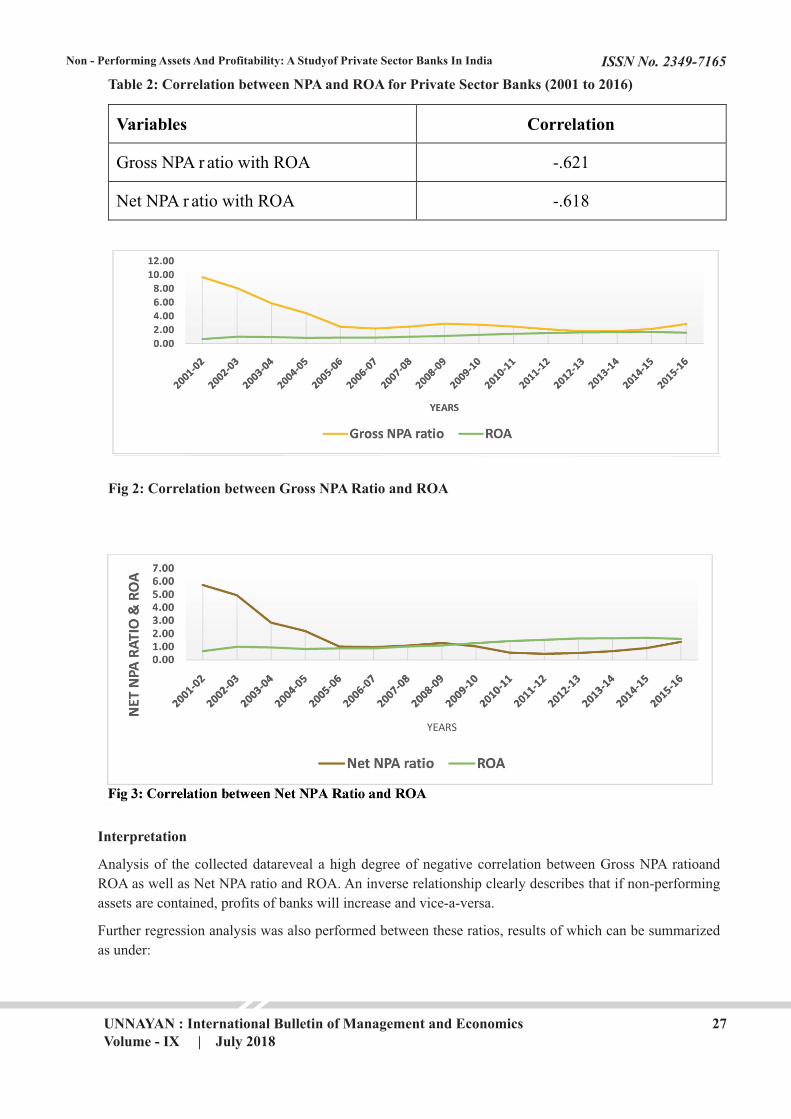
Table 2: Correlation between NPA and ROA for Private Sector Banks (2001 to 2016)
Variables Correlation
Gross NPA r atio with ROA -.621
Net NPA r atio with ROA -.618
Fig 2: Correlation between Gross NPA Ratio and ROA
Interpretation
Analysis of the collected datareveal a high degree of negative correlation between Gross NPA ratioand
ROA as well as Net NPA ratio and ROA. An inverse relationship clearly describes that if non-performing
assets are contained, profits of banks will increase and vice-a-versa.
Further regression analysis was also performed between these ratios, results of which can be summarized
as under:
28
ISSN No. 2349-7165
UNNAYAN : International Bulletin of Management and EconomicsVolume - IX | July 2018
Non - Performing Assets And Profitability: A Studyof Private Sector Banks In India
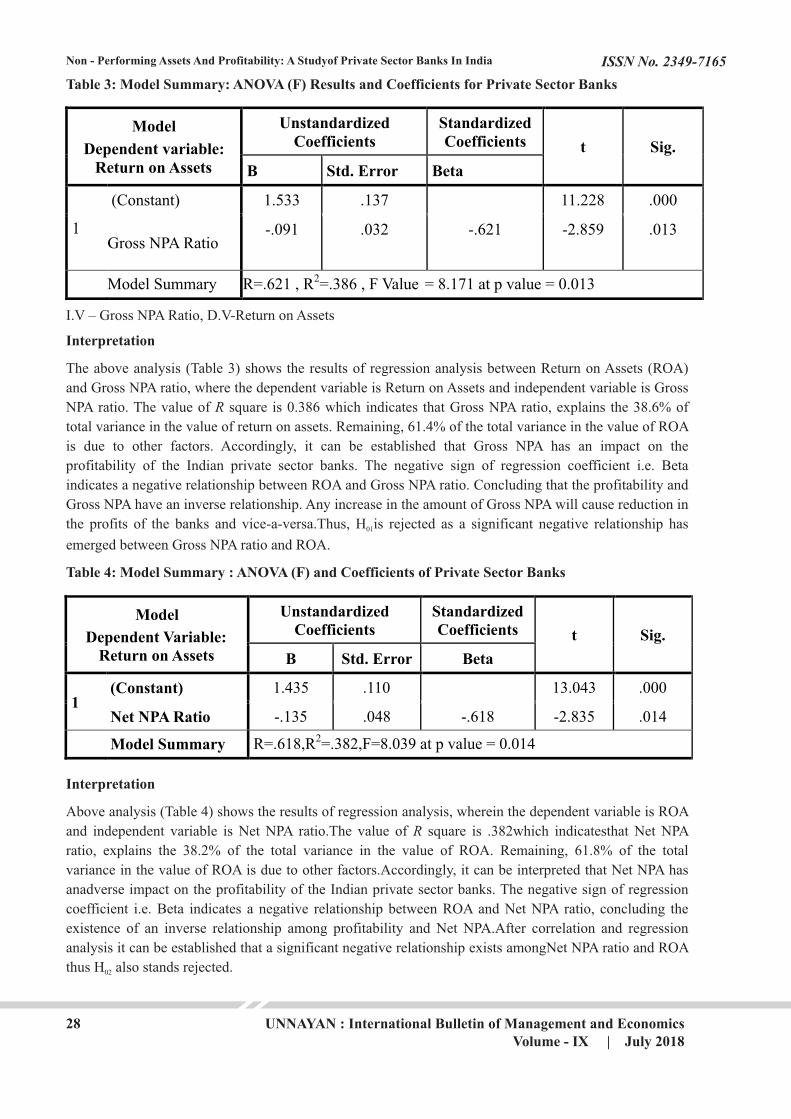
Table 3: Model Summary: ANOVA (F) Results and Coefficients for Private Sector Banks
Model
Dependent variable: Return on Assets
Unstandardized Coefficients
Standardized Coefficients
t Sig.
B Std. Error Beta
1
(Constant) 1.533 .137 11.228 .000
Gross NPA Ratio -.091 .032 -.621 -2.859 .013
Model Summary R=.621 , R2=.386 , F Value = 8.171 at p value = 0.013
I.V – Gross NPA Ratio, D.V-Return on Assets
Interpretation
The above analysis (Table 3) shows the results of regression analysis between Return on Assets (ROA)
and Gross NPA ratio, where the dependent variable is Return on Assets and independent variable is Gross
NPA ratio. The value of R square is 0.386 which indicates that Gross NPA ratio, explains the 38.6% of
total variance in the value of return on assets. Remaining, 61.4% of the total variance in the value of ROA
is due to other factors. Accordingly, it can be established that Gross NPA has an impact on the
profitability of the Indian private sector banks. The negative sign of regression coefficient i.e. Beta
indicates a negative relationship between ROA and Gross NPA ratio. Concluding that the profitability and
Gross NPA have an inverse relationship. Any increase in the amount of Gross NPA will cause reduction in
the profits of the banks and vice-a-versa.Thus, H is rejected as a significant negative relationship has 01
emerged between Gross NPA ratio and ROA.
Table 4: Model Summary : ANOVA (F) and Coefficients of Private Sector Banks
Model
Dependent Variable: Return on Assets
Unstandardized Coefficients
Standardized Coefficients
t Sig.
B Std. Error Beta
1 (Constant) 1.435 .110 13.043 .000
Net NPA Ratio -.135 .048 -.618 -2.835 .014
Model Summary R=.618,R2=.382,F=8.039 at p value = 0.014
Interpretation
Above analysis (Table 4) shows the results of regression analysis, wherein the dependent variable is ROA
and independent variable is Net NPA ratio.The value of R square is .382which indicatesthat Net NPA
ratio, explains the 38.2% of the total variance in the value of ROA. Remaining, 61.8% of the total
variance in the value of ROA is due to other factors.Accordingly, it can be interpreted that Net NPA has
anadverse impact on the profitability of the Indian private sector banks. The negative sign of regression
coefficient i.e. Beta indicates a negative relationship between ROA and Net NPA ratio, concluding the
existence of an inverse relationship among profitability and Net NPA.After correlation and regression
analysis it can be established that a significant negative relationship exists amongNet NPA ratio and ROA
thus H also stands rejected.02

29
ISSN No. 2349-7165
UNNAYAN : International Bulletin of Management and EconomicsVolume - IX | July 2018
Non - Performing Assets And Profitability: A Studyof Private Sector Banks In India
FINDINGS
On analyzing the trend of NPAs in private sector banks it was observed that non-performing assets has
reduced over the years indicating better management practices being adopted by banks. Further, negative
relationship was witnessed between both the NPA Ratios (GNPA Ratio & NNPA Ratio) and ROAleading
to the rejection of both the null hypotheses which says that there is no relationship between GNPA
Ratio,NNPA Ratio and ROA.Existence of negative relationship between NPA Ratios and ROA makes it
necessary to adequately manage the NPAs.
CONCLUSION
The present study intended to assess the impact of NPAs on the profitability of the Indian banking
industry with special reference to private sector banks. The analysis was conducted for a period of 15
years i.e. from 2001 to 2016.Statistical analysis was done using correlation and regression techniques
whereby the hypotheses were tested and it was discovered that significant negative relationship exists
between NPAs and ROA. Moreover, a diminishing trend in the ratios of non-performing assets of private
sector banks i.e. Gross NPA ratio and Net NPA ratiowas also witnessed. This warrants that the banks
should manage the level of NPAsadequately as it can affect the interest of various stakeholders
aversely.Notwithstanding non-performing assets are an inevitable burden for banking industry of a nation,
they should be contained as they can impact the profitability of banks.Thus, it becomes imperativeto
change the curve of NPAs by devising and executing effective monitoring policy, duly supported by legal
and regulatory framework of the state to keepthe NPAs under control.Although, achieving
completeeradication of NPAs may sound difficult in the banking industry, effective measures can be
adopted to lessen the extent of NPAs.
REFERENCES
Balasubramaniam, C. S. (2012). Non-performing assets and profitability of commercial banks in India:
assessment and emerging issues. National Monthly Refereed Journal of Research in Commerce &
Management, June, volume, (1), 41-52.
Bodla, B. S., & Verma, R. (2006). Determinants of profitability of banks in India: A multivariate analysis.
Journal of Services Research,6(2), 75.
Bhayani , S. (2006). Performance of the new Indian private sector banks: A comparative Study. Journal of
Management Research, 5(11), 53-70.
Borse, N. B.(2016) Study of the Effect of Non-Performing Assets (NPA) and Return on Assets(ROA) of
Major Indian Commercial Banks. International Journal in Management and Social Science,4(1),222-27
Das, A., & Ghosh, S. (2006). Financial deregulation and efficiency: An empirical analysis of Indian banks
during the post reform period. Review of Financial Economics, 15(3), 193-221.
Jayakkodi,D. & Rengarajan,P.(2016). Impact of non-performing assets on return on assets of public and
private sector banks in India. International Journal of Applied Research, 2(9), 696-702
Joseph, A. L., & Prakash, M. (2014). A Study on Analyzing the Trend of NPA Level in Private Sector
Banks and Public Sector Banks. International Journal of Scientific and Research Publications, 4(7), 1-9.
Kumar, R. (2000). NPA management for better banking. In Proceedings of the Bank Economist
Conference, 2000, 68-73.
Kumar, P.T.(2013), “A Comparative study of NPA of Old Private Sector Banks and Foreign Banks”,
Research Journal of Management Sciences,2(7), 38-40

30
ISSN No. 2349-7165
UNNAYAN : International Bulletin of Management and EconomicsVolume - IX | July 2018
Non - Performing Assets And Profitability: A Studyof Private Sector Banks In India
Malyadri, P., & Sirisha, S. (2011). A Comparative Study of Non-Performing Assets in Indian Banking
Industry. International Journal of Economic Practices and Theories,1(2), 77-87.
Narula, M. S. D. S., & Singla, M. (2014). Empirical study on non-performing assets of bank.
International journal of advance research in computer science and management studies, 2(1).
Rajput, N., Gupta, M., & Chauhan, A. K. (2012). Profitability and credit culture of NPAs: An empirical
analysis of PSBs. International Journal of Marketing, Financial Services and Management
Research,1(9), 91-109.
Reddy, (2002), “A comparative study on NPA in India in the Global Context”, Retrieved from:
( ).
Srivastava, V., & Bansal, D,(2012) A Study of trends of Non-Performing Assets in Private Banks in India,
International Journal in Multidisciplinary and Academic Research (SSIJMAR),2(2).
Vallabh, G., Bhatia, A., & Mishra, S. (2007). Non-performing assets of Indian public, private and foreign
sector banks: An empirical assessment. The IUP Journal of Bank Management, 6(3), 7-28.
Internet source
https://papers.ssrn.com/sol3/papers.cfm?abstract_id=361322
https://www.rbi.org.in/scripts/AnnualPublications.aspx?head=T rend+and+Progress+of+Banking+in+Indi
a#
https://rbidocs.rbi.org.in/rdocs/Publications/PDFs/0FLTP577BF4E172064685A26A73A6BC9210EC.PD
F-
https://rbi.org.in/scripts/BS_ViewMasCirculardetails.aspx?id=9908#2a
https://rbi.org.in/scripts/BS_ViewMasCirculardetails.aspx?id=7357