issn no. 0974-035x an indexed, refereed & peer reviewed
TRANSCRIPT

March, 2018. VOL.10. ISSUE NO. 1 www.hrdcgujarat.ac.in Page | 7
AN ANALYSIS OF POWER SECTOR REFORMS IN INDIA AND CANADA
Prof. Dr. Hetal B. Chokshi
❖ Power Sector scenario of India and Canada: Canada:
The electricity generation in Canada uses natural resources more. At present too,
almost 65% of electricity is generated by hydro plants. The Nelson Electric Light
Company, the first company to build a hydro site in British Columbia commenced its
operation producing power for the City of Nelson on February 1, 1896. The Sandon
plant was the second in March 1897. Development of the electricity sector gathered
momentum after the First World War with the creation of provincial utilities in Nova
Scotia, New Brunswick, Manitoba, Saskatchewan and British Columbia in the 1920s.
Publicly owned electric companies emphasised mainly on rural electrification and
hydroelectric development. In Manitoba and British Columbia, private companies
repaidly developed the hydropower. Since 1960, large hydroelectric projects, mainly
in Quebec, British Columbia, Manitoba and Newfoundland and Labrador,
significantly increased the country's generation capacity
Hydroelectric mega-projects were undertaken by most provinces during the 1960s
and 1970s. Many hydro power stations were started during this period like BC
Hydro developed power stations along the Peace and Columbia Rivers, Manitoba
Hydro undertook the Nelson River Hydroelectric Project, In Labrador, the
controversial Churchill Falls Generating Station was built after 20 years of
negotiations, and NB Power undertook the construction of the Mactaquac Dam,
near Fredericton. But hydroelectric development was most active in Quebec.
Between 1965 and 1984, Hydro-Quebec built 7 large power stations on
the Manicouagan and Outardes rivers while the first 3 plants of the 16,000-
MW James Bay Project were built on La Grande River. The 5 plants of the second
phase were commissioned between 1987 and 1996.
The homes, offices and factories of Canada are large users of electricity or hydro
which is often called in many regions of Canada. In 2007, per capita power
consumption of Canada was among the highest in the world, with an average of
16,995 kWh per annum.
Canada is the world's second-largest producer of hydroelectricity after China,[which
accounted for 58% of all electric generation in 2007which is now approximately 65%.
Canada is the world's sixth-largest producer of electricity generated by nuclear power,
producing 97 billion kWh in 2013
ISSN No. 0974-035X
An Indexed, Refereed & Peer Reviewed Journal of Higher Education
Towards Excellence UGC-HUMAN RESOURCE DEVELOPMENT CENTRE,
GUJARAT UNIVERSITY, AHMEDABAD, INDIA

Towards Excellence: An Indexed, Refereed & Peer Reviewed Journal of Higher Education / Prof.
Dr. Hetal Chokshi / Page 7-25
March, 2018. VOL.10. ISSUE NO. 1 www.hrdcgujarat.ac.in Page | 8
Canada has a long nuclear history. The first Canadian nuclear reactor, the ZEEP, was
built in 1945. Two years later, the National Research Council of Canada began
operations on the NRX (National Research Experimental) heavy-water reactor
at Chalk River Laboratories, near Ottawa. In 1957, it was followed by the National
Research Universal Reactor (NRU).
In the meantime, Ontario Hydro, Canadian General Electric and Atomic Energy of
Canada Limited began working on an experimental nuclear power plant. The 22 MW
reactor generated Canada's first nuclear energy to the grid on June 4, 1962.
The first full-scale nuclear power plant, the Douglas Point Nuclear Generating
Station, started commercial service on September 26, 1968. Douglas Point generated
220 MW and was built for $91 million. The CANDU reactor was then built at three
locations in Ontario in the next 25 years, in Pickering, Bruce County and Clarington.
On the 20 nuclear reactors operational in Canada, only two are located outside
Ontario. In Ontario, Canadian-designed CANDU nuclear reactors supplied more than
half the provincial electricity demand in 2007. Ontario became the first jurisdiction
in North America to fully eliminate coal as a source of electricity generation In April
2014.
64.5% of Canadian domestic electricity use was produced with the renewable sources
in the year 2009. Canada is the 4th highest in the world for renewable energy
production. However, these figures do not indicate provincial generation mixes.
Historic producers of coal, like Alberta (66.9%), Nova Scotia (58.2%), and
Saskatchewan (54.8%) rely mainly on coal-fired generating stations. The hydro-rich
provinces are such as Manitoba (99.5%), Quebec (97.2%), Yukon (94.1%), and
British Columbia (88.7%), hydroelectric power accounts for the bulk of all electric
generation.
Under government leadership, provincial power companies invested heavily in the
power sector to stimulate economic development. The power sector has been
deregulated there for the same.
The liberalization process of the 1990s have changed some parameters such as the
unbundling of generation, transmission and distribution functions of incumbent
utilities to grow a competitive wholesale market. In the cases of large exporters like
Quebec and British Columbia, have to comply with the Order 888 of the Federal
Energy Regulatory Commission and other U.S. market rules. Most provincial
governments still maintain a strong financial stake as operators in the electrical
markets.
India:
The first demonstration of an electric light in Calcutta (now Kolkata) was conducted
on 24 July 1879 by P.W. Fleury & Co. Kilburn & Co. The company was renamed as
the Calcutta Electric Supply Corporation later. The control of the company was
transferred from London to Calcutta in 1970. Motivated by the success of electricity
in Calcutta, power was thereafter introduced in Bombay (now Mumbai) which saw
electric lighting demonstration for the first time in 1882 at Crawford Market and

Towards Excellence: An Indexed, Refereed & Peer Reviewed Journal of Higher Education / Prof.
Dr. Hetal Chokshi / Page 7-25
March, 2018. VOL.10. ISSUE NO. 1 www.hrdcgujarat.ac.in Page | 9
the Bombay Electric Supply & Tramways Company (BEST). It set up a generating
station to provide electricity for the tramway in 1905.
The first hydroelectric installation in India was installed near a tea estate
at Sidrapong for the Darjeeling Municipality in 1897. The hydro-electric
power plants at Darjeeling and Shivanasamudram were established in 1898 and 1902
respectively and were among the first in Asia. The first electric street
light in Asia was lit in Bangalore on 5 August 1905. India is blessed with immense
amount of hydro-electric potential and was ranked 5th in terms of exploitable hydro-
potential on global scenario in the year 2014
The installed capacity of hydro on 31 May 2014 was approximately 40,661.41 MW
which was 16.36% of total electricity generation in India with the major share of 97%
of public sector in this sector. National Hydroelectric Power Corporation (NHPC),
Northeast Electric Power Company (NEEPCO), Satluj jal vidyut nigam (SJVNL),
Tehri Hydro Development Corporation, NTPC-Hydro are a few public sector
companies engaged in development of hydroelectric power in India.
The development of wind power in India began in the 1990s by Tamil Nadu Electric
Board near Tuticorin which has significantly increased in the last decade. As of 31
March 2016, the installed capacity of wind power was 26.74 GW, spread across
many states of India.
India has the fifth largest installed wind power capacity in the world. In the year
2015-16, wind power accounted for 8.5% of India's total installed power capacity,
and 2.5% of the country's power output. India targets to install an additional 60 GW
of wind power capacity by 2022.
India is endowed with vast solar energy. As of 31 January 2017, the installed capacity
was 9 GW indicating 1% of the utility electricity generation. New solar installations
in India are expected to be 4.8 GW in 2016-17 with nearly 21 GW developments in
pipeline.
India started utilizing grid management on a regional basis in the 1960s. Individual
State grids were interconnected to form 5 regional grids covering mainland India.
Those grids were the Northern, Eastern, Western, North Eastern and Southern Grids.
In the 1990s, the Indian government began planning for a national grid. The first
interconnection of regional grids was established in October 1991 when the North
Eastern and Eastern grids were interconnected
The Ministry of Power is India's apex central government body regulating the
electrical energy sector in India. This ministry was created on 2 July 1992. The
renewable energy programme was initiated in the country after the setting up of the
CASE (Commission on Additional Sources of Energy) in 1981 and the DNES
(Department of Non conventional Energy Sources) in 1982. State nodal agencies
were established in several states to co-ordinate, implement, and facilitate renewable
energy programmes. IREDA (Indian Renewable Energy Development Agency) was
set up in 1987 to finance renewable energy projects. A full-fledged Ministry, the
MNES (Ministry of Non- Conventional Energy Sources) was formed in 1992 to
promote renewable energy development and utilisation in the country. As a result,

Towards Excellence: An Indexed, Refereed & Peer Reviewed Journal of Higher Education / Prof.
Dr. Hetal Chokshi / Page 7-25
March, 2018. VOL.10. ISSUE NO. 1 www.hrdcgujarat.ac.in Page | 10
India has many achievements in several areas in the renewable energy field. India is
on the 7th rank in the world for renewable energy production
Renewable energy projects in India are regulated and championed by the central
government’s Ministry of New and Renewable Energy.
❖ Growth of electricity sector in both the countries:
Canada
Canada generated 651.8 terawatt-hours (TWh) in 2013, showing 10% increase since
2003. In 2013, the leading type of power generation by utilities in Canada
was hydroelectricity, with a share of 60.1%. followed by Nuclear (15.8%), natural
gas (10.3%), coal (10%), wind (1.8%), fuel oil (1.2%), biofuels and waste (0. 8%),
wood (0.4%) and solar (0.1%) . Other sources, such as petroleum coke make up the
remaining 0.5%. When adding nuclear energy, it showed that over 77 percent of
Canada’s electricity generation does not emit greenhouse gases. Moreover, Canada
exports large quantities of electricity to the United States, which is primarily
hydroelectricity with reservoir storage
The following data shows the total electricity generation of Canada from the year
2001-2013.
Total Electricity Generated (GWh)a 569,402 581,068 569,917 580,444 604,370 592,636 614,583 Electricity Generated by Energy Source
(GWh)a
Natural Gas 38,899 35,688 35,641 37,154 37,436 40,508 42,233 Diesel Fuel Oil, Light Fuel Oil and
Kerosene 780 723 862 894 932 758 1,031
Heavy Fuel Oil 14,012 13,535 16,937 16,797 14,608 8,960 10,289
Coal 102,742 101,754 100,826 91,792 93,992 87,317 96,808
Hydro 329,881 346,917 334,560 337,606 360,026 351,936 364,877
Nuclear 72,320 71,252 70,652 85,240 86,830 92,419 88,191
Wood and Other 4,306 4,434 4,324 4,232 4,164 4,047 4,392 Petroleum Coke, Still Gas, Coke and
Coke Oven Gas1 6,462 6,765 6,114 6,730 6,383 6,691 6,762 Source: Statistics Canada, Report on Energy Supply and Demand in Canada, 1990–2013, Ottawa, 2015.
Total Electricity Generated (GWh)a 614,926 588,906 579,366 608,181 619,810 622,884 Electricity Generated by Energy Source
(GWh)a
Natural Gas 39,070 41,082 47,807 56,479 57,317 54,145 Diesel Fuel Oil, Light Fuel Oil and
Kerosene 979 1,071 1,085 1,052 1,035 1,072
Heavy Fuel Oil 8,332 8,243 5,357 4,570 4,655 4,931
Coal 90,987 76,367 77,869 72,838 63,080 63,964
Hydro 373,822 365,108 348,110 372,077 390,838 402,275
Nuclear 90,585 84,992 85,527 88,291 89,492 82,378
Wood and Other 4,147 4,747 5,361 9,674 10,408 10,589
Petroleum Coke, Still Gas, Coke and 7,004 7,295 8,251 3,199 2,986 3,530
Year 2001 2002 2003 2004 2005 2006 2007
Year 2008 2009 2010 2011 2012 2013

Towards Excellence: An Indexed, Refereed & Peer Reviewed Journal of Higher Education / Prof.
Dr. Hetal Chokshi / Page 7-25
March, 2018. VOL.10. ISSUE NO. 1 www.hrdcgujarat.ac.in Page | 11
Coke Oven Gas1
Source: Statistics Canada, Report on Energy Supply and Demand in Canada, 1990–2013, Ottawa, 2015.
India: The total installed electricity capacity of India after deducting the retired capacity (if
any) which are very old and obsolete as of 31 June 2016, including thermal power
generation capacity and excluding renewable power was 82,415 MW against the
target of 155,870 MW during the 12th five-year plan which would end on 31 March
2017.
The installed captive power generation capacity (above 1 MW capacity) in the
industries was 47,200 MW as on 31 March 2016. Another 75,000 MW capacity
diesel power generation sets (excluding sets of size above 1 MW and below 100
kVA) have been also installed in the country. In addition, there are innumerable DG
sets of capacity less than 100 kVA to cater to emergency power needs during
the power outages in all sectors such as industrial, commercial, domestic and
agriculture.
The following data indicates the total installed electricity generatrion in India from
the year 2001-2011.
Year Thermal
*
Hydro Nuclear Total Non-
utilities
Grand
Total
% Share of
generation
of electricity in utility
to total electricity
generation
% Annual growth
electricity
generation
2000-01 409940 74362 16902 501204 59638 560842 89.37 4.55
2001-02 424385 73579 19475 517439 61681 579120 89.35 3.26
2002-03 449289 64014 19390 532693 63850 596543 89.30 3.01
2003-04 472080 75242 17780 565102 68173 633275 89.23 6.16
2004-05 492835 84610 17011 594456 71417 665873 89.27 5.15
2005-06 505001 101494 17324 623819 73640 697459 89.44 4.74
2006-07 538350 113502 18802 670654 81800 752454 89.13 7.89
2007-08 585282 120387 16957 722626 90477 813102 88.87 8.06
2008-09 617832 113081 14713 745626 95905 842531 88.50 3.62
2009-10 670965 106680 18636 796281 109693 905974 87.89 7.53
2010-
11(P) 704323 114257 26266 844846 114224 959070 88.09 5.86
Source : The Governement of India from www.data.gov.in
❖ Renewable electricity production in India and Canada: Canada’s electricity generation includes more on renewable energy side while in
India it is growing. Compared to China, the renewable energy production of the total
energy is quite less which can be seen from the following table.
Renewable elelctircity produced as of % of of total electricity production year in India in Canada
1991 24.48929396 62.37871882
1992 22.80740221 61.41041299
1993 20.75265214 61.67921442
1994 19.55881334 61.72232798

Towards Excellence: An Indexed, Refereed & Peer Reviewed Journal of Higher Education / Prof.
Dr. Hetal Chokshi / Page 7-25
March, 2018. VOL.10. ISSUE NO. 1 www.hrdcgujarat.ac.in Page | 12
1995 21.21909967 60.40045134
1996 17.26053911 61.00409818
1997 15.76729394 63.10607423
1998 16.01513081 62.35094142
1999 16.70110829 60.40605432
2000 15.25807575 61.18370484
2001 13.59094803 60.60030119
2002 13.20704353 58.03265624
2003 12.05516116 59.88641921
2004 13.46942476 58.91556496
2005 14.4825005 58.44631709
2006 16.61901808 59.63563628
2007 17.54042472 59.61839537
2008 17.86408569 60.0250196
2009 16.50983374 61.13106575
2010 15.66005525 62.59320494
2011 16.04374444 61.26763484
2012 17.31689839 61.95213565
2013 15.62123639 63.24845745
Source: The worldbank retrived from http://data.worldbank.org/indicator/REG.ELEC.
❖ An analysis of power sector in India and Canada: Canda is a developed country and India is developing countries. The history of
electricity sector shows that both the countries initiated power sector at same time.
Both the countries have implemented many measures to increase the growth and
development of power sector.
Mainly 6 points have been considered to compare power sector performance in both
the countries. They are
1. Total electricity generation
2. Renewable energy production
3. Per capita electricity consumption
4. Access of electricity to population
5. Co2 emission from energy sector
6. Transmission and distribution losses
The performance of power sector between India and Canada can be compared by
following data
• Total electiricty generation in both the countries
year Total in India in
Gwh
total in Canada
2001 501204 569,402
2002 517439 581,068
2003 532693 569,917
2004 565102 580,444
2005 594456 604,370
2006 623819 592,636
2007 670654 614,583
2008 722626 614,926

Towards Excellence: An Indexed, Refereed & Peer Reviewed Journal of Higher Education / Prof.
Dr. Hetal Chokshi / Page 7-25
March, 2018. VOL.10. ISSUE NO. 1 www.hrdcgujarat.ac.in Page | 13
Source: Source : The
Governement of India from www.data.gov.in and Statistics Canada, Report on Energy Supply and Demand in Canada, 1990–2013, Ottawa, 2015.
The above table indicates that the production of electricity has increased more in
India compared to Canada between the period 2001-2013.
• Per capita counsumption in KWh:
The following data indicates that though production of electricity has increased in
India, per capital consumption is quite less compared to Canada due to more
population
year in IndiaKWh in canada kwh
1971 97.99059417 9300.717215
1972 100.5276586 9903.776234
1973 100.8556904 10297.94798
1974 104.2248132 10820.67527
1975 114.8167636 10436.94257
1976 124.406065 11043.83876
1977 126.5479235 11762.48109
1978 136.2367266 12231.86054
1979 136.0678597 12384.14961
1980 142.0579095 12763.71325
1981 152.2672038 13196.82731
1982 158.5190351 12937.26688
1983 166.1428653 13409.72659
1984 183.8218471 14290.40542
1985 194.0977967 14800.05397
1986 208.5924097 15302.58739
1987 220.8809087 15736.76083
1988 240.7513611 16326.41755
1989 257.8230059 16402.57131
1990 272.8997419 16109.27998
1991 291.8029859 16104.46973
1992 305.3875353 16080.34644
1993 321.5660742 16235.99151
1994 342.3165272 16325.65728
1995 359.9000978 16503.27042
1996 360.9460365 16572.68325
2009 745626 588,906
2010 796281 579,366
2011 844846 608,181
2012 871,224 619,810
2013 907,040 622,884
2014 961,552 6,39,000
2015 1,043,666 5,92,800

Towards Excellence: An Indexed, Refereed & Peer Reviewed Journal of Higher Education / Prof.
Dr. Hetal Chokshi / Page 7-25
March, 2018. VOL.10. ISSUE NO. 1 www.hrdcgujarat.ac.in Page | 14
1997 376.6451221 16608.55298
1998 387.0335251 16385.40196
1999 393.2069477 16625.3869
2000 394.8025371 16990.57839
2001 394.9535072 16807.14499
2002 411.8229523 16959.60079
2003 431.707988 17191.15419
2004 452.8961733 17235.41178
2005 469.3687485 17012.78163
2006 510.7030141 16560.99591
2007 543.3566224 16771.07783
2008 562.9352825 16459.68647
2009 601.5505835 15537.59153
2010 643.8797543 15341.50262
2011 698.4302265 15738.82487
2012 724.4907458 15322.65853
2013 765.0034087 15519.33597
Source: the World bank retrieved from http://data.worldbank.org/indicator/EG.consu. locations=CA
• Electricity access to % population in India:
Source: The Worldbank retrived from http://data.worldbank.org/indicator/EG.acess.locations=CA
The above data shows that 100% people are having access to electricity in Canada
since 1990 while in India it is not the same.
• Time taken to get electricity
year acess to % population in India acess to % population in canada
1990 50.9 100
2000 62.3 100
2010 75 100
2012 78.7 100
year Time required to get electricity (days) in India Time required to get electricity (days) in Canada
2009 60 169
2010 60 169
2011 60 169
2012 60 142
2013 101.8 142
2014 101.8 142
2015 86.2 137
2016 45.9 137

Towards Excellence: An Indexed, Refereed & Peer Reviewed Journal of Higher Education / Prof.
Dr. Hetal Chokshi / Page 7-25
March, 2018. VOL.10. ISSUE NO. 1 www.hrdcgujarat.ac.in Page | 15
Source : The worlldbank
The above figure says that It takes less time to get electricity in India compared to
Canada.
• CO2 emissions from electricity and heat production, total (% of total
fuel combustion)
year in India
in Canada
1971 21.57583068 23.3985
1972 23.12153968 22.91312
1973 23.926931 22.86924
1974 26.34788973 21.49977
1975 26.97070786 23.21566
1976 28.46515605 23.28982
1977 27.52108775 24.68121
1978 25.08982295 25.06203
1979 27.01247957 24.48828
1980 31.11692051 25.34287
1981 32.18260121 25.58544
1982 33.66285456 28.06608
1983 35.38149694 29.75433
1984 34.58372466 31.02714
1985 38.20521629 30.57312
1986 39.9559514 29.92636
1987 42.500393 31.60509
1988 42.2545996 32.90593
1989 43.17129171 33.45998
1990 43.88750538 32.94353
1991 45.28882286 33.62583
1992 46.93646243 34.26684
1993 49.36218936 32.50455
1994 48.88262227 32.41466
1995 51.62561437 32.84873
1996 52.60225045 32.13591
1997 51.58198732 33.72451
1998 53.03642211 36.25681
1999 53.77984626 35.84303
2000 55.26233184 36.64101
2001 56.04162779 38.21394
2002 55.05721943 37.65193
2003 56.27862135 38.0326
2004 57.01750992 36.46952
2005 55.72961729 37.83118
2006 55.66156771 37.7754
2007 55.41539628 38.99314
2008 54.40156195 37.88022
2009 52.91901076 37.28504

Towards Excellence: An Indexed, Refereed & Peer Reviewed Journal of Higher Education / Prof.
Dr. Hetal Chokshi / Page 7-25
March, 2018. VOL.10. ISSUE NO. 1 www.hrdcgujarat.ac.in Page | 16
2010 52.21603612 37.37482
2011 52.34741643 36.20815
2012 53.84407968 36.60343
2013 52.85558326 36.57704
Source: The Worldbank
It can be said that earlier the CO2 emission was less in India but since the
contribution of renewable energy has increased in Canada while has not increased the
same in India, India shows increasing trend of CO2 emission from energy compared
to Canada.
• Transmission and Distribution loss:
Year T&D loss in India
T&D loss in Canada
1991 19.24411757 7.169478092 1992 18.25873937 7.06044257 1993 18.0163228 6.891717423 1994 17.80084081 6.586427629 1995 18.73271019 7.081543915 1996 20.56402374 7.617174205 1997 20.71579384 6.962343096 1998 22.13077493 6.908407208 1999 25.68169742 7.447166829 2000 27.22068922 7.805698849 2001 28.24195685 7.52229645 2002 26.68001088 8.209655365 2003 26.74018226 6.499112871 2004 25.66334937 6.288081485 2005 25.16558235 8.251871098 2006 23.65556796 8.535023292 2007 22.76850708 7.456771762 2008 21.25537069 8.344765277 2009 20.95394974 8.716966202 2010 19.64007123 8.629299248 2011 19.39441768 8.847334503 2012 18.89775068 8.486184913 2013 18.45502229 8.641501792
Source: The worldbank
The above data indicates that the T&D loss in Canada has remained stable to 6-8%
while in India has been 3 to 4 times higher than Canada.
❖ Research methodology: This paper uses some statistical methods to compare the performance of power sector
between India and Canada. It uses the mean average and T-test or Z-test distribution
method. The data used for it are from the above tables. They can be explained as
under:
• Total electricity generation in GWh:
The null hypothesis used here is that “There is no difference in total electricity
generation between India and Canada”.

Towards Excellence: An Indexed, Refereed & Peer Reviewed Journal of Higher Education / Prof.
Dr. Hetal Chokshi / Page 7-25
March, 2018. VOL.10. ISSUE NO. 1 www.hrdcgujarat.ac.in Page | 17
Group Statistics
Country N Mean Std. Deviation Std. Error Mean
Elec Generation 1 15 726548.53 172753.421 44604.741
2 15 598552.87 20983.267 5417.856
Independent Samples Test
Levene's Test
for Equality of
Variances
t-test for Equality of Means
F Sig. t df Sig. (2-
tailed)
Mean
Difference
Std. Error
Difference
95% Confidence Interval of the
Difference
Lower Upper
Elec
Generatio
n
Equal
variance
s
assumed
31.935 .000 2.849 28 .008 127995.667 44932.573 35955.463 220035.870
Equal
variance
s not
assumed
2.849 14.413 .013 127995.667 44932.573 31883.314 224108.019
The above statistical calculations indicate that hypothesis is rejected it means there is
a difference in the total electricity production between both the countries. The
difference of mean says that total electricity generation is more in India while on the
other side, its high standard deviation and the data also shows that growth is more in
India compared to Canada.
• Renewable elelctircity production as of % of of total electricity
production:
Group Statistics
Renewable electricity output
(% of total electricity output)
in canada
N Mean Std. Deviation Std. Error Mean
Renewable electricity output
(% of total electricity output)
in India
1 23 16.94825147259
189
3.084148482181
581
.6430894136271
09
2 23 60.91281770060 1.418472564848 .2957719757154

Towards Excellence: An Indexed, Refereed & Peer Reviewed Journal of Higher Education / Prof.
Dr. Hetal Chokshi / Page 7-25
March, 2018. VOL.10. ISSUE NO. 1 www.hrdcgujarat.ac.in Page | 18
792 822 88
Independent Samples Test
Levene's
Test for
Equality of
Variances
t-test for Equality of Means
F Sig. t df Sig.
(2-
tailed
)
Mean
Difference
Std. Error
Difference
95% Confidence Interval of the Difference
Lower Upper
Renewable
electricity
output (%
of total
electricity
output) in
India
Equal
variances
assumed
6.367 .015
-
62.1
10
44 .000
-
43.964566
22801604
0
.70784536
1316935
-
45.391134
81693440
0
-42.537997639097680
Equal
variances
not
assumed
-
62.1
10
30.9
09 .000
-
43.964566
22801604
0
.70784536
1316935
-
45.408399
24071953
0
-42.520733215312546
The above calculation shows that the null hypothesis mentioning that there is no
difference in renewable electricity generation in both coutries is rejected and the data
shows that Canada produces more renewable energy compared to India.
• Per capita counsumption in KWh:
Group Statistics
in canada kwh N Mean Std. Deviation Std. Error Mean
in IndiaKWh
1 43 325.214757572
98776
187.656037702
081680
28.6172774638
48820
2 54 13208.0486078
5940000
3833.82980018
9525000
521.718153952
262400
Independent Samples Test
Levene's
Test for
Equality
of
Variance
s
t-test for Equality of Means

Towards Excellence: An Indexed, Refereed & Peer Reviewed Journal of Higher Education / Prof.
Dr. Hetal Chokshi / Page 7-25
March, 2018. VOL.10. ISSUE NO. 1 www.hrdcgujarat.ac.in Page | 19
F Si
g.
t df Sig.
(2-
tailed
)
Mean Difference Std. Error
Difference
95% Confidence Interval of the Difference
Lower Upper
in
India
KWh
E
q
u
a
l
v
a
r
i
a
n
c
e
s
a
s
s
u
m
e
d
125.
814
.0
00
-
21.99
1
95 .000
-
12882.83385028
6414000
585.835391409
147500
-
14045.86414897021
7000
-11719.803551602610000
E
q
u
a
l
v
a
r
i
a
n
c
e
s
n
o
t
-
24.65
6
53.31
9 .000
-
12882.83385028
6414000
522.502421748
262800
-
13930.69473496769
4000
-11834.972965605133000
Towards Excellence: An Indexed, Refereed & Peer Reviewed Journal of Higher Education / Prof.
Dr. Hetal Chokshi / Page 7-25
March, 2018. VOL.10. ISSUE NO. 1 www.hrdcgujarat.ac.in Page | 20
a
s
s
u
m
e
d
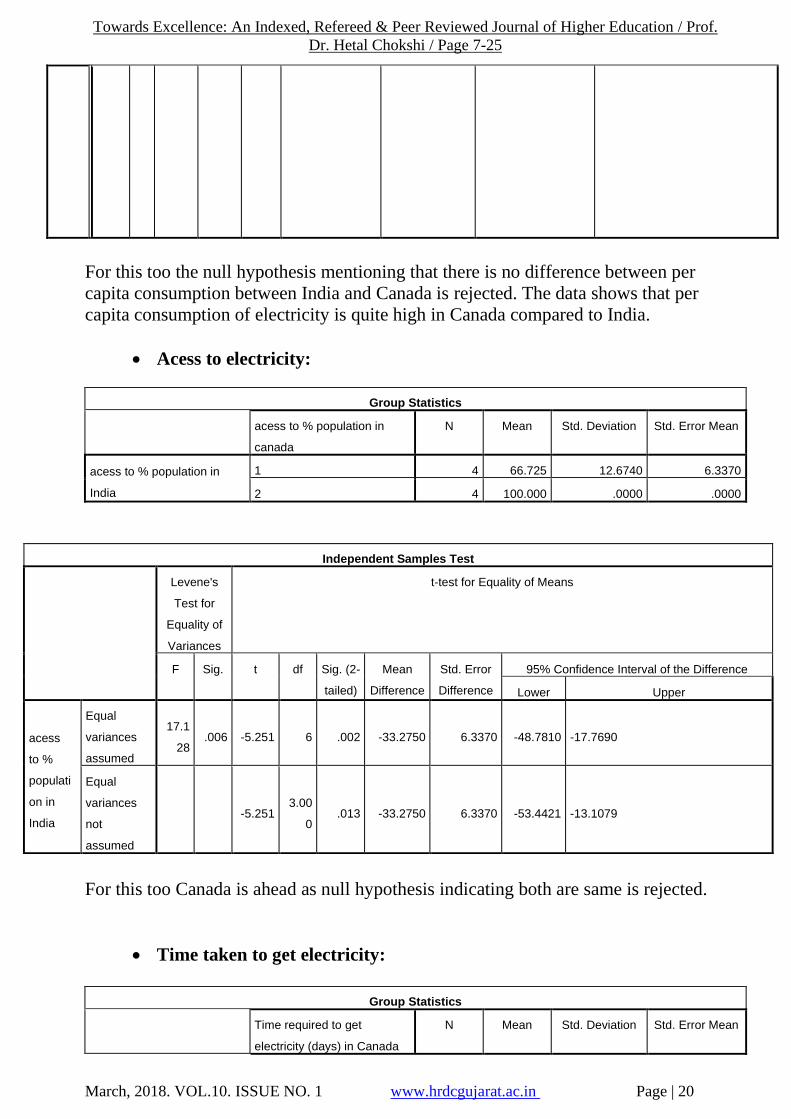
For this too the null hypothesis mentioning that there is no difference between per
capita consumption between India and Canada is rejected. The data shows that per
capita consumption of electricity is quite high in Canada compared to India.
• Acess to electricity:
Group Statistics
acess to % population in
canada
N Mean Std. Deviation Std. Error Mean
acess to % population in
India
1 4 66.725 12.6740 6.3370
2 4 100.000 .0000 .0000
For this too Canada is ahead as null hypothesis indicating both are same is rejected.
• Time taken to get electricity:
Group Statistics
Time required to get
electricity (days) in Canada
N Mean Std. Deviation Std. Error Mean
Independent Samples Test
Levene's
Test for
Equality of
Variances
t-test for Equality of Means
F Sig. t df Sig. (2-
tailed)
Mean
Difference
Std. Error
Difference
95% Confidence Interval of the Difference
Lower Upper
acess
to %
populati
on in
India
Equal
variances
assumed
17.1
28 .006 -5.251 6 .002 -33.2750 6.3370 -48.7810 -17.7690
Equal
variances
not
assumed
-5.251 3.00
0 .013 -33.2750 6.3370 -53.4421 -13.1079

Towards Excellence: An Indexed, Refereed & Peer Reviewed Journal of Higher Education / Prof.
Dr. Hetal Chokshi / Page 7-25
March, 2018. VOL.10. ISSUE NO. 1 www.hrdcgujarat.ac.in Page | 21
Time required to get
electricity (days) in India
1 8 71.96 21.497 7.600
2 8 150.88 15.151 5.357
Independent Samples Test
Levene's Test for
Equality of
Variances
t-test for Equality of Means
F Sig. t df Sig. (2-
tailed)
Mean
Difference
Std. Error
Difference
95% Confidence Interval of the
Difference
Lower Upper
Time
required
to get
electricity
(days) in
India
Equal
variances
assumed
2.114 .168 -8.487 14 .000 -78.913 9.298 -98.856 -58.969
Equal
variances
not
assumed
-8.487 12.578 .000 -78.913 9.298 -99.069 -58.756
This too shows that there is difference in time taken to get electricity in both the
countries. But here India takes less time compared to Canada.
• CO2 emissions from electricity and heat production, total (% of total
fuel combustion)
Group Statistics
Country N Mean Std. Deviation Std. Error Mean
CO2 emissions from
electricity and heat
production, total (% of total
fuel combustion)
1 43 43.3739022739
2171
11.7159909803
56292
1.78667187453
4026
2 54 29.1525361176
2999
7.37460482361
4674
1.00355660402
9083
Independent Samples Test
Levene's
Test for
Equality of
Variances
t-test for Equality of Means
F Si t df Sig. Mean Difference Std. Error 95% Confidence Interval of the Difference

Towards Excellence: An Indexed, Refereed & Peer Reviewed Journal of Higher Education / Prof.
Dr. Hetal Chokshi / Page 7-25
March, 2018. VOL.10. ISSUE NO. 1 www.hrdcgujarat.ac.in Page | 22
g. (2-
tailed
)
Difference Lower Upper
CO2
emissio
ns from
electricit
y and
heat
producti
on, total
(% of
total fuel
combust
ion)
E
q
u
a
l
v
a
r
i
a
n
c
e
s
a
s
s
u
m
e
d
17.856 .0
00
7.29
3 95 .000
14.22136615629
1720
1.950016401530
845
10.35009413830124
1 18.092638174282200
E
q
u
a
l
v
a
r
i
a
n
c
e
s
n
o
t
6.94
0
67.3
68 .000
14.22136615629
1720
2.049224791168
923
10.13150738145102
8 18.311224931132410

Towards Excellence: An Indexed, Refereed & Peer Reviewed Journal of Higher Education / Prof.
Dr. Hetal Chokshi / Page 7-25
March, 2018. VOL.10. ISSUE NO. 1 www.hrdcgujarat.ac.in Page | 23
a
s
s
u
m
e
d
The data shows that initially the CO2 emission was more or less similar in both the
countries but the difference has increased with the time. Due to more renewable
energy production, Canada emits less CO2 compared to India now. The null
hypothesis is also rejected here. As value of t is zero.
❖ Problems/Lacuna of power sector in India and Canada: Canada:
In Canada the co-operatives have to strive to grow electricity sector when basic needs
are not being met by the state. The first wave of electricity co-operatives that
incorporated between 1940 and 1960 in Alberta and Quebec was made up of rural,
distribution co-operatives as a result of right-wing government who did not publicly
fund rural electrification schemes. As it was unprofitable for private utilities, farmers
were forced to collectively organize and fund the expansion of electricity networks.
The second wave, which started in 1990 but expanded mainly after 2006, has
primarily taken place in Ontario’s deregulated power sector. Although Alberta also
has a deregulated power sector that similarly resulted in rate increases and failed to
spur the development of renewable. In Ontario, co-operatives remain a marginal
player in a sector dominated by well-financed, politically savvy private utilities. This
creates challenges for the success of electricity co-operatives and makes them
vulnerable to co-operation.
India:
The power sector of India faces more problems compared to Canada. The problems
can be listed as under:
• Demand is more compared to supply which leads to low per capita consumption.
It is 765KWh only which is less than the half amount of Canada.
• Less access to electricity which shows that electricity is not available to entire
population of country. It is available to 78% people only.
• Poor pipeline connectivity and infrastructure to harness India's abundant coal bed
methane and natural gas potential.
• Average transmission, distribution and consumer-level losses exceeding 30% at
once upon the time which includes auxiliary power consumption of thermal power
stations, fictitious electricity generation by wind generators & independent power
producers etc.
• Losses in the connector systems/service connections leading to premature failure
of capital equipments like transformers

Towards Excellence: An Indexed, Refereed & Peer Reviewed Journal of Higher Education / Prof.
Dr. Hetal Chokshi / Page 7-25
March, 2018. VOL.10. ISSUE NO. 1 www.hrdcgujarat.ac.in Page | 24
• India lacks of clean and reliable energy sources which is indicated by renewable
energy produced in India in this paper.
❖ Conclusion:
It can be concluded that though conventional and renewable energy production
started at more or less same time in both the countries, the performance of power
sector in both the countries is not same. The growth of electricity sector is more in
India since the year 2000 but due to more population, electricity is not available to all.
Transmission and Distributions loss is also high in India hence India has still miles to
go for the better performance of power sector and full availability of electricity to all
with better per capita consumption.
❖ Suggestions: Canada:
It is believed that electricity co-operatives can contribute to more renewable,
democratic, and locally-acceptable forms of development in Canada. No doubt, this
will require public intervention in the form of supportive policy and partnerships,
mainly to grow the partnerships with municipalities.
It is argued that enacting transformative change will require that co-operatives look
beyond the pragmatic value of membership and embrace the political potential of the
co-operative movement.
India:
It is quite clear that long-term policy perspective and policy certainty is needed for
the growth of power sector and mainly for the growth of the renewable energy sector
in India. The experience of the past few years shows that major changes in policy and
practice are required to fulfil the need of the country for mainly renewable energy
growth.
Integration between the renewable energy sector with conventional energy sources
and the integration of different sources of renewable energy themselves is highly
needed.
There is a wide scope for synergies between different energy sources that can expand
economic efficiency as well as meet the energy needs of the country. India needs a
long-term policy to integrate the different sectors of energy. This policy should
specify the role of renewable energy in addressing the needs of energy access and
energy security. India should increase the per capita availability of electricity
consumption and should make electricity available to all.
Entrepreneurs should be encouraged to decide their own mix of renewable energy to
achieve the lowest price for a pre-defined service quality.

Towards Excellence: An Indexed, Refereed & Peer Reviewed Journal of Higher Education / Prof.
Dr. Hetal Chokshi / Page 7-25
March, 2018. VOL.10. ISSUE NO. 1 www.hrdcgujarat.ac.in Page | 25
Development of renewable electricity sector is strongly recommended for India for its
Sustainable development also.
India should tap its potential to produce electricity so that it could be available to all
and per capita availability for the same can go high too.
❖ References: ▪ BC Hydro, 2012a. BC Hydro Annual Report 2012. BC Hydro, Vancouver.
▪ Billette de Villemeur, E., Pineau, P-O., 2012. Regulation and electricity market
integration: when trade introduces inefficiencies. Energy Econ. 34 (2), 529_535.
▪ Canada’s electricity generation retrieved from
http://www.statcan.gc.ca/pub/11-402-x/2012000/chap/ener/ener01-eng.htm
▪ Canada Energy, 2012. Ontario Electricity Market Overview. Canada Energy
Wholesalers Ltd, Oakville. Available
from: ,http://www.canadaenergy.ca/index.php?hydro5oem. (accessed 15.08.12).
▪ IEA, 2010. Energy Policies of IEA Countries—Canada 2009 Review.
International Energy Agency, Paris.
▪ Pineau, P.-O., 2012. Integrating Electricity Sectors in Canada: Good for the
Environment and for the Economy. The Federal Idea, Montreal
▪ Renewable energy consumption retrieved from
http://data.worldbank.org/indicator/EG.FEC.RNEW.ZS?end=2012&locations=IN-
ID- FI-SG-CA&start=1997&view=chart
▪ The worldbank retrieved from
http://data.worldbank.org/indicator/EG.USE.ELEC.KH.PC?locations=IN
▪ Tracking the energy revolution :Canada 2015 retrieved from
http://cleanenergycanada.org/trackingtherevolution-canada/2015/
▪ Wikipedia retrived from
https://en.wikipedia.org/wiki/Electricity_sector_in_India
Prof. Dr. Hetal B. Chokshi,
Head, department of Economics,
H.L. College of Commerce,
Ahmedabad,
Gujarat, India