issn 2094-618x major vegetables and rootcrops quarterly ... vegetables and... · major vegetables...
TRANSCRIPT

Volume 11 No. 1 Quezon City, Philippines
ISSN 2094-618x
Major Vegetables and Rootcrops Quarterly Bulletin
January-March 2017
Solid ∙ Responsive ∙ World Class PHILIPPINE STATISTICS AUTHORITY
Republic of the Philippines

Major
Vegetables and Rootcrops Quarterly Bulletin
January-March 2017
Solid ∙ Responsive ∙ World Class PHILIPPINE STATISTICS AUTHORITY
Republic of the Philippines

ii
Major Vegetables and Rootcrops Quarterly Bulletin is a publication of the Philippine Statistics Authority. The PSA reserves exclusive right to reproduce this publication in whatever form. Should any portion of this publication be included in a report/article, the title of the publication and the PSA should be cited as the source of data. The PSA will not be responsible for any information derived from the processing of data contained in this bulletin.
REPUBLIC OF THE PHILIPPINES
HIS EXCELLENCY PRESIDENT RODRIGO R. DUTERTE
PHILIPPINE STATISTICS AUTHORITY
LISA GRACE S. BERSALES, Ph.D. National Statistician
JOSIE B. PEREZ
Deputy National Statistician Census and Technical Coordination Office
Office
ROMEO S. RECIDE Deputy National Statistician
Sectoral Statistics Office

FOREWORD
The Major Vegetables and Rootcrops Quarterly Bulletin provides updates on production of major vegetables and rootcrops, namely, mongo, peanut, cabbage, eggplant, tomato, garlic, onion, sweet potato, and cassava. These crops are highlighted in the report on the Performance of Agriculture that the Philippine Statistics Authority (PSA) releases quarterly. This 1st quarter 2017 issue of the Bulletin presents the final estimates of production for October-December 2016 and the preliminary estimates for January-March 2017. The main source of data is the quarterly Crops Production Survey (CrPS) of the PSA.
LISA GRACE S. BERSALES, Ph. D.
National Statistician Quezon City, Philippines May 2017
iii

TABLE OF CONTENTS
Administrative Page ii Foreword iii Table of Contents iv Technical Notes vi
Mungbean/Mongo 2 Peanut 4 Cabbage 6 Eggplant 8 Tomato 10 Garlic 12 Bermuda Onion 14 Native Onion 16 Sweet Potato 18 Cassava 20
List of Tables
TABLE 1 Volume of Production for Selected Crops, Philippines, 22
October-December: 2015-2016 and January-March: 2016-2017p TABLE 2 Volume of Mungbean/Mongo Production by Region, 23
October-December: 2015-2016 and January-March: 2016-2017p TABLE 3 Volume of Peanut Production by Region, 24
October-December: 2015-2016 and January-March: 2016-2017p TABLE 4 Volume of Cabbage Production by Region, 25
October-December: 2015-2016 and January-March: 2016-2017p TABLE 5 Volume of Eggplant Production by Region, 26
October-December: 2015-2016 and January-March: 2016-2017p TABLE 6 Volume of Tomato Production by Region, 27
October-December: 2015-2016 and January-March: 2016-2017p TABLE 7 Volume of Garlic Production by Region, 28
October-December: 2015-2016 and January-March: 2016-2017p TABLE 8 Volume of Bermuda Onion Production by Region, 29
October-December: 2015-2016 and January-March: 2016-2017p TABLE 9 Volume of Native Onion Production by Region, 30
October-December: 2015-2016 and January-March: 2016-2017p TABLE 10 Volume of Sweet Potato Production by Region, 31
October-December: 2015-2016 and January-March: 2016-2017p TABLE 11 Volume of Cassava Production by Region, 32
October-December: 2015-2016 and January-March: 2016-2017p
iv

List of Figures
FIGURE 1 Mungbean/Mongo Production by Region, 1 January-March: 2017
FIGURE 2 Distribution of Mungbean/Mongo Production by Region, 2 January-March: 2017P
FIGURE 3 Peanut Production by Region, January-March: 2017 3 FIGURE 4 Distribution of Peanut Production by Region, 4 January-March: 2017P FIGURE 5 Cabbage Production by Region, January-March: 2017 5 FIGURE 6 Distribution of Cabbage Production by Region, 6
January-March: 2017P FIGURE 7 Eggplant Production by Region, January-March: 2017 7 FIGURE 8 Distribution of Eggplant Production by Region, 8
January-March: 2017P FIGURE 9 Tomato Production by Region, January-March: 2017 9 FIGURE 10 Distribution of Tomato Production by Region, 10
January-March: 2017P FIGURE 11 Garlic Production, by Region, January-March: 2017 11 FIGURE 12 Distribution of Garlic Production by Region, 12
January-March: 2017P FIGURE 13 Bermuda Onion Production by Region, January-March: 2017 13 FIGURE 14 Distribution of Bermuda Onion Production by Region, 14
January-March: 2017P FIGURE 15 Native Onion Production by Region, January-March: 2017 15 FIGURE 16 Distribution of Native Onion Production by Region, 16
January-March: 2017P FIGURE 17 Sweet Potato Production by Region, January-March: 2017 17 FIGURE 18 Distribution of Sweet Potato Production by Region, 18
January-March: 2017P FIGURE 19 Cassava Production by Region, January-March: 2017 19 FIGURE 20 Distribution of Cassava Production by Region, 20
January-March: 2017P
v

TECHNICAL NOTES Production refers to the quantity produced and actually harvested for a particular crop during the reference period. For other crops, area planted refers to the actual physical area planted while area harvested refers to the actual area from which harvests are realized. Estimates of production and area planted/harvested are generated from the Quarterly Crops Production Survey (CrPS) of which there are four survey rounds in a year, that is, February, May, August, and November.
vi

1
FIGURE 1 Mungbean/Mongo Production by Region, January-March: 2017p

2
FIGURE 2 Distribution of Mungbean/Mongo Production by Region, January-March: 2017p
Mungbean/Mongo • The January-March 2017 production of mungbean slightly grew by 0.3 percent, from
7.35 thousand metric tons in 2016 to 7.37 thousand metric tons this year. This could be attributed to the following: o increase in area planted in Tarlac due to seeds distribution program of the
Department of Agriculture through the Local Government Units (DA-LGUs); and o more and better pods harvested in Pangasinan and Ilocos Norte due to
distribution of quality seeds from the LGUs.
• Ilocos Region, the biggest producer, contributed 3.05 thousand metric tons or 41.4 percent to the country’s total mungbean production this quarter. The other major producers were Western Visayas with 18.0 percent share and Autonomous Region in Muslim Mindanao (ARMM) with 10.4 percent (Figure 2).
Ilocos
Region41.4%
Western Visayas 18.0%
ARMM10.4%
Other Regions30.1%

3
FIGURE 3 Peanut Production by Region, January-March: 2017p
4
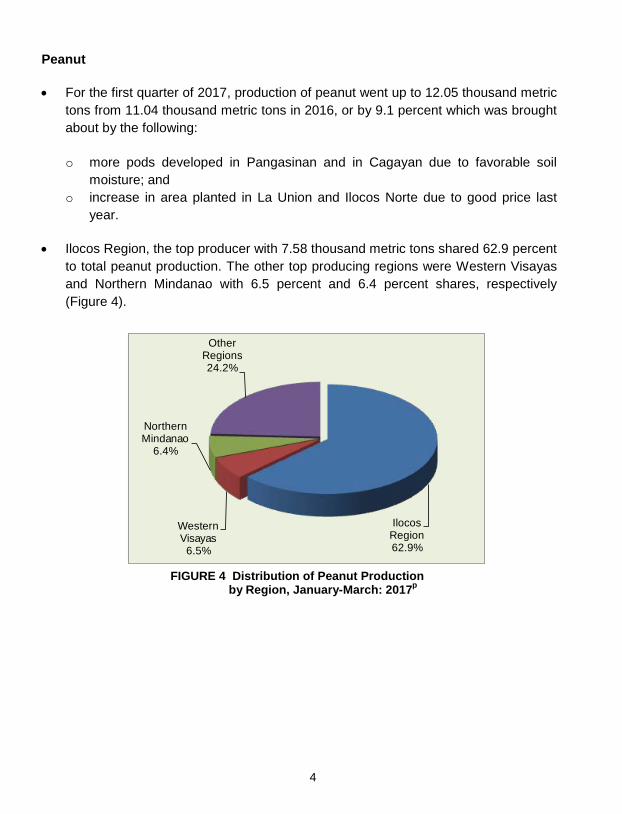
FIGURE 4 Distribution of Peanut Production by Region, January-March: 2017p
Peanut • For the first quarter of 2017, production of peanut went up to 12.05 thousand metric
tons from 11.04 thousand metric tons in 2016, or by 9.1 percent which was brought about by the following:
o more pods developed in Pangasinan and in Cagayan due to favorable soil
moisture; and o increase in area planted in La Union and Ilocos Norte due to good price last
year.
• Ilocos Region, the top producer with 7.58 thousand metric tons shared 62.9 percent to total peanut production. The other top producing regions were Western Visayas and Northern Mindanao with 6.5 percent and 6.4 percent shares, respectively (Figure 4).
Ilocos Region62.9%
Western Visayas
6.5%
Northern Mindanao
6.4%
Other Regions24.2%

5
FIGURE 5 Cabbage Production by Region, January-March: 2017p

6
FIGURE 6 Distribution of Cabbage Production by Region, January-March: 2017p
Cabbage • During the January-March 2017 period, cabbage production at 31.92 thousand
metric tons was 1.2 percent lower than the 2016 output of 32.31 thousand metric tons.
• The decline in output could be traced to shifting from cabbage to broccoli, lettuce, and Chinese pechay production in Benguet due to good price.
• Cordillera Administrative Region (CAR) remained the largest producer with
24.47 thousand metric tons representing 76.7 percent of the total cabbage production this quarter. Ilocos Region came next with 6.2 percent and Central Visayas with 5.0 percent (Figure 6).
CAR 76.7%
Ilocos Region6.2%
Central Visayas
5.0%
Other Regions12.2%

7
FIGURE 7 Eggplant Production by Region, January-March: 2017p

Ilocos Region37.4%
Central Luzon 18.7%
CALABARZON 16.8%
Other Regions27.1%
8
FIGURE 8 Distribution of Eggplant Production by Region, January-March: 2017p
Eggplant • For January-March 2017, production of eggplant at 78.76 thousand metric tons was
3.1 percent higher than the previous year’s level of 76.36 thousand metric tons. The improvement in output was due to the following factors:
o increase in area planted in Tarlac, Ilocos Norte, Ilocos Sur, and La Union due
to good price and demand; o bigger fruits harvested in Tarlac and Nueva Ecija due to sufficient use
of fertilizer; o use of high yielding varieties in Pangasinan; and o lesser infestation of pests such as flea beetles, hornworms and fruit borer in
Ilocos Norte and Ilocos Sur.
• Ilocos Region recorded the highest production at 29.46 thousand metric tons which represented 37.4 percent of the total eggplant production this quarter. Central Luzon ranked second with 18.7 percent and CALABARZON with 16.8 percent (Figure 8).

9
FIGURE 9 Tomato Production by Region, January-March: 2017p

9 10
FIGURE 10 Distribution of Tomato Production by Region, January-March: 2017p
Tomato • In January-March 2017, production of tomato reached 91.26 thousand metric tons,
up by 4.1 percent from its 2016 level of 87.68 thousand metric tons. The growth was supported by:
o the increase in area planted in Ilocos Sur due to contract growing scheme
offered by Northern Foods Corporation (NFC) of Ilocos Norte; o the use of high yielding varieties in Pangasinan; and o the bigger fruits harvested in Nueva Ecija due to sufficient use of fertilizer and
LGU intervention on good seeds in Bulacan.
• Ilocos Region, the highest contributor with 41.34 thousand metric tons shared 45.3 percent to the national output. This was followed by Central Luzon with 19.9 percent share and CALABARZON with 10.3 percent (Figure 10).
Ilocos Region45.3%
Central Luzon 19.9%
CALABARZON 10.3%
Other Regions24.5%

11
FIGURE 11 Garlic Production by Region, January-March: 2017p

12
FIGURE 12 Distribution of Garlic Production by Region, January-March: 2017p
Garlic • For January-March 2017, production of garlic reached 7.03 thousand metric tons
which was 3.1 percent higher than the 2016 level of 6.82 thousand metric tons. This was effected by the bigger bulbs harvested in Ilocos Norte as a result of the availability of more quality seeds from the LGUs coupled with favorable wind during bulb formation.
• Ilocos Region, the top producer with 5.10 thousand metric tons contributed
72.5 percent to the national total. MIMAROPA came next with 21.3 percent followed by Cagayan Valley with 4.3 percent (Figure 12).
Ilocos Region72.5%
MIMAROPA21.3%
Cagayan Valley 4.3%
Other Regions
1.8%

13
FIGURE 13 Bermuda Onion Production by Region, January-March: 2017p

14
FIGURE 14 Distribution of Bermuda Onion Production by Region, January-March: 2017p
Bermuda Onion (Red Creole and Yellow Granex) • For January-March 2017, production of bermuda onion was recorded
at 102.10 thousand metric tons, 72.3 percent higher than the 59.25 thousand metric tons output last year. The growth could be traced to the increase in area planted in Nueva Ecija and Nueva Vizcaya due to seeds distribution program of the DA through the LGUs.
• Central Luzon, the highest producing region with 89.15 thousand metric tons
represented 87.3 percent to the national output. This was followed by Cagayan Valley with share of 7.7 percent and Ilocos Region with 2.9 percent (Figure 14).
Central Luzon 87.3%
Cagayan Valley 7.7%
Ilocos Region2.9%
Other Regions
2.1%

15
FIGURE 15 Native Onion Production by Region, January-March: 2017p

16
Native Onion • The January-March 2017 production of native onion increased by 9.5 percent, from
24.94 thousand metric tons in 2016 to 27.31 thousand metric tons this year. Increment could be attributed to the following:
o increase in area planted in Ilocos Sur due to higher price, use of high yielding
varieties and control of root rot caused by thrips; and o bigger bulbs harvested in Ilocos Norte due to availability of more quality seeds
from the LGUs coupled with favorable wind during bulb formation.
• Ilocos Region, the top producer of native onion at 25.58 thousand metric tons shared 93.7 percent to the national total this quarter (Figure 16).
FIGURE 16 Distribution of Native Onion Production by Region, January-March: 2017p
Ilocos Region93.7%
Central Luzon 6.1%
Cagayan Valley 0.1%
Other Regions
0.1%

17
FIGURE 17 Sweet Potato Production by Region, January-March: 2017p
18
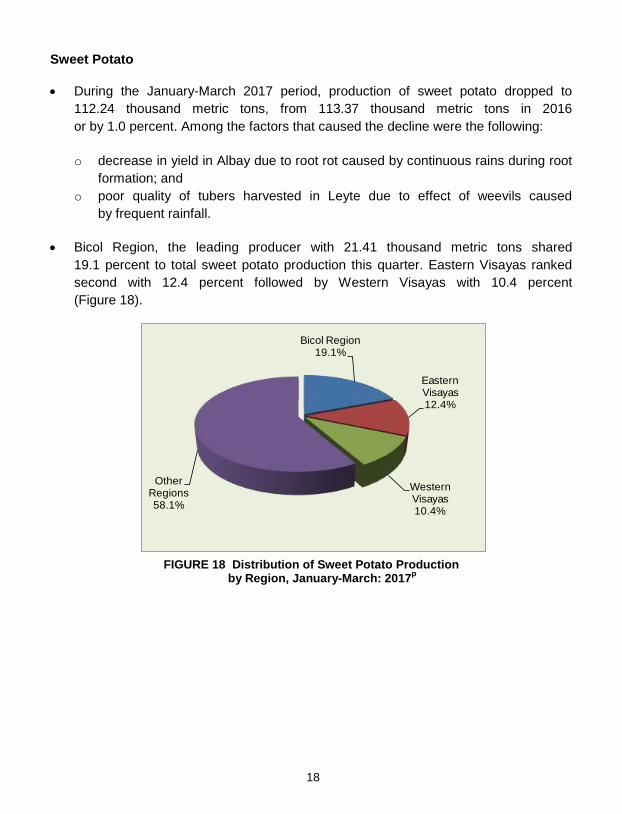
FIGURE 18 Distribution of Sweet Potato Production by Region, January-March: 2017p
Sweet Potato
• During the January-March 2017 period, production of sweet potato dropped to 112.24 thousand metric tons, from 113.37 thousand metric tons in 2016 or by 1.0 percent. Among the factors that caused the decline were the following:
o decrease in yield in Albay due to root rot caused by continuous rains during root
formation; and o poor quality of tubers harvested in Leyte due to effect of weevils caused
by frequent rainfall.
• Bicol Region, the leading producer with 21.41 thousand metric tons shared 19.1 percent to total sweet potato production this quarter. Eastern Visayas ranked second with 12.4 percent followed by Western Visayas with 10.4 percent (Figure 18).
Bicol Region
19.1%
Eastern Visayas 12.4%
Western Visayas 10.4%
Other Regions58.1%

19
FIGURE 19 Cassava Production by Region, January-March: 2017p

20
FIGURE 20 Distribution of Cassava Production by Region, January-March: 2017p
Cassava • For January-March 2017, production of cassava was estimated at 589.75 thousand
metric tons which was 1.5 percent higher than last year’s 581.05 thousand metric tons. This could be attributed to the following factors:
o increase in area harvested in Bukidnon due to high demand for feeds and other
industrial uses; o more area harvested in Bohol due to resumption of milling operations
of Liwayway Marketing Corporation (LMC); and o movement of harvest in South Cotabato from the fourth quarter of 2016 to the
first quarter of 2017 due to drought in the first semester of 2016 that resulted to delayed planting.
• Northern Mindanao topped all the cassava producing regions with 189.41 thousand metric tons sharing 32.1 percent to the national output. The other leading producers were ARMM with 16.9 percent and Cagayan Valley with 16.6 percent (Figure 20).
Northern Mindanao
32.1%
ARMM16.9%
Cagayan Valley 16.6%
Other Regions34.4%

STATISTICAL TABLES

pPreliminary - no data
2015 2016 2016 2017p Oct-Dec Jan-Mar
Mongo 3,127 3,117 7,348 7,367 (0.3) 0.3 Peanut 5,084 5,118 11,044 12,049 0.7 9.1 Cabbage 52,155 50,408 32,308 31,916 (3.3) (1.2) Eggplant 23,016 23,477 76,360 78,764 2.0 3.1 Tomato 27,224 28,340 87,681 91,258 4.1 4.1 Garlic 0.08 - 6,820 7,032 (100.0) 3.1 Onion 9,798 9,317 84,191 129,412 (4.9) 53.7
Bermuda 64 81 59,253 102,103 26.4 72.3 Native 9,734 9,237 24,939 27,309 (5.1) 9.5
Sweet Potato 122,167 127,851 113,366 112,236 4.7 (1.0) Cassava 762,309 776,200 581,046 589,752 1.8 1.5
ProductionCrop October-December January-March
Percent Change
TABLE 1 Volume of Production for Selected Crops, Philippines, October-December: 2015-2016 and January-March: 2016-2017p (In metric tons)
22

pPreliminary - no data
2015 2016 2016 2017p Oct-Dec Jan-Mar
PHILIPPINES 3,127 3,117 - 7,348 7,367 (0.3) 0.3
National Capital Region - - - - - - - - CAR 41 34 56 48 (15.8) (14.7) Ilocos Region 285 289 2,960 3,053 1.4 3.1 Cagayan Valley 24 18 103 58 (25.1) (43.6) Central Luzon 74 70 572 695 (5.7) 21.6 CALABARZON - - 87 84 - (3.9) MIMAROPA 20 19 668 628 (2.2) (5.9) Bicol Region 6 6 35 35 (7.7) (1.4) Western Visayas 62 53 1,439 1,328 (15.1) (7.7) Central Visayas 110 129 32 28 17.7 (12.2) Eastern Visayas 57 54 11 10 (5.9) (10.1) Zamboanga Peninsula 55 57 76 77 3.9 1.6 Northern Mindanao 119 116 129 140 (3.2) 8.5 Davao Region 323 334 63 65 3.6 4.0 SOCCSKSARGEN 84 83 122 113 (1.5) (7.1) Caraga 133 121 1 0.49 (9.0) (53.9) ARMM 1,561 1,545 756 766 (1.0) 1.4 NIR 173 188 239 239 8.8 (0.2)
October-December January-MarchRegionProduction Percent
Change
TABLE 2 Volume of Production for Mungbean/Mongo by Region, October-December: 2015-2016 and January-March: 2016-2017p (In metric tons)
23

pPreliminary - no data
2015 2016 2016 2017p Oct-Dec Jan-Mar
PHILIPPINES 5,084 5,118 - 11,044 12,049 - 0.7 9.1
National Capital Region - - - - - - CAR 2 2 12 11 (36.0) (12.7) Ilocos Region 1,108 1,072 6,775 7,582 (3.3) 11.9 Cagayan Valley 336 278 535 652 (17.5) 22.0 Central Luzon 96 100 486 451 3.9 (7.1) CALABARZON 66 68 181 173 3.6 (4.4) MIMAROPA 193 198 443 448 2.7 1.0 Bicol Region 48 48 356 329 (0.5) (7.7) Western Visayas 242 208 721 785 (14.2) 8.8 Central Visayas 210 267 77 82 27.1 5.9 Eastern Visayas 29 27 54 51 (4.8) (5.1) Zamboanga Peninsula 637 685 81 88 7.6 9.4 Northern Mindanao 1,057 1,080 747 768 2.1 2.8 Davao Region 217 219 89 94 0.7 5.6 SOCCSKSARGEN 127 119 195 233 (5.9) 19.6 Caraga 100 96 2 1 (3.7) (46.7) ARMM 249 245 116 120 (1.6) 3.1 NIR 367 407 173 181 10.9 4.6
RegionProduction
October-December January-March Percent Change
TABLE 3 Volume of Production for Peanut by Region, October-December: 2015-2016 and January-March: 2016-2017p
(In metric tons)
24

pPreliminary - no data
2015 2016 2016 2017p Oct-Dec Jan-Mar
PHILIPPINES 52,155 50,408 - 32,308 31,916 (3.3) (1.2)
National Capital Region - - - - - - CAR 41,984 39,835 24,905 24,474 (5.1) (1.7) Ilocos Region 427 402 1,966 1,967 (5.8) 0.0 Cagayan Valley 59 80 837 914 36.7 9.2 Central Luzon - 0.05 - 0.05 - - CALABARZON 121 108 270 209 (10.7) (22.5) MIMAROPA 7 7 18 18 (3.5) (2.0) Bicol Region 48 47 42 38 (2.2) (8.7) Western Visayas 57 57 85 80 (1.1) (5.8) Central Visayas 2,316 2,515 1,589 1,598 8.6 0.5 Eastern Visayas 25 26 28 24 0.4 (13.9) Zamboanga Peninsula 495 523 49 48 5.8 (2.0) Northern Mindanao 3,655 3,647 506 568 (0.2) 12.4 Davao Region 1,683 1,689 1,138 1,163 0.4 2.2 SOCCSKSARGEN 354 356 268 242 0.6 (9.7) Caraga 0.46 1 1 1 41.3 (9.1) ARMM 263 264 78 57 0.4 (27.0) NIR 662 852 528 516 28.7 (2.3)
RegionProduction
October-December January-MarchPercent Change
TABLE 4 Volume of Production for Cabbage by Region, October-December: 2015-2016 and January-March: 2016-2017p (In metric tons)
25

pPreliminary - no data
2015 2016 2016 2017p Oct-Dec Jan-Mar
PHILIPPINES 23,016 23,477 - 76,360 78,764 2.0 3.1
National Capital Region - - - - - - CAR 97 76 477 497 (21.3) 4.2 Ilocos Region 1,564 1,508 28,713 29,463 (3.5) 2.6 Cagayan Valley 1,025 683 5,103 4,914 (33.4) (3.7) Central Luzon 2,624 2,659 11,743 14,736 1.3 25.5 CALABARZON 4,660 4,595 14,183 13,217 (1.4) (6.8) MIMAROPA 500 530 1,116 1,277 6.0 14.4 Bicol Region 356 357 1,885 1,704 0.4 (9.6) Western Visayas 1,477 1,342 4,738 4,463 (9.2) (5.8) Central Visayas 2,102 2,453 1,615 1,578 16.7 (2.3) Eastern Visayas 138 139 340 319 0.6 (6.3) Zamboanga Peninsula 1,460 1,480 570 599 1.4 5.0 Northern Mindanao 1,582 1,651 998 1,015 4.4 1.7 Davao Region 1,958 1,924 824 815 (1.8) (1.1) SOCCSKSARGEN 1,796 1,888 1,414 1,526 5.2 7.9 Caraga 816 1,309 435 341 60.6 (21.5) ARMM 294 298 126 130 1.2 3.5 NIR 567 584 2,079 2,171 3.1 4.4
RegionProduction
October-December January-MarchPercent Change
TABLE 5 Volume of Production for Eggplant by Region, October-December: 2015-2016 and January-March: 2016-2017p (In metric tons)
26

pPreliminary - no data
2015 2016 2016 2017p Oct-Dec Jan-Mar
PHILIPPINES 27,224 28,340 - 87,681 91,258 4.1 4.1
National Capital Region - - - - - - CAR 629 514 1,994 1,862 (18.3) (6.6) Ilocos Region 2,258 2,297 38,073 41,341 1.7 8.6 Cagayan Valley 579 537 2,530 2,591 (7.3) 2.4 Central Luzon 1,435 1,563 16,935 18,177 8.9 7.3 CALABARZON 460 462 11,060 9,387 0.3 (15.1) MIMAROPA 247 298 565 647 20.5 14.6 Bicol Region 22 21 1,054 958 (2.3) (9.1) Western Visayas 877 1,010 6,167 6,589 15.2 6.8 Central Visayas 546 593 890 846 8.5 (5.0) Eastern Visayas 71 73 73 64 1.8 (12.5) Zamboanga Peninsula 1,898 1,926 499 516 1.5 3.6 Northern Mindanao 15,951 16,692 5,056 5,520 4.6 9.2 Davao Region 358 352 1,247 1,238 (1.6) (0.7) SOCCSKSARGEN 1,472 1,552 943 953 5.4 1.1 Caraga 60 73 24 21 21.6 (11.7) ARMM 135 138 87 88 1.9 1.3 NIR 226 241 484 460 6.4 (5.0)
RegionProduction
October-December January-MarchPercent Change
TABLE 6 Volume of Production for Tomato by Region, October-December: 2015-2016 and January-March: 2016-2017p (In metric tons)
27

pPreliminary - no data
2015 2016 2016 2017p Oct-Dec Jan-Mar
PHILIPPINES 0.08 - 6,820 7,032 - 3.1
National Capital Region - - - - - - CAR - - 9 - - (100.0) Ilocos Region - - 4,488 5,101 - 13.7 Cagayan Valley - - 422 305 - (27.7) Central Luzon - - 165 50 - (69.8) CALABARZON 0.08 - 77 72 (100.0) (6.6) MIMAROPA - - 1,656 1,501 - (9.4) Bicol Region - - - - - - Western Visayas - - 4 3 - (24.1) Central Visayas - - - - - - Eastern Visayas - - - - - - Zamboanga Peninsula - - - - - - Northern Mindanao - - - - - - Davao Region - - - - - - SOCCSKSARGEN - - - - - - Caraga - - - - - - ARMM - - - - - - NIR - - - - - -
RegionProduction
October-December January-MarchPercent Change
TABLE 7 Volume of Production for Garlic by Region, October-December: 2015-2016 and January-March: 2016-2017p (In metric tons)
28

pPreliminary - no data
2015 2016 2016 2017p Oct-Dec Jan-Mar
PHILIPPINES 64 81 - 59,253 102,103 26.4 72.3
National Capital Region - - - - - - CAR - - - - - - Ilocos Region 51 49 3,092 3,007 (3.9) (2.7) Cagayan Valley - 19 6,981 7,817 - 12.0 Central Luzon - - 47,140 89,146 - 89.1 CALABARZON - - 4 3 - (9.6) MIMAROPA - - 2,019 2,115 - 4.8 Bicol Region - - - - - - Western Visayas - - 10 12 - 20.0 Central Visayas 0.03 - 0.15 0.25 (100.0) 63.3 Eastern Visayas - - - - - - Zamboanga Peninsula - - - - - - Northern Mindanao - - - - - - Davao Region - - - - - - SOCCSKSARGEN 12 10 7 3 (16.0) (57.0) Caraga - - - - - - ARMM - - - - - - NIR 1 3 - - 217.6 -
RegionProduction
October-December January-MarchPercent Change
TABLE 8 Volume of Production for Bermuda Onion by Region, October-December: 2015-2016 and January-March: 2016-2017p (In metric tons)
29

pPreliminary - no data
2015 2016 2016 2017p Oct-Dec Jan-Mar
PHILIPPINES 9,734 9,237 24,939 27,309 (5.1) 9.5
National Capital Region - - - - - - CAR - - - - - - Ilocos Region 9,696 9,216 23,739 25,580 (4.9) 7.8 Cagayan Valley 27 9 76 36 (68.8) (53.4) Central Luzon 4 3 1,072 1,671 (9.71) 55.8 CALABARZON 3 2 43 12 (4.0) (72.1) MIMAROPA - - 3 3 - (10.3) Bicol Region - - - - - - Western Visayas - - - - - - Central Visayas - - - - - - Eastern Visayas - - - - - - Zamboanga Peninsula 1 1 0.23 0.25 (14.3) 8.7 Northern Mindanao - - - - - - Davao Region - - - - - - SOCCSKSARGEN 4 5 5 6 18.0 20.0 Caraga - - - 1 - - ARMM - - - - - - NIR - 1 - 1 - -
RegionProduction
October-December January-March Percent Change
TABLE 9 Volume of Production for Native Onion by Region, October-December: 2015-2016 and January-March: 2016-2017p (In metric tons)
30

pPreliminary - no data
2015 2016 2016 2017p Oct-Dec Jan-Mar
PHILIPPINES 122,167 127,851 113,366 112,236 4.7 (1.0)
National Capital Region - - - - - - CAR 3,625 3,162 2,507 2,239 (12.8) (10.7) Ilocos Region 2,547 2,469 6,678 7,090 (3.0) 6.2 Cagayan Valley 2,148 1,982 2,536 2,608 (7.7) 2.8 Central Luzon 9,541 9,721 8,258 8,298 1.9 0.5 CALABARZON 4,972 4,770 9,858 9,160 (4.1) (7.1) MIMAROPA 6,123 6,352 3,302 3,603 3.7 9.1 Bicol Region 7,846 7,359 23,470 21,407 (6.2) (8.8) Western Visayas 7,084 7,233 10,808 11,686 2.1 8.1 Central Visayas 11,305 12,750 4,434 4,558 12.8 2.8 Eastern Visayas 16,752 16,367 14,751 13,893 (2.3) (5.8) Zamboanga Peninsula 13,570 14,819 1,118 1,168 9.2 4.5 Northern Mindanao 10,307 11,153 8,808 9,141 8.2 3.8 Davao Region 4,973 4,960 3,133 3,140 (0.3) 0.2 SOCCSKSARGEN 1,480 1,510 2,721 2,583 2.1 (5.1) Caraga 9,190 11,368 5,281 5,015 23.7 (5.0) ARMM 3,736 3,718 982 988 (0.5) 0.6 NIR 6,967 8,157 4,721 5,659 17.1 19.9
RegionProduction
October-December January-March Percent Change
TABLE 10 Volume of Production for Sweet Potato by Region, October-December: 2015-2016 and January-March: 2016-2017p (In metric tons)
31

pPreliminary - no data
2015 2016 2016 2017p Oct-Dec Jan-Mar
PHILIPPINES 762,309 776,200 - 581,046 589,752 1.8 1.5
National Capital Region - - - - - - CAR 620 2,695 680 589 334.9 (13.5) Ilocos Region 5,128 4,698 5,283 5,893 (8.4) 11.5 Cagayan Valley 66,638 64,511 101,997 97,709 (3.2) (4.2) Central Luzon 7,536 7,980 4,819 4,819 5.9 (0.0) CALABARZON 10,617 10,072 14,530 14,696 (5.1) 1.1 MIMAROPA 4,827 5,237 2,579 2,819 8.5 9.3 Bicol Region 10,280 9,587 31,999 28,677 (6.7) (10.4) Western Visayas 7,553 6,859 7,027 6,859 (9.2) (2.4) Central Visayas 31,046 32,031 33,332 36,104 3.2 8.3 Eastern Visayas 11,973 12,180 23,043 23,451 1.7 1.8 Zamboanga Peninsula 24,236 31,187 6,418 7,978 28.7 24.3 Northern Mindanao 106,544 110,876 182,878 189,406 4.1 3.6 Davao Region 4,234 4,698 4,677 4,762 11.0 1.8 SOCCSKSARGEN 27,340 24,692 45,332 47,526 (9.7) 4.8 Caraga 5,006 8,627 1,979 1,813 72.3 (8.4) ARMM 423,645 424,942 98,111 99,523 0.3 1.4 NIR 15,087 15,328 16,359 17,127 1.6 4.7
RegionProduction
October-December January-MarchPercent Change
TABLE 11 Volume of Production for Cassava by Region, October-December: 2015-2016 and January-March: 2016-2017p (In metric tons)
32

/Philippine Statistics Authority /PSAgovph

Republic of the Philippines PHILIPPINE STATISTICS AUTHORITY
16th Floor, ETON Cyberpod Centris 3 EDSA, Quezon City
www.psa.gov.ph