issn 1170-9847 napier city council annual report · a regional strategic coordination group (rsgc)...
TRANSCRIPT

Napier City CouncilAnnual Report1 July 2007 to 30 June 2008
Adopted 15 October 2008
ISSN 1170-9847

Page 1Napier City Council Annual Report 2007/08
ContentsMayor and Councillors as at 30 June 2008 .......................................................................................................................... 2Mayor and Chief Executive’s Message ................................................................................................................................ 3Financial Summary ............................................................................................................................................................... 4Key Statistics ........................................................................................................................................................................ 5Community Outcomes .......................................................................................................................................................... 6Statement of Compliance and Responsibility ....................................................................................................................... 9Financial Statements .......................................................................................................................................................... 13
Statement of Financial Performance ............................................................................................................................ 14Statement of Changes in Equity .................................................................................................................................. 14Statement of Financial Position .................................................................................................................................... 15Statement of Cash Flows .............................................................................................................................................. 16Notes to the Financial Statements ................................................................................................................................ 171. Statement of Accounting Policies for the year ended 30 June 2008 ....................................................................... 172. Explanation of major variances against budget ...................................................................................................... 253. Summary cost of services ....................................................................................................................................... 264. Rates revenue ......................................................................................................................................................... 275. Other revenue ......................................................................................................................................................... 286. Gains/(losses) ......................................................................................................................................................... 287. Employee benefi t expenses .................................................................................................................................... 298. Other expenses ....................................................................................................................................................... 299. Finance income and fi nance costs .......................................................................................................................... 2910. Tax ........................................................................................................................................................................... 3011. Cash and cash equivalents ..................................................................................................................................... 3012. Debtors and other receivables ................................................................................................................................ 3113. Inventories ............................................................................................................................................................... 3214. Biological assets ..................................................................................................................................................... 3215. Other fi nancial assets .............................................................................................................................................. 3316. Non-current assets held for sale ............................................................................................................................. 3317. Property plant and equipment ................................................................................................................................. 3418. Intangible assets ..................................................................................................................................................... 3619. Investment Property ................................................................................................................................................ 3720. Investments in associates ....................................................................................................................................... 3821. Creditors and other payables .................................................................................................................................. 3822. Employee benefi t liabilities ...................................................................................................................................... 3923. Borrowings .............................................................................................................................................................. 3924. Provisions ................................................................................................................................................................ 4125. Equity ...................................................................................................................................................................... 4226. Capital Management ............................................................................................................................................... 4327. Capital commitments and operating leases ............................................................................................................ 4428. Contingencies ......................................................................................................................................................... 4529. Reconciliation of net surplus after tax to net cash fl ow from operating activities .................................................... 4530. Remuneration .......................................................................................................................................................... 4631. Severance Payments .............................................................................................................................................. 4632. Events after the balance sheet date ........................................................................................................................ 4633. Financial Instrument Risks ...................................................................................................................................... 4734. Derivative Financial Instruments ............................................................................................................................. 5135. Related Party Transactions ..................................................................................................................................... 5136. Joint Venture ........................................................................................................................................................... 52
Council Controlled Organisations ....................................................................................................................................... 53Maori Contribution to Decision-Making Process................................................................................................................. 54Statement of Service Performance for Activity Groups ...................................................................................................... 55Democracy and Governance .............................................................................................................................................. 56Recreation .......................................................................................................................................................................... 58Social and Cultural ............................................................................................................................................................. 63City Promotion .................................................................................................................................................................... 71Planning and Regulatory .................................................................................................................................................... 76Roading .............................................................................................................................................................................. 81Water and Wastes .............................................................................................................................................................. 84Property Assets .................................................................................................................................................................. 90Support Services ................................................................................................................................................................ 93Glossary of Terms ............................................................................................................................................................... 94
Page 2 Napier City Council Annual Report 2007/08
Mayor and Councillors as at 30 June 2008
Mayor
MISSION STATEMENT
To provide the Facilities and Services and the Environment, Leadership, Encouragement and Economic Opportunity
TO MAKE NAPIER THE BEST PROVINCIAL CITY IN NEW ZEALAND
in which to live, work, raise a family, and enjoy a safe and satisfying life.
Councillors
Bill Dalton
Dave Pipe Faye White
Harry Lawson
John Cocking Kathie Furlong
Keith Price
Mark Herbert
Maxine Boag
Rob LutterTony Jeffery JP
Barbara Arnott
Tania Wright

Page 3Napier City Council Annual Report 2007/08
Napier ranks at the top of provincial cities in New Zealand and although nearly all of our residents think that the city spends rates well, are happy with the city environment, services and facilities and the opportunities here – this only means we’ll try harder to improve and respond to communities needs.
Where and how we live, work and play is important to all of us and managing and planning for our changing city is vital.
All of our gains are a result of working in partnership with our communities and your interaction with us means efficient delivery of high quality services.
Our thanks to Councillors, our valued managers and staff and our forthright, positive Napier community.
The Annual Report is one measure of how we’ve delivered on our work programme for the year and you can be confident in the Council’s ongoing excellent financial management. This means a reduced level of debt and affordable, sustainable rates.
Roading, sewage and refuse still consume the lions share of the funding but those facilities that bring us pleasure are not far behind – libraries, reserves and sportsgrounds.
During the year the community made decisions about the Botanical Gardens and the Art Gallery & Museum. In both cases the Council went back to the drawing board after the consultation process and the results are a reflection of the community input. Economic Development is a large factor in the sustainability of our city and the workforce so tourism and our bid to attract skilled workers was at the forefront of our work in this area.
Council’s partnership with the Rotary Pathway Trust has brought enormous benefits to those who enjoy the environment and a healthy lifestyle. Over 10 kilometres have been constructed this year.
The city treasures its heritage and Art Deco is the heart of this. We now rank in the Government’s list as the preferred cultural site for World Heritage. Investigation of this process and the requirements has begun.
We’ve worked with the region on many issues, wastewater, urban growth, airport, civil defence, our museum collections, the ongoing operation of Pettigrew Green Arena and many other issues. Napier is a unique city and balances well our affordability issues with the provision of amenities and protection for our fabulous natural environment. The commitment to quality and community from all of us serves Napier well.
Neil Taylor Barbara Arnott CHIEF EXECUTIVE MAYOR
Mayor and Chief Executive’s Message

Page 4 Napier City Council Annual Report 2007/08
Financial Summary
Financial condition indicatorsActual
2007/08$000
Budget2007/08
$000
Actual2006/07
$000
Rates Revenue 39,708 39,253 38,333Net Surplus 18,491 14,475 20,407Working Capital 32,248 30,308 30,762Public Debt 11,627 42,794 18,814Total Assets 1,287,915 1,221,740 1,144,837Proportion of rates revenue to total revenue (%) 43.94% 45.22% 44.17%Public debt as a percentage of total assets 0.90% 3.50% 1.64%Proportion of rates revenue applied to service debt (%) 8.71% 13.51% 8.46%
The fi nancial performance measures refl ect positively on Council's overall performance and fi nancial position at 30 June 2008. In addition public debt and working capital both show favourable variances due to timing variations and the carry forward of capital projects, and the application of internal borrowing instead of raising public debt.
Explanations of major budget variations are outlined in note 2 of the Financial Statements.
How rates were spentThe chart shows the split of rates expenditure between Council's activities. A negative percentage indicates a contribution to rates.
-5.9%-4.7%
-1.9%-0.4%
0.1%0.1%0.4%0.6%0.8%0.9%0.9%0.9%1.0%1.1%1.1%1.1%1.1%1.1%
1.8%2.1%2.3%2.5%2.5%
3.2%3.3%
4.0%4.1%
5.5%6.8%
7.5%8.0%8.2%
8.7%7.6%
9.7%13.8%
-10.0% -5.0% 0.0% 5.0% 10.0% 15.0%
Property HoldingsKennedy Park
Retirement & Rental HousingPar 2 Golf
Inner HarbourMarine Parade Pools
Safer CommunityWar Memorial Centre
Municipal TheatreAnimal Control
Safety WatchCemeteries
HallsNapier i-Site
Building ConsentsMarineland
Civil DefenceEnvironmental Health
AquariumCity & Business Promotion
Development ControlCity Promotion
Public ToiletsCommunity Development
Planning PolicyHBMAG
Napier Aquatic CentreStormwater
Water SupplySportsgrounds
Democracy & GovernanceReservesLibraries
Solid Waste (Refuse)Wastewater (Sewerage)
Roading

Page 5Napier City Council Annual Report 2007/08
Key Statistics
30 June 2008 30 June 2007
Area and populationArea (ha) 10,364 10,364Population (2006 Census) 57,100 56,900
ValuationRateable properties, no. of 24,061 23,635Non-rateable properties, no. of 352 346Gross capital value 9,459,156,200 9,257,526,200Nett capital value (i.e. Capital Value of rateable property) 9,011,393,450 8,813,921,950Gross land value 4,514,224,550 4,464,873,770Nett land value (i.e. land value of rateable property) 4,329,006,600 4,279,692,320Date of last revision of values 2008 2005
Rates and ratingTotal rates struck (incl. GST) 43,319,540 42,688,307System of rating Land Value Land Value
Public debtPublic debt outstanding (excluding fi nance leases) 11,562,300 18,570,250Loan redemption reserves 2,223,612 3,408,784Unexercised loan authorities 58,625,000 46,411,000
Building consentsValue of consents for year 142,092,037 149,330,502Value of consents for residential Properties 71,162,583 84,049,462
Date of constitution of city 1989 1989
Average Residential Rates
1,337
1,455
1,467
1,476
1,484
1,529
1,569
1,570
1,612
1,500
1,292
1,350
1,432
1,369
1,412
1,449
1,533
1,502
1,430
1,419
Timaru
Hamilton
Napier
Invercargill
Palmerston North
Hastings
Tauranga
Rotorua
Whangarei
AVERAGE
2007/08 2006/07

Page 6 Napier City Council Annual Report 2007/08
The fi ve Hawke’s Bay Councils - Hastings District Council, Napier City Council, Central Hawke’s Bay District Council, Wairoa District Council and the Hawke’s Bay Regional Council worked together to identify a long term vision for the future and community outcomes for the Hawke's Bay region for inclusion in the 2004 LTCCP.
National Research Bureau was commissioned in February 2005 to undertake a survey of residents in the region to obtain the views of residents on economic wellbeing, social and cultural wellbeing, and environmental wellbeing. This information gives a baseline for reporting on Council's progress towards achievement of the community outcomes. Results from this survey were reported in Council's 2004/05 Annual Report. Work is continuing on monitoring and reporting on the community outcomes collaboratively with the other Councils.
A Regional Strategic Coordination Group (RSGC) has been formed comprising 14 member organisation, Councils and non Government organisations. This group will coordinate the monitoring and reporting of Community Outcomes. The fi rst report is expected to be produced early 2009.
The Council considers that meeting its service level targets constitutes its major role as a contributor to the progress of Community Outcomes for the 2007/08 year. The contributions of Council's activities to the community outcomes are as follows:
Economic Wellbeing
Outcome - A strong prosperous and thriving economy
Governance: Through Governance Council provides the infrastructure and services that promote economic growth.Sportsgrounds: Sports events bring competitors and supporters to the city.
Marine Parade Pool Complex: The complex provides well presented and modern aquatic facilities and local business opportunities.Par 2 MiniGolf: Promotes tourism.Inner Harbour: Facilitates the fi shing industry by maximising berth facilities.War Memorial Conference Centre: The facility and Napier are promoted as a conference destination and it maintains the Marine Parade Precinct.Municipal Theatre: Provides a facility to accommodate large conferences and events and ticketing services to a range of venues for local, national and international events.Emergency Management: Identifi es hazards and risks and plans for the management and response to a civil defence emergency. Regulatory Consents: District Plan provisions which allow a fl exible approach to a range of development opportunities.Building Consents: Provides for a range of development opportunities.Parking Services: Facilitates economic development in CBD and contributes to active marketing of CBD.Property Holdings: Provides leasehold land for commercial and industrial use and letable space in commercial buildings.
Business Facilitation: The Council’s economic development work is directly concerned with increasing the overall economic well-being of the Napier community. The Council does this in association with community agencies and central government. Marineland of New Zealand: Assists in Napier being a leading commercial and tourist centre.National Aquarium of New Zealand: Attracts visitors to Napier.Napier i-SITE: Provides increased information about Napier to visitors to promote visitor spend.Kennedy Park: Provides access for a wide range of visitors and contributes to local employment opportunities and support to national and regional sports events.
Outcome - Transport, infrastructure and services that are safe, effective and integrated
War Memorial Conference Centre: A quality facility is maintained.Retirement and Rental Housing: The use of rental properties is maximised and tenants have affordable rents.Public Toilets: Provides and maintains suitably located and adequate number of public toilets throughout the city.City Development Planning: Actively supports the adopted retail strategy and strategic plan ensuring the district plan and bylaws are effective in managing planning issues and changes such as: Port noise, Businesses of prostitution, Business Parks, Retail Strategy, Non-complying activities, Financial Contributions.Animal Control: Services that are effective in reducing registration costs. Consistent application of the principles of equity and fairness.Parking Services: Provide accessible quality transportation amenities.Roading: Roads and footpaths are provided to satisfy public expectations.Solid Waste: Ease of access through improved facilities (eg. an increased number of recycling stations and entranceway improvements at the Redclyffe Transfer Station).Stormwater: Maintains pumping stations and the open drains to a standard that will maximise the pumping capacity.Wastewater: Provides and maintains a wastewater system with adequate wastewater capacity.Water: The system is fl ushed and cleaned. Capacity and storage improvements are made.
Social and Cultural Wellbeing
Outcome - Strong regional leadership and a sense of belonging
Governance: Governance contributes to co-ordinated regional leadership to achieve economic, social, cultural and environmental wellbeing of our communities, a democratic environment where all people are able to participate in the life of their communities and achieve a sense of belonging.Community Development: Provides appropriate training, advice and information services to the various community groups, organisations and agencies.
Community Outcomes
Page 7Napier City Council Annual Report 2007/08
Community Outcomes
Youth Development: The coordination of 6 youth forums per year provides an opportunity for youth participation and partnerships with local government and the community.Safer Napier: Provides and encourages coordination, facilitation and liaison between the community groups that contribute to crime prevention, mitigation and safety.Business Facilitation: The Council’s economic development work, in particular, its small business facilitation and employment services, also has important social impacts that contribute to the overall social and cultural well-being of the Napier community. An important part of the Council’s economic development work continues to involve working with local community and Maori groups and interests, to improve business and employment outcomes for these sectors.
Outcome - Supportive, caring and inclusive communities
Library Services: The library service maintains a community information database listing a minimum of 350 community organisations which is electronically available, a Books-on-Wheels Service for the housebound and reading programmes for children and teens.Napier Aquatic Centre: Opportunities are provided to exercise, learn, relax and have fun in a healthy and supportive environment which assists in the health and rehabilitation of individuals and groups.Retirement and Rental Housing: Applies the principles of equity and fairness to ratepayers.Halls: Provides communities with a place to come together for meetings and activities.Community Development: Administrative support and liaison services provided to community based groups and committees. Agreed fi nancial assistance and resources provided to community groups, social service organisations and agencies in the city. Monitor and report on social and related conditions in Napier.Youth Development: Access to resources for young people to pursue cultural and sporting opportunities within their community provided. Ensure community services and young people are connected through access to information and partnerships.Safer Napier: Provides and encourages coordination, facilitation and liaison between the community groups that contribute to crime prevention, mitigation and safety.Emergency Management: Formulates community networks and communication systems to respond effectively to a civil defence emergency. Environmental Health Services: Improved quality of suburban environment is provided through services such as noise control.Animal Control: A more co-ordinated approach to social service delivery to provide, secure and more satisfying social environment.Property Holdings: Provides leasehold land for residential use and enabling residential leaseholders to own their own properties.Kennedy Park: Provides support to local sports organisations.
Outcome - Safe and accessible recreational facilities
Library Services: The libraries are open to the public 100 hours per week. There are a variety of resources available, including books, magazines, audio visual materials and electronic resources. Staff members are available at multiple service points to assist the public with obtaining the material they need. The library is used by a wide variety of people.Sportsgrounds: A full range of attractive facilities for organised outdoor sports is provided for use by citizens and visitors. The multiple uses of facilities is promoted in order to use grounds and buildings to capacity.Napier Aquatic Centre: A safe and well presented aquatic centre is provided whilst the standards are recognised to the highest national standards. Pool water quality is provided that is safe for users and meets or exceeds national standards. Pride is installed in the centre by its users and users are assisted in a positive recreational experience.Passive Recreation Facilities: Public gardens are provided for the pleasure and quiet relaxation of citizens and visitors. A network of open space reserves is provided which subdivides the city into manageable suburban areas. Local community areas are provided for general outdoor recreation for the use of the local residents, especially children.Par 2 MiniGolf: Provides an attractive and relaxed leisure environment.Inner Harbour: Safe accessible water-based recreational opportunities are provided.Halls: Provides communities with a place to come together for meetings and activities.Municipal Theatre: Allows residents to enjoy a range of theatrical, cultural and artistic experiences.War Memorial Conference Centre: Provides a facility for community and commercial hire.National Aquarium of New Zealand: Provides opportunity for a range of visitor experiences.Kennedy Park: Provides facilities for young people and families.
Outcome - Communities that value and promote their unique culture and heritage
Library Services: The library service maintains five collections of resources reflecting and enhancing the culture of the city; Art Deco, Maori, Hawke’s Bay Heritage, Robson Collection on Restorative Justice and the Irene Lister Taradale Archive. The library service indexes all family notices and important local news stories published in the main local journal(s) of record to acceptable library standards and make them electronically accessible to all library users.Cultural Services: Actively promotes the region’s heritage and helps to preserve cultural facilities.Par 2 MiniGolf: Providing culturally themed aspects to Par 2 MiniGolf.War Memorial Conference Centre: The Centre values and protects a place of historical signifi cance by housing and maintaining the eternal fl ame memorial.Municipal Theatre: Maintains the Art Deco heritage and is an integral part of the Napier Art Deco experience.

Page 8 Napier City Council Annual Report 2007/08
Community Outcomes
Community Development: By undertaking ongoing liaison with community groups, social services, key organisations and government agencies. City Development Planning: Actively participates in preserving the heritage of the city identifying the heritage value of the city as a whole through adding to the heritage inventory and Commissioning appropriate Heritage studies. Supports and promotes cultural diversity by encouraging all relevant stakeholders to have the opportunity to comment prior to formal notifi cation of District Plan modifi cations.Marineland of New Zealand: Increases community pride in regional museums and exhibitions.National Aquarium of NZ: Provides cultural experience which adds to the intrinsic value of the community.Napier i-SITE: Increases knowledge of the local area and what it has to offer.
Environmental Wellbeing
Outcome - A lifetime of good health and wellbeing
Napier Aquatic Centre: Swimming and other programmes are presented as life skills for individuals to develop to their full potential. Affordable access to high quality activities and educational programmes are provided. This access is for individuals, as well as groups and school users.Marine Parade Pool Complex: An alternative recreation facility which encourages and promotes fitness of residents. Retirement and Rental Housing: Assistance is available to tenants and they are visited on a regular basis.Halls: Provides and maintains an appropriate number and range of community facilities.Public Toilets: The closure time of public toilets due to cleaning or repair and maintenance is minimised.Youth Development: Provides safe choices that are alcohol and drug free and promote health and wellbeing of youth in our community.Environmental Health Services: A water sampling programme is carried out in excess of the National Drinking Water Standard requirements.Marineland of New Zealand: Provides education services and opportunities and environmental enhancement.Water: Provides water suitable for human consumption.
Outcome - Safe and secure communities
Inner Harbour: The Inner Harbour environment allows safe access to the amenities.Retirement and Rental Housing: Provides a safe environment for the tenants and ensures tenants comply with the conditions of the Tenancy Agreement and with maintenance and improvements identifi ed.Safer Napier: Develops and implements community based crime reduction activities that mitigate the effects of crime consistent with the Governments crime Reduction Strategy and its seven key goals. Promotes safety in the community that emphasises situational crime.Community Safety: Security patrols are provided in the inner city.
Building Consents: Planning and City heritage provide for safe and secure communities.Environmental Health Services: Inspections of registered premises are carried out.Parking Services: Contributes to a safe inner city.Property Holdings: Ensuring Council buildings are well maintained and meet current standards and safety requirements.Roading: Road surfaces provide a comfortable and smooth ride.Roads are safe - number of injury crashes are minimised in accordance with Land Transport NZ (LTNZ) Strategy to 2010.
Solid Waste: Safeguards environment and community health.Stormwater: Minimising the adverse effects of surface water on human health, infrastructure, property and the environment.Wastewater: Protect Public Health by means of collection, conveyance and disposal of wastewater from urban areas.Water: Provides water for domestic use, industrial and commercial purposes, and for fire fighting and other emergencies.
Outcome - An environment that is appreciated, protected and sustained for future generations
Passive Recreation Facilities: Reserves are sustainably managed and developed as a natural recreational resource for the enjoyment of the inhabitants of and the visitors to Napier.Burial and Cremation Services: A well maintained and aesthetically pleasing environment for all cemetery users.City Development Planning: Practices and supports sustainable urban development by developing planning frameworks for identifi ed city growth and development areas such as Greenfi eld growth areas. Ensures an adequate supply of commercial and industrial zoned land. Creates imaginative, interlinked urban public places and clearly and effectively communicates planning and resource management processes to the public.Regulatory Consents: Planning and City heritage protect and sustain the environment.Roading: Renewal work is undertaken when due.Solid Waste: Protects resources by reducing waste generated and producer pays for disposal to refl ect true cost of waste. Marineland of New Zealand: Provides education services and opportunities.National Aquarium of NZ: Raises environmental awareness in the community through increased understanding of marine life and conservation and environmental issues.Stormwater: Compliance with requirements of resource consents for discharging stormwater.Wastewater: Protect the environment from adverse effects of wastewater.Water: Actively promotes water conservation to help ensure effi cient use of water from the Heretaunga Plains aquifer.

Page 9Napier City Council Annual Report 2007/08
Statement of Compliance and Responsibility
Neil Taylor Barbara Arnott CHIEF EXECUTIVE MAYOR15 October 2008 15 October 2008
Compliance
The Council and management of the Napier City Council confi rm that all the statutory requirements in relation with the Annual Report have been complied with in accordance with clause 20 of schedule 10 of the Local Government Act 2002.
Responsibility
1. The Napier City Council and its management accept responsibility for the preparation of the annual Financial Statements and the judgements used in them.
2. The Napier City Council and its management accept responsibility for establishing and maintaining a system of internal control designed to provide reasonable assurance as to the integrity and reliability of fi nancial reporting.
3. In the opinion of the Napier City Council and its management the annual Financial Statements for the year ended 30 June 2008 fairly refl ect the fi nancial position and operations of Napier City Council.

Page 10 Napier City Council Annual Report 2007/08
AUDIT REPORT
TO THE READERS OFNAPIER CITY COUNCIL’S
FINANCIAL STATEMENTS AND PERFORMANCE INFORMATIONFOR THE YEAR ENDED 30 JUNE 2008
The Auditor-General is the auditor of Napier City Council (the City Council). The Auditor-General has appointed me, Mark Maloney, using the staff and resources of Audit New Zealand, to carry out an audit on his behalf. The audit covers the City Council’s compliance with the requirements of Schedule 10 of the Local Government Act 2002 that apply to the annual report of the City Council for the year ended 30 June 2008, including the fi nancial statements.
Unqualifi ed Opinion
In our opinion:
The fi nancial statements of the City Council on pages 14 to 93:
comply with generally accepted accounting practice in New Zealand;
and
- fairly refl ect :
the City Council’s fi nancial position as at 30 June 2008; and•
the results of its operations and cash fl ows for the year ended • on that date.
The service provision information of the City Council on pages 55 to 93 fairly refl ects the levels of service provision as measured against the intended levels of service provision adopted, as well as the reasons for any signifi cant variances, for the year ended on that date; and
The Council has complied with the other requirements of Schedule 10 of the Local Government Act 2002 that apply to the annual report (the “other requirements”).
The audit was completed on 15 October 2008, and is the date at which our opinion is expressed.
The basis of our opinion is explained below. In addition, we outline the responsibilities of the Council and the Auditor, and explain our independence.
Basis of Opinion
We carried out the audit in accordance with the Auditor-General’s Auditing Standards, which incorporate the New Zealand Auditing Standards.
We planned and performed the audit to obtain all the information and explanations we considered necessary in order to obtain reasonable assurance that the fi nancial statements, performance information and the other requirements did not have material misstatements, whether caused by fraud or error.
Page 11Napier City Council Annual Report 2007/08
Audit Report
Material misstatements are differences or omissions of amounts and disclosures that would affect a reader’s overall understanding of the fi nancial statements, performance information and the other requirements. If we had found material misstatements that were not corrected, we would have referred to them in our opinion.
The audit involved performing procedures to test the information presented in the fi nancial statements, performance information and the other requirements. We assessed the results of those procedures in forming our opinion.
Audit procedures generally include:
determining whether signifi cant fi nancial and management controls are working and can be relied on to produce complete and accurate data;
verifying samples of transactions and account balances;
performing analyses to identify anomalies in the reported data;
reviewing signifi cant estimates and judgements made by the Council;
confi rming year-end balances;
determining whether accounting policies are appropriate and consistently applied; and
determining whether all required disclosures are adequate.
We did not examine every transaction, nor do we guarantee complete accuracy of the fi nancial statements, performance information and the other requirements.
We evaluated the overall adequacy of the presentation of information in the fi nancial statements, performance information and the other requirements. We obtained all the information and explanations we required to support our opinion above.
Responsibilities of the Council and the Auditor
The Council is responsible for preparing fi nancial statements in accordance with generally accepted accounting practice in New Zealand. The fi nancial statements must fairly refl ect
the fi nancial position of the City Council as at 30 June 2008. They must also fairly refl ect
the results of its operations and cash fl ows and the levels of service provision for the year ended on that date. The Council is also responsible for meeting the other requirements of Schedule 10 and including that information in the annual report. The Council’s responsibilities arise from Section 98 and Schedule 10 of the Local Government Act 2002.
We are responsible for expressing an independent opinion on the fi nancial statements, performance information and the other requirements and reporting that opinion to you. This responsibility arises from section 15 of the Public Audit Act 2001 and section 99 of the Local Government Act 2002.

Page 12 Napier City Council Annual Report 2007/08
Audit Report
Independence
When carrying out the audit we followed the independence requirements of the Auditor-General, which incorporate the independence requirements of the Institute of Chartered Accountants of New Zealand.
Other than the audit and in conducting the audit of Long Term Council Community Plan, we have no relationship with or interests in the City Council.
Mark Maloney
Audit New ZealandOn behalf of the Auditor-GeneralPalmerston North, New Zealand
Matters Relating to the Electronic Presentation of the Audited Financial Statements, Performance Information and the Other RequirementsThis audit report relates to the fi nancial statements, performance information and the other requirements of Napier City Council for the year ended 30 June 2008 included on Napier City Council’s website. The Napier City Council’s Council is responsible for the maintenance and integrity of Napier City Council’s website. We have not been engaged to report on the integrity of Napier City Council’s website. We accept no responsibility for any changes that may have occurred to the fi nancial statements, performance information and the other requirements since they were initially presented on the website. The audit report refers only to the fi nancial statements, performance information and the other requirements named above. It does not provide an opinion on any other information which may have been hyperlinked to or from the fi nancial statements, performance information and the other requirements. If readers of this report are concerned with the inherent risks arising from electronic data communication they should refer to the published hard copy of the audited fi nancial statements, performance information and the other requirements as well as the related audit report dated 15 October 2008 to confi rm the information included in the audited summary annual presented on this website.Legislation in New Zealand governing the preparation and dissemination of fi nancial information may differ from legislation in other jurisdictions.

Page 13Napier City Council Annual Report 2007/08
Financial Statements
for the year ended 30 June 2008

Page 14 Napier City Council Annual Report 2007/08
Statement of Changes in Equity for the year ended 30 June 2008
Statement of Financial Performance
The accompanying notes form part of and should be read in conjunction with these financial statements.
Note
Actual2008$000
Budget2008$000
Actual2007$000
IncomeRates revenue 4 39,708 39,253 38,333Finance income 9 3,661 1,797 1,892Other revenue 5 46,023 45,757 43,476Other gains/(losses) 6 982 - 2,366Total income 90,374 86,807 86,067
Expenditure
Employee benefi t expenses 7 22,005 20,331 20,727
Depreciation and amortisation 17, 18 16,131 16,047 14,734Other expenses 8 32,678 31,755 28,927Finance costs 9 1,236 4,199 1,430Total operating expenditure 72,050 72,332 65,818
Operating surplus/(deficit) before tax 18,324 14,475 20,249Share of associate surplus/(defi cit) 20 167 - 158Surplus/(deficit) before tax 18,491 14,475 20,407
Income tax expense 10 - - - Surplus/(defi cit) after tax 18,491 14,475 20,407
Note
Actual2008$000
Budget2008$000
Actual2007$000
Balance at 1 July 1,113,013 1,103,142 1,092,568Property, plant and equipmentRevaluation gains/(losses) taken to equity 25 - - - Gain on property valuations 25 129,013 50,701 -Financial assets at fair value through equityValuation gains/(losses) taken to equity 25 32 - 38Net income/(expense) recognised directly in equity 129,045 50,701 38Surplus/(defi cit) for the year 25 18,491 14,475 20,407Total recognised income/(expense) for the year ended 30 June 147,536 65,176 20,445Balance at 30 June 1,260,549 1,168,318 1,113,013

Page 15Napier City Council Annual Report 2007/08
Statement of Financial Positionas at 30 June 2008
The accompanying notes form part of and should be read in conjunction with these financial statements.
Note
Actual2008$000
Budget2008$000
Actual2007$000
AssetsCurrent assetsCash and cash equivalents 11 3,468 25,759 9,305Debtors and other receivables 12 9,921 10,035 6,881Inventories 13 5,410 8,590 7,754Biological assets 14 189 - 229Other fi nancial assets 15 30,203 - 22,907Non current assets held for sale 16 - - 1,311Total current assets 49,191 44,384 48,387
Non-current assetsProperty, plant and equipment 17 1,180,461 1,174,168 1,046,221Intangible assets 18 172 - 159Investment property 19 44,928 - 44,426Investment in associates 20 3,771 1,163 3,565Other fi nancial assets 15 9,392 2,025 2,079Total non-current assets 1,238,724 1,177,356 1,096,450Total assets 1,287,915 1,221,740 1,144,837
LiabilitiesCurrent liabilitiesCreditors and other payables 21 9,764 6,680 8,169Employee benefi t liabilities 22 2,620 2,000 2,269Borrowings 23 4,559 5,396 7,187Total current liabilities 16,943 14,076 17,625
Non-current liabilitiesProvisions 24 1,548 360 914Employee benefi t liabilities 22 1,807 1,510 1,658Borrowings 23 7,068 37,476 11,627Total non-current liabilities 10,423 39,346 14,199Total liabilities 27,366 53,422 31,824
EquityRetained earnings 25 655,305 399,383 630,253Other reserves 25 605,244 768,935 482,760Total public equity 1,260,549 1,168,318 1,113,013
Note: The 2008 budget values have been reclassifi ed in accordance with NZ IFRS where possible.

Page 16 Napier City Council Annual Report 2007/08
Statement of Cash Flowsfor the year ended 30 June 2008
The accompanying notes form part of and should be read in conjunction with these financial statements.
Note Actual2008$000
Budget2008$000
Actual2007$000
Cash fl ows from operating activitiesReceipts from rates revenue 39,590 39,253 38,169Interest received 2,917 1,797 1,525Dividends received 19 - - Receipts from other revenue 41,996 40,550 46,463Goods and services tax (net) (339) - (10)Payments to suppliers and employees (50,042) (52,248) (48,871)Interest paid (1,289) (4,199) (1,483)
Net cash from operating activities 29 32,852 25,153 35,793
Cash fl ows from investing activitiesProceeds from sale of property, plant and equipment 1,320 2,170 2,408Proceeds from sale of non-current assets held for sale 1,325 - - Proceeds from withdrawal of investments 43,953 1,973 49,130Purchase of property, plant and equipment (19,482) (30,122) (22,492)Purchase intangible assets (98) - (76)Acquisition of investments (58,519) (1,387) (66,140)
Net cash from investing activities (31,501) (27,366) (37,170)
Cash fl ows from fi nancing activitiesProceeds from borrowings - 9,031 2,000Repayment of borrowings (7,008) (3,142) (6,270)Payment of fi nance lease liabilities (180) - (299)
Net cash from fi nancing activities (7,188) 5,889 (4,569)
Net (decrease)/increase in cash, cash equivalents and bank overdrafts
(5,837) 3,676 (5,946)
Cash, cash equivalents and bank overdrafts at the beginning of the year
9,305 22,083 15,251
Cash, cash equivalents and bank overdrafts at the end of the year
3,468 25,759 9,305
The GST (net) component of operating activities refl ects the net GST paid and received with the Inland Revenue Department.The GST (net) component has been presented on a net basis, as the gross amounts do not provide meaningful information for fi nancial statement purposes.

Page 17Napier City Council Annual Report 2007/08
Notes to the Financial StatementsYear Ended 30 June 2008
1.1 Reporting EntityNapier City Council is a New Zealand Council and is governed by the Local Authorities Act 2002.The accounting policies adopted for preparation of the 2007/08 fi nancial statements comply with the New Zealand equivalents to International Reporting Standards (NZ IFRS) and are set out below. These policies have been consistently applied to the year presented, unless otherwise stated. The fi nancial statements include separate fi nancial statements for Napier City Council (the Council) as an individual entity and its 26% equity share of its associate Hawke’s Bay Airport Authority which is equity accountedThe primary objective of Napier City Council is to provide goods and services for the community or social benefi t rather than making a fi nancial return. Accordingly, Napier City Council has designated itself as a public benefi t entity for the purposes of New Zealand equivalents to NZ IFRS. Although Napier City Council’s associate company (Hawke’s Bay Airport Authority) is not classifi ed as a public benefi t entity the Napier City Council is considered a public benefi t entity for the purposes of New Zealand equivalents to NZ IFRS. The fi nancial statements of Napier City Council are for the year ended 30 June 2008. The fi nancial statements were authorised for issue by the Napier City Council on 15 October 2008.
1.2 Basis of PreparationThe fi nancial statements have been prepared in accordance with New Zealand generally accepted accounting practice (NZ GAAP). They comply with New Zealand equivalents to International Financial Reporting Standards (NZ IFRS), and other applicable Financial Reporting Standards, as appropriate for public benefi t entities.These financial statements have been prepared in accordance with the requirements of the Local Government Act 2002: Part 6, Section 98 and Part 3 of Schedule 10, which includes the requirement to comply with New Zealand generally accepted accounting practice (NZ GAAP).The accounting policies set out below have been applied consistently to all periods presented in these financial statements. Napier City Council has also chosen to early adopt NZIAS2.
1.3 Changes in Accounting PoliciesThere have been no changes in accounting policy during the period except for the application of the amended NZ IAS 2 standard for inventories. Existing policies have also been detailed in the accounting policies to provide additional clarifi cation for readers of the fi nancial statements. The additional accounting policy disclosures are 1.27 Grant Expenditure, 1.31 Budgets and 1.32 Cost Allocation.The amendment to IAS 2 requires public benefi t entities to measure inventory held for distribution at cost, adjusted when applicable for any loss of service potential. Prior to the amendment, public benefi t entities were required to measure inventories held for distribution at the lower of cost and current replacement cost.Application of the amendment is mandatory for reporting periods beginning on or after 1 January 2008. Napier City Council has elected to adopt the amended NZ IAS 2 early in accordance with transitional provisions, which require Napier City Council to account for the change in accounting policy
1. Statement of Accounting Policies for the year ended 30 June 2008
prospectively from 1 July 2007. No adjustment has been made to Napier City Council opening retained earnings as all stock held for distribution is recorded at cost.Standards, amendments and interpretations issued that are not yet effective and have not been early adopted and which are relevant to Napier City Council include:• NZ IAS 1 Presentation of Financial Statements (revised
2007) replaces NZ IAS 1 Presentation of Financial Statements (issued 2004) and is effective for reporting periods beginning on or after 1 January 2009. The revised standard requires information in fi nancial statements to be aggregated on the basis of shared characteristics and introduces a statement of comprehensive income. The statement of comprehensive income will enable readers to analyse changes in equity resulting from non-owner changes separately from transactions with owners. The revised standard gives Napier City Council the option of presenting items of income and expense and components of other comprehensive income either in a single statement of comprehensive income with subtotals or in two separate statements (a separate income statement followed by a statement of comprehensive income). The Napier City Council is required to adopt this standard for the year ending 30 June 2010, and is yet to decide whether it will prepare a single statement of comprehensive income or a separate income statement followed by a statement of comprehensive income.
• NZ IAS 23 Borrowing Costs (revised 2007) replaces NZ IAS 23 Borrowing Costs (issued 2004) and is effective for reporting periods beginning on or after 1 January 2009. The revised standard requires all borrowing costs to be capitalised if they are directly attributable to the acquisition, construction or production of a qualifying asset. The revised standard will also require borrowing costs to be considered when revaluing property, plant and equipment to fair value based on depreciated replacement cost. Any necessary adjustments to depreciated replacement carrying cost values will have fl ow on effects to depreciation expense. The Napier City Council is required to adopt this standard for the year ending 30 June 2010 and has not yet quantifi ed the potential impact of the new standard.
• NZ IFRS 3 Business Combinations (revised 2008) and the amended NZ IAS 27 Consolidated and Separate Financial Statements are effective for reporting periods beginning on or after 1 July 2009 and must be applied prospectively from that date. The main changes the revised NZ IFRS 3 and the amended IAS 27 will make to existing requirements or practice are:- Partial acquisitions – Non-controlling interests are
measured either as their proportionate interest in the net identifi able assets (which is the original IFRS 3 requirement) or at fair value.
- Step acquisitions – The requirement to measure at fair value every asset and liability at each step for the purposes of calculating a portion of goodwill has been removed. Instead, goodwill is measured as the difference at acquisition date between the fair value of any investment in the business held before the acquisition, the consideration transferred and the net assets acquired.

Page 18 Napier City Council Annual Report 2007/08
Notes to the Financial Statements for the Year Ended 30 June 2008
- Acquisition-related costs – Acquisition related costs are generally recognised as expenses (rather than included in the cost of acquisition).
- Contingent consideration – Contingent consideration must be recognised and measured at fair value at the acquisition date. Subsequent changes in fair value are recognised in accordance with other NZ IFRSs, usually in profi t or loss (rather than by adjusting the cost of acquisition).
Napier City Council is required to adopt and comply with, the revised NZ IFRS 3 and the amended NZ IAS 27, for the year ended 30 June 2010 if Napier City Council enters into any business combinations on or after 1 July 2009.1.4 Historical Cost ConventionThese fi nancial statements have been prepared under the historical cost convention, as modifi ed by the revaluation of available for sale fi nancial assets, fi nancial assets and liabilities (including derivative instruments) at fair value through profi t or loss, certain classes of property, plant and equipment, investment property and biological assets subject to agricultural activity.
1.5 Principles of ConsolidationAssociatesAssociates are all entities over which the Council has signifi cant infl uence but not control, generally evidenced by holding of between 20% and 50% of the voting rights. Investments in associates are accounted for in the Council fi nancial statements using the equity method of accounting.Dividends receivable from associates are recognised in the Council’s Statement of Financial Performance.
1.6 Joint Ventures• Jointly controlled assetsThe proportionate interests in the assets, liabilities, income and expenses of the jointly controlled assets have been incorporated into the financial statements under the appropriate headings, together with any liabilities incurred.
1.7 Foreign Currency TranslationFunctional and Presentation CurrencyItems included in the fi nancial statements of each of the Group’s entities are measured using the currency of the primary economic environment in which the entity operates (the functional currency). The fi nancial statements are presented in New Zealand dollars, which is the Council’s functional and presentation currency. All values are rounded to the nearest thousand dollars ($’000).Transactions and BalancesForeign currency transactions are translated into the functional currency using the exchange rates prevailing at the dates of the transactions. Foreign exchange gains and losses resulting from the settlement of such transactions and from the translation at year end exchange rates of monetary assets and liabilities denominated in foreign currencies are recognised in the Statement of Financial Performance, except when deferred in equity as qualifying cash fl ow hedges.
1.8 Revenue RecognitionRevenue comprises the fair value for the sale of goods and services, net of rebates and discounts. Revenue is
recognised as follows:• Rates Rates are recognised when levied. Penalties and discounts
relating to rates are included where applicable.• Residential developments Sales of sections in residential developments are
recognised when contracts for sale are unconditional.• Traffi c and parking infringements Traffi c and parking infringements are recognised when
tickets are issued.• Licences and permits Revenue derived from licences and permits are
recognised on application.• Development and fi nancial contributions Development contributions are recognised when invoiced
and are no longer refundable.• Sales of goods – retail Sales of goods are recognised when a product is sold to
the customer. Retail sales are usually in cash or by credit card. The recorded revenue is the gross amount of sale, including credit card fees payable for the transaction. Such fees are included in distribution costs.
• Sales of services Sales of services are recognised in the accounting
period in which the services are rendered, by reference to completion of the specifi c transaction assessed on the basis of the actual service provided as a proportion of the total services to be provided.
• Rental revenue Rental revenue is recognised in the period that it relates
to.• Interest income Interest income is recognised on a time proportion basis
using the effective interest method. When a receivable is impaired, the Council reduces the carrying amount to its recoverable amount, being the estimated future cash fl ow discounted at original effective interest rate of the instrument, and continues unwinding the discount as interest income. Interest income on impaired loans is recognised using the rate of interest used to discount the future cash fl ows for the purpose of measuring the impairment loss.
• Dividend income Dividend income is recognised when the right to receive
payment is established.• Donated, subsidised or vested assets Where a physical asset is acquired for nil or nominal
consideration the fair value of the asset received is recognised as revenue.
• Grants and subsidies Grants and subsidies received in relation to the provision
of services are recognised on a percentage of completion basis. Other grants and subsidies are recognised when receivable. Napier City Council receives the majority of grants and subsidies income from Land Transport New Zealand (LTNZ) which subsidises part of Napier City Councils costs in maintaining the local road infrastructure.

Page 19Napier City Council Annual Report 2007/08
1.9 Income TaxThe Council is exempt from income tax except on interest or other income received from certain trading activities. The income tax expense or revenue for the period is the tax payable on the current period’s taxable income based on the national income tax rate for each jurisdiction adjusted by changes in deferred tax assets and liabilities attributable to temporary differences between the tax bases of assets and liabilities and their carrying amounts in the fi nancial statements, and to unused tax losses.Deferred tax assets and liabilities are recognised for temporary differences at the tax rates expected to apply when the assets are recovered or liabilities are settled, based on those tax rates which are enacted or substantively enacted for each jurisdiction. The relevant tax rates are applied to the cumulative amounts of deductible and taxable temporary differences to measure the deferred tax asset or liability. An exception is made for certain temporary differences arising from the initial recognition of an asset or a liability. No deferred tax asset or liability is recognised in relation to these temporary differences if they arose in a transaction, other than a business combination, that at the time of the transaction did not affect either accounting profi t or taxable profi t or loss.Deferred tax assets are recognised for deductible temporary differences and unused tax losses only if it is probable that future taxable amounts will be available to utilise those temporary differences and losses.Deferred tax liabilities and assets are not recognised for temporary differences between the carrying amount and tax bases of investments in controlled entities where the parent entity is able to control the timing of the reversal of the temporary differences and it is probable that the differences will not reverse in the foreseeable future.Current and deferred tax balances attributable to amounts recognised directly in equity are also recognised directly in equity.
1.10 Goods and Services Tax (GST)The Statement of Financial Performance has been prepared so that all components are stated exclusive of GST. All items in the Statement of Financial Position are stated net of GST, with the exception of receivables and payables, which include GST invoiced.Commitments and contingencies are disclosed exclusive of GST.
1.11 LeasesThe Council is the LesseeLeases of property, plant and equipment where the Council has substantially all the risks and rewards of ownership are classifi ed as fi nance leases. Finance leases are capitalised at the lease’s inception at the lower of the fair value of the leased property and the present value of the minimum lease payments. The corresponding rental obligations, net of fi nance charges, are included in other long term payables. Each lease payment is allocated between the liability and fi nance charges so as to achieve a constant rate on the fi nance balance outstanding. The interest element of the fi nance cost is charged to the Statement of Financial Performance over the lease period so as to produce a constant periodic rate of interest on the remaining balance of the liability for each period. The property, plant and equipment acquired under
Notes to the Financial Statements for the Year Ended 30 June 2008
fi nance leases are depreciated over the shorter of the asset’s useful life and the lease term.Leases in which a signifi cant portion of the risks and rewards of ownership are retained by the lessor are classifi ed as operating leases. Payments made under operating leases (net of any incentives received from the lessor) are charged to the Statement of Financial Performance on a straight line basis over the period of the lease.The Council is the LessorAssets leased to third parties under operating leases are included in property, plant and equipment in the Statement of Financial Position. They are depreciated over their expected useful lives on a basis consistent with similar owned property, plant and equipment. Rental income (net of any incentives given to lessees) is recognised on a straight line basis over the lease term.
1.12 Impairment of AssetsAssets that have an indefi nite useful life are not subject to amortisation and are tested annually for impairment. Assets that are subject to amortisation or depreciation are reviewed for impairment whenever events or changes in circumstances indicate that the carrying amount may not be recoverable. An impairment loss is recognised for the amount by which the asset’s carrying amount exceeds its recoverable amount. The recoverable amount is the higher of an asset’s fair value less costs to sell and value in use. Where the future economic benefi ts of an asset are not primarily dependent on the asset’s ability to generate net cash infl ows, and where the Council would, if deprived of the asset, replace its remaining future economic benefi ts, value in use is determined as the depreciated replacement cost of the asset. For the purposes of assessing impairment, assets are grouped at the lowest levels for which there are separately identifi able cash fl ows (cash generating units).
1.13 Cash and Cash EquivalentsCash and cash equivalents includes cash on hand, deposits held at call with fi nancial institutions, other short term, highly liquid investments with original maturities of three months or less that are readily convertible to known amounts of cash and which are subject to an insignifi cant risk of changes in value, and bank overdrafts. Bank overdrafts are shown within borrowings in current liabilities on the Statement of Financial Position.
1.14 Trade receivablesTrade receivables are recognised initially at fair value and subsequently measured at amortised cost, less provision for doubtful debts. Trade receivables are due for settlement no more than [150] days from the date of recognition for land development and resale debtors, and no more than [30] days for other debtors.Collectibility of trade receivables is reviewed on an ongoing basis. Debts which are known to be uncollectible are written off. A provision for impairment of receivables is established when there is objective evidence that the Council will not be able to collect all amounts due according to the original terms of receivables. The amount of the provision is the difference between the asset’s carrying amount and the present value of estimated future cash fl ows, discounted at the effective interest rate. The amount of the provision is recognised in the Statement of Financial Performance.

Page 20 Napier City Council Annual Report 2007/08
1.15 InventoriesRaw Materials and Stores, Work in Progress and Finished GoodsRaw materials and stores, and fi nished goods are stated at the lower of cost and net realisable value costs are assigned to individual items of inventory on the basis of weighted average costs. Net realisable value is the estimated selling price in the ordinary course of business less the estimated costs of completion and the estimated costs necessary to make the sale.Inventory held for distributionInventories held for distribution are measured either at cost or at cost adjusted where applicable for any loss of service potential. These assets are held for distribution at no charge in the ordinary course of the Group’s operations.
1.16 Non current assets held for saleNon current assets are classifi ed as held for sale and stated at the lower of their carrying amount and fair value less costs to sell if their carrying amount will be recovered principally through a sale transaction rather than through continuing use.An impairment loss is recognised for any initial or subsequent write down of the asset to fair value less costs to sell. A gain is recognised for any subsequent increases in fair value less costs to sell of an asset, but not in excess of any cumulative impairment loss previously recognised. A gain or loss not previously recognised by the date of the sale of the non current asset is recognised at the date of derecognition.Non current assets (including those that are part of a disposal group) are not depreciated or amortised while they are classifi ed as held for sale. Interest and other expenses attributable to the liabilities of a disposal group classifi ed as held for sale continue to be recognised.Non current assets classifi ed as held for sale and the assets of a disposal group classifi ed as held for sale are presented separately from the other assets in the Statement of Financial Position. The liabilities of a disposal group classifi ed as held for sale are presented separately from other liabilities in the Statement of Financial Position.
1.17 Investments and other financial assetsFinancial assets at fair value through profit or lossThis category has two sub categories: fi nancial assets held for trading, and those designated at fair value through profi t or loss on initial recognition. A fi nancial asset is classifi ed in this category if acquired principally for the purpose of selling in the short term or if so designated by management. The policy of management is to designate a fi nancial asset if there exists the possibility it will be sold in the short term and the asset is subject to frequent changes in fair value. Derivatives are also categorised as held for trading unless they are designated as hedges. Assets in this category are classifi ed as current assets if they are either held for trading or are expected to be realised within 12 months of the Statement of Financial Position date.Loans and receivablesLoans and receivables are non derivative fi nancial assets with fi xed or determinable payments that are not quoted in an active market. They arise when the Council provides money, goods or services directly to a debtor with no intention of selling the receivable. They are included in current assets, except for those with maturities greater than 12 months after
Notes to the Financial Statements for the Year Ended 30 June 2008
the Statement of Financial Position date which are classifi ed as non current assets. Loans and receivables are included in receivables in the Statement of Financial Position.Held to maturity investmentsHeld to maturity investments are non derivative fi nancial assets with fixed or determinable payments and fixed maturities that the Council’s management has the positive intention and ability to hold to maturity.Available for sale financial assets and fair value through equityAvailable for sale fi nancial assets, comprising principally marketable equity securities, are non derivatives that are either designated in this category or not classifi ed in any of the other categories. They are included in non current assets unless management intends to dispose of the investment within 12 months of the Statement of Financial Position date.Purchases and sales of investments are recognised on trade date the date on which the Council commits to purchase or sell the asset. Investments are initially recognised at fair value plus transaction costs for all fi nancial assets not carried at fair value through profi t or loss. Financial assets are derecognised when the rights to receive cash fl ows from the fi nancial assets have expired or have been transferred and the Council has transferred substantially all the risks and rewards of ownership.Available for sale fi nancial assets and fi nancial assets at fair value through profi t and loss are subsequently carried at fair value. Loans and receivables and held to maturity investments are carried at amortised cost using the effective interest method. Realised and unrealised gains and losses arising from changes in the fair value of the fi nancial assets at fair value through profi t or loss category are included in the income statement in the period in which they arise. Unrealised gains and losses arising from changes in the fair value of non monetary securities classifi ed as available for sale are recognised in equity in the available for sale investments revaluation reserve. When securities classifi ed as available for sale are sold or impaired, the accumulated fair value adjustments are included in the Statement of Financial Performance as gains and losses from investment securities.The fair values of quoted investments are based on current bid prices. If the market for a fi nancial asset is not active (and for unlisted securities), the Council establishes fair value by using valuation techniques. These include reference to the fair values of recent arm’s length transactions, involving the same instruments or other instruments that are substantially the same, discounted cash fl ow analysis, and option pricing models refi ned to refl ect the issuer’s specifi c circumstances.The Council assesses at each balance date whether there is objective evidence that a fi nancial asset or group of fi nancial assets is impaired. In the case of equity securities classifi ed as available for sale, a signifi cant or prolonged decline in the fair value of a security below its cost is considered in determining whether the security is impaired. If any such evidence exists for available for sale fi nancial assets, the cumulative loss measured as the difference between the acquisition cost and the current fair value, less any impairment loss on that fi nancial asset previously recognised in profi t and loss is removed from equity and recognised in the Statement of Financial Performance. Impairment losses

Page 21Napier City Council Annual Report 2007/08
recognised in the Statement of Financial Performance on equity instruments are not reversed through the Statement of Financial Performance.
1.18 DerivativesDerivatives are initially recognised at fair value on the date a derivative contract is entered into and are subsequently remeasured to their fair value. The method of recognising the resulting gain or loss depends on whether the derivative is designated as a hedging instrument, and if so, the nature of the item being hedged. The Council designates certain derivatives as either; (1) hedges of the fair value of recognised assets or liabilities or a fi rm commitment (fair value hedge); or (2) hedges of highly probable forecast transactions (cash fl ow hedges).The Council documents at the inception of the transaction the relationship between hedging instruments and hedged items, as well as its risk management objective and strategy for undertaking various hedge transactions. The Council also documents its assessment, both at hedge inception and on an ongoing basis, of whether the derivatives that are used in hedging transactions have been and will continue to be highly effective in offsetting changes in fair values or cash fl ows of hedged items.Fair value hedgeChanges in the fair value of derivatives that are designated and qualify as fair value hedges are recorded in the Statement of Financial Performance, together with any changes in the fair value of the hedged asset or liability that are attributable to the hedged risk.Cash flow hedgeThe effective portion of changes in the fair value of derivatives that are designated and qualify as cash fl ow hedges is recognised in equity in the hedging reserve. The gain or loss relating to the ineffective portion is recognised immediately in the Statement of Financial Performance.Amounts accumulated in equity are recycled in the Statement of Financial Performance in the periods when the hedged item will affect profi t or loss (for instance when the forecast sale that is hedged takes place). However, when the forecast transaction that is hedged results in the recognition of a non fi nancial asset (for example, plant) or a non fi nancial liability, the gains and losses previously deferred in equity are transferred from equity and included in the measurement of the initial cost or carrying amount of the asset or liability.When a hedging instrument expires or is sold or terminated, or when a hedge no longer meets the criteria for hedge accounting, any cumulative gain or loss existing in equity at that time remains in equity and is recognised when the forecast transaction is ultimately recognised in the Statement of Financial Performance. When a forecast transaction is no longer expected to occur, the cumulative gain or loss that was reported in equity is immediately transferred to the Statement of Financial Performance.Derivatives that do not qualify for hedge accountingCertain derivative instruments do not qualify for hedge accounting. Changes in the fair value of any derivative instrument that does not qualify for hedge accounting are recognised immediately in the Statement of Financial Performance.
1.19 Fair value estimationThe fair value of fi nancial assets and fi nancial liabilities
Notes to the Financial Statements for the Year Ended 30 June 2008
must be estimated for recognition and measurement or for disclosure purposes.The fair value of forward exchange contracts is determined using forward exchange market rates at the Statement of Financial Position date.The nominal value less estimated credit adjustments of trade receivables and payables are assumed to approximate their fair values. The fair value of fi nancial liabilities for disclosure purposes is estimated by discounting the future contractual cash fl ows at the current market interest rate that is available to the Council for similar fi nancial instruments.
1.20 Property, plant and equipmentItems of property, plant and equipment are initially recognised at cost, which includes purchase price plus directly attributable costs of bringing the asset to the location and condition necessary for it to be capable of operating in the manner intended by management. Where a physical asset is acquired for nil or nominal consideration the fair value of the asset received is recognised as revenue.Land and buildings (except for investment properties) are shown at fair value (which is based on periodic valuations by external independent valuers that are performed with suffi cient regularity to ensure that the carrying value does not differ materially from fair value) less subsequent depreciation for buildings. Any accumulated depreciation at the date of revaluation is eliminated against the gross carrying amount of the asset and the net amount is restated to the revalued amount of the asset. All other property, plant and equipment is stated at historical cost less depreciation. Historical cost includes expenditure that is directly attributable to the acquisition of the items. Cost may also include transfers from equity of any gains/losses on qualifying cash fl ow hedges of foreign currency purchases of property, plant and equipment.Subsequent costs are included in the asset’s carrying amount or recognised as a separate asset, as appropriate, only when it is probable that future economic benefi ts associated with the item will fl ow to the Council and the cost of the item can be measured reliably. All other repairs and maintenance are charged to the Statement of Financial Performance during the fi nancial period in which they are incurred.Increases in the carrying amounts arising on revalued assets are credited to a revaluation reserve in public equity. To the extent that the increase reverses a decrease previously recognised in profi t or loss, the increase is fi rst recognised in profi t and loss. Decreases that reverse previous increases of the same asset are fi rst charged against revaluation reserve directly in equity to the extent of the remaining reserve attributable to the asset; all other decreases are charged to the Statement of Financial Performance.Depreciation of property, plant and equipment other than land is calculated on a straight line basis at rates that will write off the cost or valuation, less estimated residual value, over their expected useful economic lives. The following rates have been applied:
Buildings and structural improvements 2 to 10%Fixed plant and equipment 5 to 20%Mobile plant and equipment 5 to 50%Motor vehicles 10 to 33.33%Furniture and fi ttings 4 to 20%Offi ce equipment 8 to 66.67%Library bookstock 7 to 25%

Page 22 Napier City Council Annual Report 2007/08
Notes to the Financial Statements for the Year Ended 30 June 2008
Depreciation of infrastructural and restricted assets is calculated on a straight line basis at rates that will write off their cost or valuation over their expected useful economic lives.The expected lives, in years, of major classes of infrastructural and restricted assets are as follows:
Roading YearsBase course 70Surfacings 12Concrete pavers 70Footpaths and pathways /walkways 15-80Drainage 14-80Bridges and structures 20-100Road lighting 4-50Traffi c services and safety 10-25Water Reticulation 56-107Reservoirs 100Pump stations 25-80Stormwater Reticulation 100Pump stations 15-75Sewerage Reticulation 80Pump stations 15-80Milliscreen 10-80Outfall 80OthersGrandstands, community and sports halls Sportsgrounds, parks and reserves 50improvements 10-50Buildings on reserves 10-50Pools 10-50Inner harbour 20-50
The assets’ residual values and useful lives are reviewed, and adjusted if appropriate, at each Statement of Financial Position date.An asset’s carrying amount is written down immediately to its recoverable amount if the asset’s carrying amount is greater than its estimated recoverable amount (note 1.12).Gains and losses on disposals are determined by comparing proceeds with carrying amount. These are included in the Statement of Financial Performance. When revalued assets are sold, it is Council’s policy to transfer the amounts included in other reserves in respect of those assets to retained earnings.Valuation of property plant and equipmentAs at 30 June 2008, Council’s Property and Equipment are valued as follows:
Description Method of valuationInvestment property Valued by independent registered
valuer M. Penrose, ANZIV, SNZPI, AAMINZ of Telfer Young (HB) Ltd as at 30 June 2008 using fair value.
Valuation of this class of asset is performed on an annual basis (see also note 1.21).
Library collections Valued at depreciated replacement cost in accordance with the guidelines released by the New Zealand Library Association and the National Library in May 2002 for general collections and replacement cost for the Heritage Collection. Library valuations are performed Dr Robin Watt MA (Hons.) PhD of R J Watt & Associates. The last valuation was performed in June 2008.
Land under roads Land under roads were valued based on fair value of adjacent land determined by M. Penrose, ANZIV, SNZPI, AAMINZ of Telfer Young (HB) Ltd as at 30 June 2005. Under NZ IFRS Napier City Council has elected to use fair value of land under roads at 30 June 2005 as deemed cost. Land under roads are no longer revalued.
Land and buildings Valued by independent registered valuer M. Penrose, ANZIV, SNZPI, AAMINZ of Telfer Young (HB) Ltd as at 30 June 2008 using fair value. Land and buildings are revalued on a three yearly valuation cycle. The carrying values are also reviewed at each balance date to ensure that those values are not materially different to fair value.
Infrastructural assets Valued by independent registered valuer M. Penrose, ANZIV, SNZPI, AAMINZ of Telfer Young (HB) Ltd as at 30 June 2008 at fair value using depreciated replacement cost method. Infrastructural assets are revalued on a three yearly valuation cycle. The carrying values are also reviewed at each balance date to ensure that those values are not materially different to fair value. If there is a material difference, then the off-cycle asset classes are revalued. All infrastructural asset classes carried at valuation were valued.
Restricted assets Valued by independent registered valuer M. Penrose, ANZIV, SNZPI, AAMINZ of Telfer Young (HB) Ltd as at 30 June 2008 using depreciated replacement cost method.
Plant and equipment Valued in 1994 using market value. Additions are at cost.
Omarunui Landfi ll Landfi ll assets comprise of land, plant and equipment and motor vehicles. All assets are valued at cost less depreciation.

Page 23Napier City Council Annual Report 2007/08
Notes to the Financial Statements for the Year Ended 30 June 2008
1.21 Investment propertyInvestment property is held for long term rental yields and capital appreciation and is not occupied by the Council or held to meet service delivery objectives. Properties leased to third parties under operating leases will generally be classifi ed as investment property unless:• the property is held to meet service delivery objectives,
rather than to earn rentals or for capital appreciation• the occupants provide services that are integral to the
operation of the owner’s business and/or these services could not be provided effi ciently and effectively by the lessee in another location
• the property is being held for future delivery of services
• the lessor uses services of the owner and those services are integral to the reasons for their occupancy of the property.
Investment property is carried at fair value, representing open market value determined annually by external valuers. Changes in fair values are recorded in the Statement of Financial Performance as part of other gains/(losses).
1.22 Intangible assetsTrademarks and licencesTrademarks and licences have a fi nite useful life and are carried at cost less accumulated amortisation and impairment losses. Amortisation is calculated using the straight line method to allocate the cost of trademarks and licences over their estimated useful lives, which vary from 3 to 5 years.Computer softwareAcquired computer software and software licences are capitalised on the basis of the costs incurred to acquire and bring to use the specifi c software. These costs are amortised over their estimates useful lives of 3 to 5 years. Cost associated with developing or maintaining computer software are recognised as an expense as incurred. Costs that are directly associated with the production of identifi able and unique software products controlled by the Council, and that will generate economic benefi ts exceeding costs beyond one year, are recognised as intangible assets. Direct costs include the software development employee costs and an appropriate portion of relevant overheads. Computer software development costs recognised as assets are amortised over their estimated useful lives not exceeding 3 years.
1.23 Trade and other payablesThese amounts represent liabilities for goods and services provided to the Council prior to the end of fi nancial year which are unpaid. The amounts are unsecured and are usually paid within [30] days of recognition.
1.24 BorrowingsBorrowings are initially recognised at fair value, net of transaction costs incurred. Borrowings are subsequently measured at amortised cost. Any difference between the proceeds (net of transaction costs) and the redemption amount is recognised in the Statement of Financial Performance over the period of the borrowings using the effective interest method.Borrowings are classifi ed as current liabilities unless the Council has an unconditional right to defer settlement of the liability for at least 12 months after the Statement of Financial Position date.
1.25 Borrowing costsBorrowing costs are recognised as an expense in the period in which they are incurred.
1.26 ProvisionsProvisions are recognised when the Council has a present legal or constructive obligation as a result of past events; it is more likely than not that an outfl ow of resources will be required to settle the obligation; and the amount has been reliably estimated. Provisions are not recognised for future operating losses.Where there are a number of similar obligations, the likelihood that an outfl ow will be required in settlement is determined by considering the class of obligations as a whole. A provision is recognised even if the likelihood of an outfl ow with respect to any one item included in the same class of obligations may be small.Provisions are measured at the present value of the expenditures expected to be required to settle the obligation using a pre-tax rate that refl ects current market assessments of the time value of money and the risks specifi c to the obligation. An increase in the provision due to the passage of time is recognised as an interest expense.
1.27 Grant expenditureNon-discretionary grants are those grants that are awarded if the grant application meets the specifi ed criteria and are recognised as expenditure when an application that meets the specifi ed criteria for the grant has been received.Discretionary grants are those grants where Napier City Council has no obligation to award on receipt of the grant application and are recognised as expenditure when a successful applicant has been notifi ed of Napier City Councils decision.
1.28 Employee benefitsWages and salaries, annual leave and sick leaveLiabilities for wages and salaries, including non monetary benefi ts, annual leave and accumulating sick leave expected to be settled within 12 months of the reporting date are recognised in other payables in respect of employees’ services up to the reporting date and are measured at the amounts expected to be paid when the liabilities are settled. Liabilities for non accumulating sick leave are recognised when the leave is taken and measured at the rates paid or payable.Long service leave and gratuitiesThe liability for long service leave and gratuities is recognised in the provision for employee benefi ts and measured as the present value of expected future payments to be made in respect of services provided by employees up to the reporting date using the projected unit credit method. Consideration is given to expected future wage and salary levels, experience of employee departures and periods of service. Expected future payments are discounted using market yields at the reporting date on national government bonds with terms to maturity and currency that match, as closely as possible, the estimated future cash outfl ows.Retirement benefit obligationsCurrent and former employees of the Council are entitled to benefi ts on retirement, disability or death from the Council’s multi-employer benefit scheme. The scheme manager, National Provident Fund, have advised council that is no

Page 24 Napier City Council Annual Report 2007/08
Notes to the Financial Statements for the Year Ended 30 June 2008
consistent and reliable basis for allocating the obligation scheme assets and cost of the multiemployer defi ned benefi t scheme to individual participating employers. As a result the scheme is accounted for as a defi ned contribution plan and contributions are recognised as an expense as they become payable. Prepaid contributions are recognised as an asset if a cash refund or a reduction in the future payments is available.Bonus plansThe Council recognises a liability and an expense for bonuses where contractually obliged or where there is a past practice that has created a constructive obligation.
1.29 Biological assetsLivestockLivestock are measured at their fair value less estimated point-of-sale costs. The fair value of livestock is determined based on market prices of livestock of similar age, breed and genetic merit.
1.30 EquityEquity is the community’s interest in Napier City Council and is measured as the difference between total assets and total liabilities. Equity is disaggregated and classifi ed into a number of reserves.The components of equity are:
- Retained earnings- Restricted reserves- Fair value and hedging reserves- Asset revaluation reserves
Restricted and Council created reservesRestricted reserves are a component of equity generally representing a particular use to which various parts of equity have been assigned. Reserves may be legally restricted or created by Napier City Council.Restricted reserves are those subject to specifi c conditions accepted as binding by Napier City Council and which may not be revised by Napier City Council without reference to the Courts or a third party. Transfers from these reserves may be made only for certain specifi ed purposes or when certain specifi ed conditions are met.Also included in restricted reserves are reserves restricted by Council decision. The Council may alter them without references to any third party or the Courts. Transfers to and from these reserves are at the discretion of the Council.Napier City Council’s objectives, policies and processes for managing capital are described in note 26.
1.31 Budget figuresThe budget fi gures are those approved by the Council and adopted as a part of the Council’s Long Term Financial Plan (LTCCP) or as revised and approved by Council prior to the commencement of the year in the Annual Plan. The budget fi gures have been prepared in accordance with NZ GAAP, using accounting policies that are consistent with those adopted by Napier City Council for the preparation of the fi nancial statements.
1.32 Cost AllocationDirect costs are those costs directly attributable to a signifi cant activity. Indirect costs are those costs, which cannot be identifi ed in an economically feasible manner, with a signifi cant activity.
Direct costs are charged directly to signifi cant activities. Indirect costs are charged to signifi cant activities using appropriate cost drivers such as actual usage, staff numbers and fl oor area.
1.33 Critical accounting estimates and assumptionsIn preparing these fi nancial statements Napier City Council has made estimates and assumptions concerning the future. These estimates and assumptions may differ from the subsequent actual results. Estimates and assumptions are continually evaluated and are based on historical experience and other factors, including expectations or future events that are believed to be reasonable under the circumstances. The estimates and assumptions that have a signifi cant risk of causing a material adjustment to the carrying amounts of assets and liabilities within the next fi nancial year are discussed as follows:Landfill aftercare provisionNote 24 discloses an analysis of the exposure of Napier City Council in relation to the estimates and uncertainties surrounding the landfi ll aftercare provision.Infrastructural assetsThere are a number of assumptions and estimates used when performing depreciated replacement cost valuations over infrastructural assets. These include:• the physical deterioration and condition of an asset, for
example the Council could be carrying an asset at an amount that does not refl ect its actual condition. This is particularly so for those assets which are underground such as stormwater, wastewater and water supply pipes. This risk is minimised by Council performing a combination off physical inspections and condition modelling assessments of underground assets;
• estimating any obsolescence or surplus capacity of an asset; and
• estimating the remaining useful lives over which the asset will be depreciated. These estimates can be impacted by the local conditions, for example weather patterns and traffi c growth. If useful lives do not refl ect the actual consumption of the benefi ts of the asset, then Napier City Council could be over or under estimating the annual depreciation charge recognised as an expense in the statement of fi nancial performance. To minimise this risk Napier City Councils infrastructural asset useful lives have been determined with reference to the NZ Infrastructural Asset Valuation and Depreciation Guidelines published by the National Asset Management Steering Group, and have been adjusted for local conditions based on past experience. Asset inspections and deterioration and condition modelling are also carried out regularly as part of the Napier City Council asset management planning activities, which gives Napier City Council further assurance over its useful life estimates.
Experienced independent valuers perform the Council’s infrastructural asset revaluations.
Critical judgements in applying Napier City Council’s accounting policies
Management has exercised the following critical judgements in applying the Napier City Council’s accounting policies for the period ended 30 June 2008:

Page 25Napier City Council Annual Report 2007/08
2. Explanation of major variances against budgetExplanations for major variations from Napier City Council’s estimated fi gures in the 2007/08 Annual Plan are as follows:
Statement of fi nancial performanceIncomea) Finance income was above budget $1.9m. This was the result of both higher than budget interest rates received on funds
invested +$0.8m and higher than budget average funds invested for the year +$1.1m.Expenditurea) Employee benefi t expenses were impacted by the additional week leave from 1 April 2007. Year ended 30 June 2008 was
the fi rst complete fi nancial year of impact. Holiday pay cost increases were $0.5m above prior year. Wage and salary increases negotiated after budget preparation account for the balance of the variance of actual against
budget expenditure.b) Finance costs below budget due to lower average loans for the year (Actual $1.2m Budget $4.2m)
Statement of fi nancial positionCurrent assetsa) Cash and cash equivalents were signifi cantly lower than budget for the period as cash funds held were on deposit for greater
than 90 days and are classifi ed as other fi nancial assets.b) Inventories are lower than budget due to Parklands subdivision development. Resource consent for the next stage of
development was in progress at year end whereas the inventory calculation for budget purposes anticipated that stage 2 land would be included in inventory at year end 2008.
c) Other fi nancial assets classifi ed as cash and cash equivalents for budget. Cash and other fi nancial assets (current and non- current) above budget mainly due to lower than budget capital expenditure for year -$12m (due to deferrals and timing variances).
Non current assetsa) Budget property plant and equipment value includes investment property and intangible assets. These assets are seperately
disclosed in the actual results. In addition 2007/08 revaluation total for property plant and equipment was +$129m against +$51m for budget. b) Investment in associates is higher than budget as budget was prepared for parent accounts only. Actual results include
investment in associates on an equity accounted basis.c) Other financial assets (current and non-current) are above budget mainly due to lower than budget capital
expenditure for year -$12m (arising from expenditure timing variances).Non current liabilitiesBorrowings are $30m lower than budget for the period. This is the result of deferral of Advanced Wastewater Treatment project $10m, loan funds not drawn on specifi c projects yet to be completed such as the overland drain project $2.0m, Museum building redevelopment $5m, Taradale Library extension $1.8m and CBD and Taradale Redevelopment (Roads) $3m.The remaining variance is a result of a combination of a budget assumption that all council approved loan authorities will be taken up before the commencement of the budget period and internal treasury practiceto fund projects by internal loan when cashfl ow requirements permit.Retained earnings and other reservesActual retained earnings includes $196m transfer of asset revaluation reserve (related to land under roads) from other reserves. This transfer arising from the IFRS deemed cost election for Land under Roads was not included in equity at the date of budget preparation.
Statement of movements in equityThe major budget variation in movements in equity is due to above budget increase in revaluation of Council assets (+$78m) along with higher than budget income (+$4m) as outlined above under statement of fi nancial performance income.
Classification of propertyNapier City Council owns a number of leasehold land and rental properties. The receipt of market-based rentals from these properties is incidental to the holding of these properties. In the case of residential leasehold properties there are legal restrictions applying to how council can
Notes to the Financial Statements for the Year Ended 30 June 2008
manage these properties and in the case of rental properties these are held as part of Napier City Councils social housing policy or to secure the ability to undertake long term city development projects. As these properties are held for service delivery objectives they have been accounted for as property, plant and equipment.

Page 26 Napier City Council Annual Report 2007/08
Notes to the Financial Statements for the Year Ended 30 June 2008
3. Summary cost of servicesActual
2008$000
Budget2008$000
Actual2007$000
IncomeRecreation 1,752 1,284 2,287Social and Cultural 5,849 4,024 5,701City Promotion 6,335 5,725 5,936Planning and Regulatory 3,909 3,703 3,767Roading 4,026 3,540 2,773Water and Wastes 14,407 12,937 13,672Property Assets 11,781 12,420 11,435Total activity income 48,059 43,633 45,571
Non targeted rates 28,685 28,411 27,749Other income 13,630 14,763 12,747Total income 90,374 86,807 86,067
ExpenditureDemocracy and Governance 1,907 1,919 1,681Recreation 8,035 8,288 7,875Social and Cultural 12,880 10,745 12,458City Promotion 7,593 7,620 7,459Planning and Regulatory 5,127 4,747 5,031Roading 12,607 13,288 11,875Water and Wastes 16,355 15,622 14,415Property Assets 8,098 9,004 6,650
72,602 71,233 67,444
Less internal expenditure (1,231) - (2,013)Other expenses 679 1,099 387Total operating expenditure 72,050 72,332 65,818

Page 27Napier City Council Annual Report 2007/08
Notes to the Financial Statements for the Year Ended 30 June 2008
4. Rates revenueActual
2008$000
Actual2007$000
Non targeted rates 28,685 27,749
Targeted rates attributable to activitiesWater 2,973 2,767Sewerage 6,387 6,217Refuse and sanitation 1,336 1,267Roading 175 181Marketing 152 152Total revenue from rates 39,708 38,333
Total rates revenue 39,708 38,333
Rates remissions 460 567Rates revenue net of remissions 39,248 37,766
In accordance with the Local Government (Rating) Act 2002, rates remitted under the Council’s Rate Remission Policies are recorded as expenditure and are also included under rates revenue as paid on behalf of the ratepayer.
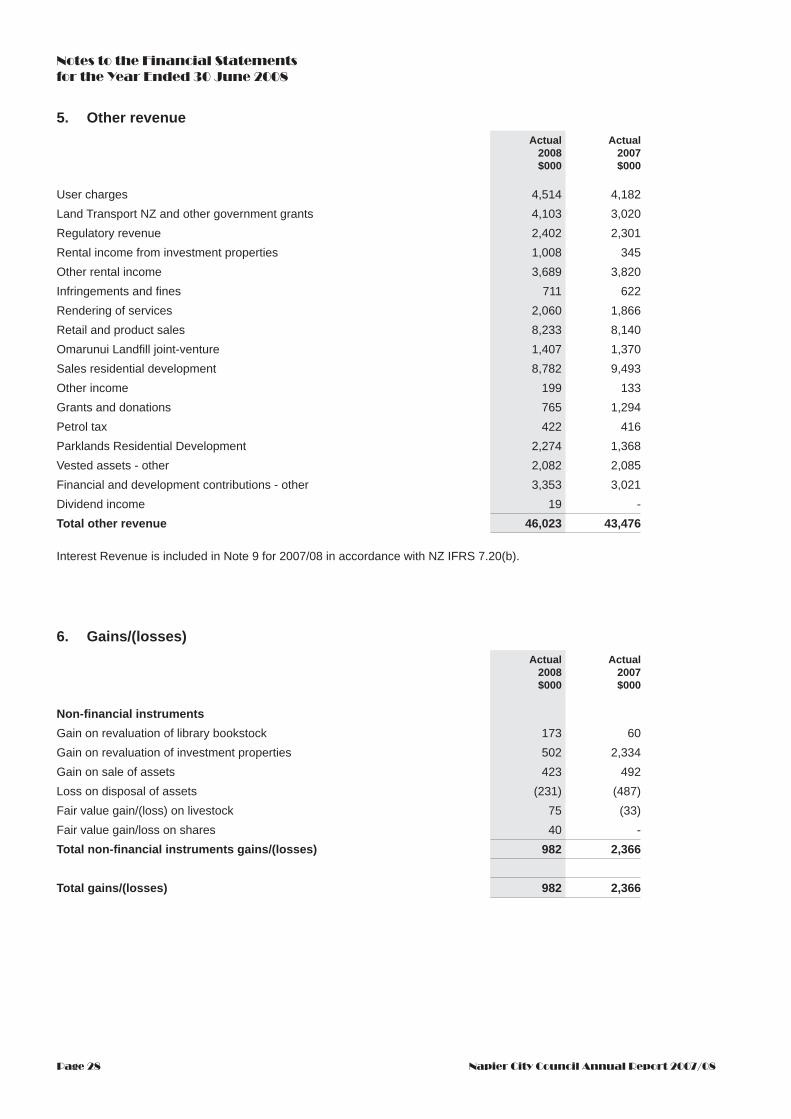
Page 28 Napier City Council Annual Report 2007/08
6. Gains/(losses)
5. Other revenue
Notes to the Financial Statements for the Year Ended 30 June 2008
Actual2008$000
Actual2007$000
User charges 4,514 4,182Land Transport NZ and other government grants 4,103 3,020Regulatory revenue 2,402 2,301Rental income from investment properties 1,008 345Other rental income 3,689 3,820Infringements and fi nes 711 622Rendering of services 2,060 1,866Retail and product sales 8,233 8,140Omarunui Landfi ll joint-venture 1,407 1,370Sales residential development 8,782 9,493Other income 199 133Grants and donations 765 1,294Petrol tax 422 416Parklands Residential Development 2,274 1,368Vested assets - other 2,082 2,085Financial and development contributions - other 3,353 3,021Dividend income 19 - Total other revenue 46,023 43,476
Interest Revenue is included in Note 9 for 2007/08 in accordance with NZ IFRS 7.20(b).
Actual2008$000
Actual2007$000
Non-fi nancial instrumentsGain on revaluation of library bookstock 173 60Gain on revaluation of investment properties 502 2,334Gain on sale of assets 423 492Loss on disposal of assets (231) (487)Fair value gain/(loss) on livestock 75 (33)Fair value gain/loss on shares 40 - Total non-fi nancial instruments gains/(losses) 982 2,366
Total gains/(losses) 982 2,366

Page 29Napier City Council Annual Report 2007/08
Notes to the Financial Statements for the Year Ended 30 June 2008
7. Employee benefi t expenses
8. Other expenses
9. Finance income and fi nance costs
Actual2008$000
Actual2007$000
Salaries and wages 21,819 20,476Employer contributions to multi-employer defi ned benefi t plans 96 116Increase/(decrease) in employee benefi t liabilities 90 135Total employee benefi t expenses 22,005 20,727
Actual2008$000
Actual2007$000
Audit fees - fi nancial statement audit 102 108Audit fees - LTCCP audit 1 - Audit fees - IFRS audit - 25Donations 21 17Bad debts written off 3 - Rental expense on operating leases 182 167Other operating expenses 32,369 28,610Total other expenses 32,678 28,927
Actual2008$000
Actual2007$000
Finance incomeInterest income: - term deposits and call accounts 2,912 1,306 - local authority stock 685 507 - sinking fund 64 79Total fi nance income 3,661 1,892
Finance costsInterest expense: - interest on borrowings 1,231 1,412 - discount unwind on provisions - - - fi nance charges on leased assets 5 18Total fi nance costs 1,236 1,430
Net fi nance income 2,425 462

Page 30 Napier City Council Annual Report 2007/08
Notes to the Financial Statements for the Year Ended 30 June 2008
10. Tax
11. Cash and cash equivalents
Relationship between tax expense and accounting profi tActual
2008$000
Actual2007$000
Surplus/(defi cit) before tax 18,324 20,407
Tax at 33% 6,047 6,734Non-taxable income (6,047) (6,734)Tax expense - -
Additional disclosuresA deferred tax asset has not been recognised in relation to unused tax losses of $666,218 (2007: $551,831).
Actual2008$000
Actual2007$000
Cash at bank and in hand 2,931 5,922Short term deposits maturing three months or less from date of acquision - 2,500Omarunui Landfi ll 537 883Total cash and cash equivalents 3,468 9,305
The carrying value of short-term deposits with maturity dates of three months or less approximates their fair value.There are no restrictions on the use of part or all of the cash.Cash include the following for the purposes of the cash fl ow statement:
Actual2008$000
Actual2007$000
Cash at bank and in hand 2,931 5,922Short term deposits maturing within three months - 2,500Omarunui Landfi ll 537 883
3,468 9,305

Page 31Napier City Council Annual Report 2007/08
Notes to the Financial Statements for the Year Ended 30 June 2008
12. Debtors and other receivablesActual
2008$000
Actual2007$000
Rates receivables 814 780Other receivables 4,010 2,099Parklands - unconditional contracts subdivision sales 3,844 3,202Transfund NZ subsidy claims 1,177 773Prepayments 76 27Total debtors and other receivables 9,921 6,881
There is no concentration of credit risk with respect to receivables outside the group, as the group has a large number of customers.
Napier City Council does not provide for any impairment on rates receivable as it has various powers under the Local Government (Rating) Act 2002 to recover any outstanding debts. Ratepayers can apply for payment plan options in special circumstances. Where such payment plans are in place, debts are discounted to the present value of future repayments.
These powers allow Napier City Council to commence legal proceedings to recover any rates that remain unpaid after the due date for payment. If payment has not been made after the Court’s judgment, then Napier City Council can apply to the Registrar of the High Court to have the judgment enforced by sale or lease of the rating unit.
The age of rates receivable overdue, whose payment terms have been renegotiated is $106,200 (2007: $236,000).
Napier City Council holds no collateral as security or other credit enhancements over receivables that are past due. Other receivables have been assessed for impairment at year end and no impairment has been provided for.
The status of receivables as at 30 June 2008 and 2007 are detailed below:
Actual2008$000
Actual2007$000
Current 8,264 5,693Past due 30 days 544 454Past due 60 days 66 90Past due 90 days 1,047 644
9,921 6,881

Page 32 Napier City Council Annual Report 2007/08
Notes to the Financial Statements for the Year Ended 30 June 2008
13. Inventories
14. Biological assets
Actual2008$000
Actual2007$000
Inventory held for distribution 154 155Inventory held for resale 205 190Parklands - work in progress 5,051 7,409Total inventories 5,410 7,754
Inventory held for distribution increased by 2008: $1,000 (2007: $13,000) due to stocktake adjustments.
The carrying amount of inventories pledged as security for liabilities is $nil (2007: $nil).
Actual2008$000
Actual2007$000
Biological assets changes in valueOpening value 1 July 229 241
Change in value arising from changes in fair value 75 (33)Increase in value due to natural increase / (decrease) 59 51Increase in value due to purchases 102 222Change in value due to sales (276) (252)Closing value 30 June 189 229
Biological assets comprise 1,403 (2007: 949) sheep largely held for breeding and 208 (2007: 370) cattle largely held for trading.
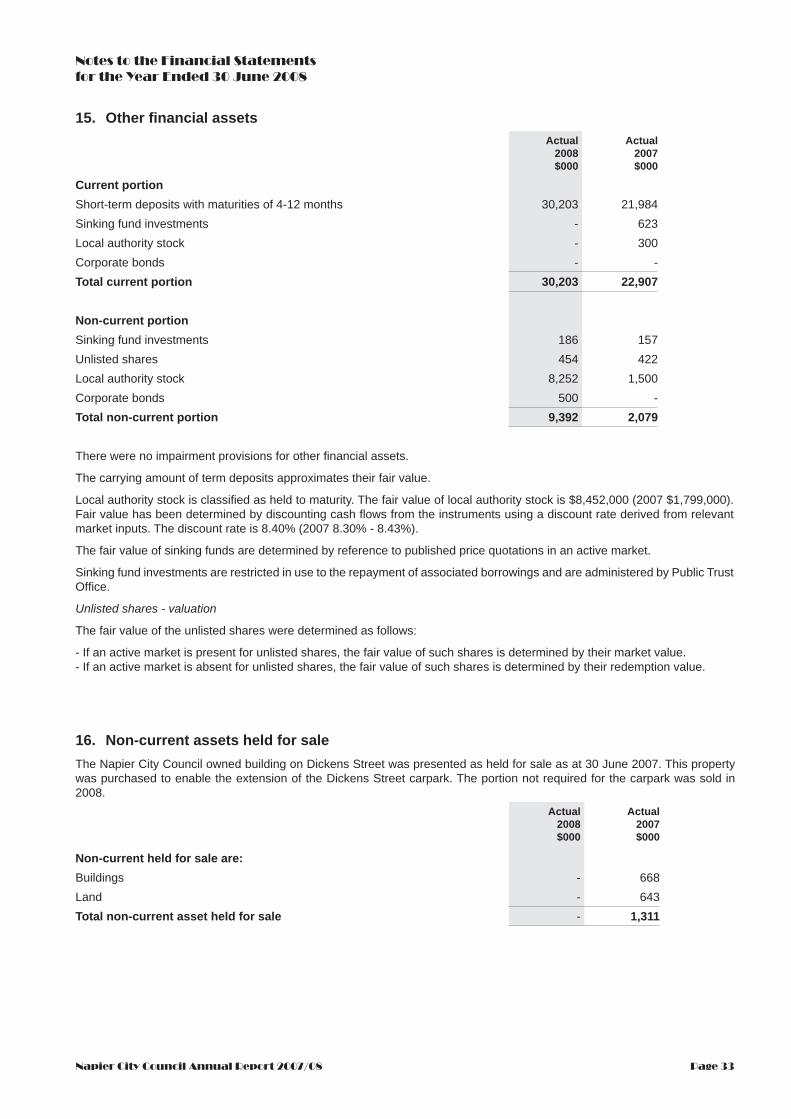
Page 33Napier City Council Annual Report 2007/08
Notes to the Financial Statements for the Year Ended 30 June 2008
15. Other fi nancial assetsActual
2008$000
Actual2007$000
Current portionShort-term deposits with maturities of 4-12 months 30,203 21,984Sinking fund investments - 623Local authority stock - 300Corporate bonds - - Total current portion 30,203 22,907
Non-current portionSinking fund investments 186 157Unlisted shares 454 422Local authority stock 8,252 1,500Corporate bonds 500 - Total non-current portion 9,392 2,079
There were no impairment provisions for other fi nancial assets.
The carrying amount of term deposits approximates their fair value.
Local authority stock is classifi ed as held to maturity. The fair value of local authority stock is $8,452,000 (2007 $1,799,000). Fair value has been determined by discounting cash fl ows from the instruments using a discount rate derived from relevant market inputs. The discount rate is 8.40% (2007 8.30% - 8.43%).
The fair value of sinking funds are determined by reference to published price quotations in an active market.
Sinking fund investments are restricted in use to the repayment of associated borrowings and are administered by Public Trust Offi ce.
Unlisted shares - valuation
The fair value of the unlisted shares were determined as follows:
- If an active market is present for unlisted shares, the fair value of such shares is determined by their market value.- If an active market is absent for unlisted shares, the fair value of such shares is determined by their redemption value.
16. Non-current assets held for saleThe Napier City Council owned building on Dickens Street was presented as held for sale as at 30 June 2007. This property was purchased to enable the extension of the Dickens Street carpark. The portion not required for the carpark was sold in 2008.
Actual2008$000
Actual2007$000
Non-current held for sale are:Buildings - 668Land - 643Total non-current asset held for sale - 1,311

Page 34 Napier City Council Annual Report 2007/08
Notes to the Financial Statements for the Year Ended 30 June 2008
17. Property plant and equipment
2008
Cos
t/re
valu
atio
n
1 Ju
ly 2
007
$000
Acc
umul
ated
de
pn a
nd
impa
irmen
t ch
arge
s1
July
200
7$0
00
Car
ryin
g a
mou
nt
1 Ju
ly 2
007
$000
Cur
rent
yea
r ad
ditio
ns
$000
Cur
rent
yea
r di
spos
als
cost
$000
Cur
rent
yea
r ac
cum
ulat
ed
depn
and
ad
just
men
ts
$000
Cur
rent
yea
r im
pairm
ent
char
ges
$000
Cur
rent
yea
r de
prec
iatio
n
$000
Rev
alua
tion
surp
lus
$000
Cos
t/re
valu
atio
n
30 Ju
ne 20
08$0
00
Acc
umul
ated
de
pn a
nd
impa
irmen
t ch
arge
s30
June
2008
$000
Car
ryin
g a
mou
nt
30 Ju
ne 20
08$0
00
Cou
ncil
oper
atio
n as
sets
Land
65,
340
- 6
5,34
0 2
,227
(3
0) -
--
19,
398
86,
935
- 8
6,93
5
Leas
ehol
d La
nd 1
9,57
6 -
19,
576
- (8
31)
- -
- 2
,018
2
0,76
3 -
20,
763
Bui
ldin
gs 4
3,49
8 (2
,063
) 4
1,43
5 3
49
(9)
3,0
57
- (1
,021
) 3
,747
4
7,58
5 (2
7) 4
7,55
8
Libr
ary
Boo
ks 2
,274
-
2,2
74
507
-
- -
(615
) 1
73
2,3
39
- 2
,339
Pla
nt a
nd e
quip
men
t 1
9,86
8 (1
1,91
4) 7
,954
3
,047
(6
28)
493
-
(1,5
25)
- 2
2,28
7 (1
2,94
6) 9
,341
Mot
or v
ehic
les
3,1
43
(1,7
15)
1,4
28
363
(1
49)
104
-
(363
)-
3,3
57
(1,9
74)
1,3
83
Land
fi ll p
ost c
losu
re 2
25
(225
) -
--
- -
--
225
(2
25)
-
Wor
k in
pro
gres
s 1
87
- 1
87
114
- -
--
- 3
01
- 3
01
Tota
l ope
ratio
nal a
sset
s 1
54,1
11
(15,
917)
138
,194
6
,607
(1
,647
) 3
,654
-
(3,5
24)
25,
336
183
,792
(1
5,17
2) 1
68,6
20
Cou
ncil
infr
astr
uctu
ral a
sset
sS
ewer
age
syst
em 8
6,89
5 (4
,370
) 8
2,52
5 2
,514
(8
52)
7,33
8 -
(3,0
64)
16,
271
104
,828
(9
6) 1
04,7
32
Wat
er s
yste
m 4
9,32
4 (1
,759
) 4
7,56
5 1
,569
(9
1) 2
,813
-
(1,0
64)
9,7
14
60,
516
(10)
60,
506
Dra
inag
e ne
twor
k 6
2,37
7 (2
,311
) 6
0,06
6 1
,947
(2
66)
3,2
54
- (1
,062
) 1
3,26
2 7
7,32
0 (1
19)
77,
201
Roa
ding
net
wor
k 1
26,7
21
(9,0
53)
117
,668
7
,670
-
14,
420
- (5
,367
) 3
,809
1
38,2
00
- 1
38,2
00
Land
und
er ro
ads
419
,097
-
419
,097
2
8 -
- -
- -
419
,125
-
419
,125
Wor
k in
pro
gres
s 1
5,14
9 -
15,
149
1,2
91
- -
--
- 1
6,44
0 -
16,
440
Tota
l inf
rast
ruct
ural
ass
ets
759
,563
(1
7,49
3) 7
42,0
70
15,
019
(1,2
09)
27,
825
- (1
0,55
7) 4
3,05
6 8
16,4
29
(225
) 8
16,2
04
Cou
ncil
rest
ricte
d as
sets
Spo
rtsgr
ound
s 1
17,7
11
(1,3
42)
116
,369
4
36
- 1
,966
-
(744
) 1
4,49
0 1
32,6
37
(120
) 1
32,5
17
Gra
ndst
ands
and
hal
ls 7
,686
(2
28)
7,4
58
- -
342
-
(114
) 1
,161
8
,847
-
8,8
47
Bui
ldin
gs o
n re
serv
es 2
5,88
1 (1
,432
) 2
4,44
9 1
73
- 2
,145
-
(718
) 4
,251
3
0,30
5 (4
) 3
0,30
1
Sw
imm
ing
pool
s 1
0,20
0 (6
14)
9,5
86
6
- 9
21
- (3
07)
304
1
0,51
0 -
10,
510
Inne
r har
bour
8,2
48
(153
) 8
,095
-
- 2
35
- (8
2) 5
,214
1
3,46
2 -
13,
462
Tota
l res
trict
ed a
sset
s 1
69,7
26
(3,7
69)
165
,957
6
15
- 5
,609
-
(1,9
65)
25,
420
195
,761
(1
24)
195
,637
Tota
l gro
up p
rope
rty p
lant
an
d eq
uipm
ent
1,0
83,4
00
(37,
179)
1,0
46,2
21
22,
241
(2,8
56)
37,
088
- (1
6,04
6) 9
3,81
2 1
,195
,982
(1
5,52
1) 1
,180
,461
Item
s ad
ded
to w
ork
in p
rogr
ess
$4,9
93,0
00 (2
007
$6,7
92,0
00).
Com
plet
ed a
sset
s tra
nsfe
rred
from
wor
k in
pro
gres
s $3
,588
,000
(200
7 $3
,781
,000
). Th
e ne
t car
ryin
g am
ount
of p
lant
and
equ
ipm
ent h
eld
unde
r fi n
ance
leas
es is
$12
8,00
0 (2
007
$292
,000
)In
acc
orda
nce
with
Acc
ount
ing
Pol
icie
s th
e re
valu
atio
n su
rplu
s fo
r Lib
rary
Boo
ks h
as b
een
take
n to
pro
fi t a
nd lo
ss a
s an
offs
et o
f los
ses
prev
ious
ly e
xpen
sed

Page 35Napier City Council Annual Report 2007/08
Notes to the Financial Statements for the Year Ended 30 June 2008
2007
Cos
t/re
valu
atio
n
1 Ju
ly 2
006
$000
Acc
umul
ated
de
pn a
nd
impa
irmen
t ch
arge
s1
July
200
6$0
00
Car
ryin
g a
mou
nt
1 Ju
ly 2
006
$000
Cur
rent
yea
r ad
ditio
ns
$000
Cur
rent
yea
r di
spos
als
cost
$000
Cur
rent
yea
r ac
cum
ulat
ed
depn
and
ad
just
men
ts
$000
Cur
rent
yea
r im
pairm
ent
char
ges
$000
Cur
rent
yea
r de
prec
iatio
n
$000
Rev
alua
tion
surp
lus
$000
Cos
t/re
valu
atio
n
30 Ju
ne 20
07$0
00
Acc
umul
ated
de
pn a
nd
impa
irmen
t ch
arge
s30
June
2007
$000
Car
ryin
g a
mou
nt
30 Ju
ne 20
07$0
00
Cou
ncil
oper
atio
n as
sets
Land
64,
195
- 6
4,19
5 1
,692
(5
47)
- -
- -
65,
340
- 6
5,34
0
Leas
ehol
d La
nd 2
1,05
1 -
21,
051
- (1
,475
) -
- -
- 1
9,57
6 -
19,
576
Bui
ldin
gs 4
2,79
1 (1
,026
) 4
1,76
5 7
97
(90)
2
- (1
,039
) -
43,
498
(2,0
63)
41,
435
Libr
ary
Boo
ks 2
,218
-
2,2
18
445
-
- -
(449
) 6
0 2
,274
-
2,2
74
Pla
nt a
nd e
quip
men
t 1
8,09
3 (1
1,02
3) 7
,070
2
,437
(6
62)
466
-
(1,3
57)
- 1
9,86
8 (1
1,91
4) 7
,954
Mot
or v
ehic
les
2,9
96
(1,5
27)
1,4
69
338
(1
91)
158
-
(346
) -
3,1
43
(1,7
15)
1,4
28
Land
fi ll p
ost c
losu
re 2
25
(225
) -
- -
- -
- -
225
(2
25)
-
Wor
k in
pro
gres
s 2
38
- 2
38
(51)
- -
- -
- 1
87
- 1
87
Tota
l ope
ratio
nal a
sset
s 1
51,8
07
(13,
801)
138
,006
5
,658
(2
,965
) 6
26
- (3
,191
) 6
0 1
54,1
11
(15,
917)
138
,194
Cou
ncil
infr
astr
uctu
ral a
sset
sS
ewer
age
syst
em 8
6,05
1 (2
,128
) 8
3,92
3 1
,187
(3
43)
175
-
(2,4
17)
- 8
6,89
5 (4
,370
) 8
2,52
5
Wat
er s
yste
m 4
8,44
0 (8
51)
47,
589
1,0
95
(211
) 1
37
- (1
,045
) -
49,
324
(1,7
59)
47,
565
Dra
inag
e ne
twor
k 6
0,87
2 (1
,123
) 5
9,74
9 1
,669
(1
64)
69
- (1
,257
) -
62,
377
(2,3
11)
60,
066
Roa
ding
net
wor
k 1
19,4
43
(4,2
09)
115
,234
7
,278
-
- -
(4,8
44)
- 1
26,7
21
(9,0
53)
117
,668
Land
und
er ro
ads
418
,901
-
418
,901
1
96
- -
- -
- 4
19,0
97
- 4
19,0
97
Wor
k in
pro
gres
s 9
,355
-
9,3
55
5,7
94
- -
- -
- 1
5,14
9 -
15,
149
Tota
l inf
rast
ruct
ural
ass
ets
743
,062
(8
,311
) 7
34,7
51
17,
219
(718
) 3
81
- (9
,563
) -
759
,563
(1
7,49
3) 7
42,0
70
Cou
ncil
rest
ricte
d as
sets
Spo
rtsgr
ound
s 1
16,3
91
(662
) 1
15,7
29
1,3
20
- -
- (6
80)
- 1
17,7
11
(1,3
42)
116
,369
Gra
ndst
ands
and
hal
ls 7
,686
(1
14)
7,5
72
- -
- -
(114
) -
7,6
86
(228
) 7
,458
Bui
ldin
gs o
n re
serv
es 2
5,82
0 (7
16)
25,
104
61
- -
- (7
16)
- 2
5,88
1 (1
,432
) 2
4,44
9
Sw
imm
ing
pool
s 1
0,20
0 (3
07)
9,8
93
- -
- -
(307
) -
10,
200
(614
) 9
,586
Inne
r har
bour
8,2
48
(71)
8,1
77
- -
- -
(82)
- 8
,248
(1
53)
8,0
95
Tota
l res
trict
ed a
sset
s 1
68,3
45
(1,8
70)
166
,475
1
,381
-
- -
(1,8
99)
- 1
69,7
26
(3,7
69)
165
,957
Tota
l gro
up p
rope
rty p
lant
an
d eq
uipm
ent
1,0
63,2
14
(23,
982)
1,0
39,2
32
24,
258
(3,6
83)
1,0
07
- (1
4,65
3) 6
0 1
,083
,400
(3
7,17
9) 1
,046
,221
Item
s ad
ded
to w
ork
in p
rogr
ess
$6,7
92,0
00 (
2006
$8,
753,
000
)C
ompl
eted
ass
ets
trans
ferr
ed fr
om w
ork
in p
rogr
ess
$3,7
81,0
00 (2
006
$8,7
21,0
00)
The
net c
arry
ing
amou
nt o
f pla
nt a
nd e
quip
men
t hel
d un
der fi
nan
ce le
ases
is $
292,
000
(200
6 $5
87,0
00)
In a
ccor
danc
e w
ith A
ccou
ntin
g P
olic
ies
the
reva
luat
ion
surp
lus
for L
ibra
ry B
ooks
has
bee
n ta
ken
to p
rofi t
and
loss
as
an o
ffset
of l
osse
s pr
evio
usly
exp
ense
d

Page 36 Napier City Council Annual Report 2007/08
Notes to the Financial Statements for the Year Ended 30 June 2008
18. Intangible assets
2008
Cos
t/re
valu
atio
n
Acc
umul
ated
de
prec
iatio
n an
d im
pairm
ent
char
ges
Car
ryin
g am
ount
Cur
rent
yea
r ad
ditio
nsC
urre
nt y
ear
disp
osal
s
Cur
rent
yea
r im
pairm
ent
char
ges
Cur
rent
yea
r am
mor
tisat
ion
Rev
alua
tion
Surp
lus
Cos
t/re
valu
atio
n
Acc
umul
ated
de
prec
iatio
n an
d im
pairm
ent
char
ges
Car
ryin
g a
mou
nt
1 J
uly
2007
1 J
uly
2007
1 J
uly
2007
30 J
une
2008
30 J
une
2008
30 J
une
2008
$000
$000
$000
$000
$000
$000
$000
$000
$000
$000
$000
Com
pute
r so
ftwar
e1,
891
(1,7
32)
159
98-
- (8
5)-
1,98
9(1
,817
)17
2
2007
Cos
t/re
valu
atio
n
Acc
umul
ated
de
prec
iatio
n an
d im
pairm
ent
char
ges
Car
ryin
g a
mou
ntC
urre
nt y
ear
addi
tions
Cur
rent
yea
r di
spos
als
Cur
rent
yea
r im
pairm
ent
char
ges
Cur
rent
yea
r am
mor
tisat
ion
Rev
alua
tion
Surp
lus
Cos
t/re
valu
atio
n
Acc
umul
ated
de
prec
iatio
n an
d im
pairm
ent
char
ges
Car
ryin
g a
mou
nt
1 J
uly
2006
1 J
uly
2006
1 J
uly
2006
30 J
une
2007
30 J
une
2007
30 J
une
2007
$000
$000
$000
$000
$000
$000
$000
$000
$000
$000
$000
Com
pute
r so
ftwar
e1,
826
(1,6
51)
175
76(1
1) -
(81)
- 1,
891
(1,7
32)
159

Page 37Napier City Council Annual Report 2007/08
19. Investment Property
Notes to the Financial Statements for the Year Ended 30 June 2008
Actual2008$000
Actual2007$000
Balance 1 July 44,426 42,092Additions from acqusitions - - Disposals - - Fair value gains/(losses) on valuation 502 2,334Balance 30 June 44,928 44,426
Napier City Council’s investment properties are valued annually at fair value effective 30 June. All investment properties were valued based on open market evidence. The valuation was performed by M. Penrose ANZIV, SNZPI, AAMINZ an independent valuer from Telfer Young (HB) Ltd. Telfer Young are experienced valuers with extensive market knowledge of the types of investment properties owned by Napier City Council.
Actual2008$000
Actual2007$000
Rental income from investment property 1,008 345Expenses from investment property generating income - - Contractual obligations for capital expenditure - - Contractual obligations for operating expenditure - -

Page 38 Napier City Council Annual Report 2007/08
Notes to the Financial Statements for the Year Ended 30 June 2008
20. Investments in associates
21. Creditors and other payables
Napier City Council has a 26.12% interest in Hawkes Bay Airport Authority and its reporting date is 30 June.
Hawke’s Bay Airport Authority is an unlisted entity and, accordingly, there are no published price quotations to determine the fair value of this investment.
Actual2008$000
Actual2007$000
Movements in the carrying amount of investments in associatesBalance at 1 July 3,565 3,407New investments during year - - Adjustment due to adoption of IFRS by Hawke’s Bay Airport Authority 39 - Disposal of investments during the year - - Share of total recognised revenues and expenses 192 181Interest adjustment on appropriation account (25) (23)Share of dividend - - Balance at 30 June 3,771 3,565
Summarised fi nancial information of associate entitiesActual
2008$000
Actual2007$000
Assets 18,415 15,838Liabilities 2,229 543Revenues 2,444 2,312Surplus/(defi cit) 736 694Group’s interest 26.12% 26.12%
Associated contingenciesThere are no contingent liabilities arising from the Council’s involvement in the associate.
Actual2008$000
Actual2007$000
Trade payables 7,879 6,203Deposits and bonds 911 851Accrued interest 194 248Rates in advance 780 867Total creditors and other payables 9,764 8,169

Page 39Napier City Council Annual Report 2007/08
Notes to the Financial Statements for the Year Ended 30 June 2008
22. Employee benefi t liabilities
23. Borrowings
Actual2008$000
Actual2007$000
Current portionAccrued pay 582 438Annual leave 2,038 1,831Sick leave - - Retirement and long service leave - - Total current portion 2,620 2,269
Non-current portionRetirement and long service leave 1,807 1,658Total non-current portion 1,807 1,658
Total employee entitlement 4,427 3,927
Actual2008$000
Actual2007$000
Current portionSecured loans 4,508 7,008Lease liabilities 51 179Total current portion 4,559 7,187
Non-current portionSecured loans 7,054 11,562Lease liabilities 14 65Total non-current portion 7,068 11,627
Fixed-rate debt
The Council’s secured debt of $11,562,300 (2007: $18,570,250) is issued at fi xed rates of interest.
The Council has established sinking funds in respect of loans, with a carrying amount of $186,460, maturing in 2009/10. The sinking fund investments, together with accumulated interest, will be suffi cient to repay the principal of the associated loans on the due date. The amount held in the sinking funds is shown in note 15 Other Financial Assets.
The Council’s loans are secured by a Secured Trust Deed creating a charge over the special rate deemed to be made by the Council upon the value of all rateable property within the City of Napier.
Lease liabilities are effectively secured as the rights to the leased asset revert to the lessor in the event of default.
Refi nancingThe Council manages its borrowings in accordance with its funding and fi nancial policies, which include a Liability Management policy. These policies have been adopted as part of the Council’s Long Term Council Community Plan.

Page 40 Napier City Council Annual Report 2007/08
Notes to the Financial Statements for the Year Ended 30 June 2008
Maturity analysis and effective interest ratesThe following is a maturity analysis of the Council’s borrowings (excluding fi nance leases, which are shown separately below). Depending on the conditions attached to the secured loans, there may be early repayment options.
Secured Loans
Actual2008$000
Actual2007$000
Less than one year 4,508 7,008Weighted average effective interest rate 6.56% 6.96%Later than one year but not more than fi ve years 5,034 7,534Weighted average effective interest rate 6.98% 6.77%Later than fi ve years 2,020 4,028Weighted average effective interest rate 7.62% 7.23%
11,562 18,570
Analysis of fi nance lease liabilities Actual
2008$000
Actual2007$000
Total minimum lease payments are payableNot later than one year 52 185Later than one year and not later than fi ve years 14 66Total minimum lease payments 66 251Future fi nance charges (1) (7)Present value of minimum lease payments 65 244
Present value of minimum lease payments are payableNot later than one year 51 179Later than one year and not later than fi ve years 14 65Total 65 244
Current 51 179Non-current 14 65Total 65 244
Description of material leasing arrangements
The Council has entered into fi nance leases for various items of offi ce equipment.
The fi nance leases can be renewed at the Council’s option, with rents set by reference to current market rates for items of equivalent age and condition. The Council has the option to purchase the asset at the end of the lease.
There are no restrictions placed on the Council by any of the fi nance leasing arrangements.

Page 41Napier City Council Annual Report 2007/08
Notes to the Financial Statements for the Year Ended 30 June 2008
24. ProvisionsOpening balance
2008$000
Additional provision
$000
Unused amounts reversed during
the year$000
Closing balance
2008$000
Financial guarantees 645 - (50) 595Landfi ll aftercare provision 269 684 - 953Total provisions 914 684 (50) 1,548
Provision for fi nancial guarantees
The Council is listed as sole guarantor to a number of related authorities and locally incorporated societies for bank facilities.
The Council is obligated under the guarantees to make payments in the event the authority or society defaults on a fi nancial arrangement. The exercising of guarantees will be dependent on the fi nancial stability of the authorities and societies, which will vary over time.
Provision for landfi ll aftercare
The joint Landfi ll Committee gained a resource consent in 1985 to operate the Omarunui Landfi ll. Napier City Council, as 36.32% owner of the Omaranui Landfi ll, has a joint legal obligation under the resource consent to provide ongoing maintenance and monitoring sevices at the landfi ll site post closure.
The management of the landfi ll will infl uence the timing of recognition of some liabilities - for example, the current landfi ll will operate in four stages. A liability relating to stages two, three and four will only be created when the stage is commissioned and when refuse begins to accumulate in this stage.
- The remaining capacity of the site is 4 million cubic metres (refuse, cleanfi ll and cover).
- The estimated remaining life is 40 years.
- Estimates of the life have been made by Hastings District Council’s engineers based on historical volume information.
The cash outfl ows for landfi ll post-closure are expected to occur in two to sixty-nine years time (or between 2008 and 2077). The long term nature of the liability means that there are inherent uncertainties in estimating costs that will be incurred. The provision has been estimated taking into account existing technology and using a discount rate of 7%.
The following major assumptions have been made in the calculation of the provision:
- Aftercare will be required for 30 years after the closure of each stage.
- The annual cost of aftercare for stage one (Valley A) is assessed at $37,500.
- Only Napier City Council’s 36.62% share of the provision is included.
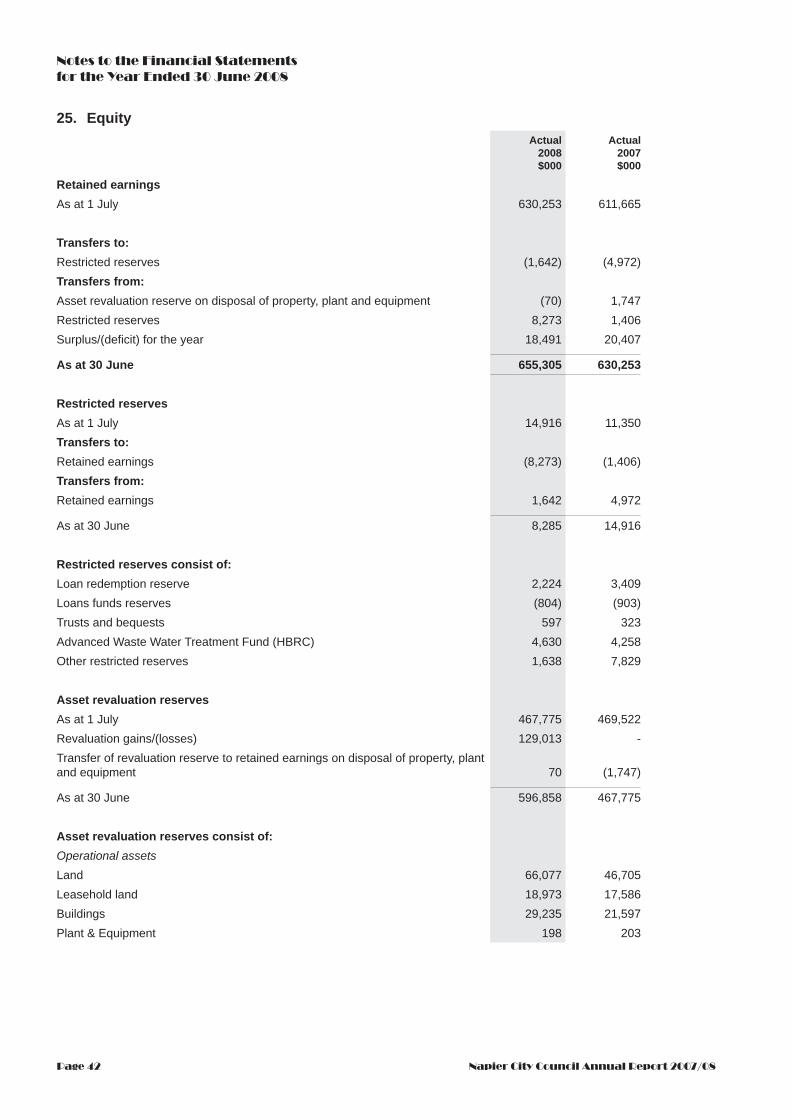
Page 42 Napier City Council Annual Report 2007/08
Notes to the Financial Statements for the Year Ended 30 June 2008
25. EquityActual
2008$000
Actual2007$000
Retained earningsAs at 1 July 630,253 611,665
Transfers to:Restricted reserves (1,642) (4,972)Transfers from:Asset revaluation reserve on disposal of property, plant and equipment (70) 1,747Restricted reserves 8,273 1,406Surplus/(defi cit) for the year 18,491 20,407
As at 30 June 655,305 630,253
Restricted reservesAs at 1 July 14,916 11,350Transfers to:Retained earnings (8,273) (1,406)Transfers from:Retained earnings 1,642 4,972
As at 30 June 8,285 14,916
Restricted reserves consist of:Loan redemption reserve 2,224 3,409Loans funds reserves (804) (903)Trusts and bequests 597 323Advanced Waste Water Treatment Fund (HBRC) 4,630 4,258Other restricted reserves 1,638 7,829
Asset revaluation reservesAs at 1 July 467,775 469,522Revaluation gains/(losses) 129,013 - Transfer of revaluation reserve to retained earnings on disposal of property, plant and equipment 70 (1,747)
As at 30 June 596,858 467,775
Asset revaluation reserves consist of:Operational assetsLand 66,077 46,705Leasehold land 18,973 17,586Buildings 29,235 21,597Plant & Equipment 198 203

Page 43Napier City Council Annual Report 2007/08
Notes to the Financial Statements for the Year Ended 30 June 2008
26. Capital ManagementThe Council’s capital is its equity (or Ratepayers’ Funds), which comprise retained earnings and reserves. Equity is represented by net assets.
The Local Government Act 2002 (the Act) requires Council to manage its revenues, expenses, assets, liabilities, investments, and general fi nancial dealings prudently and in a manner that promotes the current and future interests of the community. Ratepayers’ Funds are managed largely as a by-product of managing revenues, expenses, assets, liabilities, investments, and general fi nancial dealings.
The objective of managing these items is to achieve intergenerational equity, which is a principle promoted in the Act and applied by the Council. Intergenerational equity requires today’s ratepayers to meet the costs of utilising the Council’s assets but does not expect them to meet the full cost of long-term assets that will benefi t ratepayers in future generations.
Additionally, the Council has Asset Management Plans in place for major classes of assets, detailing renewal and maintenance programmes to ensure that future generations of ratepayers are not required to meet the costs of deferred renewals and maintenance.
The Act requires the Council to make adequate and effective provision in its Long Term Council Community Plan (LTCCP) and in its Annual Plan (where applicable)
to meet the expenditure needs identifi ed in those plans. The Act sets out the factors that the Council is required to consider when determining the most appropriate sources of funding for each of its activities. The sources and levels of funding are set out in the funding and fi nancial policies in the Council’s LTCCP.
Napier City Council has the following Council created reserves: • reserves for different areas of benefi t; • self-insurance reserves; and • trust and bequest reserves.
Reserves for different areas of benefi t are used where there is a discrete set of rate or levy payers as distinct from the general rate. Any surpluses or defi cits relating to these separate areas of benefi t are applied to the specifi c reserves.
Self-insurance reserves are built up annually from general rates and are made available for specifi c unforeseen events. The release of these funds can generally be approved only by Council.
Trust and bequest reserves are set up where the Council is donated funds that are restricted for particular purposes. Interest is added to trust and bequest reserves where applicable, and deductions are made where funds have been used for the purposes for which they were donated.
Actual2008$000
Actual2007$000
Infrastructural AssetsSewerage system 90,994 68,254Water system 43,357 30,928Drainage network 54,355 38,094Roading network 170,059 151,830Restricted ReservesSportsgrounds 98,980 82,522Grandstands and halls 2,607 1,103Buildings on reserves 8,092 1,696Swimming pools 3,637 2,412Inner harbour 10,294 4,845
Fair value through equity reserveAs at 1 July 69 31Valuation gains/(losses) on unlisted shares taken to equity 32 38
As at 30 June 101 69
Total other reserves 605,244 482,760
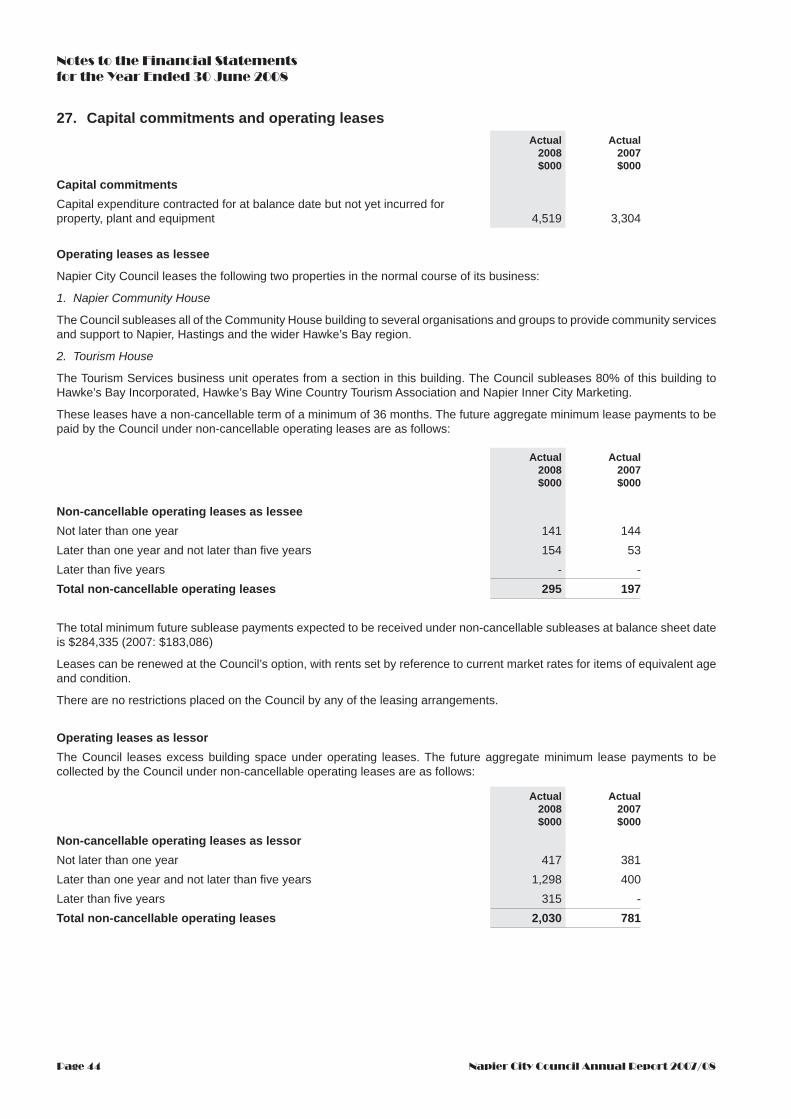
Page 44 Napier City Council Annual Report 2007/08
Notes to the Financial Statements for the Year Ended 30 June 2008
27. Capital commitments and operating leasesActual
2008$000
Actual2007$000
Capital commitmentsCapital expenditure contracted for at balance date but not yet incurred for property, plant and equipment 4,519 3,304
Operating leases as lessee
Napier City Council leases the following two properties in the normal course of its business:
1. Napier Community House
The Council subleases all of the Community House building to several organisations and groups to provide community services and support to Napier, Hastings and the wider Hawke’s Bay region.
2. Tourism House
The Tourism Services business unit operates from a section in this building. The Council subleases 80% of this building to Hawke’s Bay Incorporated, Hawke’s Bay Wine Country Tourism Association and Napier Inner City Marketing.
These leases have a non-cancellable term of a minimum of 36 months. The future aggregate minimum lease payments to be paid by the Council under non-cancellable operating leases are as follows:
Actual2008$000
Actual2007$000
Non-cancellable operating leases as lesseeNot later than one year 141 144Later than one year and not later than fi ve years 154 53Later than fi ve years - - Total non-cancellable operating leases 295 197
The total minimum future sublease payments expected to be received under non-cancellable subleases at balance sheet date is $284,335 (2007: $183,086)
Leases can be renewed at the Council’s option, with rents set by reference to current market rates for items of equivalent age and condition.
There are no restrictions placed on the Council by any of the leasing arrangements.
Operating leases as lessorThe Council leases excess building space under operating leases. The future aggregate minimum lease payments to be collected by the Council under non-cancellable operating leases are as follows:
Actual2008$000
Actual2007$000
Non-cancellable operating leases as lessorNot later than one year 417 381Later than one year and not later than fi ve years 1,298 400Later than fi ve years 315 - Total non-cancellable operating leases 2,030 781

Page 45Napier City Council Annual Report 2007/08
Notes to the Financial Statements for the Year Ended 30 June 2008
28. Contingencies
29. Reconciliation of net surplus after tax to net cash fl ow from operating activities
Contingent liabilities Actual2008$000
Actual2007$000
Financial guarantees 285 852Total contingent liabilities 285 852
Financial guarantees
The value of guarantees disclosed as contingent liabilities refl ects the Council’s assessment of the undiscounted portion of fi nancial guarantees that are not recognised in the statement of fi nancial position. Refer to note 24 Provisions for information on recognised fi nancial guarantees.
Unquantifi ed claims
In 2007/08, there are four claims against Council which have been notifi ed to Council’s Insurers. Because of the uncertainty associated with the claims, an estimate of the fi nancial effect cannot be made. These matters were not recognised in the fi nancial statements because of the uncertainty associated with the outcomes.
Other contingencies
At 30 June 2008, Napier City Council held 7 (2007: 27) conditional contracts for sale of residential development sections. The contracted revenue of $1,390,000 (GST exclusive) from these sales has not been included in the 30 June 2008 fi nancial statements and deposits received (2008: $66,000, 2007: $869,600) in conjunction with these contracts are held in trade and other payables until these contracts become unconditional. The contract terms require consent under S222 of the Resource Management Act (completion of infrastructure works) to become unconditional contracts for sale. In the event consent is not obtained deposits held are refundable.Napier City Council is a participating employer in a Defi ned Benefi t Plan Contributors Scheme (“the scheme”) which is a multi-employer defi ned benefi t scheme. If the other participating employers ceased to participate in the scheme, Napier City Council could be responsible for the entire defi cit of the scheme. Simarily, if a number of employees ceased to participate in the scheme, Napier City Council could be responsible for an increased share of the defi cit.
Actual2008$000
Actual2007$000
Surplus/(defi cit) after tax 18,491 20,407
Add/(less) non-cash items:Share of associate surplus/(defi cit) (167) (158)Depreciation and amortisation expense 16,131 14,734Vested assets (2,082) (2,085)(Gains)/losses in fair value of investment property (501) (2,334)Gains on library bookstock (173) (60)Other non-cash Items (11) (65)
Add/(less) items classifi ed as investing or fi nancing activities:(Gains)/losses on disposal of property plant and equipment (191) (5)
Add/(less) movements in working capital items:Accounts receivable (3,040) 3,154Inventories 2,344 1,284Biological assets 40 12Accounts payable 877 883Provisions 634 (40)Employee benefi ts 500 66Net cash infl ow/(outfl ow) from operating activities 32,852 35,793
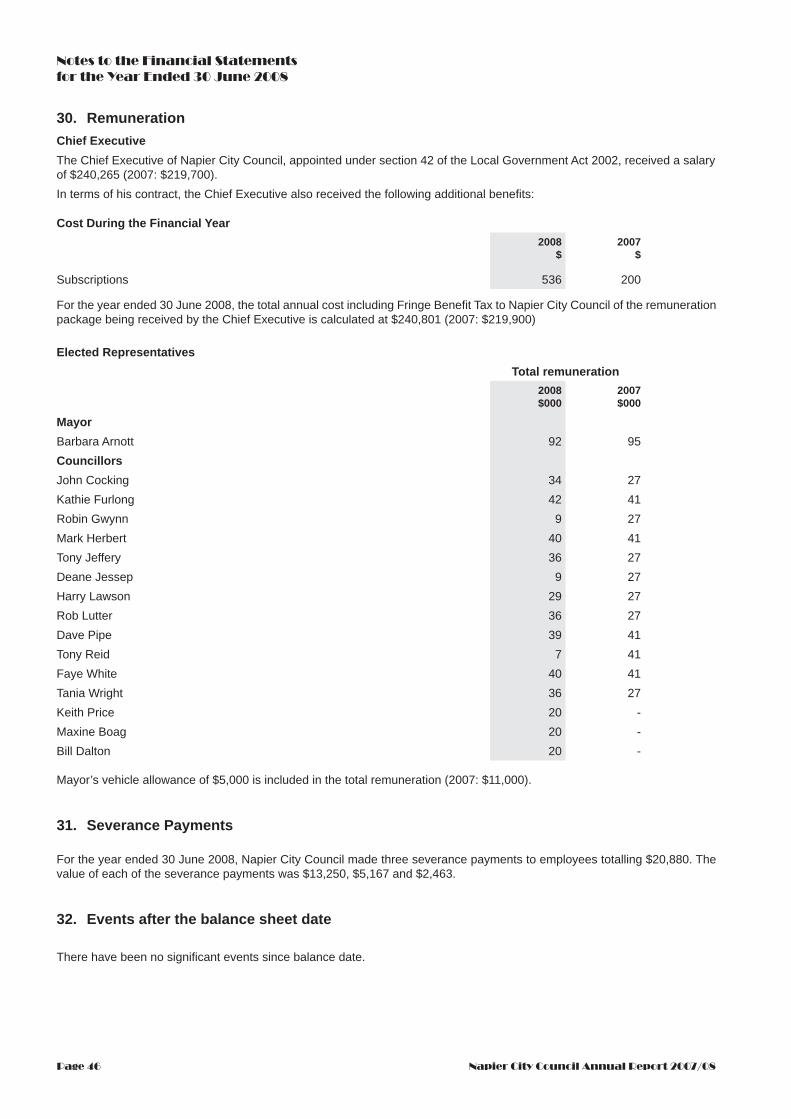
Page 46 Napier City Council Annual Report 2007/08
Notes to the Financial Statements for the Year Ended 30 June 2008
30. RemunerationChief ExecutiveThe Chief Executive of Napier City Council, appointed under section 42 of the Local Government Act 2002, received a salary of $240,265 (2007: $219,700).In terms of his contract, the Chief Executive also received the following additional benefi ts:
Cost During the Financial Year2008
$2007
$
Subscriptions 536 200
For the year ended 30 June 2008, the total annual cost including Fringe Benefi t Tax to Napier City Council of the remuneration package being received by the Chief Executive is calculated at $240,801 (2007: $219,900)
Elected RepresentativesTotal remuneration
2008$000
2007$000
MayorBarbara Arnott 92 95CouncillorsJohn Cocking 34 27Kathie Furlong 42 41Robin Gwynn 9 27Mark Herbert 40 41Tony Jeffery 36 27Deane Jessep 9 27Harry Lawson 29 27Rob Lutter 36 27Dave Pipe 39 41Tony Reid 7 41Faye White 40 41Tania Wright 36 27Keith Price 20 - Maxine Boag 20 - Bill Dalton 20 -
Mayor’s vehicle allowance of $5,000 is included in the total remuneration (2007: $11,000).
31. Severance Payments
For the year ended 30 June 2008, Napier City Council made three severance payments to employees totalling $20,880. The value of each of the severance payments was $13,250, $5,167 and $2,463.
32. Events after the balance sheet date
There have been no signifi cant events since balance date.

Page 47Napier City Council Annual Report 2007/08
Notes to the Financial Statements for the Year Ended 30 June 2008
33. Financial Instrument Risks
Financial Instrument Categories
Actual2008
($000)
Actual 2007
($000)
Financial AssetsLoans and receivablesCash and Cash Equivalents (see Note 1 below) 3,468 9,305Debtors and Other Receivables 9,921 6,881Other Financial AssetsTerm Deposits 30,203 21,984Total Loans & Receivables 43,592 38,170
Held to maturityOther Financial AssetsLocal Authority Stock (see Note 2. below) 8,252 1,800Sinking Fund Investments 186 780Corporate Bonds 500 - Total Held to Maturity 8,938 2,580
Fair Value Through EquityUnlisted Shares 454 422 Total Fair Value Through Equity 454 422
Financial LiabilitiesFinancial Liabilities at Amortised CostCreditors and Other Payables 9,764 8,169Secured Loans 11,562 18,570Finance Leases 65 244
21,391 26,983
Financial Instrument RisksNapier City Council has a series of policies to manage the risks associated with fi nancial instruments. Napier City Council is risk-averse and therefore seeks to minimise risk exposure from its treasury activities through adherence to its approved Investment Management Policy and Liability Management Policy. These policies do not allow transactions of a speculative nature.
Market RiskPrice riskPrice risk is the risk that the fair value or future cash fl ows of a fi nancial instrument will fl uctuate as a result of changes in market prices. Napier City Council is exposed to equity securities price risk on its investments, which are classifi ed as fi nancial assets held at fair value through equity. This price risk arises due to market movements in listed securities. This price risk is managed by diversifi cation of Napier City Council’s investment portfolio in accordance with the limits set out in Napier City Council’s Investment Management Policy.
Currency riskCurrency risk is the risk that the fair value or future cash fl ows of a fi nancial instrument will fl uctuate due to changes in foreign exchange rates. Napier City Council purchases plant and equipment associated with the construction of certain infrastructural assets as well as library book assets, from overseas. These transactions require Napier City to enter into transactions denominated in foreign currencies. As a result of these activities, exposure to currency risk arises.It is Napier City Council’s policy to manage foreign currency risks arising from contractual commitments and liabilities that are signifi cant values by entering into forward foreign exchange contracts to hedge the foreign currency risk exposure. This means Napier City Council is able to fi x the New Zealand dollar amount payable prior to delivery of the plant and equipment from overseas. (2008: nil, 2007: $885,000)
Fair value interest rate riskFair value interest rate risk is the risk that the value of a fi nancial instrument will fl uctuate due to changes in market interest rates. Borrowings and investments issued at fi xed rates of interest expose the Napier City Council to fair value interest rate risk.

Page 48 Napier City Council Annual Report 2007/08
Notes to the Financial Statements for the Year Ended 30 June 2008
Napier City Council’s Liability Management policy is to stay within a minimum and maximum percentage of its borrowings in fi xed-rate instruments. Fixed to fl oating interest rate swaps can be entered into to hedge the fair value interest rate risk arising where Napier City Council’s fi xed rates borrowings are in excess of the target range.
Cash fl ow interest rate riskCash fl ow interest rate risk is the risk that the cash fl ows from a fi nancial instrument will fl uctuate because of changes in market interest rates. Borrowings and investments issued at variable interest rates expose Napier City Council to cash fl ow interest rate risk. In order to manage the cash fl ow interest rate risk, under its Liability Management Policy Napier City Council has the ability to raise long-term borrowings at fl oating rates, then later swap them to fi xed rates using interest rate swaps.
Credit risk
Credit risk is the risk that a third party will default on its obligation to Napier City Council, causing Napier City Council to incur a loss. Due to the timing of its cash infl ows and outfl ows, the Napier City Council invests surplus cash into term deposits and local authority stock, which gives rise to credit risk. Napier City Council’s Investment Management Policy limits the amount of credit exposure to any one fi nancial institution or organisation. Investments in other Local Authorities are generally secured by charges over rates. Other than other local authorities, Napier City Council invests funds only with entities that have a Standard and Poor’s credit rating of at least A-1 for short-term investments, and at least A+ for long-term investments.Napier City Council has no collateral or other credit enhancements for fi nancial instruments that give rise to credit risk.
Maximum Exposure to Credit RiskNapier City Council’s maximum credit exposure for each class of fi nancial instrument is as follows:
Actual 2008
($000)
Actual 2007
($000)
Cash at Bank 3,453 9,290Term Deposits 30,203 21,984Sinking Fund Investments 186 780Local Authority Stock 8,252 1,800Financial Guarantees 880 1,497Total Credit Risk 42,974 35,351
Credit Quality of Financial Assets
The credit quality of fi nancial assets that are neither past due nor impaired can be assessed by reference to Standard and Poor’s credit ratings (if available) or to historical information about counterparty default rates:
Counterparties With Credit Ratings
Actual 2008
($000)
Actual 2007
($000)
Cash at Bank AA (Others) 3,453 9,290 AA- (Kiwibank) - -
3,453 9,290Term Deposits AA (Others) 22,703 15,984 AA- (Kiwibank) 7,500 6,000
30,203 21,984Counterparties Without Credit RatingsLocal Authority Stock 8,252 1,800Sinking Fund Investments 186 780Financial Guarantees 880 1,497
9,318 4,077
Debtors and other receivables mainly arise from Napier City Council’s statutory functions. Therefore there are no procedures in place to monitor or report the credit quality of debtors and other receivables with reference to internal or external credit ratings. The Council has no signifi cant concentrations of credit risk in relation to debtors and other receivable, as it has a large number of credit customers, mainly ratepayers, and has powers under the Local Government (Rating) Act 2002 to recover outstanding debts from ratepayers.
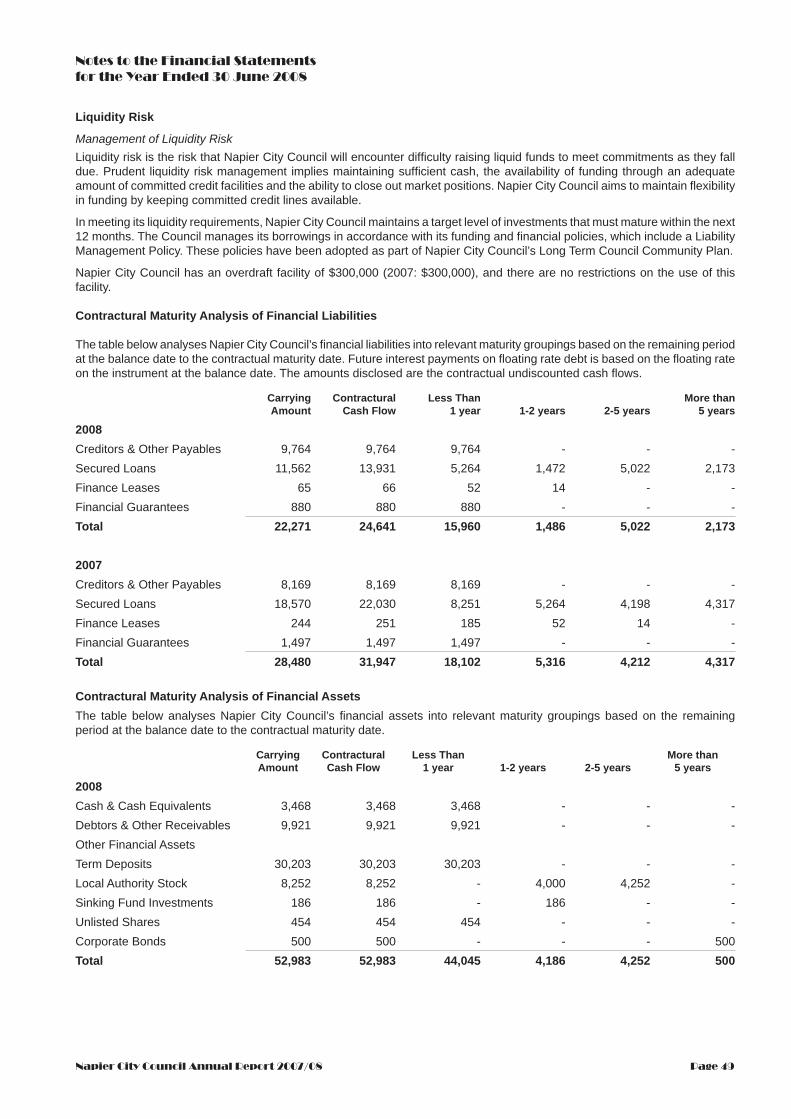
Page 49Napier City Council Annual Report 2007/08
Notes to the Financial Statements for the Year Ended 30 June 2008
Liquidity Risk
Management of Liquidity RiskLiquidity risk is the risk that Napier City Council will encounter diffi culty raising liquid funds to meet commitments as they fall due. Prudent liquidity risk management implies maintaining suffi cient cash, the availability of funding through an adequate amount of committed credit facilities and the ability to close out market positions. Napier City Council aims to maintain fl exibility in funding by keeping committed credit lines available.
In meeting its liquidity requirements, Napier City Council maintains a target level of investments that must mature within the next 12 months. The Council manages its borrowings in accordance with its funding and fi nancial policies, which include a Liability Management Policy. These policies have been adopted as part of Napier City Council’s Long Term Council Community Plan.
Napier City Council has an overdraft facility of $300,000 (2007: $300,000), and there are no restrictions on the use of this facility.
Contractural Maturity Analysis of Financial Liabilities
The table below analyses Napier City Council’s fi nancial liabilities into relevant maturity groupings based on the remaining period at the balance date to the contractual maturity date. Future interest payments on fl oating rate debt is based on the fl oating rate on the instrument at the balance date. The amounts disclosed are the contractual undiscounted cash fl ows.
CarryingAmount
ContracturalCash Flow
Less Than1 year 1-2 years 2-5 years
More than5 years
2008Creditors & Other Payables 9,764 9,764 9,764 - - - Secured Loans 11,562 13,931 5,264 1,472 5,022 2,173Finance Leases 65 66 52 14 - - Financial Guarantees 880 880 880 - - - Total 22,271 24,641 15,960 1,486 5,022 2,173
2007Creditors & Other Payables 8,169 8,169 8,169 - - - Secured Loans 18,570 22,030 8,251 5,264 4,198 4,317Finance Leases 244 251 185 52 14 - Financial Guarantees 1,497 1,497 1,497 - - - Total 28,480 31,947 18,102 5,316 4,212 4,317
Contractural Maturity Analysis of Financial AssetsThe table below analyses Napier City Council’s fi nancial assets into relevant maturity groupings based on the remainingperiod at the balance date to the contractual maturity date.
CarryingAmount
ContracturalCash Flow
Less Than1 year 1-2 years 2-5 years
More than5 years
2008Cash & Cash Equivalents 3,468 3,468 3,468 - - - Debtors & Other Receivables 9,921 9,921 9,921 - - - Other Financial AssetsTerm Deposits 30,203 30,203 30,203 - - - Local Authority Stock 8,252 8,252 - 4,000 4,252 - Sinking Fund Investments 186 186 - 186 - - Unlisted Shares 454 454 454 - - - Corporate Bonds 500 500 - - - 500Total 52,983 52,983 44,045 4,186 4,252 500

Page 50 Napier City Council Annual Report 2007/08
Notes to the Financial Statements for the Year Ended 30 June 2008
CarryingAmount
ContracturalCash Flow
Less Than1 year 1-2 years 2-5 years
More than5 years
2007Cash & Cash Equivalents 9,305 9,305 9,305 - - - Debtors & Other Rec’bles 6,881 6,881 6,881 - - - Other Financial AssetsTerm Deposits 21,984 21,984 21,984 - - - Local Authority Stock 1,800 1,800 300 - 1,500 - Sinking Fund Investments 780 780 623 157 - - Unlisted Shares 422 422 422 - - - Corporate Bonds - - - - - - Total 41,172 41,172 39,515 157 1,500 -
Sensitivity AnalysisThe tables below illustrate the potential profi t and loss impact for reasonably possible market movements, with all other variables held constant, based on Napier City Council’s fi nancial instrument exposures at the balance date.
2008 2007-100bps 100bps -100bps 100bps
ProfitOtherEquity Profit
OtherEquity Profit
OtherEquity Profit
OtherEquity
Interest Rate RiskFinancial AssetsCash & Cash Equivalents (35) - 35 - (93) - 93 - Other Financial AssetsTerm Deposits (302) - 302 - (220) - 220 - Local Authority Stock (83) - 83 - (18) - 18 - Sinking Fund Investments (2) - 2 - (8) - 8 - Corporate Bonds (5) - 5 - - - - - Financial LiabilitiesTerm Loans - Floating - - - - - - - -
(427) - 427 - (339) - 339 -
Explanation of Sensitivity AnalysisCash and Cash EquivalentsCash and cash equivalents include offset bank balances and deposits at call totalling $3,468 (2007 $9,306) which are at a fl oating interest rate. A movement in that rate of plus or minus 1.0% has an effect on interest income of $35 (2007 $93).Term DepositsA total of $2,462,000 (2007 $1,767,000) of investments in local authority stock are classifi ed at fair value through equity. A movement in interest rates of plus or minus 1.0% has an effect of $56,000 (2007 $101,000) on the fair value through equity reserve. A total of $30,203 (2007 $21,983) of investments in term deposits are classifi ed as held to maturity. A movement in interest rates of plus or minus 1.0% has an effect of $302 (2007 $220) on interest income.Local Authority StockA total of $8,252 (2007 $1,800) of investments in local authority stock are classifi ed as held to maturity. A movement in interest rates of plus or minus 1.0% has an effect of $83 (2007 $18) on interest income.Sinking Fund InvestmentsSinking Fund Investments totalling $186 (2007 $780) are invested at a fl oating interest rate. A movement in that rate of plus or minus 1.0% has an effect on interest income of $2 (2007 $8).Corporate BondsA total of $500 (2007 $0) of investments in corporate bonds are classifi ed as held to maturity. A movement in interest rates of plus or minus 1.0% has an effect of $5 (2007 $0) on interest income.Term LoansAt 30 June 2008 Napier City Council had $0 of fl oating rate debt (2007 $0). A movement in interest rates of plus or minus 1.0% therefore has no effect on interest income.

Page 51Napier City Council Annual Report 2007/08
Notes to the Financial Statements for the Year Ended 30 June 2008
35. Related Party TransactionsNapier City Council has signifi cant infl uence over Hawke’s Bay Cultural Trust and Hawke’s Bay Incorporated. Napier City Council also has a 36.32% share in the Omarunui Landfi ll joint venture and has signifi cant infl uence over Hawke’s Bay Airport Authority due to its 26.12% ownership.Hawke’s Bay Cultural TrustThe Trust is a council-controlled organisation as three of the fi ve member Board are Napier City Council and Hastings District Council nominees.Hawke’s Bay IncorporatedThis is a council-controlled organisation as the three funding Councils comprising Napier City Council, Hastings District Council and Hawke’s Bay Regional Council, have the right to appoint 50% of the Trustees of this organisation.
Actual2008$000
Actual2007$000
Hawke’s Bay Cultural Trust (HBCT)Grants paid to HBCT 262 850Book purchases paid to HBCT - - Conferences expenses paid to HBCT - - Services provided to HBCT 536 5Accounts receivable from HBCT - 276Accounts payable to HBCT 25 -Hawke’s Bay Incorporated (HBI)Advertising expenses paid to HBI 21 16Grant paid to HBI 400 400Services provided to HBI 2 1Hawke’s Bay Airport Authority (HBAA)
Services provided to HBAA 4 4Omaruni Landfi llLandfi ll fees paid to Hasting District Council 1,265 1,276
Key management personnelDuring the year, Councillors and key management, as part of a normal customer relationship, were involved in minor transactions with Napier City Council (such as payment of rates, Council fees and charges etc). Amounts shown below are exclusive of GST where GST is applicable.During the year, the Council purchased goods and services from East Pier, in which Mark Herbert, a Councillor, has an equity interest. These services cost $350 (2007: $1,642) and were supplied on normal commercial terms. The Council received revenue of $1,978 (2007: $750) from East Pier. This revenue was for advertising displays at Napier i-Site Visitor Centre and issuance of licences related to East Pier Bar and Restaurant.During the year, the Council received revenue of $1,047 from Thirsty Whale Bar and Restaurant Limited, in which Keith Price, a Councillor, has an equity interest. This revenue was for issuance of licences to Thirsty Whale Bar and Restaurant.During the year, the Council also purchased services from Something Different Limited, which is owned by John Cocking, a Councillor. The services cost $7,722 (2007: $15,693) and were supplied on normal commercial terms.No provision has been required, nor any expense recognised for impairment of receivables for any loans or other receivables to related parties (2007: $nil).
As at 30 June 2008, Napier City Council’s current and non-current investments and borrowings have all been negotiated at fi xed interest rates for fi xed terms. Accordingly, the Council holds no derivative fi nancial instruments (2007: $nil).
34. Derivative Financial Instruments

Page 52 Napier City Council Annual Report 2007/08
Notes to the Financial Statements for the Year Ended 30 June 2008
36. Joint VentureNapier City Council’s interest in the Omarunui Landfi ll is accounted for as a jointly controlled operation. Napier City Council’s interests in the jointly controlled operation are as follows:
Actual2008$000
Actual2007$000
Current assets 537 883Non-current assets 4,605 3,169Non-current liabilities 953 269Income 1,866 1,990Income (Napier City Council sales eliminated) (460) (464)
Expenses 659 881
Joint venture commitments and contingenciesThere are no capital commitments and contingent liabilities arising from involvement in the joint venture.
Key Management Personnel Compensation
Actual2008$000
Actual2007$000
Salaries and other short-term employee benefi ts 1,618 1,463Post-employment benefi ts - - Other long-term benefi ts - -Termination benefi ts - -
Key management personnel include the Mayor, Councillors, Chief Executive and other senior management.
Page 53Napier City Council Annual Report 2007/08
Council Controlled Organisations
This part of the Annual Report reports the performance of the Council-Controlled organisations as required in Clause 16 of Schedule 10 of the Local Government Act 2002.
Hawke’s Bay Airport Authoritya. Policies and Objectives Regarding Ownership and
Control
This is a joint venture between Government, Hastings District Council and Napier City Council, in which Napier City Council has a 26% shareholding. The Authority produces separate annual accounts. No payments are made by Napier City Council to the Authority and there is no fi nancial provision included in Council budgets. The Napier City Council share of the Authority is included in its annual fi nancial statements as an investment, valued using the equity method of accounting.
Council’s policies and objectives have been met in full.
b. Nature and Scope of Activities
The nature and scope of the activities of the Authority is to operate the airport facilities appropriate for Hawke’s Bay that fully comply with Civil Aviation Authority and other regulatory requirements, and the management of other related commercial activities on airport land.
There has been no change between the intended and actual nature and scope of activities delivered.
c. Performance Targets
The key performance targets and performance results (as refl ected in the Authority’s Annual Report for 2007/08) are:
Target Actual
Earnings before Interest, tax anddepreciation % to Revenue
61.7% 57.0%
Return on Funds Employed 4.4% 4.6%Profi t for period as % of total equity 4.1% 4.5%Landing Charges to Other Income 51.49 47.53Bird Strikes - per 000 aircraft movements
0.5 0.7
Safety & Security - accidents on airport nil nilCAA Rule 139 - non-compliance with rule
nil nil
Hawke’s Bay Cultural Trusta. Policies and Objectives Regarding Ownership and
Control
The Trust is a Council Controlled Organisation as three of the fi ve-member Board are Council nominees. This is in accordance with the revised Constitution and Rules adopted 30 October 2006, which were amended to refl ect the change in role to that of owner and guardian of the regional collection. As a new Board had not been appointed at the time a draft Statement of Intent would have been presented to shareholders, in accordance with the Act, there was no Council accepted Statement of Intent for 2007/08
b. Nature and Scope of Activities
The Objectives of the Trust are:
To hold and protect the regional collection for the • people of Hawke’s Bay and to provide storage and protection for the collectionTo advance and promote the Arts in New Zealand • and particularly in Hawke’s BayTo promote a sense of history and an awareness • of the importance of the nation’s heritage in New Zealand and particularly in Hawke’s BayTo provide an exhibition policy and to oversee the • maintenance, risk management and quality of the regional collection through a contract for services with the Napier City CouncilTo regulate and approve the disposal of collection • itemsTo administer the bequests held by the Hawke’s Bay • Cultural Trust.
The Nature and Scope of Activities to be undertaken for the regional collection are:
The provision of:
Care – To ensure conservation standards are met • and conservation practice is ongoingDevelopment – To grow in accordance with Collection • PoliciesHousing – To ensure proper storage/protection of • collection itemsExhibition/Display – To present the collection in line • with the Management agreement with Hawke’s Bay Museum & Art Gallery and other associated entitiesAccess to the collection – To ensure appropriate • access to the collection is maintained at all timesA collection that refl ects the history of Hawke’s Bay.•
c. Performance Targets
As noted above, there was no Council accepted Statement of Intent for the Trust for 2007/08 and therefore no performance targets were in place. A Statement of Intent, with measurable performance targets, has been prepared for 2008/09.
Hawke’s Bay Incorporated (HB Inc)a. Policies and Objectives Regarding Ownership and
Control
This was a Council-Controlled Organisation as the 3 funding Councils, Napier City Council, Hastings District Council and Hawke’s Bay Regional Council, had the right to appoint 50% of the Trustees of the Trust.
The purpose of HB Inc was to foster regional economic development including tourism destination marketing for the Hawke’s Bay region through improving the competitiveness of Hawke’s Bay as a place to visit, live, work, invest and grow business located in the Hawke’s Bay region.
b. Nature and Scope of Activities
The nature and scope of the activities of HB Inc were:

Page 54 Napier City Council Annual Report 2007/08
Council Controlled Organisations
Maori Contribution to Decision-Making Process
To provide Central Government and appropriate • departments such as NZTE with a single point of reference and connection to the region for tourism, economic development, and business development activities.To facilitate economic growth in the Hawke's Bay • region through:
providing the strategic direction for the region -through developing, agreeing, and updating as required a strategic plan for the regionproviding leadership in the implementation of the -plan, working with major stakeholders to ensure opportunities identifi ed are realisedmaximising the region's tourism effectiveness -by identifying target markets domestically and internationally, and ensuring individual and regional promotion to these targets is alignedproviding clear direction and support to the region's -tourism operators through the establishment and availability of a 'toolbox' of marketing materials ensuring all promotion of the region is consistentmarketing the region effectively as a competitive -place to visit through targeting specifi c marketing channels including key publications, private and public tourism organisations, and joint marketing opportunitiesestablishing and managing processes and -relationships to attract inward investment and favourable immigrationassisting growth businesses located in Hawke's -Bay to realise their potential through the establishment of a broad ranging business
capability database enabling collaborative opportunities to be identifi ed, skills matched, and potential realised.facilitate growth businesses by identifying -opportunities and constraints to their growth, and accessing relevant advice and supportactively build a positive relationship with Hastings -and Napier economic development staff to help ensure synergy of local and regional activities.
c. Performance Targets
The key performance targets (as reflected in the organisation’s 2007/08 Statement of Intent) were:
i. Financial
To operate within budget and remain solvent at all times.
ii. Non-Financial
To have in place a fully staffed organisation • structure.To complete and implement the Business Plan in • agreement with the Stakeholders.
To meet performance targets and measures • specifi ed by the Trust.
Hawke's Bay Inc has met its broad key fi nancial and non fi nancial performance targets. Full details are outlined in the Annual Report for HB Inc for 2007/08.
Hawke's Bay Inc functions transferred to the Hawke's Bay Regional Council during 2007/08, and with effect from 1 July 2008 ceased to be a Council Controlled Organisation.
Clause 21 of Schedule 10 of the Local Government Act 2002 requires that this Annual Report includes a report on opportunities provided for Maori to contribute to the decision-making process of Council.
Liaison with the Maori community is undertaken in the fi rst instance through the Maori Consultative Committee.
The Maori Consultative Committee makes recommendations to Council on agenda items already included on the
Community Development, Environmental Management and Corporate Business Standing Committee agendas. It also makes recommendations to the appropriate Standing Committee or Council on any other matters relevant to Council as it considers necessary. It meets six weekly, one week prior to the Council meeting.
Committee members may attend Council seminars/workshops as appropriate.

Page 55Napier City Council Annual Report 2007/08
Statement of Service
Performance for Activity Groups
Activity ReportingThe Statement of Services and Performance describes the Activities within each group, progress on Key Issues identifi ed in the 2007/08 Annual Plan and the fi nancial and non-fi nancial performance targets and results. Where applicable comparisons to budgets and last year's actuals are provided.
The HB Museum and Art Gallery activity includes the LTCCP Cultural Services activity.
The LTCCP Safer Community activity has been renamed Safer Napier.
NRB Customer Satisfaction SurveyCustomer satisfaction targets are measured by the NRB Customer Satisfaction Survey. Interviews were carried out in July 2008 with 455 residents of Napier, throughout the City. Weightings were applied to the sample data to refl ect the actual male/female/age/ethnic proportions in the area as determined by the Department of Statistics Census data. The Communitrak Survey is a scientifi cally prepared service based on a random probability sample. For the sample size of 455 the margin of error is plus or minus 6.5%.
Page 56 Napier City Council Annual Report 2007/08
DEMOCRACY AND GOVERNANCE
Activities
The Democracy and Governance Group comprises:
Democracy and Governance
Meeting Cycle 6 weeks• Standing and Specialist Committees 8• Elections Last• Held 2 November 2007
Through Democracy and Governance Council provides a democratic and consultative system for decision making. The Council, consisting of a Mayor and twelve Councillors, is elected three yearly. Through its structure of Committees, Sub-Committees, Working Parties and Forums Council carries out the requirements of the Local Government Act and other related legislation.
Key Issues
Council Elections
The election for the Council was held in October 2007 in accordance with the decision of the representation review with six councillors representing the city at large and six councillors representing the four newly formed wards, Ahuriri (1 representative), Onekawa-Tamatea (1), Nelson Park (2) and Taradale (2).
Two additional Standing Committees, LTCCP and Annual Plan and Tourism and Economic Development, have been added to the governance structure. The Hearings Committee has been replaced by the Resource Management Hearings Committee and the Licensing and Permits Hearings Committee.
Performance Measures for 2007/08
Measures and Targets Results
Democracy and Governance
1. Number of Council Meetings CyclesTarget: 7 cycles
7 meeting cycles were held in 2007/08 with the following number of Council and Standing Committee Meetings:
Council (inc. Extraordinary Council) 9Strategic Planning 2Environmental Management 7Community Development 5Corporate Business 6Maori Consultative 7Tourism and Economic Development 2LTCCP and Annual Plan 3
2. Percentage of residents satisfied with the “Sufficiency of Public Information” in the NRB Public Opinion SurveyTarget: 65%
The NRB Survey carried out in July 2008 showed 70% public satisfaction for “Suffi ciency of the Information Supplied”.
More than enough 8%Enough 62%Not Enough 20%Nowhere near enough 4%Don’t Know / Not Sure 6%
3. Carry out all processes for Council ElectionsTarget: No specific target for 2007/08
Elections were held on 13 October 2007 and the new Council was installed on 2 November 2007.

Page 57Napier City Council Annual Report 2007/08
Democracy and Governance
Financial Summary
Budget07/08$000
Actual 07/08 - $000 ActualActivity Operating Depn Interest Total Income Net Cost 06/07
of Service $000
1,919 Democracy and Governance 1,907 - - 1,907 - 1,907 1,681
1,919 Total net operating 1,907 - - 1,907 - 1,907 1,681 - Capital Expenditure - -
1,919 Funding Required 1,907 1,681
Funded by1,919 Non Targeted Rates 1,907 1,681
1,919 Total 1,907 1,681

Page 58 Napier City Council Annual Report 2007/08
RECREATION
Activities
The Recreation Group comprises:
Sportsgrounds
13 sports parks (167 hectares)• Major facilities - McLean Park Complex, Park Island, • Nelson Park and Tareha Park
Sportsgrounds are provided throughout the City to cater for a range of recreational and sporting needs.
Napier Aquatic Centre
Indoor facilities (heated) - 5-lane 25m pool, 6-lane • 25m pool, 15m learner’s pool, 2 toddlers pools, 2 spa pools, 2 waterslides
The aquatic facility provides a learn to swim school plus fitness, recreational and holiday programmes.
Marine Parade Pools
4 heated outdoor pools, 5 spa pools•
A complex with a range of heated salt water pools and spas managed under contract.
Reserves
35 neighbourhood parks, 45 greenbelt reserves, 22km • pathways, 22 playgrounds, 7 foreshore reserves and 6 public gardens.72.2 m• 2 recreational reserves per residential lot
A range of passive recreation facilities providing an open space network and formal gardens of a high standard throughout the City.
Inner Harbour
95 berths•
An area of wharves and catwalks in Ahuriri providing berths for commercial and recreational vessels and popular for recreational fishing.
Key Issues
Botanical Gardens Restoration ProjectCouncil carried out a public consultation process for the restoration of the Botanical Gardens. As a result an independent archeological assessment of the gardens was carried out. The restoration plan will be used as a guide only for future work in the Napier Botanical Gardens. The fence will be removed and a gate installed at the lower Spencer Road entrance. The water reticulation works and water conservation measures will be undertaken after the necessary approvals are obtained from the Historic Places Trust. Remaining funds of $336,000 for the Botanical Gardens Restoration Capital project are be spent in the 2008/09 year
Napier Aquatic Centre In April 2008 the Napier City Council decided that the Olympic pool and dive well at the Napier Aquatic Centre would be closed as they were no longer viable to operate and maintain.
Significant Acquisitions or Replacement of Assets
McLean Park Redevelopment• The redevelopment encompasses an upgrade of the lighting, the construction of the Graeme Lowe Stand, which is to replace the existing McKenzie Stand, and the upgrading of user requirements. Expenditure incurred in 2007/08 was for the design of the new stand and lighting. Unspent budget will be carried forward for the completion of the project.
Whakarire Ave Breakwater• The addition of a Groyne in the vicinity of Whakarire Avenue is part of the erosion mitigation measures planned for Westshore Beach. Expenditure for 2007/08 relates to professional fees and assessment of the environmental effect of the proposed breakwater. Unspent budget will be carried forward for the completion of the project subject to obtaining a resource consent.

Page 59Napier City Council Annual Report 2007/08
Recreation
Performance Measures for 2007/08
Performance Measures Results
Sportsgrounds
1. Residents satisfi ed with ‘Sportsgrounds/fi elds’ in the NRB Public Opinion SurveyTarget: 90%
The NRB Survey carried out in July 2008 showed 93% resident satisfaction with Parks and Sportsfi elds. Very Satisfi ed 55% Fairly Satisfi ed 38% Not Very Satisfi ed 3% Don’t Know 4%
2. Sportsground area per 1,000 residentsTarget: 3.129 Ha
Sportsground area per 1,000 residents = 2.919 Ha. The target (not achieved) is a long term average and the result is dependent on the timing of development of sportsgrounds.
3. International Events Target: 4
International events = 3. The target was not achieved.
4. National/Inter-regional Events Target: 75
National/Inter-regional events = 74.The target was not achieved.
Napier Aquatic Centre
1. Users per Year.Target: 230,000
Casual users 65,255Concessions 15,324Aerobics 8,092Learn to swim 21,888Holiday Programme 3,567Clubs 14,420Facility Hires (Groups) 35,821Non Paying users 18,379Total Users 182,746The target was not achieved.
2. Percentage of Facilities ‘Poolsafe’Target: 100%
100% compliance with PoolSafe requirements
3. Customer Satisfaction in the NRB Public Opinion SurveyTarget: 80%
The NRB Survey carried out in July 2008 showed 55% resident satisfaction with Swimming Pools. Very Satisfi ed 26% Fairly Satisfi ed 29% Not Very Satisfi ed 18% Don’t Know 27%The target was not achieved.
4. Programmes Operating Per Year.Target: 6
2007/08 = 7
5. Adherence rate to Water Quality Meeting NZ Standards.Target: At least 85% of the water test results comply
with NZ Standards
Adherence average = 95%
6. Number of Learn To Swim Users per Year.Target: 25,000
Learn to swim participants = 21,888. The target was not achieved.
Note: Performance results for the Napier Aquatic Centre have been adversely effected by the closure of the Olympic pool and dive well.

Page 60 Napier City Council Annual Report 2007/08
Recreation
Performance Measures Results
Marine Parade Pools
No performance measures
Reserves
1. Residents Satisfi ed with ‘Public Gardens and Street Beds’ in the NRB Public Opinion SurveyTarget: 90%
The NRB Survey carried out in July 2008 showed 97% resident satisfaction with Public Gardens and Street Beds. Very Satisfi ed 60% Fairly Satisfi ed 37% Not Very Satisfi ed 3% Don’t Know 0%
2. Number of annuals propagated and planted throughout the cityTarget: 180,000
Annuals for 2007/08 = 177,340The target was not achieved.
3. Area of Recreational Land Per Residential LotTarget: 75m2
Area per lot = 72.2m2. The target (not achieved) is a long term average and the result is dependent on the timing of development of greenfi eld reserves and the acquisition of suitable reserve areas to counter infi ll development.
Inner Harbour
1. Percentage of vessels berthed that are CommercialTarget: 30%
30% of vessels berthed were commercial for 2007/08
2. Time between Dredges of the Inner HarbourTarget: 3 years
Planned dredging during 2007/08 not undertaken so that dredging could coincide with Port of Napier dredging requirement to minimise cost. Dredging to be undertaken in second half of 2008, 4½ years from last dredging.The target was not achieved.
3. Number of Permanent BerthsTarget: 95
95 permanent berths for 2007/08

Page 61Napier City Council Annual Report 2007/08
Recreation
Financial Summary
Budget Actual 07/08 - $000 Actual07/08 Activity Operating Depn Interest Total Income Net Cost 06/07$000 [1] of Service $000
2,631 Sportsgrounds 2,155 594 127 2,876 839 2,037 1,382
1,112 Napier Aquatic Centre 1,552 202 13 1,767 589 1,178 1,236
140 Marine Parade Pools 70 148 12 230 50 180 134
2,900 Reserves 2,440 221 174 2,835 108 2,727 2,666
221 Inner Harbour 227 82 18 327 166 161 170
7,004 Total net operating 6,444 1,247 344 8,035 1,752 6,283 5,588 5,763 Capital Expenditure [2] 610 1,394
12,767 Funding Required 6,893 6,982
Funded by5,850 Non Targeted Rates 5,700 6,045
4,802 Special Funds 729 549
274 Vested Assets - -
1,414 Loans 64 -
427 Non Funded Depn 400 388
12,767 Total 6,893 6,982
[1] Summary of IncomeActual07/08$000
Land Transport NZ & other Government Grants 1,275
Regulatory Revenue 32
Retail & Product Sales 407
Other Income 22
Grants & Donations 13
Vested Assets - Parklands Residential Development 3
Total Income 1,752

Page 62 Napier City Council Annual Report 2007/08
Recreation
[2] Capital ExpenditureBudget Actual
07/08 07/08$000 $000
Sportsgrounds3,496 McLean Park Redevelopment 175
111 Tareha Sportsground Construct Shower/Change Facilities -
- Sportsgrounds Minor Capital 12
139 Sportsgrounds Renewals 27
Napier Aquatic Centre- Redevelop Reception and Offi ce 42
38 Napier Aquatic Centre Renewals 17
Reserves1,314 Whakarire Ave Breakwater 64
100 Beach Reprofi ling -
60 Tree Planting Programme 54
- Upgrade Skatebowl Facility 49
- Reserves Minor Capital 16
231 Reserves Renewals 154
274 Reserves Vested Assets -
5,763 Capital Expenditure 610

Page 63Napier City Council Annual Report 2007/08
SOCIAL AND CULTURAL
ActivitiesThe Social and Cultural Group comprises:
Libraries
• 2 Libraries - Napier and Taradale• 39,859 members
Libraries offer free-to-all services and a stimulating and pleasant environment. Services include recreational, educational, historical, genealogical, cultural and current affairs material together with on-line facilities, reading and outreach programmes.
War Memorial Conference Centre
A multi-functional facility located on the beach front along Marine Parade, consisting of a ballroom, an exhibition hall, a gallery and three breakout rooms. This venue is highly suitable for conferences, exhibitions, weddings and other functions. The facility also houses an eternal flame as a memorial to Napier citizens who served and died in the conflicts of the 20th century.
Napier Municipal Theatre
The Art Deco heritage building in Tennyson Street provides modern theatre facilities for local, national and international live theatre, performing arts, exhibitions, and other community functions. The auditorium has a seating capacity of 993, and a ticketing Agency, selling 77,000 tickets annually, is situated in the front foyer.
HB Museum and Art Gallery
Hawke’s Bay Museum and Art Gallery is located at the corner of Marine Parade and Tennyson Street in Napier. Key parts were designed by prominent architect Louis Hay and built in the 1930s with significant additions including the Century Theatre designed by Natusch Shattky & Co in the late 1970s. It is a purpose-build art gallery and an iconic Art Deco building in Napier. The buildings house a combined museum and art gallery and a theatre/cinema complex. Hawke’s Bay Museum and Art Gallery is also responsible for overseeing the operation of the Faraday Centre, Technical Museum and Science Centre, located in Faraday Street, Napier.
Community Development
Community facilitation, administration of community grants, and youth development are the main components of community advice. Community facilitation and grants support and encourage voluntary and community based organisations to address social issues in the city through self-help processes. Youth development supports and fosters the role of young people in our community, providing opportunities for young people to participate and engage in decision making.
Safer Napier
The purpose of this activity is to develop Crime Reduction projects that promote safety in the community, and provide coordination and liaison between community groups and organisations. The Safer Napier Board, formerly the Safer Community Council, was established as a Central Government initiative - subsidised by the Ministry of Justice Crime Prevention Unit.
Safety Watch
• Inner City Patrol at least five nights per week - 8pm to 5am.
The Safety Watch patrol acts as extra eyes and ears for the Police in the inner city area. The aim of the programme is to reduce violence and encourage sensible social behaviour.
Halls
• 7 casual hire facilities, 2 leased facilities
Council provides a range of facilities with a good geographic spread for recreational, community or leisure activities at affordable prices.
Retirement and Rental Housing
• 303 retirement flats in 9 villages - all one bedroom• 70 rental flats in 3 villages - mostly 2 bedrooms
Flats are provided for people with special housing needs, low assets, and low income, with the emphasis on providing for the welfare of the tenants. Council flats are in high demand with the average occupancy rate exceeding 97% with the remainder a very tight down time for cleaning and maintenance.
Cemeteries
• 6 cemeteries - 4 operational and 2 historic
Comprehensive areas for burials, ash interments, and ash scattering. The recently restored historic cemeteries ensure the historical and cultural significance is preserved. Records are available for genealogical enquiries. Note the crematorium for the Hawke’s Bay region, located in Hastings, is owned and operated by Hastings District Council.
Public Toilets
• 42 toilet facilities free of charge (of 43 total)
Public toilets are provided in key areas generally related to tourism, recreation and shopping activities. Facilities are cleaned and inspected daily with the emphasis on hygiene, safety and mitigation of graffiti.
Emergency Management
• 1 Emergency Management Operations Centre• 9 Civil Defence Centres
Emergency Management combines Council staff, volunteers, other organisations and agencies to facilitate a planned response to emergencies in Napier. Integration of policies and planning as a region is coordinated by the Hawke’s Bay Civil Defence Emergency Management Group.
Page 64 Napier City Council Annual Report 2007/08
Social and Cultural
Key Issues
Community DevelopmentIn November 2007 the Napier City Council finalised the purchase of four shops to facilitate the rejuvenation of the Maraenui Shopping Centre. Two shops were on-sold to the EIT which has gone on to develop an Education Centre in the community. The remaining shops were renovated and leased to organisations to provide community based services.In August 2007, in response to a petition from young people, the Napier City Council resolved to carry out an upgrade of the Anderson Park Skatepark. This upgrade was completed in July 2008.The Pukemokimoki urban Marae was completed and officially opened in October 2007.The Skatezone wall facing Marine Parade was upgraded to include viewing panels in September 2007.
HB Museum and Art GalleryFunding of the costs of maintaining the regional collection has been agreed between Napier City Council and Hastings District Council to be shared equally. The regional collection is held by the Hawke’s Bay Cultural Trust, a Council Controlled Organisation.
Significant Acquisitions or Replacement of Assets
Library Bookstock• Purchase of bookstock to renew, revitalise and add to the Library Collections. There is no effective way to separate renewal from new capital as most items are not exact replacements but new material on existing subjects. Unspent budget will be carried forward.
Projects resulting from the Review of Library • ServicesNapier libraries have implemented many of the strategies and recommendations arising from the review of library services adopted by the Napier City Council in August 2007. The redevelopment of the Taradale Library is scheduled to start in September 2008
Redevelop HB Museum and Art Gallery Buildings• Major redevelopment of the Hawke’s Bay Museum and Art Gallery building is proposed. This includes the demolition of the Lilliput and Discovery Centre buildings, the creation of a new HB Museum and Art Gallery building which links through to the existing Century Theatre and Museum buildings and the restoration of the Louis Hay Museum to its original Art Deco character.Architects have been employed to prepare working drawings. This project is behind schedule due to delays caused through the design concept needing to be reworked after initial consultation and design considerations.Budget for this project was originally included in the 2006 LTCCP and 2007/08 Annual Plan in the Property Assets activity group as the project was identified prior to the transfer of the HB Museum and Art Gallery from the HB Cultural Trust to the Napier City Council.

Page 65Napier City Council Annual Report 2007/08
Social and Cultural
Performance Targets for 2007/08
Performance Measures Results
Libraries
1. Number of issues of Specialist Collections Target: 1,500
Number of Issues = 9,133 Increased issues resulted from improved displays and marking (OCTA project).
2. Number of Users (Door and Virtual) Target: 500,000 (door and web) 420,000 (door only)
Number of users 2007/08: Door and Web = 505,178 Door only = 428,092
3. Bookstock Refreshment Rate Target: 250
Refreshment Rate = 376
4. Number of Items issued Target: 740,000
Number of Items issued = 750,305
5. Number of members Target: 33,000
Number members at 30 June 2008 = 39,859(35,010 Napier resident members)
6. Users of Community Information Database Target: 160
Number of Users = 716 Better use of website after it was upgraded and combined with the Council Website.
7. Books on Wheels users Target: 100
Number of Users = 101
8. Number of children’s programmes Target: 150
Number of Programmes = 223Target set lower for closure of Taradale Library which is now scheduled for 2008/09.
Note: The measure "Number of users of Indexes" included in the LTCCP was not included in the 2008/09 Annual Plan as the statistic is not able to be measured accurately with current systems.
War Memorial Centre
1. Days Eternal Flame Memorial maintained Target: 365
Flame memorial maintained for 366 days in 2007/08
2. Usage Rate Target: 252 days
Usage Rate for 2007/08 = 290 days
3. Customer Satisfaction Target: 90%
Customer satisfaction for 2007/08 = 94%
4. Number of “Full Service” Conferences Target: Total Delegates 2,700 Conferences 18 Average delegates 150
Number of "Full Services" conferences for 2007/08
Total Delegates 3,653Conferences 22Average delegates 166

Page 66 Napier City Council Annual Report 2007/08
Social and Cultural
Performance Measures Results
Municipal Theatre
1. Number of Performance Days Target: 154
Number of Performance Days 2007/08 = 118. The target was not achieved. Less touring shows this last year and increased venue competition
2. Reviews of Building Maintenance and Standard of Art Deco Presentation
Target: 1 per year
1 review achieved in 2007/08
3. Number of ‘Other’ Hire Days Target: 60
'Other' Hire Days 2007/08 = 43. The target was not achieved. Lower overall level of activity/timing of bookings
4. Number of Tickets sold Target: 56,000
Tickets sold 2007/08 = 77,939
Note: The trend of more tickets sold over the internet, quality of touring shows available in the regions and regional competition saw ticketing drop. The target was reduced from the LTCCP target of 74,000.
HB Museum and Art Gallery
From 1 July 2006 the activities previously managed by the HB Cultural Trust reported through the Tourism Services department of Napier City Council. Performance measures for the HB Museum and Art Gallery are currently being developed for inclusion in the 2008/09 LTCCP.
Community Development
1. Community Services Grants Allocated By the Designated Process and Time Frame
Target: 100%
The target was achieved with a total of $57,200 allocated to 39 community organisations, approved at Council meeting on 8 August 2007.
2. Community Services Property Grants Allocated By the Designated Process and Time Frame
Target: 100%
The target was achieved with a total of $25,355 allocated as approved at Council meeting on 19 September 2007.
3. Percent of Community Development Funding Distributed to Support Community Development Initiatives Each Year
Target: 100%
The target was achieved with $189,500 distributed or allocated to support community development initiatives. • Maraenui Shopping Centre Revitalisation • sPACIFICally Pacific Youth Expo 2007 $2,000• HB Elderly Directory $5,000• Maraenui Shop Purchases $179,000• Xmas Parade 2007 $3,500.
4. Percent of Service Agreements and Purchase Contracts Meeting Reporting Requirements
Target: 90%
The following organisations have either a service agreement or purchase contract with Council: • Creative Napier • Napier Citizens Advice Bureau• Neighbourhood Support • Sport Hawke’s Bay • Surf Life Saving 90% reporting requirements met in 2007/08
5. Number of Napier Community Network Meetings Coordinated Each Year
Target: 4
4 community network meetings held in 2007/08• 25 September 2007• 13 November 2007• 26 February 2008• 27 May 2008
6. Number of community organisations receiving information by way of mail-out and e-mail four times per year
Target: 100
120 community organisations received information via community network meetings, newsletters, email groups, community projects and on the Council website.

Page 67Napier City Council Annual Report 2007/08
Social and Cultural
Performance Measures Results
Youth Development
1. Number of Youth Forums Coordinated Per Year Target: 6
19 Youth Forums coordinated in 2007/08.
2. Number of Scholarships Awarded For the Youth Development Fund
Target: 10
10 Scholarships awarded for 2007/08.
3. Number of Youth Service Providers Receiving Information Mail-outs Quarterly
Target: 25
248 Youth Services providers received quarterly information mail-outs in 2007/08. (10 different mail-outs to Youth Workers Collective)
4. Number of Alcohol and Drug Free Events and Activities Target: 6
10 events held in 2007/08:• 3 x Live Concerts• ‘Take It On’ – Spac Pac Hip Hop Comp• Kidz Fest• Maraenui Family Fun Day • Hawkes Bay Youth Awards• Pool Party with Napier Aquatic Centre• Hip Hop Concert• Free Fun Day @ Sk8 Zone
Safer Napier
1. Crime Reduction Strategies Target: 3
Continued implementation of Maraenui Urban Renewal • PlanKa Hao Te Rangatahi youth programme currently • running. A further funding application has been made to the Ministry of Youth DevelopmentAhuriri survey finialised• Maraenui Survey completed• Napier alcohol Liaison Group continues to meet• As part of the Curbing Alcohol Related Violence project • a draft Alcohol Strategy was completed and is ready for the first consultationDraft civic pride action plan is completed and ready for • consultation. Targets wilful damage
Safety Watch
1. Nights Safety Watch Patrol Inner City Per Year Target: 260
Patrolled 254 nights for 2007/08.The target was not achieved.
Note: The measures "Total Incidents Recorded" and "Total Recorded Crime in CBD" included in the LTCCP were not included in the 2007/08 Annual Plan as they do not reflect the actual performance of the Safety Watch Patrol. They are primarily influenced by variables beyond the control of Council.
Halls
1. Total Proportion of Users That Are Community and Rehabilitation Hires
Target: 75%
89% for 2007/08.The target was not achieved.
2. Total Hours Hired in Greenmeadows East, Memorial Square and Library Seminar Room
Target: Greenmeadows 1,250 Memorial Square 1,600 Library Seminar 700
Hours Hired 2007/08:
Greenmeadows 1,782Memorial Square 1,927Library Seminar Room 608The Library Seminar Room target was not achieved.
3. Customer Satisfaction Rate Target: 80%
Customer Satisfaction Rate for 2007/08 = 96%

Page 68 Napier City Council Annual Report 2007/08
Social and Cultural
Performance Measures Results
Retirement and Rental Housing1. Number of flats inspected Target: 100%
94% of flats inspected in 2007/08. The target was not achieved. Flats are not inspected if the tenant is not able to be present for the inspection.
2. Occupancy Rate - Rental Flats Target: 96.7%
Occupancy rate for 2007/08 = 97.1%
3. Occupancy Rate - Retirement Flats Target: 96.7%
Occupancy rate for 2007/08 = 96.8%
4. Maximum Rent Arrears - Rental Flats Target: 0.16% of rentals
Arrears 2007/08 $899.80 = 0.07% of rentals
5. Maximum Rent Arrears - Retirement Flats Target: 0.16% of rentals
Arrears 2007/08 $844.80 = 0.16% of rentals
CemeteriesThe subject of death and burials is a sensitive issue so it is not practical to survey users directly. There are no performance targets set, but the number of burials is recorded and included in this Annual Report.
1. Record the number of burials and ash interments for the year.
Burials for 2007/08 175Ash interments for 2007/08 191
Public Toilets1. Public satisfaction rate in the NRB Public Opinion
Survey Target: 80%
The NRB Survey carried out in July 2008 showed 69% resident satisfaction with Public Toilets. Very Satisfied 27% Fairly Satisfied 42% Not Very Satisfied 12% Don’t Know 19%The target of 80% is optimistic and has not been achieved in past years. This year the percentage has also been adversely effected by an increase in "don't know's".
2. Daily inspections and cleaning of all Toilets Target: 100%
100 % of toilets were inspected and cleaned daily in 2007/08
Emergency Management1. Radio Communications operative during weekly
checks Target: 95%
100% of radios operative during weekly checks. Twelve of the weekly checks were not carried out due to annual leave and other commitments. The radios are in daily use by the parking department and Napier Aquatic Centre.
2. Emergency Operations Centre training activities Target: 30
38 training activities in 2007/08
3. Number of Civil Defence Centres Target: 9
9 Civil Defence Centres
4. Number of Civil Defence Community Networks (Volunteers)
Target: 45
50 Civil Defence Community Networks
5. Percentage of residents satisfied with Civil Defence Activity in the NRB Public Opinion Survey
Target: 58%
The NRB Survey carried out in July 2008 showed 58% resident satisfaction with Civil Defence. Very Satisfied 19% Fairly Satisfied 39% Not Very Satisfied 4% Don’t Know 38%
6. National Warnings responded to within 30 minutes Target: 95%
100% of warnings, where required, were responded to within 30 minutes

Page 69Napier City Council Annual Report 2007/08
Social and Cultural
Financial Summary
Budget Actual 07/08 - $000 Actual07/08 Activity Operating Depn Interest Total Income Net Cost 06/07$000 [1] of Service $000
2,598 Libraries 2,267 696 14 2,977 252 2,725 2,428
235 War Memorial Centre 1,245 90 9 1,344 1,112 232 255
486 Municipal Theatre 614 257 19 890 440 450 478
781 HB Museum and Art Gallery 2,435 55 - 2,490 1,482 1,008 1,174
821 Community Development 1,118 2 - 1,120 310 810 888
105 Safer Napier 292 - - 292 161 131 71
337 Safety Watch 219 - 1 220 - 220 237
208 Halls 272 42 9 323 50 273 202
(38) Retirement and Rental Housing 1,215 463 130 1,808 1,805 3 (21)
290 Cemeteries 421 27 8 456 212 244 206
607 Public Toilets 603 38 5 646 13 633 568
291 Emergency Management 278 36 - 314 12 302 271
6,721 Total net operating 10,979 1,706 195 12,880 5,849 7,031 6,757 2,780 Capital Expenditure [2] 1,526 1,390 9,501 Funding Required 8,557 8,147
Funded by6,245 Non Targeted Rates 7,338 6,783
920 Special Funds 666 503
- Vested Assets - 465
1,939 Loans 164 -
397 Non Funded Depn 389 396
9,501 Total 8,557 8,147
[1] Summary of IncomeActual07/08$000
User Charges 1,069
Land Transport NZ & other Govt Grants 398
Rental Income - Other 1,956
Retail & Product Sales 2,115
Other Income 25
Grants & Donations 286
Total Income 5,849

Page 70 Napier City Council Annual Report 2007/08
Social and Cultural
[2] Capital Expenditure
Budget07/08$000
Actual07/08$000
Libraries553 Library Stock 498
939 Projects resulting from the Review of Library Services 162
10 Verna Corbett Bequest 9
- Self Checking Equipment 96
- Libraries Minor Capital 2
War Memorial Centre16 War Memorial Centre Minor Capital 16
Municipal Theatre25 Municipal Theatre Minor Capital 13
HB Museum and Art Gallery1,000 Redevelop HB Museum and Art Gallery Buildings 305 *
HB Museum and Art Gallery Minor Capital 40
Safety Watch- Crime prevention through environmental design 84
Halls- Halls Minor Capital 79
Retirement and Rental Housing80 Retirement Housing Minor Capital 16
20 Rental Housing Minor Capital 1
Cemeteries47 Infrastructure Asset Renewal 14
Public Toilets90 Infrastructure Asset Renewal 121
Emergency Management- Civic Building Generator 66
- Emergency Management Minor Capital 4
2,780 Capital Expenditure 1,526
Note (*): see page 64 for comments on Redevelopment of HB Museum and Art Gallery Buildings

Page 71Napier City Council Annual Report 2007/08
CITY PROMOTION
Activities
The City Promotion Group comprises:
City and Business Promotion
• Business advisory and facilitation services• Business re-focus• “Be Your Own Boss” programme
The Enterprise Unit facilitates and assists existing and new businesses in the City to develop, expand and create employment.
• Time of Your Life campaign
Council promotes Napier via the “Time of Your Life” city marketing programme - an ongoing major media advertising programme aimed at informing national and international audiences about Napier to attract migrants and visitors to Hawke’s Bay.
• Sister City relations
Napier City Council has formal sister city relationships with Tomakomai in Japan and Lianyungang in China. Council also has friendly city relationships with Xuzhou in China, Victoria in British Columbia, Canada and has servicing relationships with the Chatham Islands.
City Promotion Grants
• Grants to key local tourism organisations
Council assists with the economic development of the region via its contracts for service to Hawke’s Bay Inc. Art Deco is an important tourism feature of the City and Council assists the Art Deco Trust and Bertie in its promotion of Art Deco in Napier by way of a contract for service. Council also provides assistance for the marketing of the Central Business District.
Marineland of NZ
New Zealand’s only marine zoo located on Marine Parade houses seals, sea lions, penguins and other birds. Until the death of the remaining dolphin, Kelly, on 11 September 2008 Marineland ran shows and behind the scenes tours daily and provided bicycles and wet suits for hire. The zoo also provides an animal rehabilitation centre for sick, injured and orphaned marine animals. Education programmes and workshops are available for schools.
National Aquarium of NZ
The National Aquarium of New Zealand on Marine Parade houses sharks, stingray, hundreds of fi sh species, reptiles and kiwi. There are shows and tours daily, diving and photograph facilities, a themed souvenir shop and a café. The aquarium regularly hosts school groups, tour groups, birthday parties, sleepovers, and many other functions.
Napier i-SITE Visitor Centre
Napier i-Site Visitor Centre on Marine Parade is part of the i-SITE New Zealand network and offers information and booking services including accommodation and travel, attractions and activities, itinerary planning and advice, gifts, souvenirs, stamps and phone cards, local events and entertainment information, maps, guides and books, locally and New Zealand wide.
Par 2 MiniGolf
Two 18 hole miniature golf courses situated next to the Napier i-SITE Visitor Centre on Marine Parade providing entertainment for all ages. Services include group rates, coaching for schools, Big Day Out Programme incorporating Marine Parade Heritage Features, and corporate business house competitions.
Kennedy Park
Kennedy Park Top 10 Resort is one of the busiest holiday parks in New Zealand set in spacious park like surroundings. Facilities include 91 rooms, 170 powered and non-powered sites, as well as a restaurant, bar, conference facility, children’s playground, commercial laundry, service buildings, shop and a pool complex.
Key IssuesMarinelandIn accordance with Council's 2 July 2008 resolution, when the remaining dolphin Kelly died, Marineland was closed to the public and at the same time the strategy identified in 2001 was put in place. Redevelopment options will continue to be investigated in consultation with the community.

Page 72 Napier City Council Annual Report 2007/08
City Promotion
Performance Targets for 2007/08
Performance Measures Results
City and Business Promotion
1. Number of Economic Monitoring Reports producedTarget: 4
Economic Monitoring Reports produced 2007/08 = 3• Business Survey - September 2007• Economic Monitor Report - November 2007 and March
2008 The target was not achieved.
2. ‘Be Your Own Boss’ clients servedTarget: 100
95 clients in 2007/08The target was not achieved.
3. Public Satisfaction rating in the NRB Public Opinion SurveyTarget: 70% excluding don't know
The NRB Survey carried out in July 2008 showed 85% resident satisfaction with Council’s policies to promote job opportunities excluding "don't know".
City Promotion Grants
There are no non fi nancial performance measures.
Marineland of New Zealand
1. AttendancesTarget: 46,500
Attendances for 2007/08 = 47,711 (This does not include the 5,000 attendees at open day November 2007.
2. Range of visitor experience optionsTarget: 7
Visitor experience options for 2007/08 = 7
3. Number of educational programme attendeesTarget: 4,400
Educational programme attendees for 2007/08 = 4,300The target was not achieved
4. Number of rehabilitated animals and birdsTarget: 30
Rehabilitated animals and birds 2007/08 = 56
5. Work experience and skill enhancement volunteersTarget: 25
45 volunteers in 2007/08
Napier i-Site Visitor Centre
1. Visitor numbers through CentreTarget: 350,000
326,444 visitors for 2007/08. The target was not achieved due to a change in international visitor mix and a slight drop in overall visitor numbers to Napier.
Note: Projected growth in visitor number through the centre in the LTCCP have not eventuated. The target was reduced in the 2007/08 Annual Plan.
2. New and renewal paid operator displaysTarget: 120
425 new and renewal paid operator displays for 2007/08. New lay out of building has allowed for further paid advertising spaces.
3. Number of information packs distributedTarget: 1,200
3,119 information packs distributed in 2007/08. Information packs held in association with i-Site familiarisation has impacted this year on information pack numbers.
Note: The number of visitor information packs target was reduced from the LTCCP to refl ect the greater levels of information now available online and able to be printed by consumers on demand at home.

Page 73Napier City Council Annual Report 2007/08
City Promotion
Performance Measures Results
Par 2 MiniGolf
1. Admission numbersTarget: 50,280
53,270 admissions for 2007/08
2. Customer satisfaction ratingsTarget: 80%
Customer satisfaction for 2007/08 = 91%
National Aquarium of New Zealand
1. Number of school visitsTarget: 50
200 school visits in 2007/08
2. Number of school childrenTarget: 7,322
7,769 school children in 2007/08
3. Number of environmental exhibitionsTarget: 2
4 environmental exhibitions in 2007/08
4. Number of environmental projectsTarget: 2
5 environmental projects in 2007/08
5. Number of visitorsTarget: 113,147
102,814 visitors in 2007/08. The target was not achieved due to a downturn in visitor numbers with high fuel prices hit home in the fi nal quarter of the 2008 year.
6. Number of function attendeesTarget: 1,620
1,571 function attendees in 2007/08. The target was not achieved due to lower function numbers offset by higher sleepover attendees. Functions and sleepovers cannot be run on the same night.
7. Number of sleepover attendeesTarget: 860
1,139 sleepover attendees in 2007/08
8. Number of major cultural exhibitsTarget: 1
4 major cultural exhibit(s) in 2007/08
9. Number of Friends of the AquariumTarget: 850
1,374 friends of the Aquarium in 2007/08
Kennedy Park
1. Overall Room Nights BookedTarget: 36,141
34,523 room nights booked for 2007/08, target not achieved. Emphasis was successfully placed on yield. Profi tability was improved from lower occupancy.
1. Room nights booked for sport groupsTarget: 1,527
2,120 room nights booked for sport groups for 2007/08
2. Percentage of users who have young children in family groupsTarget: 21%
26% of users with young children in family groups in 2007/08
Note: the target was revised from the LTCCP as new computer software has enabled more accurate recording of families with young children staying at the park. Previously it was total children numbers as a percentage of total guests.

Page 74 Napier City Council Annual Report 2007/08
City Promotion
Financial Summary
Budget Actual 07/08 - $000 Actual07/08 Activity Operating Depn Interest Total Income Net Cost 06/07$000 [1] of Service $000
477 City and Business Promotion 532 - - 532 35 497 471
617 City Promotion Grants 751 - - 751 152 599 606
370 Marineland of NZ 737 38 3 778 694 84 274
642 National Aquarium of NZ 1,621 334 232 2,187 1,428 759 665
288 Napier i-SITE Visitor Centre 881 33 2 916 614 302 251
(40) Par 2 MiniGolf 244 8 - 252 331 (79) (80)
(459) Kennedy Park 1,953 207 17 2,177 3,081 (904) (664)
1,895 Total net operating 6,719 620 254 7,593 6,335 1,258 1,523 247 Capital Expenditure [2] 201 136
2,142 Funding Required 1,459 1,659
Funded by1,259 Non Targeted Rates 1,064 1,029
247 Special Funds (225) -
636 Non Funded Depn 620 630
2,142 Total 1,459 1,659
[1] Summary of IncomeActual07/08$000
Uniform Annual Charges 152
User Charges 35
Land Transport NZ & other Govt Grants 53
Rental Income - Other 34
Retail & Product Sales 5,765
Other Income 19
Grants & Donations 277
Total Income 6,335

Page 75Napier City Council Annual Report 2007/08
City Promotion
[2] Capital ExpenditureBudget07/08$000
Actual07/08$000
Marineland of NZ6 Marineland Minor Capital 6
National Aquarium of NZ13 Aquarium Minor Capital 53
30 Aquarium Capital Items -
Napier i-SITE Visitor Centre- i-Site Upgrade/Refurbishment 23
11 i-SITE Minor Capital -
Par 2 MiniGolf6 Par 2 MiniGolf Minor Capital 23
Kennedy Park104 Kennedy Park Minor Capital 88
77 Kennedy Park Renewals 8
247 Capital Expenditure 201

Page 76 Napier City Council Annual Report 2007/08
PLANNING AND REGULATORY
Activities
These activities are legislative requirements except parking. The Planning and Regulatory Group comprises:
City Development Planning
City Development Planning manages the development of the natural and built environment of Napier, via the District Plan, under the Resource Management Act 1991 in a sustainable manner, ensuring the quality and quantity of the City’s resources are maintained and enhanced.
Regulatory Consents
Council ensures that development of the City is within the Resource Management Act 1991 and the policies of the District Plan through Regulatory Consents. This includes processing non-notified Resource Consents and Land Information Memorandum, preparing resource applications for land sub-divisions and an annual environmental programme to gauge the effectiveness of Council’s environmental management policies. Also covered is enforcement work to ensure compliance with Resource Consent approvals and the operative District Plans.
Building Consents
The Council ensures that building development within the City is in accordance with the Building Act 2004 through the process of the Building Consents. Services include counter advisory service, processing building consent applications, providing codes of compliance and building warrants of fi tness, and investigating complaints.
Environmental Health
Council deals with the environmental problems of noise, smoke, smell and refuse pollution through its Environmental Health Services through investigation and enforcement under a range of Acts. Licences are processed and premises inspected for food premises, hairdressers, offensive trades, camping grounds, skin piercing, mobile shops, funeral directors and street occupation. Also covered is the administration of matters relating to the Sale of Liquor Act, monitoring compliance with household swimming pool regulations, and investigations and advice on environmental and any other health matters and nuisances such as vermin, pests and fi re hazards.
Animal Control
Animal Control ensures that all animals within the city are under proper control. Dogs are the primary animal and these must all be registered. Emphasis is placed on responsible dog ownership, education and classifi cation of dogs and owners in line with the provisions of the Dog Control Act 1996.
Parking
• Public Parking Spaces: CBD - 3,159, Taradale - 728
Parking areas are provided in the Central Business District and Taradale Shopping Centre as well as the smaller commercial areas of the City with long and short term spaces providing parking to meet reasonable public expectations. In addition to fees from parking meters, car park ticket machines and leased spaces, parking is funded through a levy on rates on commercial and retail properties in Napier and Taradale and other smaller suburban shopping and commercial areas. Monitoring and enforcement of parking bylaws ensures equitable use.
Key Issues
Significant Acquisitions or Replacement of AssetsNew Offstreet Carpark Taradale• Preliminary investigation work is still being carried out. Unspent budget will be carried forward.
Taradale Redevelopment• The 2006 LTCCP included a Taradale shopping centre renewal upgrade budget of $2.3 million in the 2006/07 and 2007/08 years. Planned works include street works ($1.8m) and cross linkages ($0.5m). To date a cross link from the Lee road car park into the shopping centre has been completed at a cost of $352,000.
Additional CBD Parking• Providing additional CBD parking is ongoing and in 2007/08 Council purchased a property adjoining the Herschell Street car park.

Page 77Napier City Council Annual Report 2007/08
Planning and Regulatory
Performance Targets for 2007/08
Performance Measures Results
City Development Planning
1. Review Council’s Strategic Policy DocumentsTarget: Report as required
Situation Analysis Report (April 2008) has been • completed on the Urban Growth Strategy.Urban design assessment has been completed on the • British American Tobacco Site, AhuririTe Awa Structure Plan Scoping Study is underway.• Taradale Town Centre alleyway enhancement project • has been completed.A review of inner city signage is underway. •
2. Process any District Plan modifi cations within legislative requirementsTarget: 100% within 2 years
Four separate plan modifi cations have been notifi ed over the last year but have not yet been referred to Council for decisions on submissions:
Business park• Large Format Retail Zone• Mobile footpath signs• Residential activities in industrial Zones•
2007/08 is the fi rst of the two years.
3. Residents Satisfaction rating in the NRB Public Opinion SurveyTarget: 60%
The NRB Survey carried out in July 2008 showed 61% resident satisfaction with Town Planning.
Very Satisfi ed 14%Fairly Satisfi ed 47%Not Very Satisfi ed 8%Don’t Know 31%
4. Report any additions to heritage inventory of heritage studies completedTarget: Report as required
Heritage assessments on inner city heritage buildings • are currently underway.A conservation plan for the National Tobacco Company • Ltd has been completed.Heritage assessments of all bond stores and offi ces on • the British American Tobacco Company site in Ahuriri (Parts I & II) have been completed.Heritage assessment of the Paxie Building has been • completed.Cultural Heritage Assessment on the Former Soldiers • Club 39 marine parade has been completed.
5. Report on consultation for District Plan modifi cations - who was consulted and on what issues prior to formal notifi cation Target: Report as required
Te Awa Structure Plan has involved consultation • with statutory authorities, network utility operators, landowners, developers and adjacent residents on all infrastructural issues associated with developing a structure plan for the Te Awa area.Inner City Signage review has involved consultation with • a wide range of stakeholders including, NZHPT, Art Deco Trust, Inner City Marketing, Sign writers Association, property owners and all inner city businesses on options for managing inner city signage.Urban Growth Review involved consultation with real • estate industry, valuers, and large residential property developers on residential trends since 1999 and likely future trends.
6. Positive Outcomes in the state of the Environment report for Napier City Target: Report as required
No specifi c state of the Environment reporting has occurred over the last year although all plan changes require a Section 32 (cost/benefi t) analysis to be undertaken which involves comparative analysis between the existing situation and options for change.

Page 78 Napier City Council Annual Report 2007/08
Planning and Regulatory
Performance Measures Results
City Development Planning (continued)
7. Consistency with other regional/territorial plans Target: Report as required
Council’s submissions on HBRC Coastal Plan have been presented to the HBRC’s Hearing Committee for consideration and decisions are expected within the next month.Plan changes to the Hastings District Plan are monitored as and when they are notifi ed to ensure no inconsistencies or cross boundary issues arise.
Note: The measure "Reduce the number of resource consent applications" included in the LTCCP was not included in the 2007/08 Annual Plan as it does not reflect the actual performance of Council. The number of consents is primarily influenced by variables beyond the control of Council.
Regulatory Consents
1. Percentage of Non-notifi ed and Subdivision Consents processed within 20 working daysTarget: 100%
Not achieved. 89% (272 out of a total of 306) processed within 20 working days.
2. Percentage of Notifi ed Consents processed within 70 working daysTarget: 100%
Not achieved. nil% (none of 3 applications) processed within 70 working days. Timeframes were overrun due to diffi culties in scheduling hearings at a time mutually agreed by applicants and Council.
3. Percentage of Land Information Memoranda processed within 10 working days Target: 100%
100% processed within 10 working days.
4. Residents Satisfaction rating in the Planning Customer Satisfaction SurveyTarget: 60%
The Planning Customer Satisfaction Survey is not an annual survey and was not carried out in 2007/08. Results for NRB survey are included above for City Development Planning.
Building Consents
1. Percentage of Building Consents processed within 20 working daysTarget: 100%
99% (1,310 of 1,323) processed within 20 working days.The target was not achieved.
2. Number of Building Warrant of Fitness (WOF) audited Target: 20%
The target was not achieved. nil% of Building WOFs audited in 2007/08. It is not a legal requirement to audit Building WOF and the target will not be included in future LTCCPs.
Note: The measure "Percentage of Building Consents processed within 10 working days" included in the LTCCP was not included in the 2007/08 Annual Plan as it is no longer applicable.
Environmental Health Services
1. Food and Non-Food Premises inspectedTarget: 100%
100% inspected in 2007/08
2. Number of water samples taken (national standard 100%)Target: 165%
Number of samples taken = 179% of national standard.
3. Residents satisfi ed with Noise Control in the NRB Public Opinion SurveyTarget: 75%
The NRB Survey carried out in July 2008 showed 81% satisfaction for Noise Control.
Very Satisfi ed 33%Fairly Satisfi ed 48%Not Very Satisfi ed 10%Don’t Know 9%

Page 79Napier City Council Annual Report 2007/08
Planning and Regulatory
Performance Measures Results
Animal Control
1. Number of registered dogsTarget: 6,090
6,164 registered dogs as at 30 June 2008 (gross)
2. Complaints actioned within 5 working daysTarget: 100%
99.25% of complaints actioned within 5 working days in 2007/08.The target was not achieved.
3. Resident satisfaction for Dog Control in the NRB public opinion survey Target: 60%
The NRB Survey carried out in July 2008 showed 71% satisfaction for Dog Control.
Very Satisfi ed 28%Fairly Satisfi ed 43%Not Very Satisfi ed 25%Don’t Know 4%
Parking Services
1. Occupancy of CBD Off street parking areasTarget: 85%
48% average over 6 days, 8 am to 4 pm (excluding leased parks). An occupancy rate lower than target is an improvement on the target. Additional parking has been provided in the CBD.
2. Occupancy of Taradale Off street parking areasTarget: 85%
68% average over 5 days, 9 am to 5 pm. An occupancy rate lower than target is an improvement on the target.
3. Occupancy of CBD On street parking areas Target: 85%
61% average over 6 days, 8 am – 4 pm. An occupancy rate lower than target is an improvement on the target.Additional parking has been provided in the CBD.
4. Occupancy of Taradale On street parking areasTarget: 85%
82% (Symons/Gloucester) average over 5 days, 9 am to 5 pm. An occupancy rate lower than target is an improvement on the target.
Note: The targets for the above measures are the upper limit of acceptable occupancy rates.
5. Residents Satisfaction with ‘Parking in the City Centre’ in the NRB Public Opinion SurveyTarget: 60%
The NRB Survey carried out in July 2008 showed 60% satisfaction for Parking in the City Centre.
Very Satisfi ed 17%Fairly Satisfi ed 43%Not Very Satisfi ed 34%Don’t Know 6%
6. Residents Satisfaction with ‘Parking in the Suburbs’ in the NRB Public Opinion SurveyTarget: 75%
The NRB Survey carried out in July 2008 showed 81% satisfaction for Parking in the Suburbs.
Very Satisfi ed 33%Fairly Satisfi ed 48%Not Very Satisfi ed 10%Don’t Know 9%

Page 80 Napier City Council Annual Report 2007/08
Planning and Regulatory
Financial Summary
Budget Actual 07/08 - $000 Actual07/08 Activity Operating Depn Interest Total Income Net Cost 06/07$000 [1] of Service $000
592 City Development Planning 862 5 - 867 2 865 858
556 Regulatory Consents 841 1 - 842 288 554 566
350 Building Consents 1,130 1 - 1,131 871 260 222
287 Environmental Health 458 1 - 459 191 268 347
158 Animal Control 565 4 12 581 426 155 207
(899) Parking Enforcement 1,129 98 20 1,247 2,131 (884) (936)
1,044 Total net operating 4,985 110 32 5,127 3,909 1,218 1,264 620 Capital Expenditure [2] 374 4,448
1,664 Funding Required 1,592 5,712
Funded by1,946 Non Targeted Rates 2,078 2,194
(434) Special Funds (588) 3,368
- Loans - 57
152 Non Funded Depn 102 93
1,664 Total 1,592 5,712
[1] Summary of IncomeActual07/08$000
User Charges 5
Regulatory Revenue 2,350
Rental Income - Other 26
Infringements & Fines 711
Rendering of Services 810
Retail & Product Sales 4
Other Income 3
Total Income 3,909
[2] Capital ExpenditureBudget Actual07/08 07/08$000 $000
Parking 500 New Off-Street Carpark Taradale -
100 Parking Equipment Replacement 62
20 Parking Minor Capital 1
- Additional CBD Parking 311
620 Capital Expenditure 374

Page 81Napier City Council Annual Report 2007/08
ROADING
Activities
The Roading Group comprises:
Roading
• 360 km of roads (100% sealed)• 302.5 km Urban Standard Roads (approx. 10% not
constructed to Council’s current urban standards)• 57.5 km Rural Roads (72% requiring widening to cope
with current traffi c volumes)• 37 km State Highways• 5,416 sumps and manholes to be cleaned • 468 km of kerb and channel to be swept
The city’s road network provides accessibility to Napier residents and visitors within a safe, clean and aesthetic environment. The services cover the installation and maintenance of the physical components; carriageways, footpaths, steps, ramps, traffic and pedestrian bridges and structures, road and amenity lighting, drainage, traffi c services and safety (e.g. street furniture, traffic lights, signage), as well as the planning, management, and amenity and safety maintenance to ensure the system is clean, safe and able to cope with future needs.
Key Issues
Significant Acquisitions or Replacement of AssetsRoading Capital Projects (Bulk Funded)• Major works for 2007/08 were Battery Rd, Hill Rd, Chilton Rd, Angus Place, Willis Toomey Service Lane, Hastings / Tennyson Intersection, Dolbel St, Anderson Rd. Work was slower than anticipated, plus some projects were split over two financial years to maximise subsidy. Unspent budget will be carried forward.
Taradale Shops Upgrade• Whilst most of the infrastructure of the Taradale Shopping Centre was sound and only about 25 years old its style, materials and form were outdated. Work completed in 2007/08 was in Taradale “Light Lane” only. Funding options for remaining work are still being considered. Unspent budget will be carried forward.
Transport Study Projects - Prebensen Drive Project• Prebensen Drive 4 Laning was identified in the Heretaunga Plains Transportation Study 2004 and the extension of Ford Road has been identified as an essential part of this project.Project investigations are continuing and are currently held up by Transit NZ requirements. Unspent budget will be carried forward.
CBD Development• The CBD redevelopment is a mixture of works for transportation capacity reasons and environmental improvements. The aim is to enlarge the core CBD area to encourage wider pedestrian, shopper and business friendly environment.In 2007/08 Stage I of Dickens St was completed and Stage II started. Unspent budget, including budget included in prior years and Council approved budget from outturn surplus, will be carried forward.
Pathway Project• The project of a long distance city circuit pathway is progressing. It incorporates the coastal Rotary Pathway and new pathways to link the existing network around the periphery of the urban area on river banks and on the Taradale Hills. The project is in partnership with the Rotary Pathway Trust and is expected to have a timeframe of at least ten years.The project is funded from external budget from Rotary Pathways Trust and Subsidy.
Roading Renewal• sIn 2007/08 all works were completed within allocated budget.
Roading Vested Assets• Assets vested in Council in 2007/08 were in new development areas such as Te Awa and Parklands.

Page 82 Napier City Council Annual Report 2007/08
Performance Targets for 2007/08
Performance Measures Results
Roading
1. Residents Satisfaction with ‘Footpaths’ in the NRB Public Opinion SurveyTarget: 75%
The NRB Survey carried out in July 2008 showed 81% satisfaction for Footpaths.
Very Satisfied 30%Fairly Satisfied 51%Not Very Satisfied 17%Don’t Know 2%
2. Residents Satisfaction with ‘Roads’ in the NRB Public Opinion SurveyTarget: 85%
The NRB Survey carried out in July 2008 showed 87% satisfaction for Roads.
Very Satisfied 31%Fairly Satisfied 56%Not Very Satisfied 12%Don’t Know 1%
3. Number of Injury Crashes in Napier CityTarget: 140
166 injury crashes in Napier City. The target was not achieved.
4. Average Roughness of Sealed Urban RoadsTarget: 100 National Association of Australian State
Road Authorities (NAASRA) counts per km
Average roughness of sealed urban roads = 104 NAASRA counts per km. The target was not achieved.
5. Maximum deferred capital worksTarget: $42 million
Deferred capital works = $42 million
Roading

Page 83Napier City Council Annual Report 2007/08
Roading
Financial Summary
Budget Actual 07/08 - $000 Actual07/08 Activity Operating Depn Interest Total Income Net Cost 06/07$000 [1] of Service $000
9,748 Roading 5,867 5,372 1,368 12,607 4,026 8,581 9,102
9,748 Total net operating 5,867 5,372 1,368 12,607 4,026 8,581 9,102 11,020 Capital Expenditure [2] 8,950 7,969 20,768 Funding Required 17,531 17,071
Funded by8,493 Non Targeted Rates 12,495 12,247
5,775 Special Funds 1,074 1,859
3,672 Vested Assets 1,789 1,498
1,402 Loans 758 359
1,426 Non Funded Depn 1,415 1,108
20,768 Total 17,531 17,071
[1] Summary of IncomeActual07/08$000
Uniform Annual Charges 174
User Charges 24
Land Transport NZ & other Govt Grants 3,619
Regulatory Revenue 19
Rendering of Services 12
Grants & Donations 178
Total Income 4,026
[2] Capital ExpenditureBudget Actual07/08 07/08$000 $000
Roading1,598 Roading Capital Projects (Bulk Funded) 966
1,150 Taradale Shops Upgrade 351
425 Transportation Proposals 87
600 Transport Study Projects 3
- CBD Development 1,127
- Cycleway Project 617
- Meeanee Road Widening 317
- Roading Minor Capital 105
3,575 Roading Renewals 3,587
3,672 Roading Vested Assets 1,789
11,020 Capital Expenditure 8,950

Page 84 Napier City Council Annual Report 2007/08
WATER AND WASTES
Activities
The Solid Waste Group comprises:
Solid WasteCouncil provides a domestic refuse collection service for both residential and commercial properties within the city as follows:• Residential Properties - once per week• Commercial - Suburban Shops - twice per week• Commercial - Central Business District - three times per
weekA kerbside recycling service for residential properties is provided fortnightly. Litter bins and drums are located throughout the City and serviced on a regular basis. Council’s Refuse Transfer Station, including the greenwaste operation, at Redclyffe accepts most domestic, garden and building waste. Currently Napier disposes of approximately 28,000 tonnes of refuse annually at the landfill from domestic collection, litter bins and the Transfer Station.Omarunui Landfill is the final disposal point for waste generated by the combined populations of Hastings District and Napier City. It is jointly owned by both the Hastings District and Napier City Councils and is managed on a day to day basis by the Hastings District Council.
Stormwater
• 208 km Stormwater Mains• 58 km Open Drains• 11 Pump Stations (Napier City Council and Hawke’s Bay
Regional Council managed)
Council provides and maintains a stormwater disposal system for the 13 separate drainage areas or catchments in
the city with the aim to minimise the effects of flooding. The system, serving approximately 97% of the city population, consists of open drains, stormwater mains and pump stations with about 75% of the city reliant on pumped systems for stormwater drainage.
Wastewater
• 44 Pump Stations• 363 km Wastewater Mains• Milliscreen Plant (Awatoto)• 1,607 m Marine Outfall • 93% of Napier’s Population Serviced By Reticulation
SystemCouncil provides a safe domestic and industrial sewage collection, screening and disposal system to maintain the community’s health. Properties are currently connecting to Stage 1 of the Bay View system.
Water Supply
• 9.7 million m3 Water Consumed Annually• 10 Wells • 10 Ground Water and 8 Booster Pump Stations• 8 Reservoir Sites• 28 million litres Storage Facilities• 453 km Mains• 95.5% of Napier’s Population Serviced By Reticulation
SystemCouncil provides a Water Supply system for the supply of potable water as well as for fire fighting purposes. Water is drawn from the Heretaunga Plains aquifer, is free from harmful contamination and no water treatment is required, and reticulated to the Napier urban area and to Bay View. Council has a programme in place to manage the usage of water, a precious natural resource, to minimise wastage and shortages.

Page 85Napier City Council Annual Report 2007/08
Key Issues
Significant Acquisitions or Replacement of AssetsOmarunui Valley D• The development of the Omarunui Regional Landfill is on ongoing project and a key component of the City’s Waste Management Plan.Development of Valley D Stage 1 is complete and Stage 2 is under construction. Substantial progress was made with the installation of a gas collection system. A new flare was also commissioned. This amount represents Napier City Council’s share (36.32%) of the year’s capital investment at Omarunui Landfill.
Stormwater Vested Assets• Assets vested in Council in 2007/08 were in new development areas such as Te Awa and Parklands.
Upgrading Stormwater Catchments• In 2007/08 the major upgrading works were Anderson Road, Dunlop St, Battery / Hyderabad / Nurses
Cross Country Drain and Pumping Station• Construction of the Cross Country Drain and Pump Station. Costs incurred in 2007/08 relate to purchase of materials and construction of the pump station.
Wastewater Renewals• The major renewal works for 2007/08 were Battery Road, Dickens Street Stage 1 and Pandora Road. Unspent budget is carried forward for future works.
Water and Waste
Wasterwater Vested Assets• Assets vested in Council in 2007/08 were in new development areas such as Te Awa and Parklands.
Taradale Road Sewage Pump Station and Main• The Taradale Road Pump Station and Main will provide emergency backup for the principal wastewater pumping stations at Latham Street and Greenmeadows. It will also cater for growth in the North Western part of the City.Work completed in 2007/08 was the construction of the portion of the pipeline under the Cross Country Drain and preliminary design costs for the scheme. Unspent budget will be carried forward.
Advanced Wastewater Treatment• The Advanced Wastewater Treatment project, with an estimated total budget of over $26 million, has been in planning and development for many years. Expenditure was incurred for an extension to the industrial effluent scheme, construction of a Biological Trickling Filter Plant, professional services costs and monitoring costs related to the preparation of a resource consent application to discharge BTF treated effluent. Unspent budget will be carried forward.
Water Supply Pipe Renewal• The major Water renewal works for 2007/08 were Anderson Road water main replacement, Battery Road 150mm water main replacement and Herschell Street 100mm water main replacement. Unspent budget is carried forward for future works.

Page 86 Napier City Council Annual Report 2007/08
Water and Wastes
Performance Targets for 2007/08
Performance Measures Results
Solid Waste
1. Total waste to landfill Target: 30,000 tonnes
27,825 tonnes for 2007/08. A reduction to the target is an improvement on the target.
2. Waste to landfill per capitaTarget: 523 Kg
486 Kg per capita for 2007/08. A reduction to the target is an improvement on the target.
3. Refuse diversion rateTarget: 17%
18.8% diversion rate for 2007/08
4. Compliance with requirements of resource consentsTarget: 100%
100% compliance for 2007/08
5. Number of recycling stations Target: 2
2 recycling stations
Stormwater
1. Residents Satisfaction with ‘Stormwater’ in the NRB Public Opinion SurveyTarget: 85%
The NRB Survey carried out in July 2008 showed 90% resident satisfaction with Stormwater.
Very Satisfied 34%Fairly Satisfied 56%Not Very Satisfied 7%Don’t Know 3%
2. Compliance with requirements of resource consentsTarget: 100%
100% compliance for 2007/08
3. Pumping capacity availableTarget: 95%
99.9% pumping capacity available
Wastewater
1. Percentage of urban main residential and rural settlement population served by reticulated systemTarget: Reticulated system - 93.3%
Main Res and Rural - 96.9%
Reticulated system - 93.3% Main Res and Rural - 96.9%
2. Residents Satisfaction with ‘Wastewater’ in the NRB Public Opinion SurveyTarget: 75%
The NRB Survey carried out in July 2008 showed 89% resident satisfaction with Wastewater.
Very Satisfied 35%Fairly Satisfied 54%Not Very Satisfied 5%Don’t Know 6%
3. Compliance with requirements of resource consentsTarget: 100%
100% compliance for 2007/08

Page 87Napier City Council Annual Report 2007/08
Water and Wastes
Performance Measures Results
Water Supply
1. Residents Satisfaction with Water Supply in the NRB Public Opinion SurveyTarget: 90%
The NRB Survey carried out in July 2008 showed 94% resident satisfaction with Water Supply.
Very Satisfi ed 49%Fairly Satisfi ed 45%Not Very Satisfi ed 3%Don’t Know 3%
2. Compliance with Resource Consent requirementsTarget: 100%
Target not achieved. Although the total water take for Napier was well within consented limits the weekly water take at the Riverside Park pump station exceeded the consented take by up to 7% for a period of 6 months.
3. Compliance with Drinking Water standardsTarget: 100%
100% compliance for 2007/08. A transgression occurred in the Taradale distribution zone during the fi rst quarter but this was within the parameters of the Drinking Water standards which require 95% compliance 95% of the time.
4. Percentage Distribution Mains CleanedTarget: 20%
29% of mains cleaned in 2007/08. More than 20% was cleaned to offset the 2006/07 fi nancial year’s shortfall.

Page 88 Napier City Council Annual Report 2007/08
Water and Wastes
Financial Summary
Budget Actual 07/08 - $000 Actual07/08 Activity Operating Depn Interest Total Income Net Cost 06/07$000 [1] of Service $000
748 Solid Waste 4,661 42 95 4,798 3,935 863 (108)
2,854 Stormwater 1,146 1,072 213 2,431 38 2,393 2,512
(916) Wastewater 2,466 3,068 283 5,817 6,846 (1,029) (1,648)
(1) Water Supply 2,116 1,079 114 3,309 3,588 (279) (13)
2,685 Total net operating 10,389 5,261 705 16,355 14,407 1,948 743 12,918 Capital Expenditure [2] 9,480 8,746 15,603 Funding Required 11,428 9,489
Funded by2,235 Non Targeted Rates 2,111 1,894
7,371 Special Funds 6,707 3,416
1,261 Vested Assets 2,567 1,491
4,541 Loans - 2,645
195 Non Funded Depn 42 43
15,603 Total 11,428 9,489
[1] Summary of IncomeActual07/08$000
Uniform Annual Charges 10,696
User Charges 2,018
Rental Income - Other 59
Omarunui Landfi ll Joint Venture 1,407
Other Income 11
Financial & Development Contributions - other 216
Total Income 14,407

Page 89Napier City Council Annual Report 2007/08
Water and Wastes
[2] Capital ExpenditureBudget Actual07/08 07/08$000 $000
Solid Waste- Omarunui Regional Landfi ll Site Development Valley A 104
59 Omarunui Regional Landfi ll Site Development Valley B 13
1,304 Omarunui Regional Landfi ll Site Development Valley D 1,683
319 Omarunui Dev Gas to Energy -
- Minor Capital Items 1
66 Solid Waste Renewals 45
Stormwater2,820 Cross Country Drain and Pumping Station 2,194
770 Upgrading Stormwater Catchments 832
119 Saltwater Creek Culvert Dupln 1
62 Dalton St Pump Replacement -
12 Georges Drive Drain -
- Stormwater Minor Capital 2
336 Stormwater Renewals 52
453 Stormwater Vested Assets 1,190
Wastewater1,181 Taradale Rd Sewage Pump Station and Main 83
58 Western Pumping Main 1
2,564 Advanced Wastewater Treatment 289
- Wastewataer Minor Capital 3
857 Wastewater Renewals 511
219 Milliscreen Replacement Programme 148
198 Wastewater Pumping Equipment Renewals 330
586 Wastewater Vested Assets 885
Water Supply- Trunk Main Ulyatt Road to Bledisloe Avenue 258
- Water Supply Minor Capital 103
520 IAR Pipes 174
69 IAR Pump Stations 71
19 IAR Water Meters 13
105 Capital Upgrade Associated wit 2
222 Water Supply Vested Assets 492
12,918 Capital Expenditure 9,480

Page 90 Napier City Council Annual Report 2007/08
PROPERTY ASSETS
Activities
The Property Assets Group comprises:
Lagoon Farm
The 350 hectare farm is situated on the south side of the Ahuriri Estuary. It currently runs cattle, sheep, and has some Kiwi Fruit plantings and cropping leases. A quarter acts as a flood ponding area during unusual and extreme weather events. The area of farm has been reduced for the development of Parklands and the extension of Prebensen Drive.
Parklands Residential Development
The Council’s Parklands Residential Development on 120 hectares of former Lagoon Farm land will provide up to 800 residential sections and includes land for sportsgrounds.
Property Holdings
Leasehold Properties:
• Commercial 83• Residential 72
This business unit is responsible for the management of leases and licences which have been established for parks, reserves, commercial, industrial and residential properties. The majority of leases are perpetually renewable.
It is also responsible for the management, including maintenance and renewal, of all Council buildings not specifically allocated to other activities.
Key Issues
Parklands
The overall Parklands project is ahead of schedule. The slowing economy will impact on the rate of development in the coming year.

Page 91Napier City Council Annual Report 2007/08
Property Assets
Performance Targets for 2007/08
Performance Measures Results
Lagoon Farm
Performance measures not set as this activity is not providing a public service.
Parklands Residential Development
1. Number of new lots createdTarget: 90
66 new lots created 2007/08. The target was not achieved. An additional sixteen lots are awaiting title.
Property Holdings
1. Leases renewed within the statutory time frame as specifi ed in the individual registered lease documentsTarget: 100%
Five leases fell due for renewal during 2007/08. One has been renewed and four are under action with the proposed rental in dispute. The target was not achieved.
2. Occupancy rate of Council owned commercial buildings subject to availability of letable space and market demand and conditionsTarget: 100%
All buildings occupied.
3. Buildings maintained to a satisfactory level and complying with the Building Act and Health and Safety ActTarget: 100%
All buildings maintained and comply with Building Act and Health and Safety Act.
4. Freeholding of leasehold properties facilitated in accordance with Council’s freeholding policyTarget: 100%
Six freeholding in 2007/08, all in accordance with Council freeholding policy.

Page 92 Napier City Council Annual Report 2007/08
Property Assets
Financial Summary
Budget07/08
Actual 07/08 - $000 Actual06/07Activity Operating Depn Interest Total Income Net Cost
$000 [1] of Service $000
75 Lagoon Farm 498 20 - 518 540 (22) 210
(2,297) Parklands Residential Development * 7,701 1 - 7,702 8,791 (1,089) (3,599)
(1,193) Property Holdings (728) 345 262 (121) 2,450 (2,571) (1,396)
(3,415) Total net operating 7,471 366 262 8,099 11,781 (3,682) (4,785)100 Capital Expenditure [2] 32 220
(3,315) Funding Required (3,650) (4,565)
Funded by(770) Non Targeted Rates (1,190) (935)
(2,653) Special Funds (2,613) (3,993)
- Loans * - 220
108 Non Funded Depn 153 143
(3,315) Total (3,650) (4,565)
[1] Summary of IncomeActual07/08$000
User Charges 20
Rental Income - Investment Property 1,008
Rental Income - Other 1,074
Retail & Product Sales 290
Sales Residential Development 8,782
Other Income 31
Fair value Gain/Loss on revaluation of investment properties 501
Fair value gain/loss on livestock 75
Total Income 11,781
[2] Capital ExpenditureBudget07/08$000
Actual07/08$000
Parklands Residential Development- Parklands Residential Development 27
Property Holdings100 Civic Building and Library Air Conditioning 2
- Civic Building Minor Capital 3
100 Capital Expenditure 32
Notes (*): Net cost of service for Parklands refl ects lower section sales. See page 64 for comments on Redevelopment of HB Museum and Art Gallery Buildings
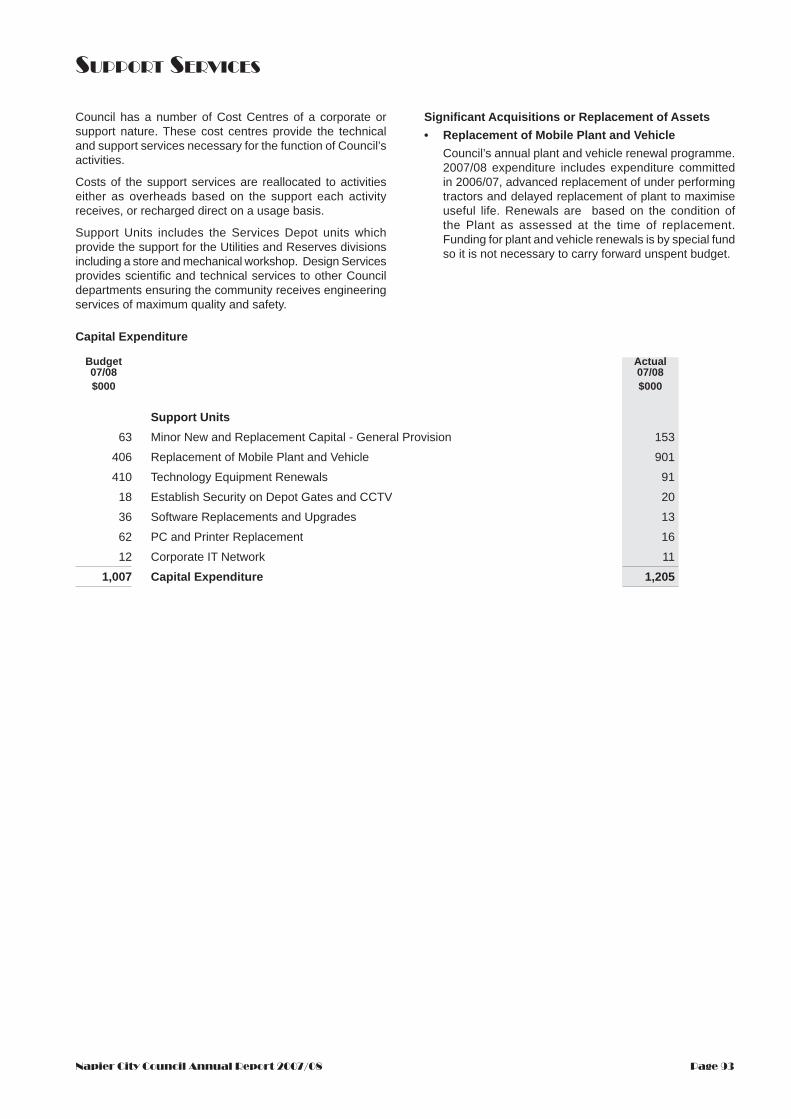
Page 93Napier City Council Annual Report 2007/08
SUPPORT SERVICES
Council has a number of Cost Centres of a corporate or support nature. These cost centres provide the technical and support services necessary for the function of Council’s activities.
Costs of the support services are reallocated to activities either as overheads based on the support each activity receives, or recharged direct on a usage basis.
Support Units includes the Services Depot units which provide the support for the Utilities and Reserves divisions including a store and mechanical workshop. Design Services provides scientific and technical services to other Council departments ensuring the community receives engineering services of maximum quality and safety.
Significant Acquisitions or Replacement of AssetsReplacement of Mobile Plant and Vehicle• Council’s annual plant and vehicle renewal programme.2007/08 expenditure includes expenditure committed in 2006/07, advanced replacement of under performing tractors and delayed replacement of plant to maximise useful life. Renewals are based on the condition of the Plant as assessed at the time of replacement. Funding for plant and vehicle renewals is by special fund so it is not necessary to carry forward unspent budget.
Capital Expenditure
Budget Actual07/08 07/08$000 $000
Support Units63 Minor New and Replacement Capital - General Provision 153
406 Replacement of Mobile Plant and Vehicle 901
410 Technology Equipment Renewals 91
18 Establish Security on Depot Gates and CCTV 20
36 Software Replacements and Upgrades 13
62 PC and Printer Replacement 16
12 Corporate IT Network 11
1,007 Capital Expenditure 1,205

Page 94 Napier City Council Annual Report 2007/08
Glossary of Terms
Activities and Activity GroupsThe main elements of the Council’s services offered to the Napier community are divided into Activities. These Activities are described in detail in the Activity Groups section of the Plan including the performance measures and targets and the financial budgets for 2007/08.
Allocation of OverheadsThe Council’s support units provide “internal” or “support” services to the service delivery business units. The costs of these internal services are allocated across the other business units either as “overheads” based on the support each output receives or recharged directly on a usage basis. This ensures that the true cost of providing specific services to the public is reflected in all budget figures.
Carrying Amount The net amount at which an asset or liability is recognised in the balance sheet.
Community OutcomesThese are goals determined by the community that it believes are important for its present and future economic, social, cultural and environmental well-being.
Council Controlled OrganisationsOrganisations in which one or more local authorities control 50 per cent or more of the voting rights or have the right to appoint 50 per cent or more of the directors.
Derecognition When an asset value is no longer recorded in the balance sheet it has been derecognised e.g. when an asset is sold it is no longer recorded on the balance sheet as from the date of the sale.
Derivative A financial instrument that has the effect of transferring between two or more parties to the instrument one or more risks inherent in an underlying asset. The value of the derivative is determined by fluctuations in the underlying asset. The most common underlying assets include currencies, interest rates, shares, bonds, commodities and market indexes.
Financial ContributionsThe share of the cost of new developments and subdivisions met by developers.
Impairment The amount by which the carrying amount of an asset exceeds its recoverable amount.
Infrastructural AssetsStationary systems forming a network and serving whole communities, where the system as a whole is intended to be maintained indefinitely at a particular level of service potential by the continuing replacement and refurbishment of its components. The network may include normally recognised ordinary assets as components. These include roads, water, sewerage and stormwater systems.
Infrastructural Asset RenewalA statutory requirement to provide for maintenance of infrastructural assets in serviceable condition in perpetuity. The amount required is calculated from asset management plans, and “smoothed” to provide a relatively even flow of funds from year to year.
Levels of ServiceA measure of the quality and quantity of services delivered. They are determined by customer expectations, legislative requirements and affordability.
Non Targeted RateRates other than targeted rates. These are general rates and Uniform Annual General Charges. These fund a wide range of activities that are considered to be of general benefit to the community.
NRB Customer Satisfaction Survey (CommunitrakTM)A wide ranging customer satisfaction survey prepared for the Napier City Council by the National Research Bureau Ltd. The survey is of public perceptions and interpretations of Council services and representation with comparisons to National and Peer Group averages.
Prospective Financial StatementsRefers to future-oriented financial statements.
Restricted AssetsThose assets which cannot be disposed of because of legal or other restrictions and that provide a benefit or service to the community. These include reserves vested under the Reserves Act and endowments or other property held in trust for specific purposes.
Targeted RateA rate set under section 16 or 19 of the Local Government (Rating) Act 2002 to fund a specific function or service provided. It may be charged as a fixed dollar amount per rating unit, a fixed charge per factor, such as property value, or a differential charge per factor.