issn 0219-3213 2017 no. 10 - home - iseas-yusof ishak ... (002).pdf · issn 0219-3213. 2017. no....
TRANSCRIPT

ISSN 0219-3213
2017 no. 10Trends inSoutheast Asia
THE INDONESIA NATIONAL SURVEY PROJECT: ECONOMY, SOCIETY AND POLITICS
DIEGO FOSSATI, HUI YEW-FOONG AND SIWAGE DHARMA NEGARA
30 Heng Mui Keng TerraceSingapore 119614http://bookshop.iseas.edu.sg
TRS10/17s
7 8 9 8 1 4 7 8 6 4 6 19
ISBN 978-981-4786-46-1

Trends in Southeast Asia
17-J02520 01 Trends_2017-10.indd 1 25/8/17 10:16 AM
The ISEAS – Yusof Ishak Institute (formerly Institute of Southeast Asian Studies) is an autonomous organization established in 1968. It is a regional centre dedicated to the study of socio-political, security, and economic trends and developments in Southeast Asia and its wider geostrategic and economic environment. The Institute’s research programmes are grouped under Regional Economic Studies (RES), Regional Strategic and Political Studies (RSPS), and Regional Social and Cultural Studies (RSCS). The Institute is also home to the ASEAN Studies Centre (ASC), the Nalanda-Sriwijaya Centre (NSC) and the Singapore APEC Study Centre.
ISEAS Publishing, an established academic press, has issued more than 2,000 books and journals. It is the largest scholarly publisher of research about Southeast Asia from within the region. ISEAS Publishing works with many other academic and trade publishers and distributors to disseminate important research and analyses from and about Southeast Asia to the rest of the world.
17-J02520 01 Trends_2017-10.indd 2 25/8/17 10:16 AM

2017 no. 10Trends inSoutheast Asia
THE INDONESIA NATIONAL SURVEY PROJECT: ECONOMY, SOCIETY AND POLITICS
DIEGO FOSSATI, HUI YEW-FOONG AND SIWAGE DHARMA NEGARA
17-J02520 01 Trends_2017-10.indd 3 25/8/17 10:16 AM

Published by: ISEAS Publishing 30 Heng Mui Keng Terrace Singapore 119614 [email protected] http://bookshop.iseas.edu.sg
© 2017 ISEAS – Yusof Ishak Institute, Singapore
All rights reserved. No part of this publication may be reproduced, stored in a retrieval system, or transmitted in any form, or by any means, electronic, mechanical, photocopying, recording or otherwise, without prior permission.
The author is wholly responsible for the views expressed in this book which do not necessarily reflect those of the publisher.
ISEAS Library Cataloguing-in-Publication Data
Fossati, Diego.The Indonesia National Survey Project : Economy, Society and Politics.
(Trends in Southeast Asia, 0219-3213 ; TRS 10/17)1. Indonesia—Economic conditions.2. Indonesia—Social conditions.3. Indonesia—Politics and government.I. Title.II. Hui, Yew-Foong.III. Negara, Siwage Dharma.IV. Series: Trends in Southeast Asia ; TRS 10/17.
DS501 I59T no.10 (2017) September 2017
ISBN 978-981-4786-46-1 (soft cover)ISBN 978-981-4786-47-8 (e-book, PDF)
Typeset by Superskill Graphics Pte LtdPrinted in Singapore by Mainland Press Pte Ltd
17-J02520 01 Trends_2017-10.indd 4 25/8/17 10:16 AM

FOREWORD
The economic, political, strategic and cultural dynamism in Southeast Asia has gained added relevance in recent years with the spectacular rise of giant economies in East and South Asia. This has drawn greater attention to the region and to the enhanced role it now plays in international relations and global economics.
The sustained effort made by Southeast Asian nations since 1967 towards a peaceful and gradual integration of their economies has had indubitable success, and perhaps as a consequence of this, most of these countries are undergoing deep political and social changes domestically and are constructing innovative solutions to meet new international challenges. Big Power tensions continue to be played out in the neighbourhood despite the tradition of neutrality exercised by the Association of Southeast Asian Nations (ASEAN).
The Trends in Southeast Asia series acts as a platform for serious analyses by selected authors who are experts in their fields. It is aimed at encouraging policy makers and scholars to contemplate the diversity and dynamism of this exciting region.
THE EDITORS
Series Chairman:Tan Chin Tiong
Series Editor:Ooi Kee Beng
Editorial Committee:Su-Ann OhDaljit SinghFrancis E. HutchinsonBenjamin Loh
17-J02520 01 Trends_2017-10.indd 5 25/8/17 10:16 AM

TABLE OF CONTENTS
List of Figures and Tables .....................................................................viiExecutive Summary ................................................................................ ix
1. Introduction ....................................................................................... 1 1.1 Background of the Study ........................................................... 1 1.2 Survey Methodology ................................................................. 2 1.3 Purpose and Structure ................................................................ 3
2. Economy ............................................................................................ 4 2.1 Evaluation of the Economy ....................................................... 4 2.2 Economic Policy ....................................................................... 8 2.3 Infrastructure Policy .................................................................. 9 2.4 Role of Government in the Economy ...................................... 13 2.5 Internet and E-commerce ........................................................ 13
3. Society ............................................................................................. 16 3.1 Islamic Practices ...................................................................... 16 3.2 Islam in Society and Politics ................................................... 23 3.3 Chinese Indonesians ................................................................ 24
4. Politics ............................................................................................. 27 4.1 Approval Rating of President Widodo .................................... 27 4.2 Trust in Institutions and Satisfaction with Democracy ........... 29 4.3 Decentralization....................................................................... 31 4.4 Political Participation .............................................................. 35 4.5 National Identity ...................................................................... 37 4.6 Globalization and International Relations ............................... 37
5. Conclusion ....................................................................................... 47
17-J02520 01 Trends_2017-10.indd 6 25/8/17 10:16 AM

LIST OF FIGURES AND TABLES
Figure 1. Evaluation of economic condition (country).................................... 5 2. Evaluation of economic condition (household) ............................... 6 3. Evaluation of household economic condition by location,
education and income ....................................................................... 7 4. Compared with the SBY years, has the economy improved
since Joko Widodo took office? ....................................................... 8 5. On whether it is easier to find a job, by gender, location,
education and income ..................................................................... 10 6. Satisfaction with government performance on infrastructure,
by location ...................................................................................... 11 7. What kind of infrastructure should be a priority? .......................... 12 8. Main obstacles to develop infrastructure in Indonesia ................... 13 9. Most important issues/problems facing Indonesia today ............... 1410. Role of government in the economy .............................................. 1411. Internet usage by gender, location, education and income ............ 1512. Cell phone ownership by gender, location, education
and income ..................................................................................... 1713. How important is it for a Muslim to go to haj? .............................. 1814. Should all Muslim women wear hijab? ......................................... 1915. Do you personally wear hijab? (women respondents only) ........... 2016. Would there be any benefits to implementing shariah law? ........... 2117. What is the most important challenge facing Islam
in Indonesia? .................................................................................. 2218. Do you usually buy Islamic products and services from the
following categories? ..................................................................... 2319. Stereotypes of Chinese Indonesians: Privileged ............................ 2520. Stereotypes of Chinese Indonesians: Influence .............................. 2621. Stereotypes of Chinese Indonesians: Exclusiveness ..................... 2622. Are you comfortable with a Chinese Indonesian in a position
of political leadership? ................................................................... 28
17-J02520 01 Trends_2017-10.indd 7 25/8/17 10:16 AM
Figure23. Views of Chinese Indonesians as political leaders,
by ethnic group ............................................................................... 2924. President’s approval rating by gender, location, education
and income ..................................................................................... 3025. Trust in institutions in Indonesia .................................................... 3126. On democracy ................................................................................ 3227. On pluralism ................................................................................... 3328. Disagreement with statement “The rights of ethnic and
religious minorities are protected in Indonesia”, by ethnic and religious group ......................................................................... 33
29. Support for decentralized governance, by location and region ...... 3430. What level of government should have most powers?
Results by location and region ....................................................... 3531. Political participation ..................................................................... 3632. Organization membership .............................................................. 3733. Are you interested in politics? Results by gender, location,
education and income ..................................................................... 3834. Attachment to national identity ...................................................... 3935. Support for globalization................................................................ 3936. Perceptions of countries and ASEAN ............................................ 4037. Positive perceptions of the impact of China on neighbouring
countries, by ethnic group .............................................................. 4238. How much will Indonesia benefit by having close economic
ties with China? Results by location and income........................... 4239. Share of respondents thinking Indonesia benefits “a lot”
from close economic ties with China, by ethnic group ................. 4340. Attitudes over Chinese immigration. Chinese workers
should… ....................................................................................... 4441. What do you think about Chinese investment in
strategic sectors? ............................................................................ 4542. How should Indonesia handle the South China Sea issue? ............ 4543. What’s your opinion on recent incidents in the Natuna Sea? ......... 46
Table1. The Role of Islam ............................................................................ 24
17-J02520 01 Trends_2017-10.indd 8 25/8/17 10:16 AM

The Indonesia National Survey Project: Economy, Society and Politics
By Diego Fossati, Hui Yew-Foong and Siwage Dharma Negara
EXECUTIVE SUMMARY• The ISEAS – Yusof Ishak Institute commissioned a nationwide
survey in Indonesia, called the Indonesia National Survey Project (INSP) to enhance understanding of economic, social, and political developments in Indonesia.
• President Joko Widodo’s approval rating hovers at around 68 per cent, and respondents generally think that the President has made improvements to the economy, although there are concerns with the price of necessities and job-seeking prospects. The Widodo administration scores well in infrastructure development, which is its signature policy thrust. Roads, education and electricity supply remain the top priorities for respondents, while corruption is still considered the most important problem facing Indonesia today.
• Some key issues that have emerged during the Jakarta gubernatorial election, such as punishing blasphemy against Islam and voting a Muslim leader into office, receive significantly high support from respondents, suggesting that these issues have currency beyond Jakarta and the election.
• On the political front, state institutions, especially the Army, are more highly trusted than politicians. Key elements of Indonesia’s political infrastructure, such as democracy, Pancasila, and decentralization are supported by an overwhelming majority of respondents.
• Indonesians identify strongly with Indonesia and consider traditional economic partners such as Malaysia, Japan, Singapore and ASEAN to be most important for Indonesia.
17-J02520 01 Trends_2017-10.indd 9 25/8/17 10:16 AM

17-J02520 01 Trends_2017-10.indd 10 25/8/17 10:16 AM

1
1 Diego Fossati is Associate Fellow at the ISEAS – Yusof Ishak Institute and Research Fellow, Griffith Asia Institute, Griffith University; Hui Yew-Foong is Senior Fellow at the ISEAS – Yusof Ishak Institute and Associate Professor, Hong Kong Shue Yan University; and Siwage Dharma Negara is Fellow at the ISEAS – Yusof Ishak Institute.2 World Bank, Indonesia Economic Quarterly: Upgraded, June 2017.
The Indonesia National Survey Project: Economy, Society and Politics
By Diego Fossati, Hui Yew-Foong and Siwage Dharma Negara1
1. INTRODUCTION1.1 Background of the Study
The Indonesian economy, society, and politics have been undergoing a number of crucial developments that may shape the country’s future trajectory in important ways. The economy, although still crippled by sluggish global economic expansion, has proven to be resilient to the slump in commodity prices, and the current administration has ambitious plans to expand infrastructure and promote a more open and investment-friendly economic environment.2
In the social and cultural realm, Indonesia is facing seemingly contradictory developments. On the one hand, there is a resurgence of anti-liberal sentiments, ranging from a growth of conservative Islam in some social sectors to increased animosity towards immigrants and ethno-religious minorities. On the other hand, civil society organizations are becoming more assertive, and they play a more influential role in shaping policy direction.
In politics, the process of democratic consolidation continues without substantial setbacks, despite unfortunate continuities with the past such
17-J02520 01 Trends_2017-10.indd 1 25/8/17 10:16 AM
2
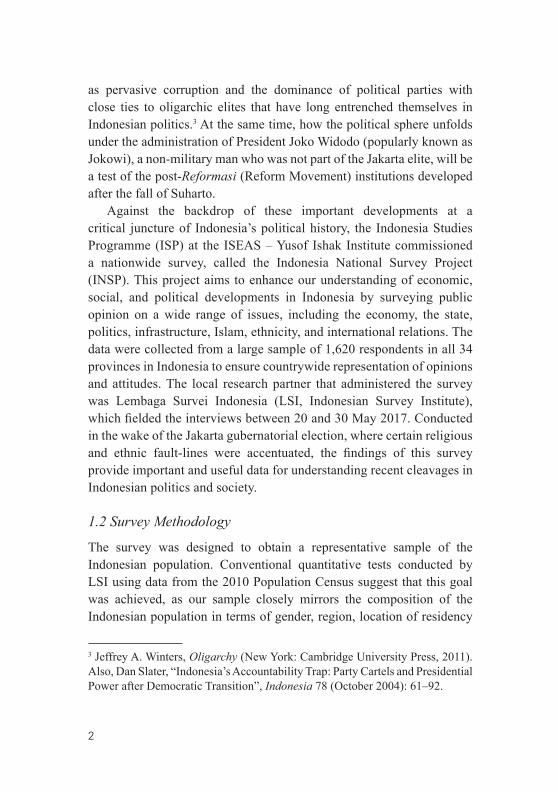
as pervasive corruption and the dominance of political parties with close ties to oligarchic elites that have long entrenched themselves in Indonesian politics.3 At the same time, how the political sphere unfolds under the administration of President Joko Widodo (popularly known as Jokowi), a non-military man who was not part of the Jakarta elite, will be a test of the post-Reformasi (Reform Movement) institutions developed after the fall of Suharto.
Against the backdrop of these important developments at a critical juncture of Indonesia’s political history, the Indonesia Studies Programme (ISP) at the ISEAS – Yusof Ishak Institute commissioned a nationwide survey, called the Indonesia National Survey Project (INSP). This project aims to enhance our understanding of economic, social, and political developments in Indonesia by surveying public opinion on a wide range of issues, including the economy, the state, politics, infrastructure, Islam, ethnicity, and international relations. The data were collected from a large sample of 1,620 respondents in all 34 provinces in Indonesia to ensure countrywide representation of opinions and attitudes. The local research partner that administered the survey was Lembaga Survei Indonesia (LSI, Indonesian Survey Institute), which fielded the interviews between 20 and 30 May 2017. Conducted in the wake of the Jakarta gubernatorial election, where certain religious and ethnic fault-lines were accentuated, the findings of this survey provide important and useful data for understanding recent cleavages in Indonesian politics and society.
1.2 Survey Methodology
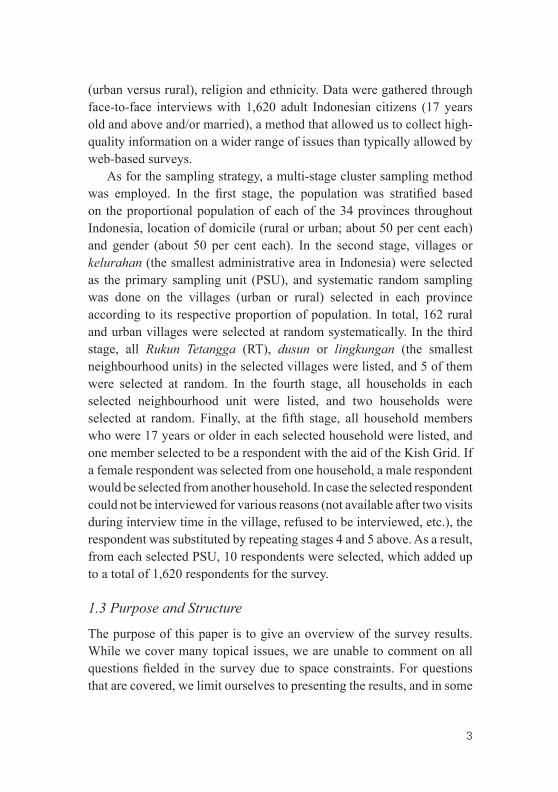
The survey was designed to obtain a representative sample of the Indonesian population. Conventional quantitative tests conducted by LSI using data from the 2010 Population Census suggest that this goal was achieved, as our sample closely mirrors the composition of the Indonesian population in terms of gender, region, location of residency
3 Jeffrey A. Winters, Oligarchy (New York: Cambridge University Press, 2011). Also, Dan Slater, “Indonesia’s Accountability Trap: Party Cartels and Presidential Power after Democratic Transition”, Indonesia 78 (October 2004): 61–92.
17-J02520 01 Trends_2017-10.indd 2 25/8/17 10:16 AM
3
(urban versus rural), religion and ethnicity. Data were gathered through face-to-face interviews with 1,620 adult Indonesian citizens (17 years old and above and/or married), a method that allowed us to collect high-quality information on a wider range of issues than typically allowed by web-based surveys.
As for the sampling strategy, a multi-stage cluster sampling method was employed. In the first stage, the population was stratified based on the proportional population of each of the 34 provinces throughout Indonesia, location of domicile (rural or urban; about 50 per cent each) and gender (about 50 per cent each). In the second stage, villages or kelurahan (the smallest administrative area in Indonesia) were selected as the primary sampling unit (PSU), and systematic random sampling was done on the villages (urban or rural) selected in each province according to its respective proportion of population. In total, 162 rural and urban villages were selected at random systematically. In the third stage, all Rukun Tetangga (RT), dusun or lingkungan (the smallest neighbourhood units) in the selected villages were listed, and 5 of them were selected at random. In the fourth stage, all households in each selected neighbourhood unit were listed, and two households were selected at random. Finally, at the fifth stage, all household members who were 17 years or older in each selected household were listed, and one member selected to be a respondent with the aid of the Kish Grid. If a female respondent was selected from one household, a male respondent would be selected from another household. In case the selected respondent could not be interviewed for various reasons (not available after two visits during interview time in the village, refused to be interviewed, etc.), the respondent was substituted by repeating stages 4 and 5 above. As a result, from each selected PSU, 10 respondents were selected, which added up to a total of 1,620 respondents for the survey.
1.3 Purpose and Structure
The purpose of this paper is to give an overview of the survey results. While we cover many topical issues, we are unable to comment on all questions fielded in the survey due to space constraints. For questions that are covered, we limit ourselves to presenting the results, and in some
17-J02520 01 Trends_2017-10.indd 3 25/8/17 10:16 AM
4
cases, we provide breakdowns by demographic factors such as gender, location, region, education and income. While we sometimes speculate on the meaning and implications of the findings, the main goal of our discussion is to present the survey data to the reader without any systematic attempt at drawing causal inferences. Other forthcoming publications will take up the task of further analysing the data and discussing more critically their significance in the context of the Indonesian economy, society and politics.
In what follows, this paper covers the three major themes around which the survey was designed, namely the economy, society and politics. Section 2 reports on respondents’ evaluations of the economy, especially with respect to infrastructure development, the role of the government in the economy, and e-commerce. Section 3 examines societal dynamics, in terms of prevalent patterns of Islamic practice, the role of Islam in society and politics, and attitudes towards Chinese Indonesians. Section 4 engages with the debate on Indonesian domestic and international politics by examining attitudes towards President Widodo’s performance, state institutions, decentralization, political participation, democracy, nation, and foreign relations. We conclude in section 5 by summing up some of the major observations based on the findings.
2. ECONOMY2.1 Evaluation of the Economy
Respondents are asked to evaluate the current condition of the Indonesian economy, the condition of the economy as compared to the previous year, and the expected condition of the economy in one year’s time. Figure 1 shows that 45.3 per cent of respondents perceives the current economic condition as “average”, 28.7 per cent perceives the economic condition as “bad”, while only 26 per cent perceives the economic condition as “good”. However, 41.5 per cent thinks that the current economic condition is “better” as compared to the last year, exceeding those who think that there is “no change” (34.4 per cent) and those who think that it is “worse” (24.2 per cent). When asked about the outlook of the economy in one year’s time, 66.5 per cent thinks that it will be better, exceeding by a large margin those who think that there will be “no change” (23.3 per
17-J02520 01 Trends_2017-10.indd 4 25/8/17 10:16 AM

5
cent) and those who think that it will be “worse” (10.3 per cent). Thus, while respondents may seem slightly pessimistic about the current state of the economy, they are more optimistic when comparing the economy to the last year and when forecasting the performance of the economy for the year to come.
The survey also asks respondents to evaluate their current household economic condition, compare it to the previous year and their expected condition in one year’s time. Overall, their responses are more optimistic than their assessment of the national economy. Figure 2 shows that 37.8 per cent of respondents perceives their household economic condition to be “good”, almost twice those who perceive their household economic condition to be “bad” (19.9 per cent). More strikingly, 75.4 per cent of respondents thinks that their household economic condition will be “better” in one year. This greater optimism with respect to household economic condition demonstrates the perception that President Widodo’s handling of the economy will not only lead to growth for the national economy, but more importantly, will bring real benefits to individual households.
Figure 1: Evaluation of economic condition (country)
26
45.3
28.7
020
4060
80Pe
rcen
t
Good
Average Bad
Right now
41.5
34.4
24.2
020
4060
80
Better
No chan
geWors
e
Compared to last year
66.5
23.3
10.3
020
4060
80
Better
No chan
geWors
e
In one year
17-J02520 01 Trends_2017-10.indd 5 25/8/17 10:16 AM

6
Figure 2: Evaluation of economic condition (household)
4 We group respondents into three main categories according to their reported income level and education level. Low-income respondents report incomes below Rp1.6 million, middle-income respondents between Rp1.6 million and Rp4 million, and high-income respondents above Rp4 million. Meanwhile, low-education respondents are defined as having only primary education, if any; medium-education respondents have completed middle-school or high school; high-education respondents have at least some college education, a college or a postgraduate degree. This follows Diego Fossati, The State of Local Politics in Indonesia: Survey Evidence from Three Cities, Trends in Southeast Asia No. 5/2016 (Singapore: ISEAS – Yusof Ishak Institute, 2016).
Figure 3 breaks down, according to location, education and income, perception of household economic condition as compared to the previous year. It shows that rural respondents (47.3 per cent) are more likely than urban respondents (42.6 per cent) to consider their household economic condition to have become “better”. In addition, the higher the educational level of respondents, and the higher their income levels, the more likely they are to consider their household economic condition to have become “better”.4
37.8
42.2
19.9
020
4060
80Pe
rcen
t
Good
Average Bad
Right now
45
32.8
22.2
020
4060
80
Better
No chan
geWors
e
Compared to last year
75.4
19.6
5
020
4060
80Bett
er
No chan
geWors
e
In one year
17-J02520 01 Trends_2017-10.indd 6 25/8/17 10:16 AM

7
Figure 3: Evaluation of household economic condition by location, education and income
47.3
30.6
22.1
010
2030
4050
Perc
ent
Better No change Worse
Rural
42.6
35
22.4
010
2030
4050
Better No change Worse
Urban
By location
39.7
32.927.3
020
4060
Perc
ent
Better
No cha
nge
Worse
Low education
47.6
32.6
19.8
020
4060
Better
No cha
nge
Worse
Medium education57.8
33.3
8.89
020
4060
Better
No cha
nge
Worse
High education
By education
39.435.5
25.1
020
4060
Perc
ent
Better
No cha
nge
Worse
Low income
44.4
32.5
23.1
020
4060
Better
No cha
nge
Worse
Middle income58.5
27.4
14.2
020
4060
Better
No cha
nge
Worse
High income
By income
!
17-J02520 01 Trends_2017-10.indd 7 25/8/17 10:16 AM

8
2.2 Economic Policy
This subsection looks into how respondents appraise Joko Widodo’s economic achievements in comparison with his predecessor, Susilo Bambang Yudhoyono (SBY). Widodo’s targets include achieving faster economic growth and making it easier to get business licences.5 Figure 4 reveals that 52.1 per cent of respondents agrees that the economy has grown faster; 55.2 per cent agrees that the economy has become more
5 Estu Suryowati, “Jokowi Yakin Pertumbuhan Ekonomi RI Bisa Tembus 7 Persen”, Kompas, 15 June 2014 <http://ekonomi.kompas.com/read/2014/ 06/15/2127459/Jokowi.Yakin.Pertumbuhan.Ekonomi.RI.Bisa.Tembus. 7.Persen> (accessed 7 August 2017).
Figure 4: Compared with the SBY years, has the economy improved since Joko Widodo took office?
22.625.3
52.1
020
4060
Per
cent
Disagree Neither Agree
Economy has grown faster
17.3
27.5
55.2
020
4060
Disagree Neither Agree
Economy more competitive
23.528.7
47.7
020
4060
Disagree Neither Agree
Easier to do business
41.3
29.9 28.8
020
4060
Per
cent
Disagree Neither Agree
Easier to find a job
47.8
24.827.5
020
4060
Disagree Neither Agree
Prices are cheaper
27.9 28.9
43.2
020
4060
Disagree Neither Agree
Improved condition for the poor
17-J02520 01 Trends_2017-10.indd 8 25/8/17 10:16 AM

9
competitive;6 47.7 per cent agrees that it has become easier to do business; and 43.2 per cent agrees that Widodo has improved conditions for the poor.
However, what can be worrying is that for two of the indicators, more people opt for “disagree” than “agree”: 41.3 per cent of respondents disagrees that it is easier to find a job, and 47.8 per cent disagrees that the Widodo administration has been able to lower the prices of goods. Thus, although official inflation rate is low, people’s perception is that goods are still too expensive.7
On the question of whether it is easier to find a job under the Widodo administration, Figure 5 shows that respondents who are female, live in urban areas, have higher education and high income are more likely to disagree that it is easier.
2.3 Infrastructure Policy
Developing infrastructure is the signature agenda of Joko Widodo. The survey asks respondents how satisfied they are with Widodo’s efforts in developing infrastructure, and finds that 74 per cent are satisfied while 26 per cent are not satisfied. Moreover, the survey finds that rural respondents are more likely to be satisfied with Widodo’s handling of infrastructure development, most likely because Widodo’s development focus is more targeted at rural areas (Figure 6).
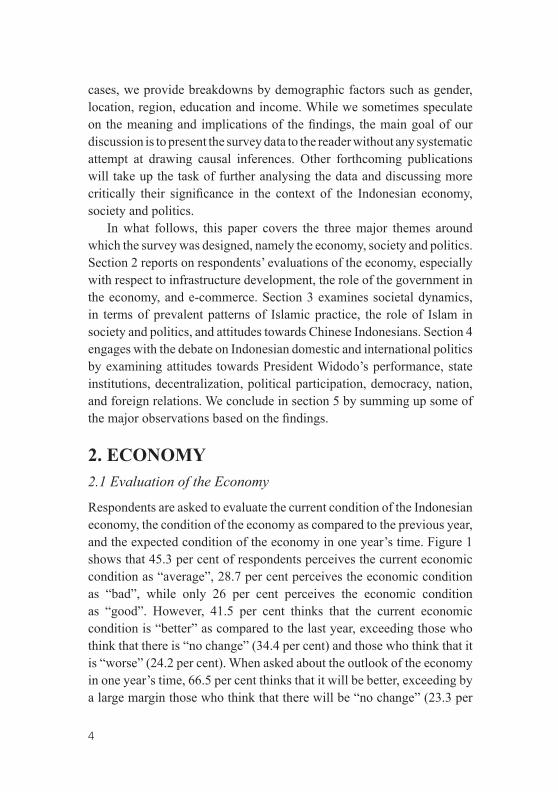
Further, the survey asks respondents what kind of infrastructure should be prioritized, and 70.5 per cent indicates that roads should be the top priority for infrastructure development, followed by 15.9 per cent for schools and 5.82 per cent for electricity and power plants (Figure 7).8
6 In general, this relates to the perception that the economy has become more competitive in comparison with other economies.7 Fabian Januarius Kuwado, “Inflasi 2016–2017 Terendah dalam 7 Tahun, Jokowi Apresiasi Kepala Daerah”, Kompas, 27 July 2017 <http://nasional.kompas.com/read/2017/07/27/13010491/inflasi-2016-2017-terendah-dalam-7-tahun-jokowi-apresiasi-kepala-daerah> (accessed 7 August 2017).8 Roads include toll roads, highways and general roads.
17-J02520 01 Trends_2017-10.indd 9 25/8/17 10:16 AM

10
Fig
ure
5: O
n w
heth
er it
is e
asie
r to
find
a jo
b, b
y ge
nder
, loc
atio
n, e
duca
tion
and
inco
me
38.8
31.6
29.5
01020304050Percent
Dis
agre
eN
eith
erA
gree
Mal
e
43.9
28.1
28
01020304050
Dis
agre
eN
eith
erA
gree
Fem
ale
By
gend
er
36.4
30.5
33.1
01020304050
Dis
agre
eN
eith
erA
gree
Rur
al46
.3
29.3
24.4
01020304050
Dis
agre
eN
eith
erA
gree
Urb
an
By
loca
tion
39.5
27.9
32.6
01020304050Percent
Disagre
eNeit
her
Agree
Low
edu
catio
n
41.7
31.3
27
01020304050
Disagre
e
Neithe
r
Agree
Med
ium
edu
catio
n48
.5
31.8
19.7
01020304050
Disagre
e
Neithe
r
Agree
Hig
h ed
ucat
ion
By
educ
atio
n
40.4
2831
.6
01020304050Percent
Disagre
eNeit
her
Agree
Low
inco
me
40.4
31.6
27.9
01020304050
Disagre
e
Neithe
r
Agree
Mid
dle
inco
me
44.9
31
24.1
01020304050
Disagre
e
Neithe
r
Agree
Hig
h in
com
e
By
inco
me
17-J02520 01 Trends_2017-10.indd 10 25/8/17 10:16 AM

11
Figure 6: Satisfaction with government performance on infrastructure, by location
24
76
020
4060
80Pe
rcen
t
Not satisfied Satisfied
Rural
28.2
71.8
020
4060
80
Not satisfied Satisfied
Urban
While the order of the top three priorities — roads, then schools, then electricity and power plants — is consistent across rural and urban respondents, rural respondents are more likely to prioritize roads and electricity, while urban respondents are more likely to prioritize schools. This is probably because roads and electricity are less readily available in rural locations, and the urban population is more likely to have better education and higher income and therefore greater demand for educational facilities.
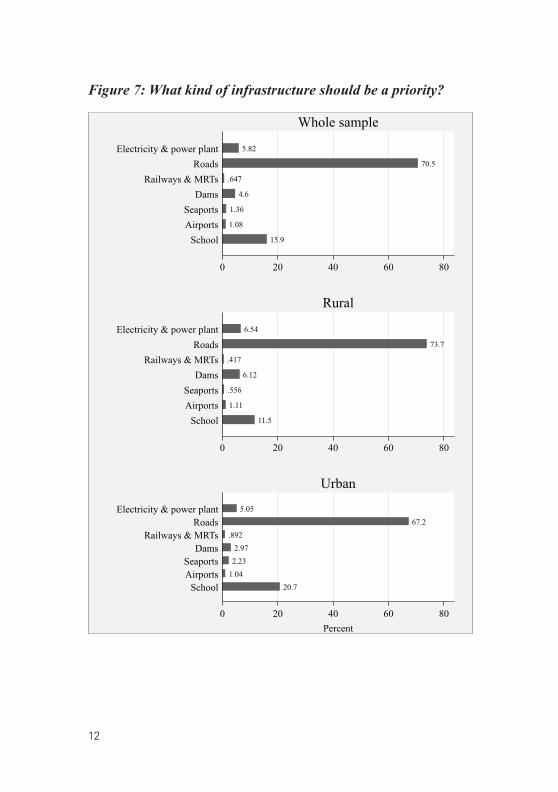
Concerning the main obstacles to infrastructure development, respondents are asked to choose up to three answers (this is why the percentages add up to more than 100). Figure 8 shows that 97 per cent of respondents thinks that corruption is the main obstacle to developing infrastructure in the country. The option that attracts the second highest proportion of votes is the “lack of human and financial resources” at 33.1 per cent, and coming in third is the lack of support from the local government at 11.1 per cent.
17-J02520 01 Trends_2017-10.indd 11 25/8/17 10:16 AM
12
Figure 7: What kind of infrastructure should be a priority?
15.9
1.08
1.36
4.6
.647
70.5
5.82
0 20 40 60 80
SchoolAirportsSeaports
DamsRailways & MRTs
RoadsElectricity & power plant
Whole sample
11.5
1.11
.556
6.12
.417
73.7
6.54
0 20 40 60 80
SchoolAirportsSeaports
DamsRailways & MRTs
RoadsElectricity & power plant
Rural
20.71.042.232.97
.89267.2
5.05
0 20 40 60 80Percent
SchoolAirportsSeaports
DamsRailways & MRTs
RoadsElectricity & power plant
Urban
17-J02520 01 Trends_2017-10.indd 12 25/8/17 10:16 AM
13
Corruption is perceived not only as the biggest obstacle for infrastructure development, but also as the most important issue facing Indonesia today. When respondents are asked to list up to three of the most important issues facing Indonesia today, corruption is at the top with 38.8 per cent listing it (Figure 9). Coming in second is “economic management and growth” at 30.7 per cent, and third is “infrastructure and transportation” at 24.6 per cent.
2.4 Role of Government in the Economy
Regarding the role of the government in the economy, setting the price of gas and staple food and setting a minimum wage have the most support at 90.1 per cent and 89.1 per cent respectively (Figure 10). The former accords with the finding in section 2.2 that respondents perceive the prices of goods to be too high. Next is that the government should provide unemployment subsidies for those who lost their jobs (71.1 per cent) and finally, support for spending more to help the poor, even if this requires higher taxes, stands at 64.6 per cent.
2.5 Internet and E-commerce
The survey also investigates respondents’ exposure to the Internet, smartphone technology and e-commerce, a new global economic phenomenon. The survey finds that 31 per cent of respondents has ever
Figure 8: Main obstacles to develop infrastructure in Indonesia
2.8
4.7
7.62
11.1
33.1
97.0
0 20 40 60 80 100 120
The goals are too ambitious
DPR & political parties are not supportive
Anti-corruption regulations slow down the process
Local government is not cooperative
There is a lack of human and financial resources
There is too much corruption
17-J02520 01 Trends_2017-10.indd 13 25/8/17 10:16 AM

14
Figure 9: Most important issues/problems facing Indonesia today
Figure 10: Role of government in the economy
35.4
64.6
020
4060
8010
0Pe
rcen
t
Don't agree Agree
Spend more for the poor
9.91
90.1
020
4060
8010
0
Don't agree Agree
Set price for gas and staple food
28.9
71.1
020
4060
8010
0Pe
rcen
t
Don't agree Agree
Provide unemployment subsidy
10.9
89.1
020
4060
8010
0
Don't agree Agree
Set minimum wage
9.53
16
16.3
18.8
20.03
20.9
22
24.6
30.7
38.8
0 5 10 15 20 25 30 35 40 45
Healthcare
Crime, law enforcement & security
Unemployment
Education
Social welfare
Poverty
Price stability
Infrastructure & transportation
Economic management & growth
Corruption
17-J02520 01 Trends_2017-10.indd 14 25/8/17 10:16 AM
15
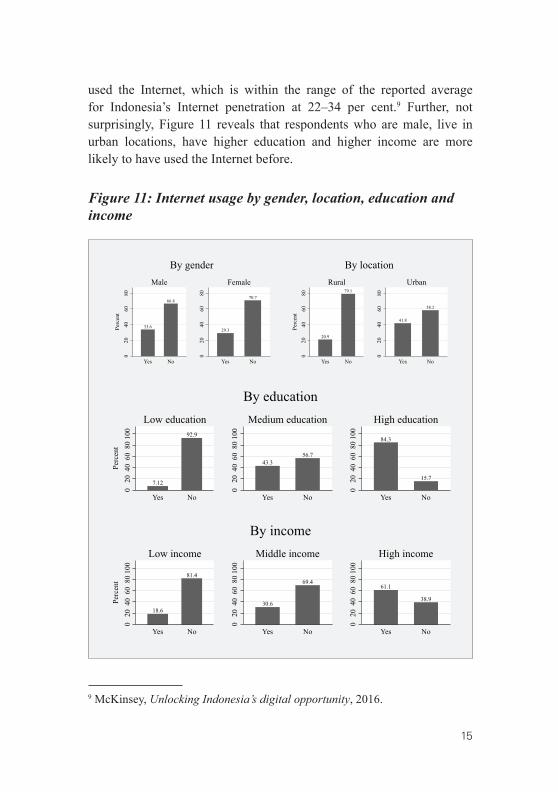
used the Internet, which is within the range of the reported average for Indonesia’s Internet penetration at 22–34 per cent.9 Further, not surprisingly, Figure 11 reveals that respondents who are male, live in urban locations, have higher education and higher income are more likely to have used the Internet before.
9 McKinsey, Unlocking Indonesia’s digital opportunity, 2016.
Figure 11: Internet usage by gender, location, education and income
33.6
66.4
020
4060
80Pe
rcen
t
Yes No
Male
29.3
70.7
020
4060
80
Yes No
Female
By gender
20.9
79.1
020
4060
80Pe
rcen
t
Yes No
Rural
41.8
58.2
020
4060
80
Yes No
Urban
By location
7.12
92.9
020
4060
8010
0Pe
rcen
t
Yes No
Low education
43.356.7
020
4060
8010
0
Yes No
Medium education
84.3
15.7
020
4060
8010
0
Yes No
High education
By education
18.6
81.4
020
4060
8010
0Pe
rcen
t
Yes No
Low income
30.6
69.4
020
4060
8010
0
Yes No
Middle income
61.1
38.9
020
4060
8010
0
Yes No
High income
By income
17-J02520 01 Trends_2017-10.indd 15 25/8/17 10:16 AM

16
10 “Special Report Indonesia”, The Economist, 27 February 2016.11 Stefani Ribka and Dylan Amirio, “E-commerce boom here to stay, industry players say”, Jakarta Post, 27 May 2016 <http://www.thejakartapost.com/news/2016/05/27/e-commerce-boom-here-to-stay-industry-players-say.html> (accessed 7 August 2017).12 The 2010 Census put Muslims at 87.5 per cent of the population. See Aris Ananta, Evi Nurvidya Arifin, M. Sairi Hasbullah, Nur Budi Handayani and Wahyu Pramono, Demography of Indonesia’s Ethnicity (Singapore: Institute of Southeast Asian Studies, 2015).
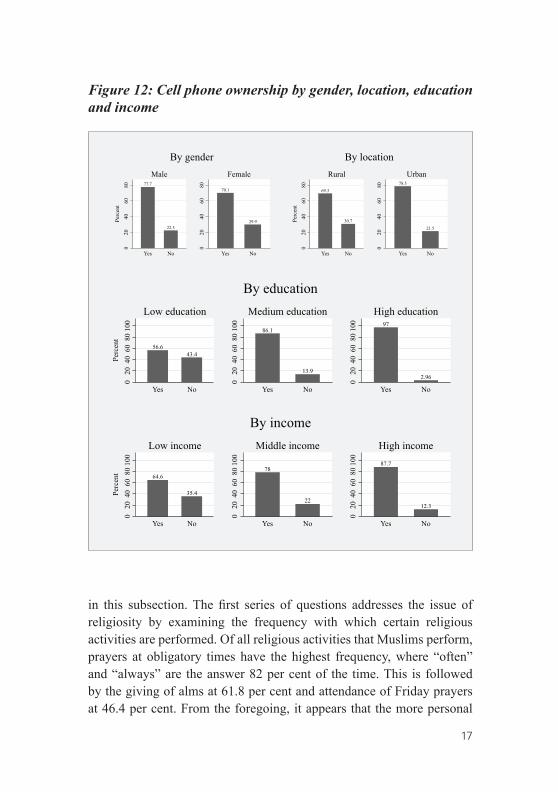
With respect to the ownership of cell phones, although the number of mobile SIM cards in use in Indonesia has steeply risen in the past decade to exceed the population,10 only 74 per cent of respondents claims to own a cell phone. Among those who own a cell phone, only 41.4 per cent owns a smartphone. As with Internet users, respondents who are male, live in urban locations, have higher education and higher income are more likely to own cell phones in Indonesia (Figure 12).
Concerning e-commerce, the survey asks if respondents have been buying products and services through online/Internet channels. Three categories of online businesses are of interest here: first, e-commerce and online shopping (Lazada, Zalora, Blibli, Tokopedia, Bukalapak, etc.); second, ride services (Gojek, Uber, Grab, etc.); and third, online traveling/hotel booking and ticketing services (Traveloka, Tiket.com, TripAdvisor, Agoda, etc.). As the rate of Internet penetration is still relatively low, it is not surprising that only 7.1 per cent of respondents has shopped online before, while 4.9 per cent has used ride services, and 4.6 per cent has used online ticketing services. This indicates the relatively small size of the e-commerce sector in Indonesia today despite the recent high expectations that the sector will serve as a new engine of growth for the economy.11
3. SOCIETY3.1 Islamic Practices
This subsection looks into the influence of Islam in society, especially in view of Indonesia being a majority Muslim country. Muslims constitute 86.2 per cent of the sample,12 and it is their responses that we examine
17-J02520 01 Trends_2017-10.indd 16 25/8/17 10:16 AM
17
Figure 12: Cell phone ownership by gender, location, education and income
77.7
22.3
020
4060
80Pe
rcen
t
Yes No
Male
70.1
29.9
020
4060
80
Yes No
Female
By gender
69.3
30.7
020
4060
80Pe
rcen
t
Yes No
Rural78.5
21.5
020
4060
80
Yes No
Urban
By location
56.643.4
020
4060
8010
0Pe
rcen
t
Yes No
Low education
86.1
13.9
020
4060
8010
0
Yes No
Medium education97
2.96
020
4060
8010
0
Yes No
High education
By education
64.6
35.4
020
4060
8010
0Pe
rcen
t
Yes No
Low income
78
22
020
4060
8010
0
Yes No
Middle income87.7
12.3
020
4060
8010
0
Yes No
High income
By income
in this subsection. The first series of questions addresses the issue of religiosity by examining the frequency with which certain religious activities are performed. Of all religious activities that Muslims perform, prayers at obligatory times have the highest frequency, where “often” and “always” are the answer 82 per cent of the time. This is followed by the giving of alms at 61.8 per cent and attendance of Friday prayers at 46.4 per cent. From the foregoing, it appears that the more personal
17-J02520 01 Trends_2017-10.indd 17 25/8/17 10:16 AM

18
practice of prayers at obligatory times is more commonly practised than the communal religious rituals.13
Where the performance of the haj is concerned, 95.1 per cent has never done it, 1.2 per cent is on the waiting list, while only 2.7 per cent has gone on the haj. Nevertheless, the haj is considered an important part of a Muslim’s life, as only 5.4 per cent considers it “not very important”, and 10.8 per cent considers it “extremely important” (Figure 13). The majority of 59.5 per cent considers it “very important”, but accepts that there are practical constraints that may prevent Muslims from making the trip.
13 As our data are not longitudinal, this does not preclude the possibility that communal religious practices may be getting more prevalent.
Figure 13: How important is it for a Muslim to go to haj?
10.8
59.5
24.2
5.41
0 20 40 60Percent
It is extremely important and itshould be done no matter what
It is important, but you need to berealistic on whether it can be done
It is important, but there aremany other more important things
It is not very importantbut it is good to do it
17-J02520 01 Trends_2017-10.indd 18 25/8/17 10:16 AM
19
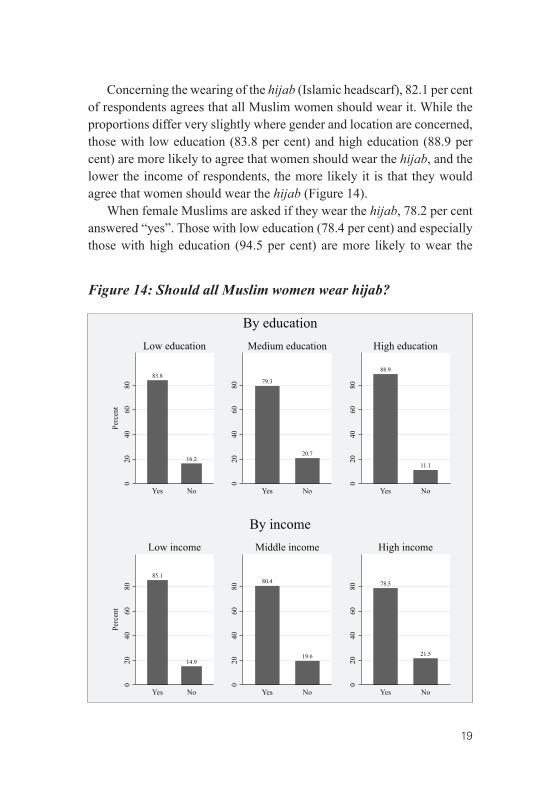
Concerning the wearing of the hijab (Islamic headscarf), 82.1 per cent of respondents agrees that all Muslim women should wear it. While the proportions differ very slightly where gender and location are concerned, those with low education (83.8 per cent) and high education (88.9 per cent) are more likely to agree that women should wear the hijab, and the lower the income of respondents, the more likely it is that they would agree that women should wear the hijab (Figure 14).
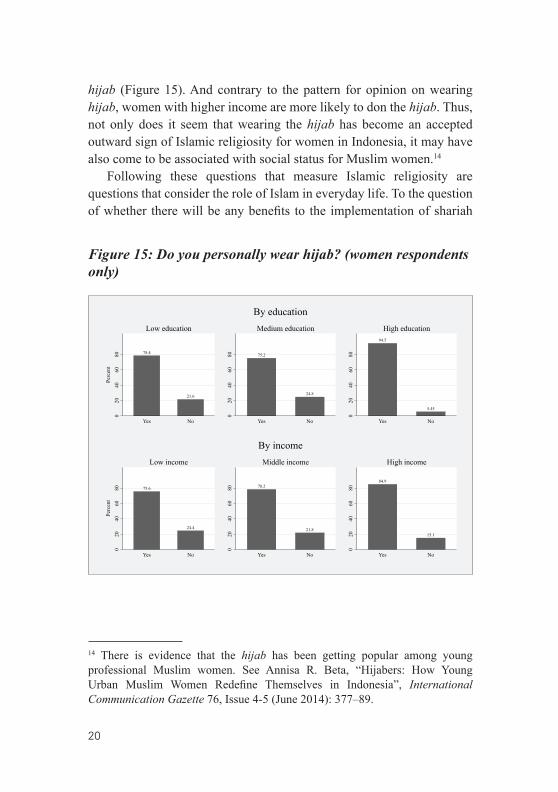
When female Muslims are asked if they wear the hijab, 78.2 per cent answered “yes”. Those with low education (78.4 per cent) and especially those with high education (94.5 per cent) are more likely to wear the
Figure 14: Should all Muslim women wear hijab?
83.8
16.2
020
4060
80Pe
rcen
t
Yes No
Low education
79.3
20.7
020
4060
80
Yes No
Medium education
88.9
11.1
020
4060
80
Yes No
High education
By education
85.1
14.9
020
4060
80Pe
rcen
t
Yes No
Low income
80.4
19.6
020
4060
80
Yes No
Middle income
78.5
21.5
020
4060
80
Yes No
High income
By income
17-J02520 01 Trends_2017-10.indd 19 25/8/17 10:16 AM
20
hijab (Figure 15). And contrary to the pattern for opinion on wearing hijab, women with higher income are more likely to don the hijab. Thus, not only does it seem that wearing the hijab has become an accepted outward sign of Islamic religiosity for women in Indonesia, it may have also come to be associated with social status for Muslim women.14
Following these questions that measure Islamic religiosity are questions that consider the role of Islam in everyday life. To the question of whether there will be any benefits to the implementation of shariah
Figure 15: Do you personally wear hijab? (women respondents only)
14 There is evidence that the hijab has been getting popular among young professional Muslim women. See Annisa R. Beta, “Hijabers: How Young Urban Muslim Women Redefine Themselves in Indonesia”, International Communication Gazette 76, Issue 4-5 (June 2014): 377–89.
78.4
21.6
020
4060
80Pe
rcen
t
Yes No
Low education
75.2
24.8
020
4060
80
Yes No
Medium education94.5
5.45
020
4060
80
Yes No
High education
By education
75.6
24.4
020
4060
80Pe
rcen
t
Yes No
Low income
78.2
21.8
020
4060
80
Yes No
Middle income
84.9
15.1
020
4060
80
Yes No
High income
By income
17-J02520 01 Trends_2017-10.indd 20 25/8/17 10:16 AM

21
law, 90.9 per cent agrees that there will be various benefits, while only 9.07 per cent considers that “benefits would be very limited or null” (Figure 16). The most popular reason for implementing shariah law, chosen by 67.2 per cent of respondents, is that “shariah law would help strengthen moral values in society”. In other words, shariah law is seen, not so much as the imposition of a certain socio-legal system, but as a measure for safeguarding moral values in society.15
Figure 16: Would there be any benefits to implementing shariah law?
9.85
4.62
9.24
67.2
9.07
0 20 40 60 80Percent
Yes, it would helppropagate Islam
Yes, it would helpfight corruption
Yes, it would helpincrease public safety
Yes, it would helpstrengthen moral values
No, benefits would bevery limited or null
15 Identifying with shariah can mean identification with Islamic values in general, and not necessarily support for the implementation of hudud, punishments mandated to be carried out with the infraction of shariah law.
17-J02520 01 Trends_2017-10.indd 21 25/8/17 10:16 AM

22
In terms of challenges faced by Islam, interestingly, Christianization efforts are among the least of respondents’ concerns at 2.13 per cent (Figure 17). Moreover, the next lowest concern, at 10.4 per cent of respondents, is with non-Muslim leaders becoming too powerful. Rather, what are considered most challenging are divisive debates among Muslims (42.7 per cent) and Islamic leaders’ involvement in politics (20.6 per cent). In short, it appears that what are perceived as challenges to Islam are not so much external factors, but factors that challenge the internal integrity of Islam.
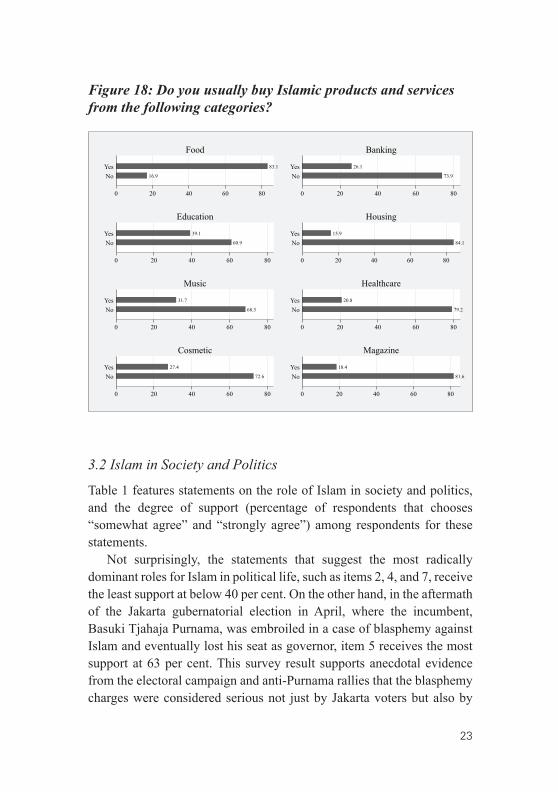
In recent years, there has been growing demand among the Islamic middle class for Islamic products and services. Figure 18 shows the products and services in terms of their popularity among Muslim respondents. Not surprisingly, a majority of 83.1 per cent insists on consuming food that is Islamic or halal. Other than that, education (39.1 per cent), music (31.7 per cent) and cosmetics (27.4 per cent) are the most popular Islamic products and services.
Figure 17: What is the most important challenge facing Islam in Indonesia?
.966
20.6
2.13
11.7
10.4
11.5
42.7
0 10 20 30 40Percent
Other
Islamic leaders aretoo involved in politics
Christianisation effortsare growing
State support for the practiceof Islam is not enough
Non-Muslim leaders arebecoming too powerful
Islam is becoming lesstolerant and too radical
Debates among Muslimsare too divisive
17-J02520 01 Trends_2017-10.indd 22 25/8/17 10:16 AM
23
Figure 18: Do you usually buy Islamic products and services from the following categories?
16.9
83.1
0 20 40 60 80
NoYes
Food
73.9
26.1
0 20 40 60 80
NoYes
Banking
60.9
39.1
0 20 40 60 80
NoYes
Education
84.1
15.9
0 20 40 60 80
NoYes
Housing
68.3
31.7
0 20 40 60 80
NoYes
Music
79.2
20.8
0 20 40 60 80
NoYes
Healthcare
72.6
27.4
0 20 40 60 80
NoYes
Cosmetic
81.6
18.4
0 20 40 60 80
NoYes
Magazine
3.2 Islam in Society and Politics
Table 1 features statements on the role of Islam in society and politics, and the degree of support (percentage of respondents that chooses “somewhat agree” and “strongly agree”) among respondents for these statements.
Not surprisingly, the statements that suggest the most radically dominant roles for Islam in political life, such as items 2, 4, and 7, receive the least support at below 40 per cent. On the other hand, in the aftermath of the Jakarta gubernatorial election in April, where the incumbent, Basuki Tjahaja Purnama, was embroiled in a case of blasphemy against Islam and eventually lost his seat as governor, item 5 receives the most support at 63 per cent. This survey result supports anecdotal evidence from the electoral campaign and anti-Purnama rallies that the blasphemy charges were considered serious not just by Jakarta voters but also by
17-J02520 01 Trends_2017-10.indd 23 25/8/17 10:16 AM

24
Table 1: The Role of Islam
Item Support
1 The government should prioritize Islam over other religions
49%
2 Islamic religious leaders should play a very important role in politics
37%
3 Indonesian regions should be allowed to implement shariah law at the local level
41%
4 Shariah law should be implemented throughout Indonesia
39%
5 Blasphemy against Islam should be punished more severely
63%
6 When voting in elections, it is very important to choose a Muslim leader
58%
7 Islam should become Indonesia’s only official religion 36%
Muslims across the country. Moreover, a good majority of respondents (58 per cent) supports item 6, suggesting that voting Muslims into political office is important. This figure coincides with the approximate percentage of votes that Purnama’s opponent, Anies Baswedan, won at the polls. Thus, the socio-political views evinced by the Jakarta election, where Islam is concerned, has broad national currency.
3.3 Chinese Indonesians
Studies of Chinese Indonesians seldom examine what indigenous Indonesians think of them. The survey features a list of long-held prejudicial statements concerning Chinese Indonesians to measure the degree to which these sentiments are still held. The first set of statements suggests that Chinese Indonesians are privileged. For all statements, those that agree exceed those that disagree (Figure 19). However, one
17-J02520 01 Trends_2017-10.indd 24 25/8/17 10:16 AM

25
statement – “Chinese Indonesians have a natural talent for success in making money” – exceeds the rest in terms of respondents that agree (68.1 per cent).
The second set of statements measures perception of Chinese Indonesians’ influence. In terms of both the economy and politics, more respondents agree than disagree that Chinese Indonesians have too much influence (Figure 20). However, respondents that acknowledge the excessive influence of Chinese in the economy (62 per cent) far exceed those that consider the Chinese’s influence excessive in politics (41.9 per cent). In other words, Chinese Indonesians are still considered to be playing a bigger role in the economy than in politics, despite their less visible role in the economy and more visible participation in electoral politics following Indonesia’s political liberalization post-1998.
The third set of questions deals with the perception that Chinese Indonesians tend to be exclusive. For every statement except the first one, respondents that agree exceed 40 per cent (Figure 21). What is interesting is that a considerable 47.6 per cent of respondents agree that “Chinese Indonesians may still harbour loyalty towards China”,
Figure 19: Stereotypes of Chinese Indonesians: Privileged
27.5
11.4
16.0
18.1
20.4
23.9
20.6
23.9
22.2
31.6
48.7
68.1
60.1
59.8
48.0
0 20 40 60 80
Chinese Indonesians have more opportunities in life than the indigenous
Chinese Indonesians have a natural talent for success in making money
Chinese Indonesians are usually at least middle-class
Chinese Indonesians are more likely to be wealthy than pribumi
Life is easier for Chinese Indonesians
Agree Neither Disagree
17-J02520 01 Trends_2017-10.indd 25 25/8/17 10:16 AM

26
Figure 20: Stereotypes of Chinese Indonesians: Influence
Figure 21: Stereotypes of Chinese Indonesians: Exclusiveness
even though almost all Chinese Indonesians are Indonesian citizens. Meanwhile, 35.8 per cent of respondents disagree that “it is inappropriate for indigenous Indonesians to inter-marry with Chinese Indonesians”, and this is the only statement where those who disagree exceed those who
14.8
26.8
23.2
31.3
62.0
41.9
0 10 20 30 40 50 60 70
Chinese Indonesians have too much influence in the Indonesian economy
Chinese Indonesians have too much influence in the Indonesian politics
Agree
Neither
Disagree
27.6
24.2
26.5
27.6
29.3
17.9
35.8
24.0
29.5
30.9
30.0
26.6
34.5
30.6
48.4
46.3
42.6
42.4
44.1
47.6
33.7
0 10 20 30 40 50 60
Chinese Indonesians only care about their own kind
Chinese Indonesians are too greedy and ambitious
Chinese Indonesians have different culture that does not fit with Indonesian values
Chinese Indonesians have their own religion that do not fit well in Indonesia
It is hard to be a close friend with a Chinese Indonesian
Chinese Indonesians may still harbour loyalty towards China
It is inappropriate for indigenous Indonesians to inter-marry with Chinese Indonesians
Agree
Neither
Disagree
17-J02520 01 Trends_2017-10.indd 26 25/8/17 10:16 AM

27
agree. Apparently, although Chinese Indonesians are largely perceived as being exclusive, indigenous Indonesians are not averse to inter-marrying with them. The sentiment here is reminiscent of the position of the Assaat Movement in the 1950s, which argued that it was not that indigenous Indonesians were unwilling to accept the Chinese, but that the Chinese stubbornly chose to maintain their foreign loyalty and exclusiveness.16
Finally, respondents are asked if they are comfortable with a Chinese Indonesian in a position of political leadership. A majority of the respondents (64.4 per cent) are uncomfortable with the notion, with no significant differences where gender and urban–rural locations are concerned. In terms of educational level, there is a clearer correlation, where the more educated the respondent, the more likely he or she will be comfortable with a Chinese Indonesian as political leader (Figure 22). Where income level is concerned, those with middle income are the most uncomfortable with the notion, perhaps because they are most likely to encounter competition from Chinese Indonesians.
Of the different ethnic groups, only the Bataks (60 per cent) and Balinese (100 per cent) are more comfortable than uncomfortable with Chinese Indonesians in political positions (Figure 23).17 On the other hand, the Malays, Cirebonese, Minangkabau and Sundanese are the most uncomfortable with the notion of Chinese Indonesians in political office.
4. POLITICS4.1 Approval Rating of President Widodo
One of the key questions of the survey is to ask respondents whether they approve of how Joko Widodo is handling his job as President of
16 See A.J. Muaja, The Chinese Problem in Indonesia (Djakarta, Indonesia: New Nusantara Publishing Coy, 1960).17 As our research design does not produce representative samples of ethnic groups, our inferences regarding variation across ethnic groups should be interpreted with caution. The largest groups in our sample are the Javanese (685 respondents), Madurese (227) and Malay (66). For other minority groups, the figures are based on a lower number of respondents, given the smaller size of such groups as a share of the general Indonesian population.
17-J02520 01 Trends_2017-10.indd 27 25/8/17 10:16 AM

28
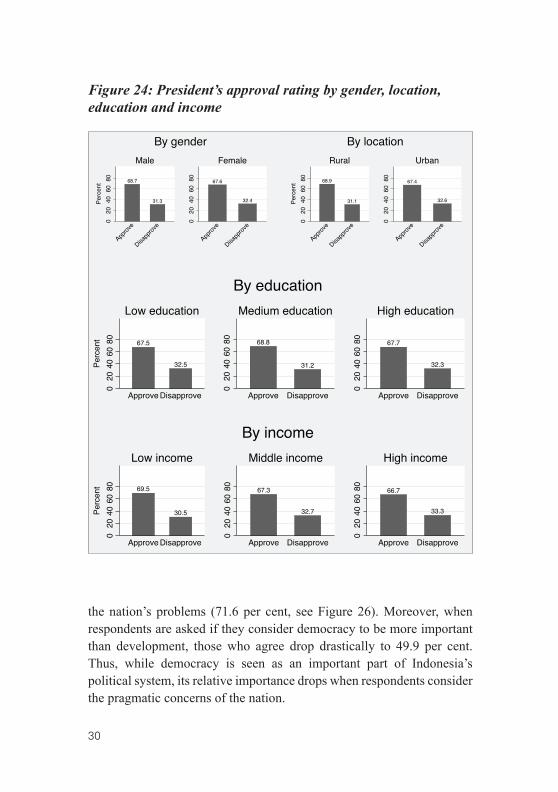
Indonesia. The majority of the respondents (68 per cent) approves of Widodo’s performance, while 32 per cent disapproves. This finding is very similar to the opinion poll conducted by Saiful Mujani Research and Consulting (SMRC) in June 2017, which finds that 67 per cent of their respondents is satisfied with Widodo’s performance, while 31 per cent is not satisfied.18 It also appears that support for Jokowi cuts across gender, income, education and urban/rural cleavages, as the differences are really small (Figure 24).
18 Cici Marlina Rahayu, “Survei SMRC: 67% Masyarakat Puas terhadap Kinerja Jokowi”, Detiknews, 8 June 2017 <https://news.detik.com/berita/d-3524763/survei-smrc-67-masyarakat-puas-terhadap-kinerja-jokowi> (accessed 6 August 2017).
Figure 22: Are you comfortable with a Chinese Indonesian in a position of political leadership?
66.8
33.2
020
4060
80Pe
rcen
t
No Yes
Low education
64.2
35.8
020
4060
80
No Yes
Medium education
53.446.6
020
4060
80
No Yes
High education
By education
63.6
36.4
020
4060
80Pe
rcen
t
No Yes
Low income
67.4
32.6
020
4060
80
No Yes
Middle income
60.7
39.30
2040
6080
No Yes
High income
By income
17-J02520 01 Trends_2017-10.indd 28 25/8/17 10:16 AM

29
Figure 23: Views of Chinese Indonesians as political leaders, by ethnic group
63
37
80
20
86
14
61
39
64
36
76
24
40
60
82
18
0
100
78
22
83
17
01
2040
8060
Perc
ent
Javan
ese
Sunda
nese
Malay
Madure
seBug
is
Batavia
nBata
k
Minang Bali
Banten
Cirebo
n
Uncomfortable Comfortable
4.2 Trust in Institutions and Satisfaction with Democracy
Respondents are asked how much they trust different institutions in Indonesia. The Army is by far the most trusted (90.2 per cent), followed by the Corruption Eradication Commission (83.1 per cent) and the national government (81.6 per cent, see Figure 25). In general, state institutions are highly trusted. On the other hand, the least trusted are political parties (45.8 per cent) and the House of Representatives (55.4 per cent), which suggests that respondents have much lower trust in politicians.
In general, respondents value democracy as a political system, as 79.8 per cent considers democracy to be the best form of government for Indonesia, although less people think that democracy can solve
17-J02520 01 Trends_2017-10.indd 29 25/8/17 10:16 AM
30
the nation’s problems (71.6 per cent, see Figure 26). Moreover, when respondents are asked if they consider democracy to be more important than development, those who agree drop drastically to 49.9 per cent. Thus, while democracy is seen as an important part of Indonesia’s political system, its relative importance drops when respondents consider the pragmatic concerns of the nation.
Figure 24: President’s approval rating by gender, location, education and income
68.7
31.3
020
4060
80Pe
rcen
t
Approv
e
Disapp
rove
Male
67.6
32.4
020
4060
80
Approv
e
Disapp
rove
Female
By gender
68.9
31.1
020
4060
80Pe
rcen
t
Approv
e
Disapp
rove
Rural
67.4
32.6
020
4060
80
Approv
e
Disapp
rove
Urban
By location
67.5
32.5
020
4060
80Pe
rcen
t
Approve Disapprove
Low education
68.8
31.2
020
4060
80
Approve Disapprove
Medium education
67.7
32.30
2040
6080
Approve Disapprove
High education
By education
69.5
30.5
020
4060
80Pe
rcen
t
Approve Disapprove
Low income
67.3
32.7
020
4060
80
Approve Disapprove
Middle income
66.7
33.3
020
4060
80
Approve Disapprove
High income
By income
17-J02520 01 Trends_2017-10.indd 30 25/8/17 10:16 AM

31
Figure 25: Trust in institutions in Indonesia
Figure 27 shows the importance that respondents place on pluralism. A strong majority of 78.3 per cent agrees that the rights of ethnic and religious minorities are protected, while an even larger 87.7 per cent of respondents agrees that Pancasila, the state ideology that supports ethnic and religious pluralism, should remain the most important national ideology of Indonesia. Thus, it seems that pluralism continues to be a value held onto by a significant majority of Indonesians.
However, when we break down the results by ethnicity and religion, significant variation emerges. Not surprisingly, the Chinese feel the most politically marginalized, as 31 per cent of respondents disagree that minorities are protected, far exceeding other ethnic groups (Figure 28). Where religious groups are concerned, it is the Catholics that feel most politically marginalized, as 25 per cent of respondents disagrees that minorities are protected, followed by Protestants at a distant second of 9 per cent.
4.3 Decentralization
Respondents are asked to assess if having multiple levels of government is a system that is working for Indonesia. In response, 80 per cent of the
90.2
70.3
55.4
65.7
45.8
83.1
78.4
79.3
67.2
78.8
79.9
81.6
0.0 10.0 20.0 30.0 40.0 50.0 60.0 70.0 80.0 90.0 100.0
Army
Police
House of Representatives
Courts
Political parties
Corruption Eradication Commission
Civil service
Electoral Commission
Mass media
District government
Province government
National government
17-J02520 01 Trends_2017-10.indd 31 25/8/17 10:16 AM

32
Figure 26: On democracy
5.9716.6
77.4
020
4060
80Pe
rcen
t
Disagree Neither Agree
Indonesia is a democratic country
9.1219.3
71.6
020
4060
80
Disagree Neither Agree
Indonesia more democratic now than 10y ago
4.6915.5
79.8
020
4060
80Pe
rcen
t
Disagree Neither Agree
Democracy best form of govt. for Indonesia
10.118.3
71.6
020
4060
80
Disagree Neither Agree
Democracy can solve Indonesia's problems
26.4 23.8
49.9
010
2030
4050
Perc
ent
Disagree Neither Agree
Democracy more important than development
sample says that the system is working “quite well” or “very well”, while the remaining 20 per cent chooses “not well at all” or “not very well”. This suggests that a strong majority of respondents is satisfied with the current system of decentralized governance.
When we consider location as a factor, rural respondents are more likely than urban respondents to think that the current decentralized system is working well (Figure 29). Where region is concerned, it appears that the furthest reaching regions of Eastern Islands (91 per cent) and Papua (88 per cent) and the most populated region of Java and Bali (83 per cent) have the highest proportion of respondents that considers
17-J02520 01 Trends_2017-10.indd 32 25/8/17 10:16 AM

Figure 27: On pluralism
4.87
16.8
78.3
020
4060
8010
0
Perc
ent
Disagree Neither agree nor disagree Agree
Rights of ethnic/religion minorities are protected
.672
11.6
87.7
020
4060
8010
0
Disagree Neither agree nor disagree Agree
Pancasila should be national ideology
Figure 28: Disagreement with statement “The rights of ethnic and religious minorities are protected in Indonesia”, by ethnic and religious group
31
3
11
4
4
9
6
4
0 10 3020
ChineseMinang
BatakBetawiBugisMalay
SundaneseJavanese
By ethnic group
9
25
4
0 10 3020
Protestant
Catholic
Islam
By religious group
17-J02520 01 Trends_2017-10.indd 33 25/8/17 10:16 AM

34
the decentralized system to be working well, while Sumatra (69 per cent) has the least proportion of respondents that thinks that the system is working well.19
When respondents are asked which level of government should have the most power, given a choice among provincial, district/city and village levels, 53 per cent chooses the provincial level, 28 per cent chooses districts/cities and 19 per cent chooses villages. When we take location into consideration, rural respondents are more likely to prefer the lower levels of government (village and district) than urban
Figure 29: Support for decentralized governance, by location and region
22
78
17
83
020
4060
80Pe
rcen
t
Urban Rural
By location
17
83
31
69
23
77
18
82
9
91
12
88
020
4060
8010
0
Java and BaliSumatra
KalimantanSulawesi
Easter IslandsPapua
By region
Not well at all/Not very well Quite well/Very well
19 As our research design does not produce representative samples at the region/provincial level, our inferences on variation across regions should be interpreted with caution. Of the 1,620 face-to-face interviews we conducted, 950 took place in Java or Bali, 330 in Sumatra, 100 in Kalimantan, 130 in Sulawesi, 80 in the Eastern Islands (Nusa Tenggara and Maluku), and 20 in Papua.
17-J02520 01 Trends_2017-10.indd 34 25/8/17 10:16 AM

35
Figure 30: What level of government should have most powers? Results by location and region
15
26
59
24
30
47
020
4060
Perc
ent
Urban Rural
By location
2024
56
17
30
54
9
25
66
21
54
25
33
25
42
5
32
63
020
4060
80
Java and BaliSumatra
KalimantanSulawesi
Easter IslandsPapua
By region
Village District Province
respondents (Figure 30). Where region is taken into consideration, the pattern becomes quite varied. Most regions prefer the province to hold the most power, especially Kalimantan (66 per cent) and Papua (63 per cent). Sulawesi, however, is an outlier where a majority of respondents (54 per cent) prefers the district or city to hold the most power. Among all regions, Eastern Island respondents (33 per cent) are most likely to prefer the most power to reside with the village level of governance.
4.4 Political Participation
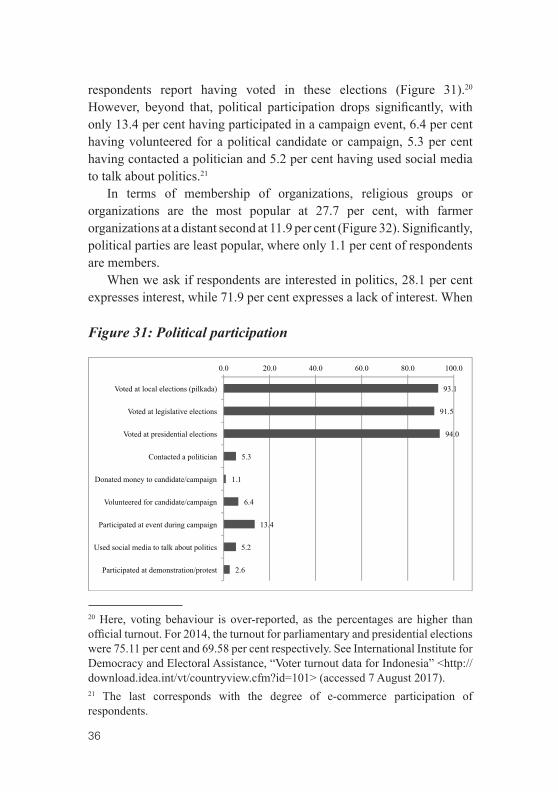
To measure the degree of political participation, a series of activities is listed and participants answer if they have participated in such activities in the last few years. It appears that voting in local, legislative and presidential elections are the most common forms of political activity that respondents have participated in, since more than 90 per cent of
17-J02520 01 Trends_2017-10.indd 35 25/8/17 10:16 AM
36
respondents report having voted in these elections (Figure 31).20 However, beyond that, political participation drops significantly, with only 13.4 per cent having participated in a campaign event, 6.4 per cent having volunteered for a political candidate or campaign, 5.3 per cent having contacted a politician and 5.2 per cent having used social media to talk about politics.21
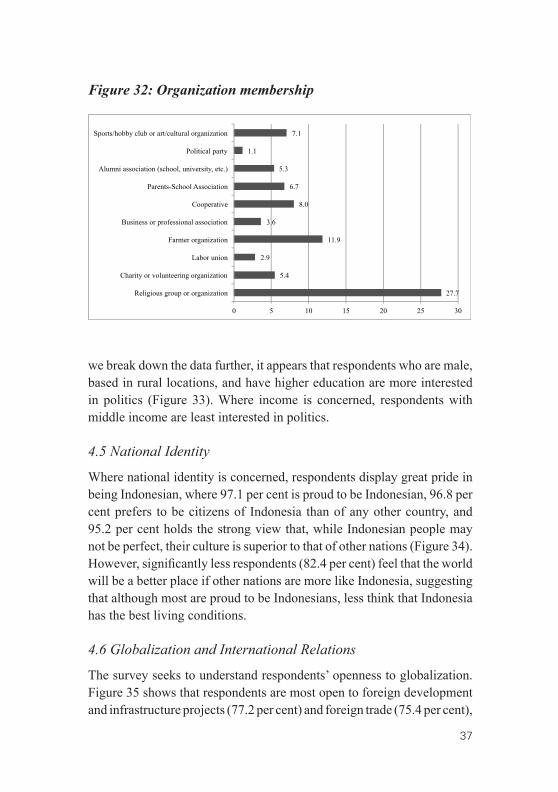
In terms of membership of organizations, religious groups or organizations are the most popular at 27.7 per cent, with farmer organizations at a distant second at 11.9 per cent (Figure 32). Significantly, political parties are least popular, where only 1.1 per cent of respondents are members.
When we ask if respondents are interested in politics, 28.1 per cent expresses interest, while 71.9 per cent expresses a lack of interest. When
20 Here, voting behaviour is over-reported, as the percentages are higher than official turnout. For 2014, the turnout for parliamentary and presidential elections were 75.11 per cent and 69.58 per cent respectively. See International Institute for Democracy and Electoral Assistance, “Voter turnout data for Indonesia” <http://download.idea.int/vt/countryview.cfm?id=101> (accessed 7 August 2017).21 The last corresponds with the degree of e-commerce participation of respondents.
Figure 31: Political participation
93.1
91.5
94.0
5.3
1.1
6.4
13.4
5.2
2.6
0.0 20.0 40.0 60.0 80.0 100.0
Voted at local elections (pilkada)
Voted at legislative elections
Voted at presidential elections
Contacted a politician
Donated money to candidate/campaign
Volunteered for candidate/campaign
Participated at event during campaign
Used social media to talk about politics
Participated at demonstration/protest
17-J02520 01 Trends_2017-10.indd 36 25/8/17 10:16 AM
37
we break down the data further, it appears that respondents who are male, based in rural locations, and have higher education are more interested in politics (Figure 33). Where income is concerned, respondents with middle income are least interested in politics.
4.5 National Identity
Where national identity is concerned, respondents display great pride in being Indonesian, where 97.1 per cent is proud to be Indonesian, 96.8 per cent prefers to be citizens of Indonesia than of any other country, and 95.2 per cent holds the strong view that, while Indonesian people may not be perfect, their culture is superior to that of other nations (Figure 34). However, significantly less respondents (82.4 per cent) feel that the world will be a better place if other nations are more like Indonesia, suggesting that although most are proud to be Indonesians, less think that Indonesia has the best living conditions.
4.6 Globalization and International Relations
The survey seeks to understand respondents’ openness to globalization. Figure 35 shows that respondents are most open to foreign development and infrastructure projects (77.2 per cent) and foreign trade (75.4 per cent),
Figure 32: Organization membership
27.7
5.4
2.9
11.9
3.6
8.0
6.7
5.3
1.1
7.1
0 5 10 15 20 25 30
Religious group or organization
Charity or volunteering organization
Labor union
Farmer organization
Business or professional association
Cooperative
Parents-School Association
Alumni association (school, university, etc.)
Political party
Sports/hobby club or art/cultural organization
17-J02520 01 Trends_2017-10.indd 37 25/8/17 10:16 AM

38
Figure 33: Are you interested in politics? Results by gender, location, education and income
65.9
34.1
020
4060
80Pe
rcen
t
No Yes
Male
78.1
21.9
020
4060
80
No Yes
Female
By gender
69.3
30.7
020
4060
80Pe
rcen
t
No Yes
Rural
74.3
25.7
020
4060
80
No Yes
Urban
By location
75.9
24.1
020
4060
80Pe
rcen
t
No Yes
Low education
70.4
29.6
020
4060
80
No Yes
Medium education
59.8
40.20
2040
6080
No Yes
High education
By education
70.9
29.1
020
4060
80Pe
rcen
t
No Yes
Low income76
24
020
4060
80
No Yes
Middle income
66.7
33.3
020
4060
80
No Yes
High income
By income
and slightly less open to foreign investment (66.7 per cent). However, when it comes to foreign workers, marginally more respondents disagree (40.8 per cent) than agree (40.1 per cent) that Indonesia should be open to them. This may be due to the perception that while the former three may improve the lives of Indonesians or generate income and jobs for them, the last introduces competition for jobs with Indonesians.
17-J02520 01 Trends_2017-10.indd 38 25/8/17 10:16 AM

39
Figure 34: Attachment to national identity
Figure 35: Support for globalization
9.5515
75.4
020
4060
80Pe
rcen
t
Disagree Neither Agree
More open to trade
15.1 18.2
66.7
020
4060
80
Disagree Neither Agree
More open to foreign investment
40.8
19
40.1
020
4060
80
Disagree Neither Agree
More open to migrant workers
8.3414.5
77.2
020
4060
80
Disagree Neither Agree
Welcome foreign infrastructure project
97.1
96.8
95.2
82.4
75.0 80.0 85.0 90.0 95.0 100.0
I am very proud to be Indonesian
I'd rather be a citizen of Indonesia than any other country
Indonesian culture is superior to others
World a better place if other nations were more like Indonesia
17-J02520 01 Trends_2017-10.indd 39 25/8/17 10:16 AM
40
Figure 36: Perceptions of countries and ASEAN
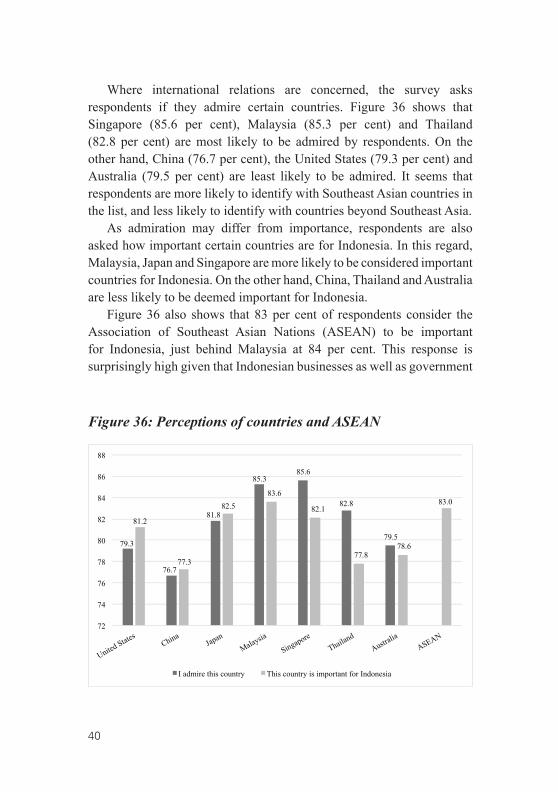
Where international relations are concerned, the survey asks respondents if they admire certain countries. Figure 36 shows that Singapore (85.6 per cent), Malaysia (85.3 per cent) and Thailand (82.8 per cent) are most likely to be admired by respondents. On the other hand, China (76.7 per cent), the United States (79.3 per cent) and Australia (79.5 per cent) are least likely to be admired. It seems that respondents are more likely to identify with Southeast Asian countries in the list, and less likely to identify with countries beyond Southeast Asia.
As admiration may differ from importance, respondents are also asked how important certain countries are for Indonesia. In this regard, Malaysia, Japan and Singapore are more likely to be considered important countries for Indonesia. On the other hand, China, Thailand and Australia are less likely to be deemed important for Indonesia.
Figure 36 also shows that 83 per cent of respondents consider the Association of Southeast Asian Nations (ASEAN) to be important for Indonesia, just behind Malaysia at 84 per cent. This response is surprisingly high given that Indonesian businesses as well as government
79.3
76.7
81.8
85.385.6
82.8
79.5
81.2
77.3
82.583.6
82.1
77.878.6
83.0
72
74
76
78
80
82
84
86
88
United States China
Japan
Malaysia
Singapore
Thailand
Australia
ASEAN
I admire this country This country is important for Indonesia
17-J02520 01 Trends_2017-10.indd 40 25/8/17 10:16 AM
41
22 Prashanth Parameswaran, “Is Indonesia Turning Away from ASEAN Under Jokowi?”, The Diplomat, 18 December 2014 <http://thediplomat.com/2014/ 12/is-indonesia-turning-away-from-asean-under-jokowi/> (accessed 7 August 2017).
officials are widely perceived to be having waning commitment towards ASEAN.22
In the context of the global rise of China, respondents are asked if they think the rise of China will have a positive or negative impact on neighbouring countries such as Indonesia. Those who think that the rise of China will have a positive impact on Indonesia are only slightly more (41 per cent) than those who think it will have a negative impact (39 per cent). This balance between respondents who think there will be a negative impact and positive impact respectively is a pattern that emerges consistently across gender, location, and income level differences.
However, perception on China’s impact on Indonesia does differ significantly across ethnic groups. While the Madurese, Bantenese and Malays are least likely to have positive perceptions of China’s impact, the Balinese, Chinese, Batak and Cirebonese are most likely to have positive perceptions of China’s impact (Figure 37).
Respondents are asked if they think Indonesia can benefit from close economic ties with China. Interestingly, Figure 38 shows that the majority of respondents (62.4 per cent) thinks that close economic ties with China will only bring a little benefit to Indonesia. Only 27.7 per cent of respondents believes that it will bring a lot of benefits to Indonesia. It is important to note that respondents who are from urban locations and who have higher income are more likely to think that closer economic ties with China will bring a lot of benefits. However, overall, the majority of respondents still think that the benefit is small.
Not surprisingly, Chinese respondents are most likely to see a lot of benefits from closer economic ties with China (67 per cent), followed by the Cirebonese (50 per cent) and Bataks (40 per cent) (Figure 39). Malays (6 per cent) and Sundanese (20 per cent) are least likely to perceive a lot
17-J02520 01 Trends_2017-10.indd 41 25/8/17 10:16 AM

Figure 37: Positive perceptions of the impact of China on neighbouring countries, by ethnic group
4138
29
17
4543
51
48
70
20
50
54
40
020
4060
80Pe
rcen
t
Javan
ese
Sunda
nese
Malay
Madure
seBug
is
Batavia
nBata
k
Minang Bali
Banten
Cirebo
n
Chinese
Other
Figure 38: How much will Indonesia benefit by having close economic ties with China? Results by location and income
9.9
62.4
27.7
020
4060
Perc
ent
Not at all A little A lot
Whole sample
12.3
64.7
23
020
4060
Perc
ent
Not at all A little A lot
Rural
7.7
60.3
32
020
4060
Not at all A little A lot
Urban
By location
11.2
66
22.8
020
4060
80Pe
rcen
t
Not at all A little A lot
Low income
9.49
60.6
29.9
020
4060
Not at all A little A lot
Middle income
7.97
58.2
33.9
020
4060
Not at all A little A lot
High income
By income
17-J02520 01 Trends_2017-10.indd 42 25/8/17 10:16 AM
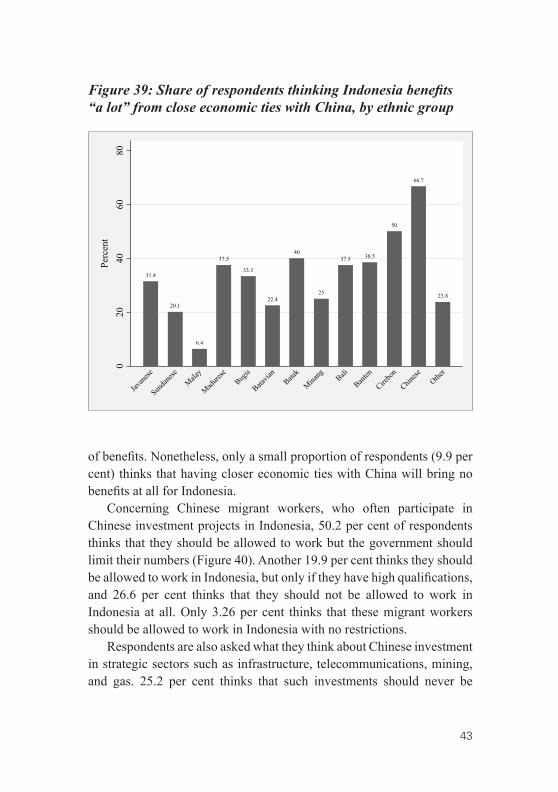
43
of benefits. Nonetheless, only a small proportion of respondents (9.9 per cent) thinks that having closer economic ties with China will bring no benefits at all for Indonesia.
Concerning Chinese migrant workers, who often participate in Chinese investment projects in Indonesia, 50.2 per cent of respondents thinks that they should be allowed to work but the government should limit their numbers (Figure 40). Another 19.9 per cent thinks they should be allowed to work in Indonesia, but only if they have high qualifications, and 26.6 per cent thinks that they should not be allowed to work in Indonesia at all. Only 3.26 per cent thinks that these migrant workers should be allowed to work in Indonesia with no restrictions.
Respondents are also asked what they think about Chinese investment in strategic sectors such as infrastructure, telecommunications, mining, and gas. 25.2 per cent thinks that such investments should never be
Figure 39: Share of respondents thinking Indonesia benefits “a lot” from close economic ties with China, by ethnic group
31.4
20.1
6.4
37.5
33.3
22.4
40
25
37.5 38.5
50
66.7
23.8
020
4060
80Pe
rcen
t
Javan
ese
Sunda
nese
Malay
Madure
seBug
is
Batavia
nBata
k
Minang Bali
Banten
Cirebo
n
Chinese
Other
17-J02520 01 Trends_2017-10.indd 43 25/8/17 10:16 AM
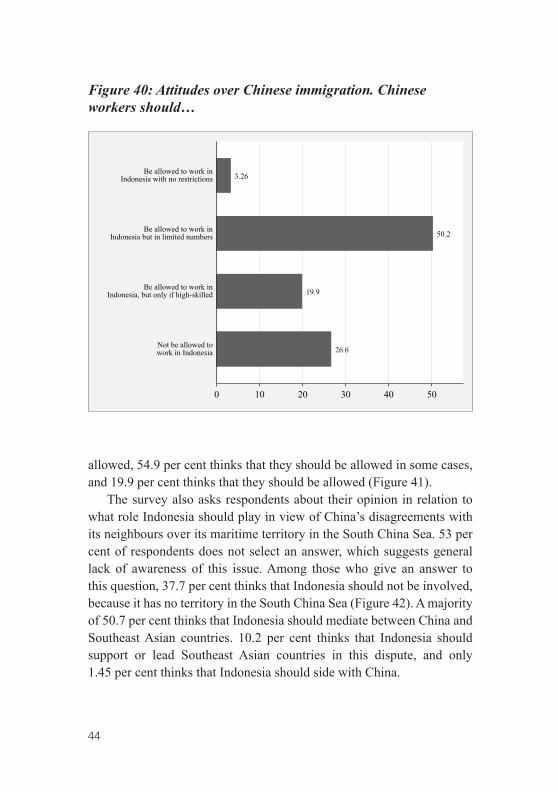
44
Figure 40: Attitudes over Chinese immigration. Chinese workers should…
26.6
19.9
50.2
3.26
0 10 20 30 40 50
Not be allowed towork in Indonesia
Be allowed to work inIndonesia, but only if high-skilled
Be allowed to work inIndonesia but in limited numbers
Be allowed to work inIndonesia with no restrictions
allowed, 54.9 per cent thinks that they should be allowed in some cases, and 19.9 per cent thinks that they should be allowed (Figure 41).
The survey also asks respondents about their opinion in relation to what role Indonesia should play in view of China’s disagreements with its neighbours over its maritime territory in the South China Sea. 53 per cent of respondents does not select an answer, which suggests general lack of awareness of this issue. Among those who give an answer to this question, 37.7 per cent thinks that Indonesia should not be involved, because it has no territory in the South China Sea (Figure 42). A majority of 50.7 per cent thinks that Indonesia should mediate between China and Southeast Asian countries. 10.2 per cent thinks that Indonesia should support or lead Southeast Asian countries in this dispute, and only 1.45 per cent thinks that Indonesia should side with China.
17-J02520 01 Trends_2017-10.indd 44 25/8/17 10:16 AM
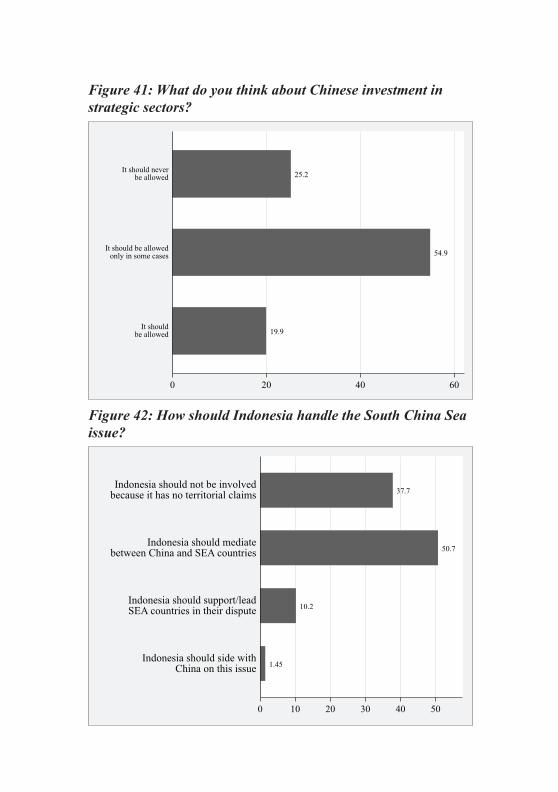
Figure 41: What do you think about Chinese investment in strategic sectors?
19.9
54.9
25.2
0 20 40 60
It shouldbe allowed
It should be allowedonly in some cases
It should neverbe allowed
Figure 42: How should Indonesia handle the South China Sea issue?
1.45
10.2
50.7
37.7
0 10 20 30 40 50
Indonesia should side withChina on this issue
Indonesia should support/leadSEA countries in their dispute
Indonesia should mediatebetween China and SEA countries
Indonesia should not be involvedbecause it has no territorial claims
17-J02520 01 Trends_2017-10.indd 45 25/8/17 10:16 AM

46
Finally, the survey asks respondents for their opinion on the recent disputes between China and Indonesia in the Natuna Sea.23 As with the previous question, there is lack of awareness of this issue, as 59 per cent of respondents does not answer this question. Of the respondents who answer the question, 50.6 per cent thinks that the incidents are alarming as China is encroaching on Indonesia’s territory. 41.6 per cent thinks that the incidents are serious, but caused by illegal fishing (Figure 43). This indicates that respondents are slightly more likely to consider the Natuna Sea issue a national security issue rather than a dispute based on economic interests.
23 China and Indonesia have been clashing over fishing rights in the waters off Indonesia’s Natuna Islands since 2015.
Figure 43: What’s your opinion on recent incidents in the Natuna Sea?
7.76
41.6
50.6
0 10 20 30 40 50
This is a minor matter,the Indonesian government overreacted
The incidents are seriousbut only caused by illegal fishing
These incidents are alarming, Chinais encroaching on Indonesian territory
17-J02520 01 Trends_2017-10.indd 46 25/8/17 10:16 AM

47
5. CONCLUSIONThe survey covers a wide range of issues, from the economy to Islam, Chinese Indonesians, political attitudes and attitudes towards other countries. Not all questions are reported in this paper, but we have given an overview of the key initial findings of this survey.
In terms of the economy, the outlook is mainly optimistic, especially where household economic condition is concerned. President Joko Widodo’s approval rating hovers at around 68 per cent, in line with current opinion polls. In general, respondents think that Widodo has made improvements to the economy since taking office, although there are concerns in terms of the price of necessities and job-seeking prospects. Indeed, when considering the role of the government in the economy, setting the price of gas and staple food and setting a minimum wage are the two items with overwhelming support from respondents.
The Widodo administration, which has made infrastructure development its signature policy thrust, scores well in this aspect of governance. Roads, education and electricity supply remain the infrastructural facilities seen by most respondents as top priorities, while corruption is considered the key impediment to the successful delivery of these facilities. Indeed, corruption is also considered the most important issue facing Indonesia today.
The survey finds that use of the Internet and smartphones, both at around 30 per cent, is not very high. Thus, it is not surprising that the prevalence of respondents’ involvement in the most common e-commerce transactions, such as online shopping, ordering of ride services, and online travel and ticketing, is not high either. This implies that there is still a lot of room for growth in the e-commerce sector of the economy.
Where Islamic piety is concerned, the most common religious practice is prayer at obligatory times, followed by the giving of alms and attendance at Friday prayers. The haj is considered important, but respondents acknowledge that there are practical constraints in fulfilling it. The donning of the hijab is now considered an important outward sign of Islamic religiosity for women in Indonesia, supported by more than 80 per cent of respondents. Indeed, almost 80 per cent of Muslim women surveyed wears the hijab and interestingly, it is becoming more
17-J02520 01 Trends_2017-10.indd 47 25/8/17 10:16 AM

48
common the higher the education and income, suggesting that the Islamic headscarf is getting more popular among Muslim women of higher social class.
An overwhelming 90.9 per cent of Muslim respondents thinks that there will be various benefits to the implementation of shariah law, the most important being that it will safeguard the moral fabric of society. At the same time, the greatest challenges to Islam are not external, such as Christianization or non-Muslim leaders becoming too powerful, but rather, factors that challenge the internal integrity of Islam, such as divisive debates and Islamic leaders’ involvement in politics.
Being conducted in the aftermath of the Jakarta gubernatorial elections, the survey results echo some of the key issues that emerged during the hotly contested electoral campaign in the capital. Punishing blasphemy against Islam is most highly supported by respondents, and 58 per cent of them consider it important to vote a Muslim leader into office, coinciding with the level of support that Purnama’s opponent, Anies Baswedan, received at the polls. This suggests that these issues have currency beyond Jakarta and the gubernatorial election.
It continues to be common for Chinese Indonesians to be perceived as privileged, overly influential and exclusive in Indonesia. One surprising finding is that about 48 per cent of respondents still thinks that Chinese Indonesians may still harbour loyalty towards China, underlining the continuing perception that they are foreign. This is probably why a majority of respondents (64.4 per cent) are uncomfortable with the notion of Chinese Indonesians in positions of political leadership. Nevertheless, more respondents find it acceptable rather than unacceptable to inter-marry with Chinese Indonesians.
On the political front, state institutions, especially the Army, are more highly trusted than politicians. Democracy continues to be seen as a cornerstone of the Indonesian political system, but not considered as being able to solve all of the nation’s problems. Pluralism, as represented by a belief in Pancasila, continues to be a value held onto by an overwhelming majority of respondents, although certain ethnic and religious minorities disagree that minority rights are adequately protected. In terms of decentralization, the majority (80 per cent) of respondents thinks that the
17-J02520 01 Trends_2017-10.indd 48 25/8/17 10:16 AM

49
current system is working well, and a slight majority (53 per cent) prefers decentralized power to reside at the provincial level.
Where political participation is concerned, it is very much limited to voting at elections. This is not surprising since only about 28 per cent of respondents reports being interested in politics, and it is reminiscent of political behaviour in most other democracies around the world. As for participation in associational life, membership in political parties is least common, while membership in religious groups or organizations is the most common, suggesting that civic life is most active in religious circles.
While respondents are proud of their country and identify strongly with Indonesia, they are also relatively open to globalization and having an open economy, although they have more reservations where foreign workers are concerned. Respondents also consider traditional economic partners such as Malaysia, Japan, Singapore and ASEAN to be most important for Indonesia.
With respect to the rise of China, respondents are almost equally divided on whether this has a positive or negative impact on Indonesia. Nevertheless, around 90 per cent thinks that close economic ties with China will bring at least a little benefit. On Chinese migrant workers, around 70 per cent agrees that they should be allowed to work in Indonesia, but with qualifications. Similarly, concerning Chinese investment in strategic sectors of Indonesia, about 75 per cent agrees that it should be allowed, but more than two-thirds of these respondents also feel that such investments should be guided by conditions.
The results from this survey are wide-ranging and suggestive, and we have proposed some preliminary inferences in this report. What has been presented are the major trends, in terms of attitudes and behaviour, with respect to the economy, society, and domestic and international politics. Forthcoming publications will examine this rich data with more rigorous analysis.
17-J02520 01 Trends_2017-10.indd 49 25/8/17 10:16 AM
ISSN 0219-3213
2017 no. 10Trends inSoutheast Asia
THE INDONESIA NATIONAL SURVEY PROJECT: ECONOMY, SOCIETY AND POLITICS
DIEGO FOSSATI, HUI YEW-FOONG AND SIWAGE DHARMA NEGARA
30 Heng Mui Keng TerraceSingapore 119614http://bookshop.iseas.edu.sg
TRS10/17s
7 8 9 8 1 4 7 8 6 4 6 19
ISBN 978-981-4786-46-1