isqs 6339, business intelligence creating data marts zhangxi lin texas tech university 1
TRANSCRIPT

ISQS 6339, Business IntelligenceISQS 6339, Business Intelligence
Creating Data MartsCreating Data MartsZhangxi Lin
Texas Tech University
1
OutlineOutline Illustrative Example : Adventure Works Illustrative Example : Adventure Works
Cycles (AWC) Cycles (AWC) Hands-on Case: Maximum Miniature
ManufacturingData Warehousing with Microsoft SQL Server
2008Exercise 2
Types of DimensionExercise 3
ILLUSTRATIVE EXAMPLE : ILLUSTRATIVE EXAMPLE : ADVENTURE WORKS ADVENTURE WORKS CYCLES (AWC) CYCLES (AWC)
3
Adventure Works Cycles Adventure Works Cycles (AWC)(AWC)A fictitious multinational
manufacturer and seller of bicycles and accessories
Based on Bothell, Washington, USA and has regional sales offices in several countries
http://www.msftdwtoolkit.com/
ISQS 6339, Data Mgmt & BI, Zhangxi Lin 4
Basic Business Basic Business InformationInformationProduct orders by categoryProduct Orders by
Country/RegionProduct Orders by Sales ChannelCustomers by Sales Channel
Snapshot
ISQS 6339, Data Mgmt & BI, Zhangxi Lin 5
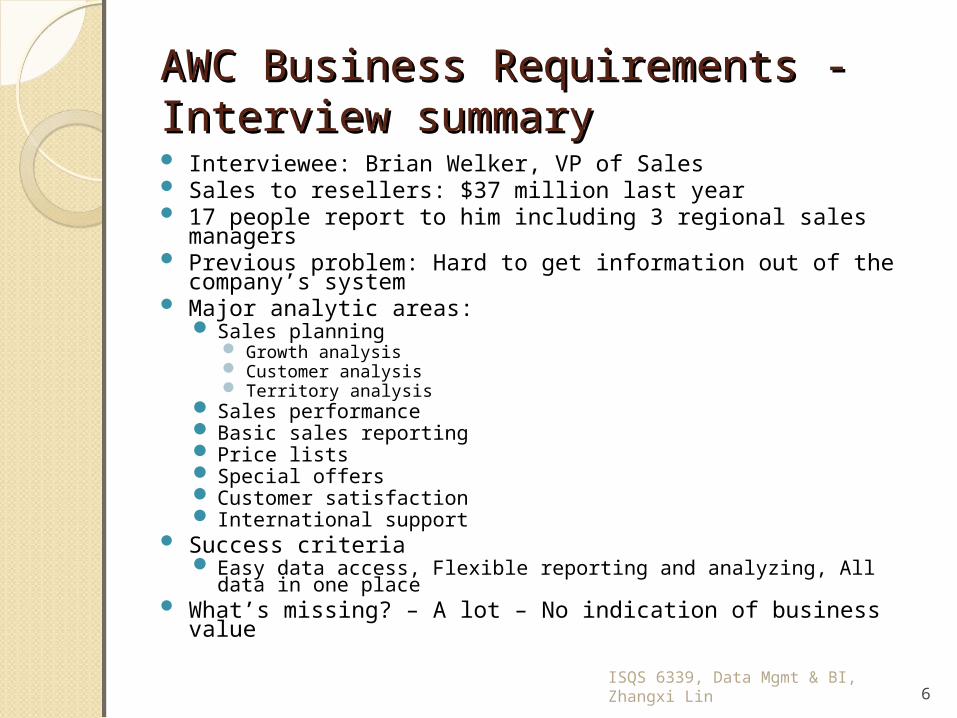
AWC Business Requirements - AWC Business Requirements - Interview summary Interview summary Interviewee: Brian Welker, VP of Sales Sales to resellers: $37 million last year 17 people report to him including 3 regional sales managers Previous problem: Hard to get information out of the company’s
system Major analytic areas:
Sales planning Growth analysis Customer analysis Territory analysis
Sales performance Basic sales reporting Price lists Special offers Customer satisfaction International support
Success criteria Easy data access, Flexible reporting and analyzing, All data in one
place What’s missing? – A lot – No indication of business value
ISQS 6339, Data Mgmt & BI, Zhangxi Lin 6

Business ProcessesBusiness ProcessesPurchase OrdersDistribution Center Deliveries Distribution Center InventoryStore DeliveriesStore InventoryStore Sales
ISQS 6339, Data Mgmt & BI, Zhangxi Lin 7
Analytic ThemesAnalytic ThemesSee the Excel file \\TechShare\coba\d\
isqs3358\Repository\AWC\AW_Analytic_Themes_List.xls
SQL Server 2008 R2 – Data Warehousing Scaling and Performance 41’28”
ISQS 6339, Data Mgmt & BI, Zhangxi Lin 8
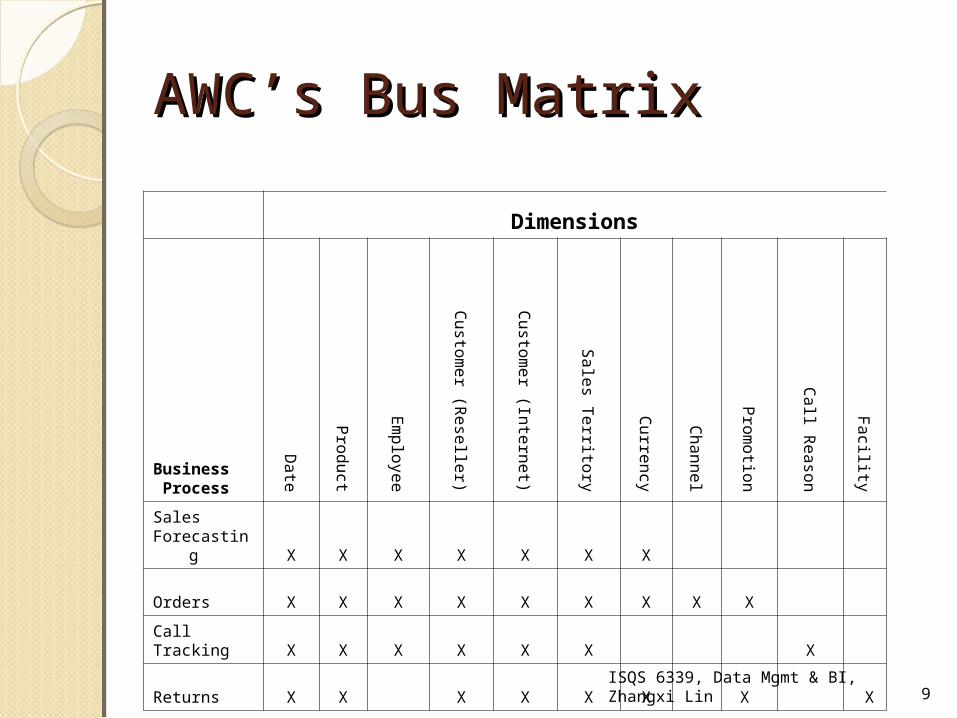
AWC’s Bus MatrixAWC’s Bus Matrix
Dimensions
Business Process
Da
te
Pro
du
ct
Em
plo
yee
Cu
stom
er (R
ese
ller)
Cu
stom
er (In
tern
et)
Sa
les T
errito
ry
Cu
rren
cy
Ch
an
ne
l
Pro
mo
tion
Ca
ll Re
aso
n
Fa
cility
Sales Forecasting X X X X X X X
Orders X X X X X X X X X
Call Tracking X X X X X X X
Returns X X X X X X X X
ISQS 6339, Data Mgmt & BI, Zhangxi Lin 9
ISQS 6339, Data Mgmt & BI, Zhangxi Lin 10
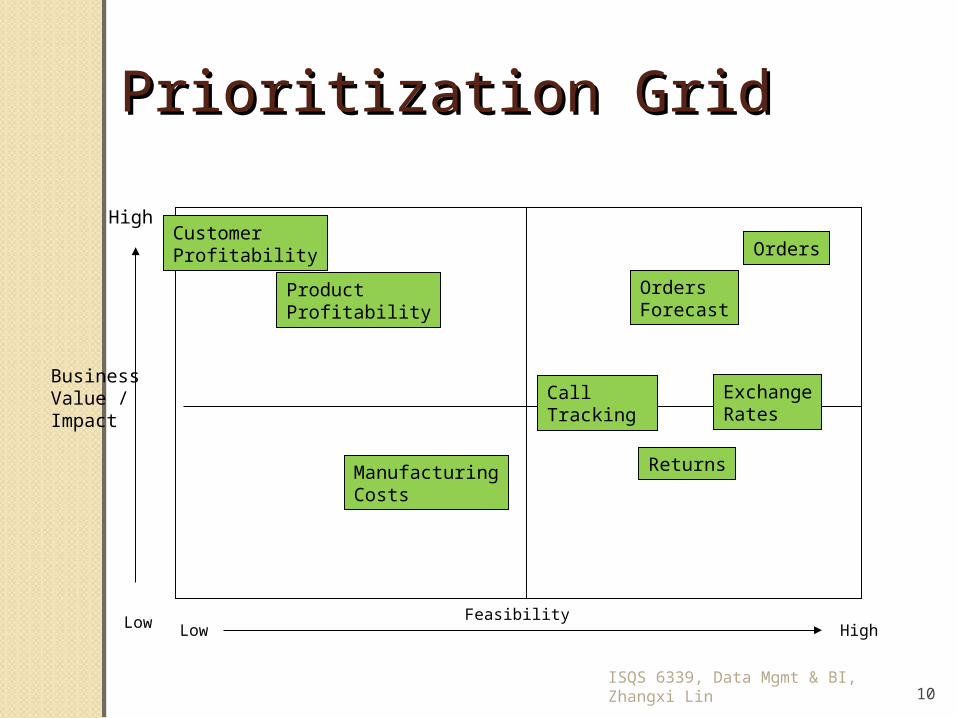
Prioritization GridPrioritization Grid
Orders
OrdersForecast
CallTracking
ExchangeRates
ReturnsManufacturingCosts
CustomerProfitability
ProductProfitability
FeasibilityHighLow
High
Low
BusinessValue / Impact
HANDS-ON CASE: HANDS-ON CASE: MAXIMUM MINIATURE MAXIMUM MINIATURE MANUFACTURINGMANUFACTURING
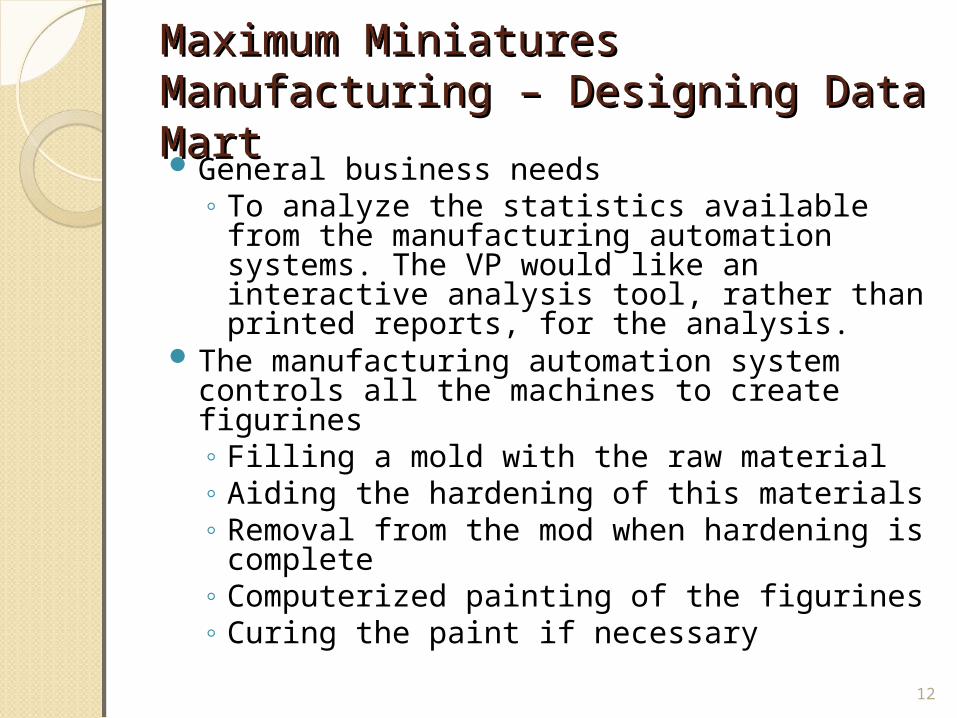
Maximum Miniatures Maximum Miniatures Manufacturing – Designing Data Manufacturing – Designing Data MartMart General business needs
◦ To analyze the statistics available from the manufacturing automation systems. The VP would like an interactive analysis tool, rather than printed reports, for the analysis.
The manufacturing automation system controls all the machines to create figurines◦ Filling a mold with the raw material◦ Aiding the hardening of this materials◦ Removal from the mod when hardening is
complete◦ Computerized painting of the figurines◦ Curing the paint if necessary
12
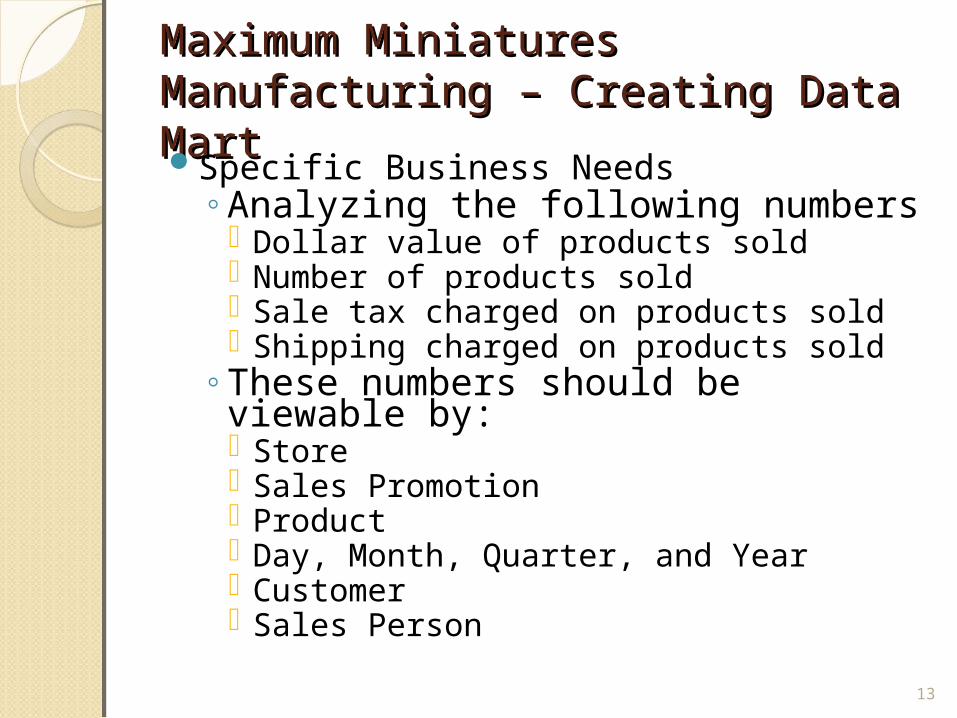
Maximum Miniatures Maximum Miniatures Manufacturing – Creating Data MartManufacturing – Creating Data MartSpecific Business Needs
◦Analyzing the following numbers Dollar value of products sold Number of products sold Sale tax charged on products sold Shipping charged on products sold
◦These numbers should be viewable by: Store Sales Promotion Product Day, Month, Quarter, and Year Customer Sales Person
13
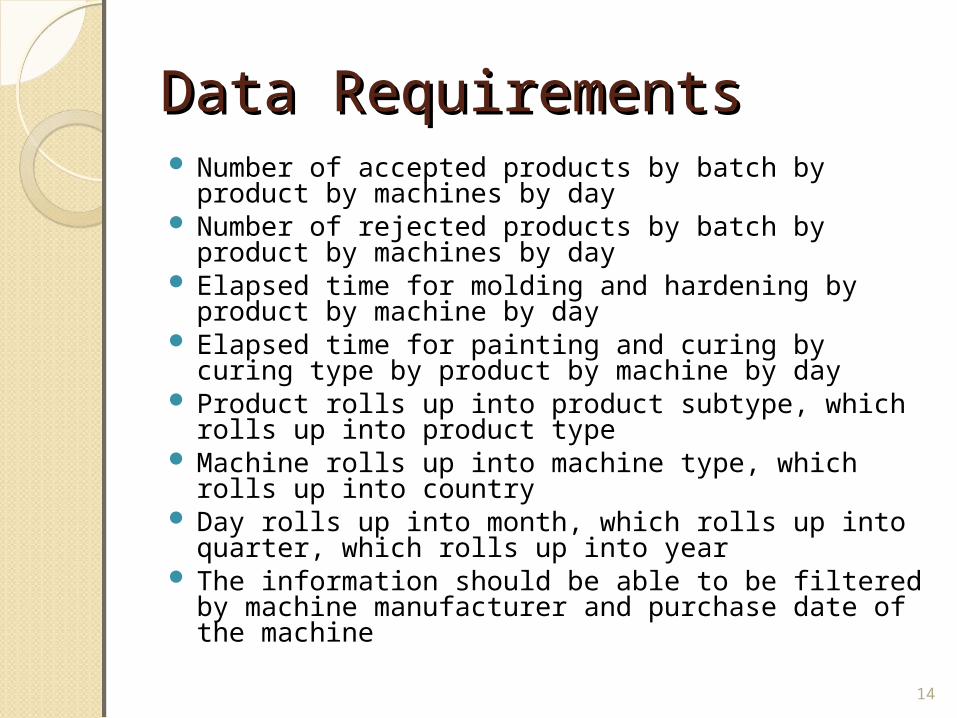
Data RequirementsData Requirements Number of accepted products by batch by product
by machines by day Number of rejected products by batch by product
by machines by day Elapsed time for molding and hardening by product
by machine by day Elapsed time for painting and curing by curing type
by product by machine by day Product rolls up into product subtype, which rolls
up into product type Machine rolls up into machine type, which rolls up
into country Day rolls up into month, which rolls up into quarter,
which rolls up into year The information should be able to be filtered by
machine manufacturer and purchase date of the machine
14

Business Need of SalesBusiness Need of SalesThe VP of sales for Max Min, Inc. would like
to analyze sales information. This information is collected by three OLTP systems: the Order Processing System, the Point of Sale (POS) system, and the MaxMin.com Online system.
To analyze the following numbers◦ Dollar value of products sold◦ Number of products sold◦ Sales tax charged on product sold◦ Shipping charged on product sold
These number should be viewable by: store, sales promotion, product, time, customer, sales person
15
16
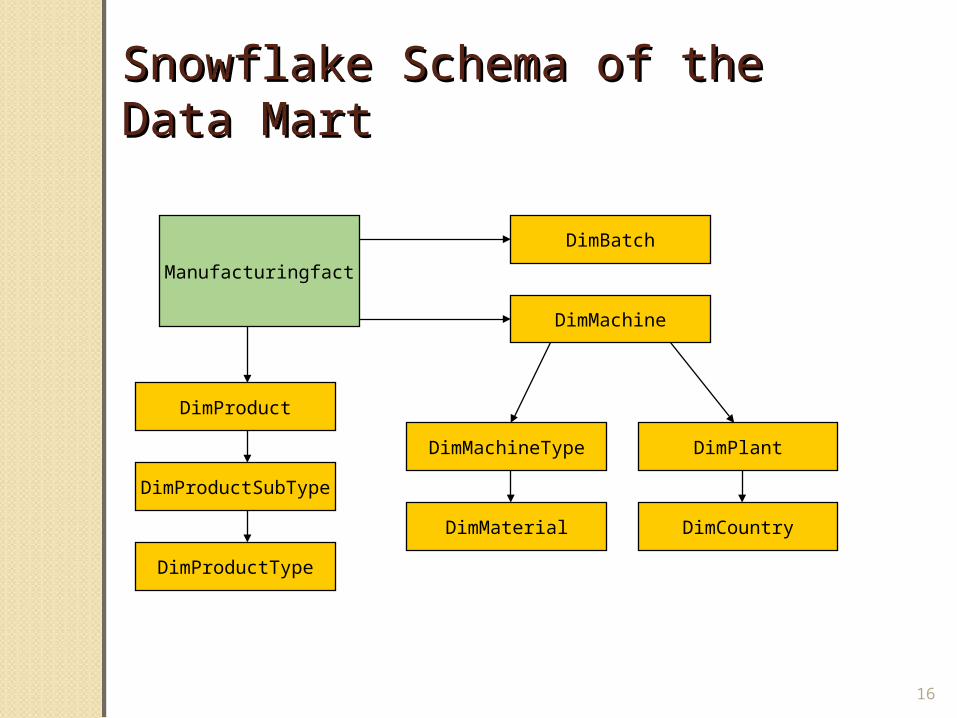
Snowflake Schema of the Data Snowflake Schema of the Data MartMart
Manufacturingfact
DimProduct
DimProductSubType
DimProductType
DimBatch
DimMachine
DimMachineType
DimMaterial
DimPlant
DimCountry
DATA WAREHOUSING DATA WAREHOUSING WITH MICROSOFT WITH MICROSOFT SQL SERVER 2008SQL SERVER 2008
ISQS 6339, Data Mgmt & BI, Zhangxi Lin 17

Unified Dimensional Model Unified Dimensional Model (UDM)(UDM) A SQL Server 2008 technology A UDM is a structure that sits over the top of a data
mart and looks exactly like an OLAP system to the end user.
Advantages◦ No need for a data mart. ◦ Can be built over one or more OLTP systems. ◦ Mixed data mart and OLTP system data◦ Can include data from database from other vendors and
XML-formatted data◦ Allows OLAP cubes to be built directly on top of
transactional data◦ Low latency◦ Ease of creation and maintenance
Features◦ Data sources◦ Data views◦ Proactive caching for preprocessed aggregates
ISQS 6339, Data Mgmt & BI, Zhangxi Lin 18
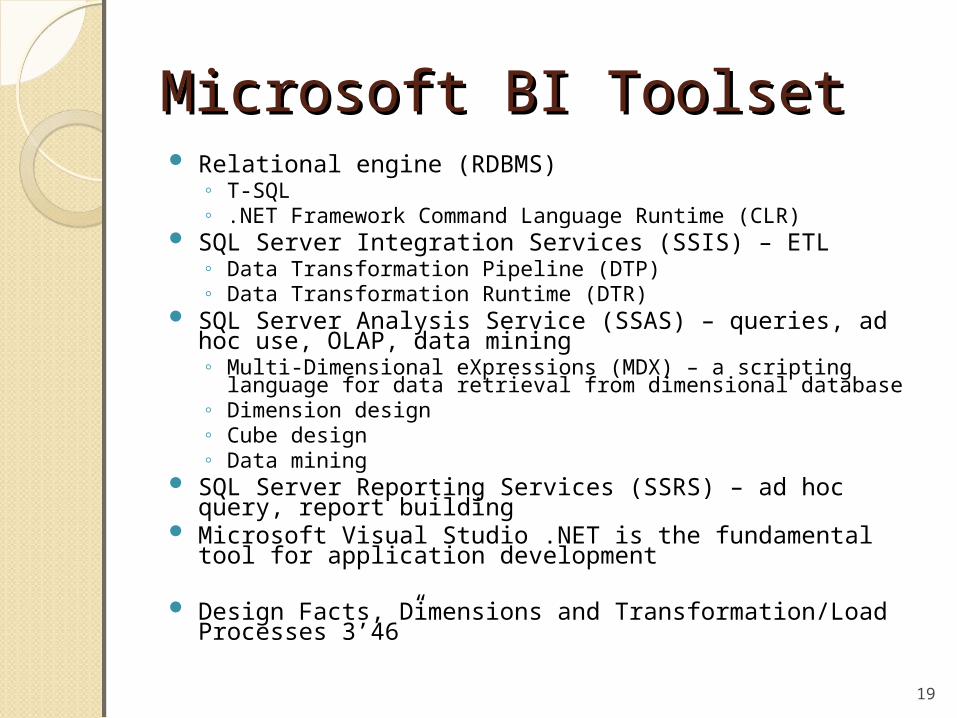
Microsoft BI ToolsetMicrosoft BI Toolset Relational engine (RDBMS)
◦ T-SQL◦ .NET Framework Command Language Runtime (CLR)
SQL Server Integration Services (SSIS) – ETL◦ Data Transformation Pipeline (DTP)◦ Data Transformation Runtime (DTR)
SQL Server Analysis Service (SSAS) – queries, ad hoc use, OLAP, data mining◦ Multi-Dimensional eXpressions (MDX) – a scripting language for
data retrieval from dimensional database ◦ Dimension design◦ Cube design◦ Data mining
SQL Server Reporting Services (SSRS) – ad hoc query, report building
Microsoft Visual Studio .NET is the fundamental tool for application development
Design Facts, Dimensions and Transformation/Load Processes 3’46”
19
20
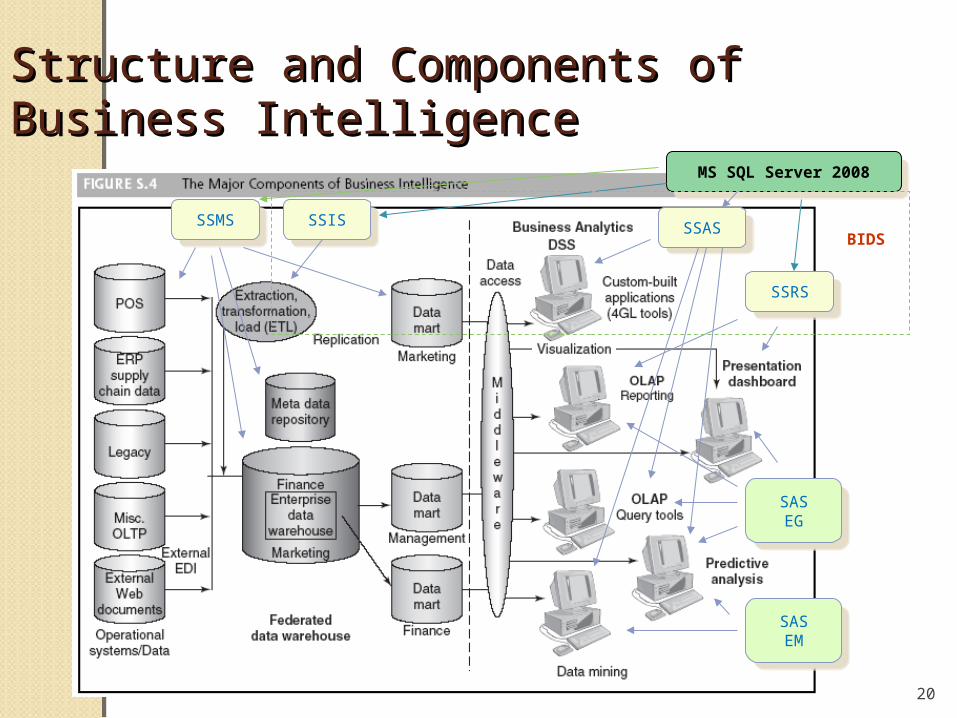
Structure and Components of Structure and Components of Business IntelligenceBusiness Intelligence
SSMSSSMS SSISSSISSSASSSAS
SSRSSSRS
SASEM
SASEM
SASEG
SASEG
MS SQL Server 2008MS SQL Server 2008
BIDS

OLAP ArchitectureOLAP Architecture◦ ROLAP – Relational OLAP
Stores cube structure in a multidimensional database. Measures are left in the relational data mart. The preprocessed aggregates are also stored in a
relational database table.
◦ Multidimensional OLAP (MOLAP) Cube structure and preprocessed aggregates -
multidimensional database A copy of measures is also access in multidimensional
database Faster but takes extra time to copy measures -
latency
◦ Hybrid OLAP (HOLAP) Measures is stored in relational database
Disadvantages of OLAPDisadvantages of OLAPComplexity to administerRequires data martLatencyRead-only
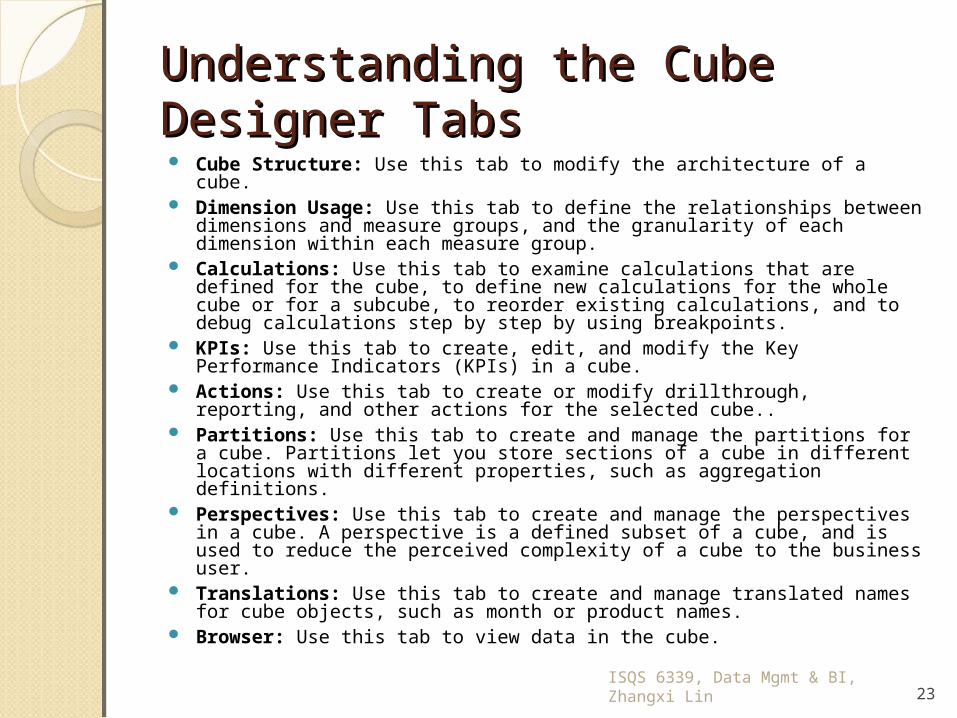
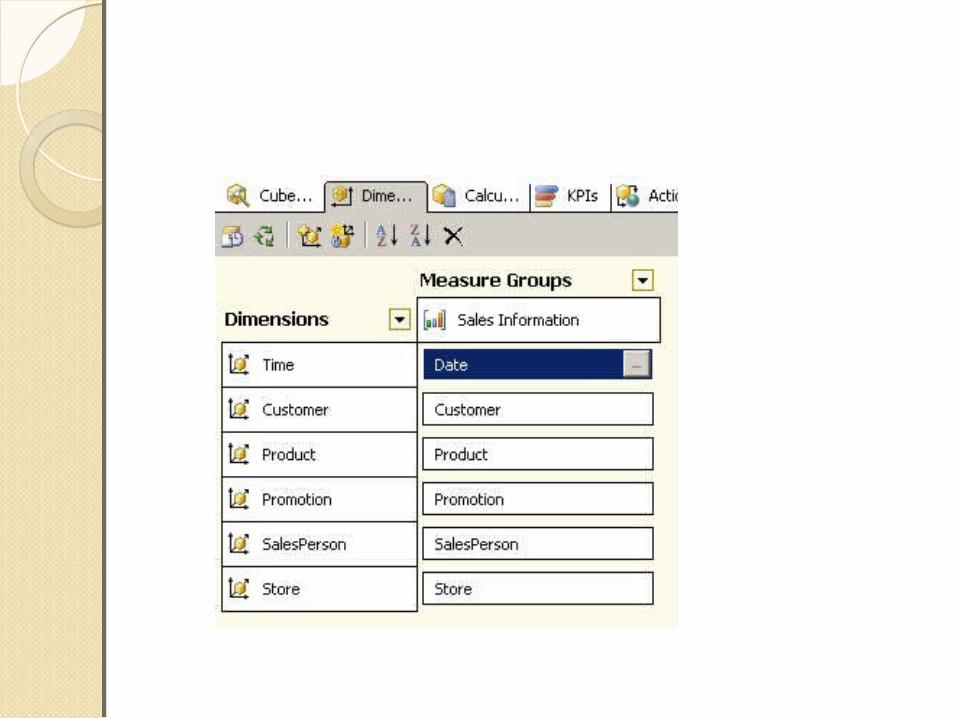
Understanding the Cube Understanding the Cube Designer Tabs Designer Tabs Cube Structure: Use this tab to modify the architecture of a cube. Dimension Usage: Use this tab to define the relationships between
dimensions and measure groups, and the granularity of each dimension within each measure group.
Calculations: Use this tab to examine calculations that are defined for the cube, to define new calculations for the whole cube or for a subcube, to reorder existing calculations, and to debug calculations step by step by using breakpoints.
KPIs: Use this tab to create, edit, and modify the Key Performance Indicators (KPIs) in a cube.
Actions: Use this tab to create or modify drillthrough, reporting, and other actions for the selected cube..
Partitions: Use this tab to create and manage the partitions for a cube. Partitions let you store sections of a cube in different locations with different properties, such as aggregation definitions.
Perspectives: Use this tab to create and manage the perspectives in a cube. A perspective is a defined subset of a cube, and is used to reduce the perceived complexity of a cube to the business user.
Translations: Use this tab to create and manage translated names for cube objects, such as month or product names.
Browser: Use this tab to view data in the cube.
ISQS 6339, Data Mgmt & BI, Zhangxi Lin 23
TYPES OF DIMENSIONTYPES OF DIMENSION
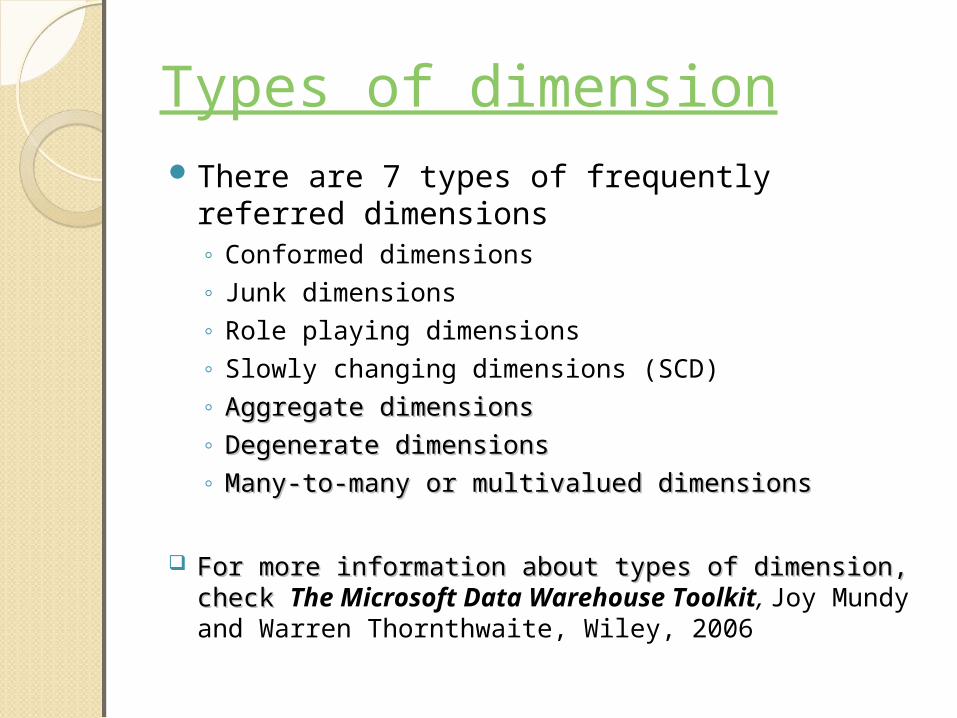
Types of dimensionThere are 7 types of frequently referred
dimensions◦ Conformed dimensions◦ Junk dimensions◦ Role playing dimensions◦ Slowly changing dimensions (SCD)◦ Aggregate dimensionsAggregate dimensions◦ Degenerate dimensionsDegenerate dimensions◦ Many-to-many or multivalued dimensionsMany-to-many or multivalued dimensions
For more information about types of dimension, check For more information about types of dimension, check The Microsoft Data Warehouse Toolkit, Joy Mundy and Warren Thornthwaite, Wiley, 2006

Conformed DimensionsConformed DimensionsA set of data attributes that have been physically
implemented in multiple database tables using the same structure, attributes, domain values, definitions and concepts in each implementation.
Dimension tables are not conformed if the attributes are labeled differently or contain different values.
Conformed dimensions come in several different flavors. At the most basic level, conformed dimensions mean exactly the same thing with every possible fact table to which they are joined.
E.g. The date dimension table connected to the sales facts and the one connected to the inventory facts.
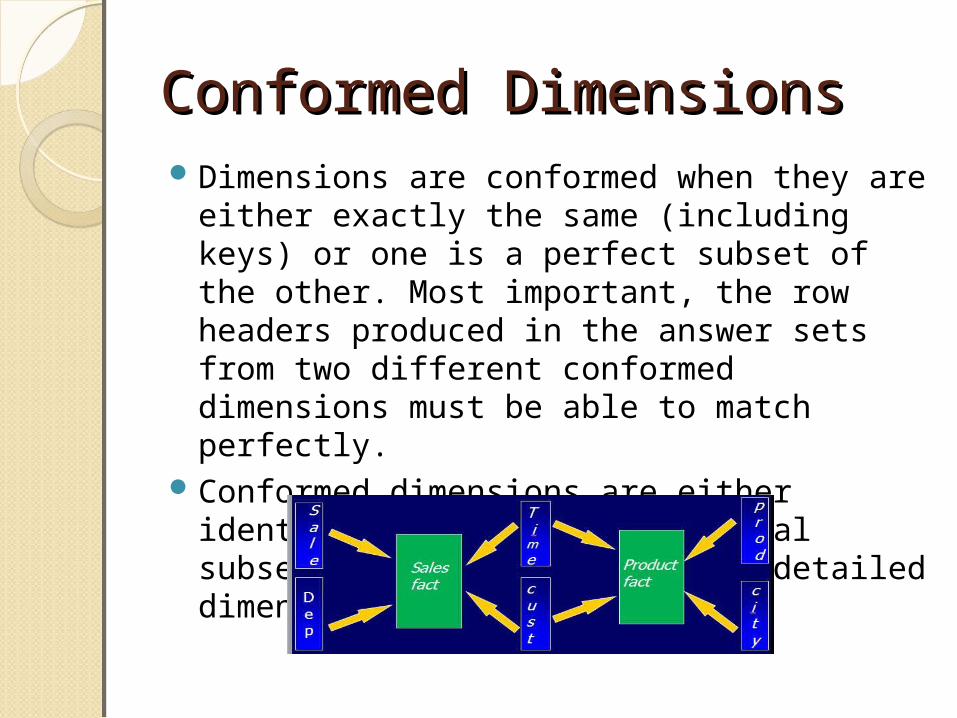
Conformed DimensionsConformed DimensionsDimensions are conformed when they are
either exactly the same (including keys) or one is a perfect subset of the other. Most important, the row headers produced in the answer sets from two different conformed dimensions must be able to match perfectly.
Conformed dimensions are either identical or strict mathematical subsets of the most granular, detailed dimension.
Junk DimensionsJunk Dimensions Also called miscellaneous or mystery dimensions They are miscellaneous attributes that don’t
belong to any existing dimension. Typically flags or indictors that describe or
categorize the transaction in some way. Contents are often important Four alternatives for dealing with them
◦ Leave them in the fact table◦ Create a separate dimension for each attribute◦ Omit them◦ Group them into a single junk dimension
28
Degenerate DimensionsDegenerate DimensionsA degenerate dimension is a dimension
key in the fact table that does not have its own dimension table, because all the interesting attributes have been placed in analytic dimensions.
Features◦ No description of its own◦ No joining to an actual dimension table◦ No attributes
Example: transaction ID
29

Junk Dimension ExampleJunk Dimension Example
Role-playing dimensionsRole-playing dimensions
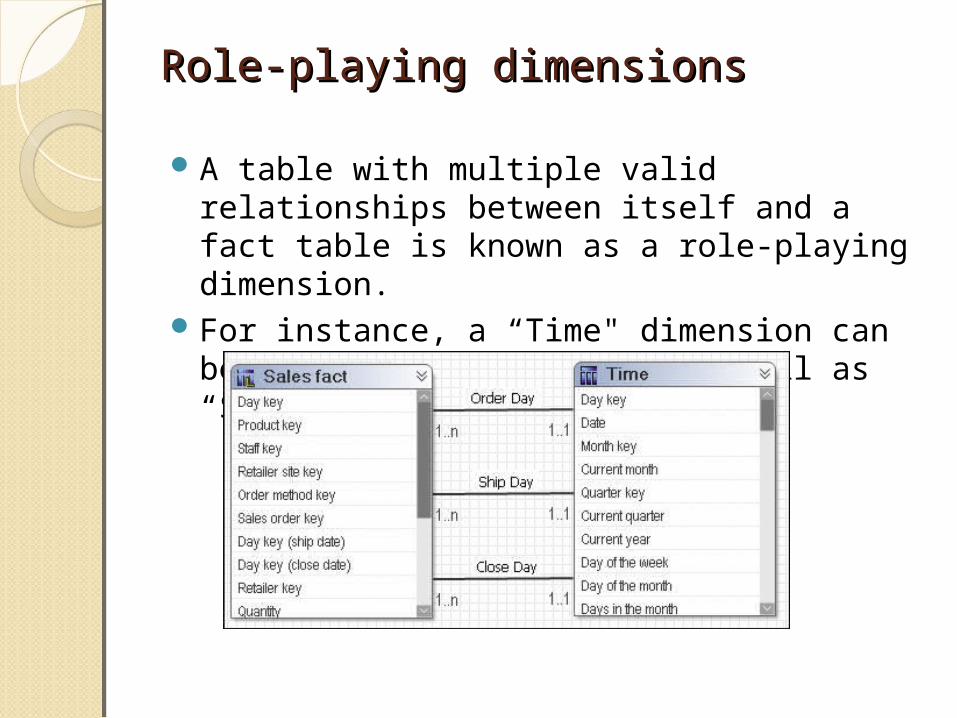
A table with multiple valid relationships between itself and a fact table is known as a role-playing dimension.
For instance, a “Time" dimension can be used for “Order Day", as well as “Ship Date", or “Close Day".
Slowly Changing Slowly Changing DimensionsDimensionsThe dimensions that have changeable
attribute values are slowly changing dimensions (SCDs)
The attribute values of SCD may change over time, which are critical to understand the dynamics of the business. The ability to track the changes of facts over time is critical to a DW/BI system.
Examples◦ Employees changed their departments◦ Home moving (16.8% American moved per
year) – zip code changes possible.More information
32
Three Types of SCDThree Types of SCDType 1 SCD overwrites the existing
attribute value with a new value. You don’t care about keeping track of historical values
Type 2 SCD change tracking – ETL process creates a new row in the dimension table to capture the new values of the changed item
Type 3 SCD – Similar to Type 2 SCD but only track current state and the original state; two additional attribute: SCD Start Date, SCD Initial Value
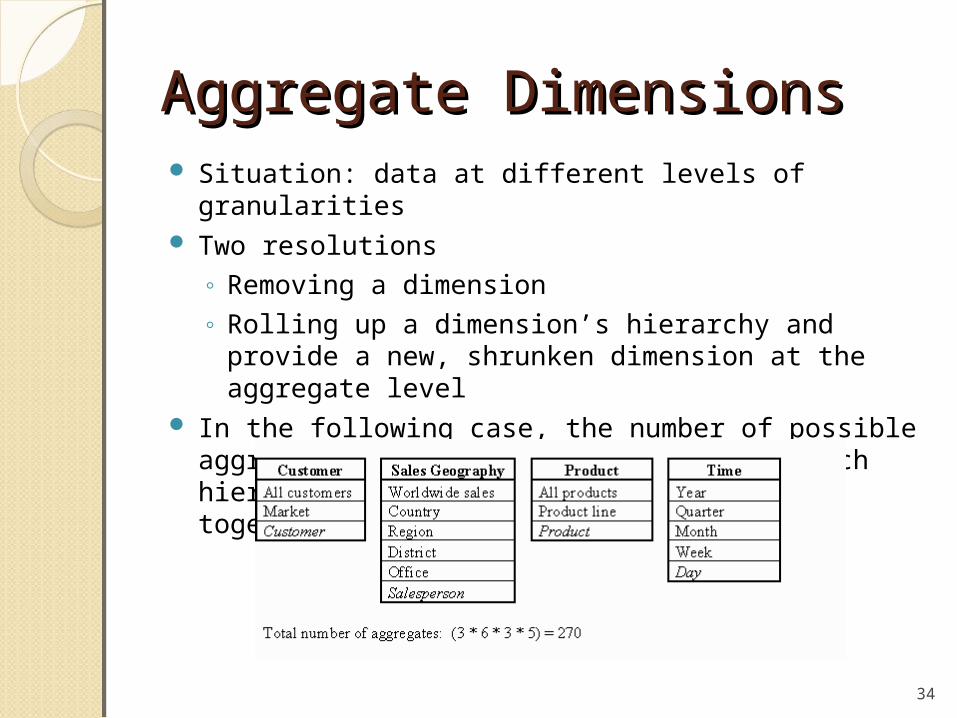
Aggregate DimensionsAggregate Dimensions Situation: data at different levels of granularities Two resolutions
◦ Removing a dimension◦ Rolling up a dimension’s hierarchy and provide a
new, shrunken dimension at the aggregate level In the following case, the number of possible
aggregates is the number of levels in each hierarchy of each dimension multiplied together.
34
Many-to-many or Multivalued Many-to-many or Multivalued DimensionsDimensionsRelationship between a dimension table and
fact table is called one-to-many: one row in the dimension table may join to many rows in the fact table.
Many-to-many or Multivalued Dimensions are referred to as there are more than one row in a dimension table joining to multiple rows in a fact table
Bridge table supports many-to-many relationship: ◦ fact-dimension◦ dimension-dimension.
35

Many-to-many or Multivalued Many-to-many or Multivalued DimensionsDimensions A dimensional model for a sales
fact that captures multiple sales reasons
EXERCISE 2EXERCISE 2
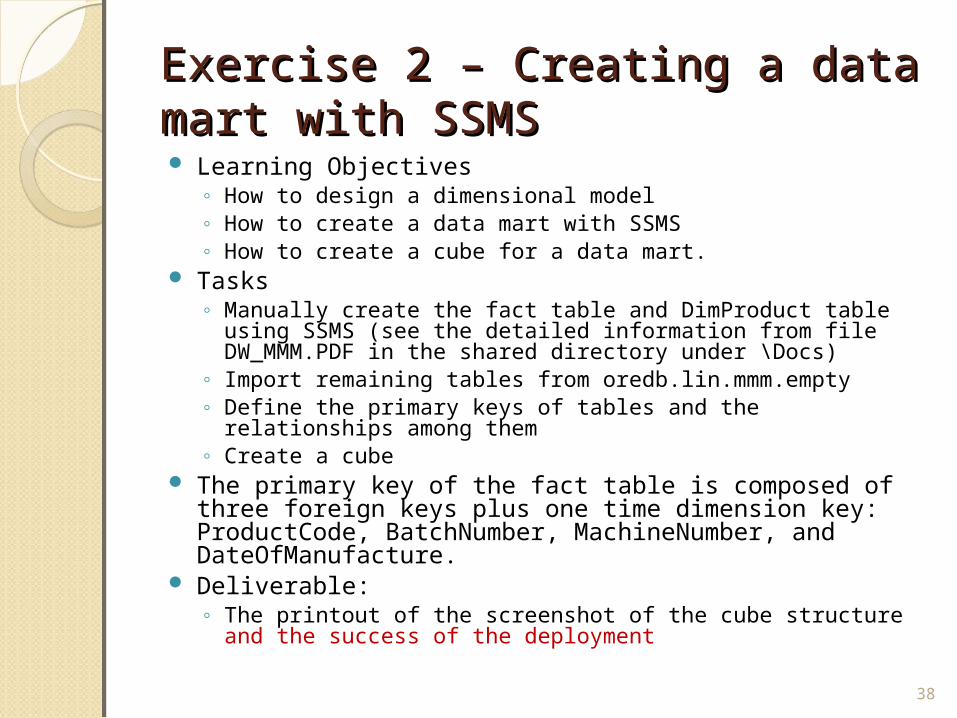
Exercise 2 – Creating a data mart Exercise 2 – Creating a data mart with SSMSwith SSMS Learning Objectives
◦ How to design a dimensional model◦ How to create a data mart with SSMS◦ How to create a cube for a data mart.
Tasks◦ Manually create the fact table and DimProduct table using
SSMS (see the detailed information from file DW_MMM.PDF in the shared directory under \Docs)
◦ Import remaining tables from oredb.lin.mmm.empty◦ Define the primary keys of tables and the relationships
among them◦ Create a cube
The primary key of the fact table is composed of three foreign keys plus one time dimension key: ProductCode, BatchNumber, MachineNumber, and DateOfManufacture.
Deliverable: ◦ The printout of the screenshot of the cube structure and the
success of the deployment
38

Hints for Deploying the OLAP Hints for Deploying the OLAP CubeCube Due to the security
restrictions, you need to:◦ Double click the
entry in Data Source
◦ Type in your eRaider login information in the Impersonation Information panel
◦ Change the server to OREDB
39
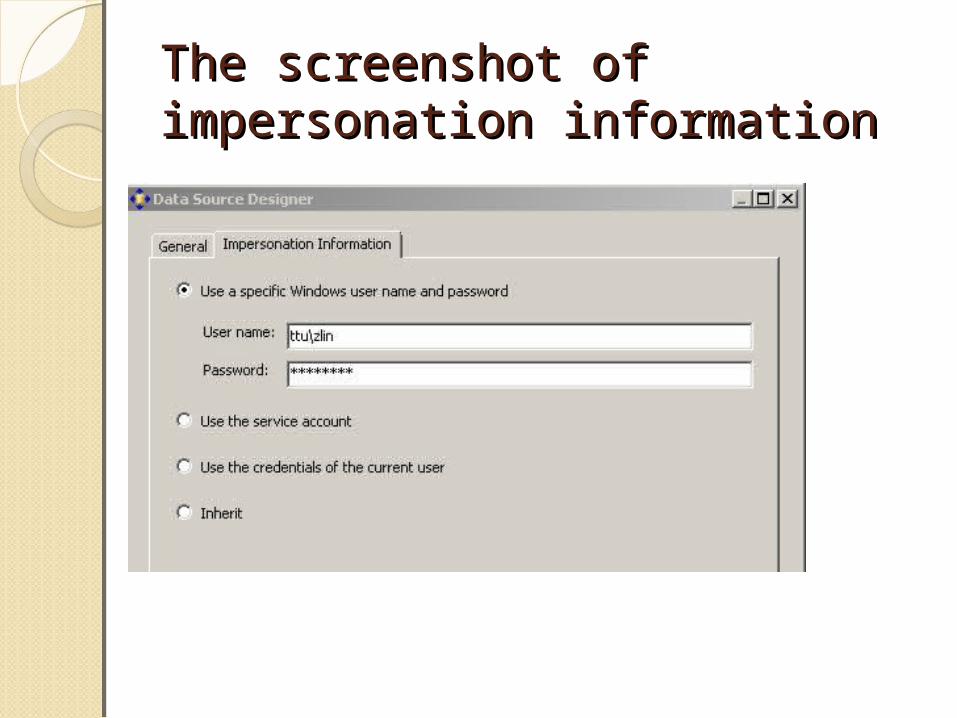
The screenshot of The screenshot of impersonation informationimpersonation information
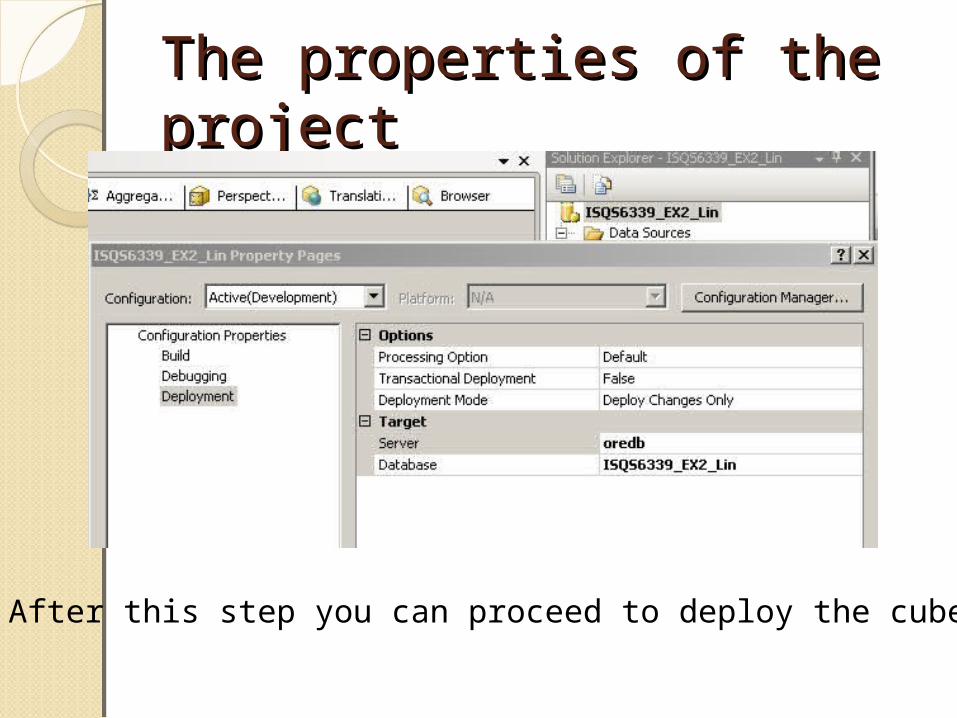
The properties of the The properties of the projectproject
After this step you can proceed to deploy the cube
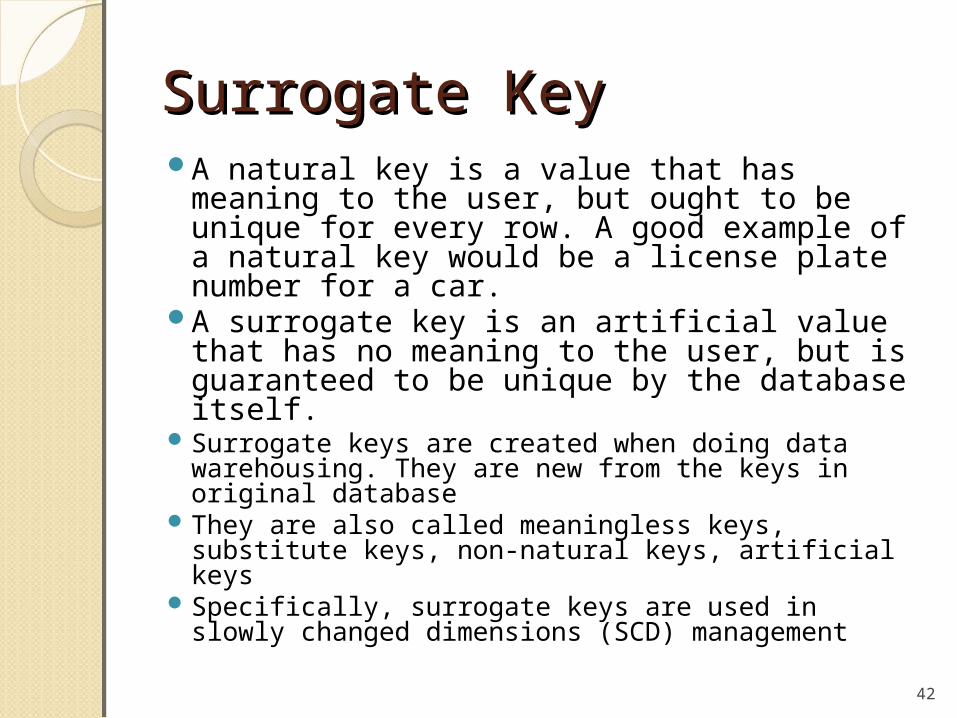
Surrogate KeySurrogate KeyA natural key is a value that has meaning
to the user, but ought to be unique for every row. A good example of a natural key would be a license plate number for a car.
A surrogate key is an artificial value that has no meaning to the user, but is guaranteed to be unique by the database itself.
Surrogate keys are created when doing data warehousing. They are new from the keys in original database
They are also called meaningless keys, substitute keys, non-natural keys, artificial keys
Specifically, surrogate keys are used in slowly changed dimensions (SCD) management
42

Benefits of surrogate Benefits of surrogate keyskeysProtect the DW/BI system from
changes in the source systemAllow the DW/BI system to integrate
data from multiple source systemEnable developers to add rows to
dimensions that do not exist in the source system
Provide the means for tacking changes in dimension
Are efficient in the relational database and analysis services
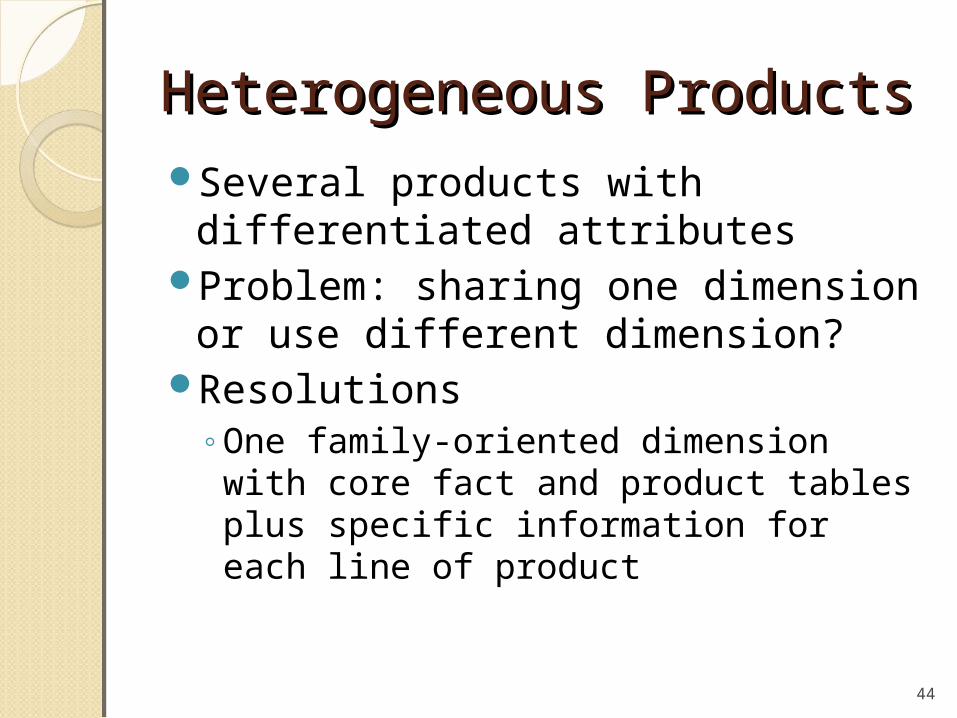
Heterogeneous ProductsHeterogeneous ProductsSeveral products with
differentiated attributesProblem: sharing one dimension
or use different dimension?Resolutions
◦One family-oriented dimension with core fact and product tables plus specific information for each line of product
44
EXERCISE 3EXERCISE 3

Exercise 3 – Creating a data mart Exercise 3 – Creating a data mart with SSAS with SSAS ◦ Learning Objectives
Learn an alternative way to create a data mart How to deploy a data mart
◦ Tasks: Create data mart MaxMinSales2014.<lastname> with BIDS from a cube
template Deploy the data mart
Deliverable: The printout of the screenshot of the cube structure and the success of
the deployment
Reference: DW pp119-130. Also check file MaxMinSalesDM.pdf in \Docs of the shared network drive.
View videos: Create data mart with BIDS 8’34”, Add in more attributes to the database 5’42”, Cube Deployment 3’11”
46
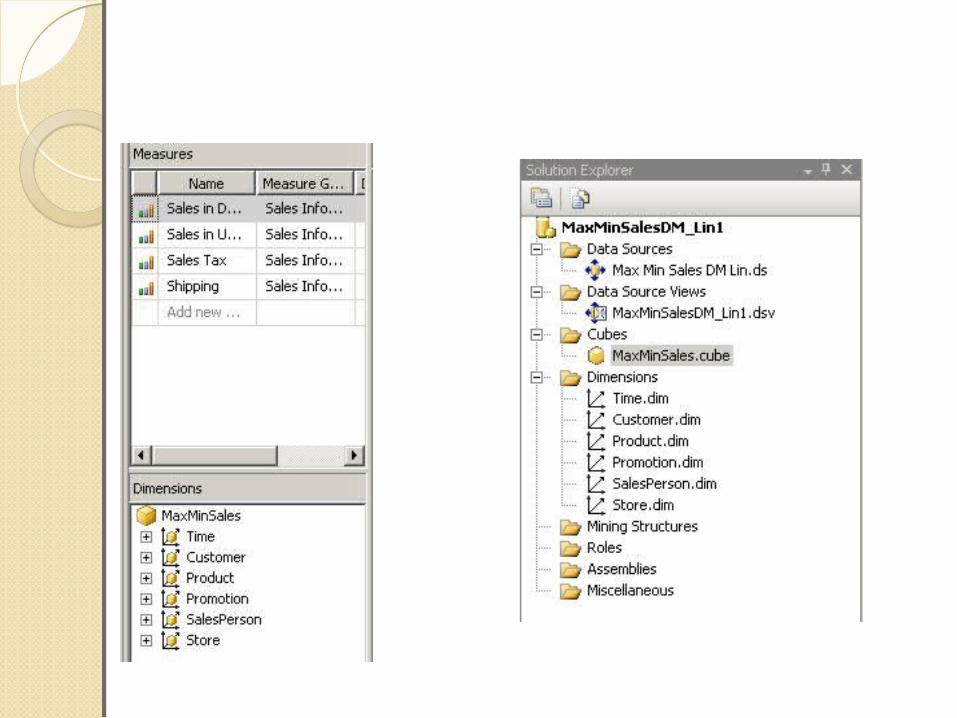
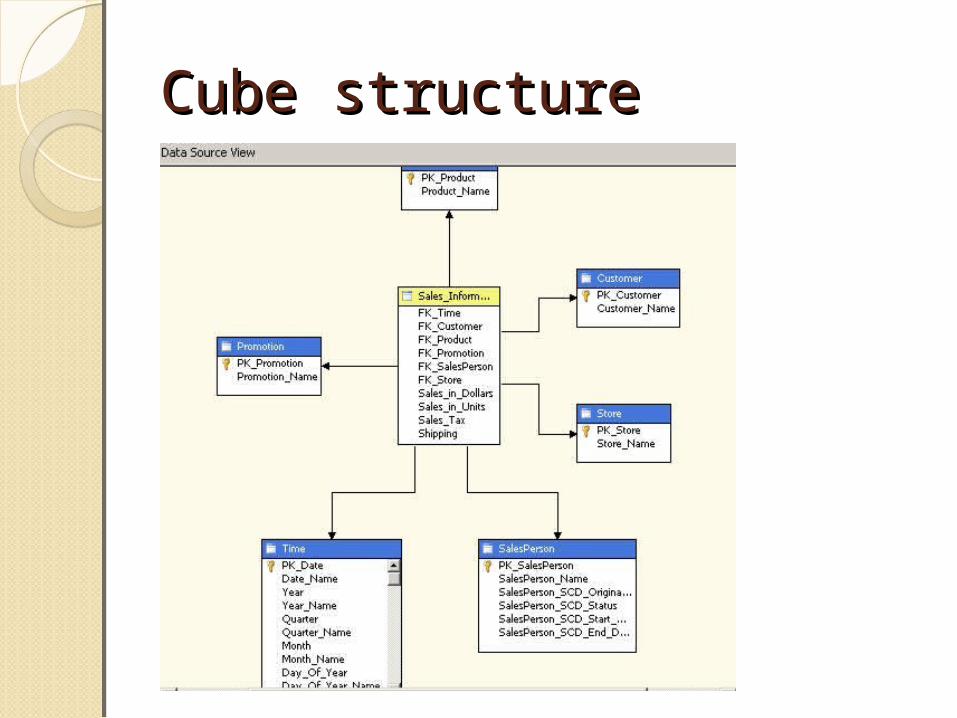
Cube structureCube structure
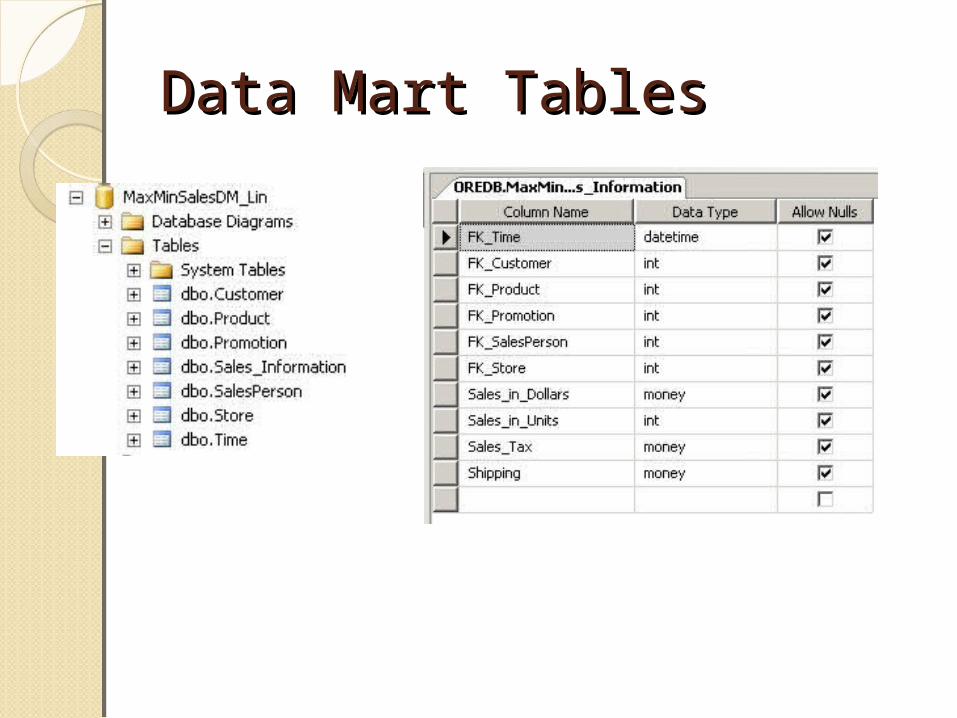
Data Mart TablesData Mart Tables