isothermal dehumidification of air in a parallel … · ill.ill tp-252-2630 1 isothermal...
TRANSCRIPT
SERl/TP-252-2630
UC Category: 59a
DE85008819
Isothermal Dehumidification of Air in a Parallel Passage Configuration
Ahmad A. Pesaran
Federica Zangrando
June 1985
Prepared for the ASME/AIChE
National Heat Transfer Conference
Denver, Colorado
4 - 7 August 1985
Prepared under Task No. 3009.10
FTP No. 467
Solar Energy Research Institute A Division of Midwest Research Institute
1617 Cole Boulevard
Golden, Colorado 80401
Prepared for the
U.S. Department of Energy Contract No. DE-AC02-83CH10093 ·
NOTICE
This report was prepared as an account of work sponsored by the United States Government. Neither the United States nor the United States Department of Energy, nor any of their employees, nor any of their contractors. subcontractors, or their employees, makes any warranty, expressed or implied, or assumes any legal liability or responsibility for the accuracy. completeness or usefulness of any information, apparatus. product or process disclosed, or represents that its use would not infringe privately owned rights.
Printed in the United States of America Available from:
National Technical Information Service U.S. Department of Commerce
5285 Port Royal Road Springfield, VA 22161
Price: Microfiche A01 Printed Copy A02
Codes are used for pricing all publications. The code is determined by the number of pages in the publication. Information pertaining to the pricing codes can be found in the current issue of the following publications. which are generally available 1n most libraries: Energy Research Abstracts. ; ERAJ:. Government Reports Announcements and Index (GRA and I): Scientific and Technical Abstract Reports! STAR); and publication. NTIS-PR-360 available from NTIS at the above address.
5-=�· � � ill.Ill � TP-252-2630
1
Isothermal Dehumidification of Air in a Parallel Passage Configuration
Ahmad A. Pesaran Federica Zangrando
Solar Energy Research Institute 1617 Cole Boulevard
Golden, Colorado 80401
ABSTRACT
The performance of a single parallel passage of a dehumidifier was examined under isothermal conditions both experimentally and theoretically. The passage was coated with silica gel using a polyester tape. The transient response of the silica gel test cells to a step change in air inlet humidity was obtained experimentally and compared with the predictions of a pseudogas-side-controlled mass transfer model. The transient response of the test cell depended on the air flow rate, aspect ratio, and temperature. Although the general trend of the experimental and predicted results were similar, the comparisons were not satisfactory. The observed discrepancies were attributed to the uncertainties in the pseudo-gas-side mass transfer coefficient and equilibrium isotherm.
NOMENCLATURE
2A cross-sectional area of bed (m )
d average particle diameter (m) 2D diffusivity of water vapor in air (m /s)12
DAR desiccant-to-air ratio, P AL/b ; ' G f friction factor H height of flow channel (m)
D hydraulic diameter of channel (m) h 2 K gas-side mass transfer �oefficient (kg/m s) G
2 K overall mass transfer coefficient (kg/m s)o A L length of desiccant bed (m)
m water vapor mass fraction, mass of water vapor/mass of moist air (kg/kg) dry mass of desiccant (kg) mass flow rate of gas mixture (kg/s)
2 n mass flux of water (kg/m s)
number of transfer units, K pL/m0A G
Nu mass transfer Nusselt number, K DG /h po12p perimeter of bed (m) p pressure (torrs) . 3Q air flow rate through test cell (m /s)Re Reynolds number Sc Schmidt number
heat transfer Stanton number mass transfer Stanton number time (s)
breakthrough time (s), see Fig. 4 dimensionless time, t/o
T temperature (°C) w absolute humidity ratio, mass of water vapor/
dry mass of air. (kg/kg) * w normalized humidity, w - w /w - w0 in 0
w average desiccant water content, mass of water/dry mass of desiccant (kg/kg)
x entrance length (m) y thickness of Lexan sheets (m) z streamwise coordinate (m)
* z dimensionless coordinate, z/L
mass transfer coefficient ratio, K /KG 0A 15 thickness of polyester tape (m) b. passage width (m)
3- -p - - density Ekg/m ) -duration of an experiment (s)
Subscripts
b bed f final value in inlet value
s=�• TP,...252-2630
2
0 initial value
out outlet value s s-surface, in gas phase adjacent to solid
phase
INTRODUCTION
Solid desiccant cooling systems have received considerable attention as simple alternatives to standard vapor compression systems for air conditioning in hot and humid climates. The system process involves drying the humid airstream by having it pass through a desiccant bed and then through an evaporative cooler to provide the conditioned air to the indoor space. The desiccant is then regenerated with hot air from either a gas burner or solar collectors.
A typical desiccant cooling system can consist of two evaporative coolers, a regenerative heat exchanger, a solar heater, and a desiccant dehumidifier [l]. Electric power requirements are limited to air and water circulation and control devices. If the thermal coefficient of performance (COP) of the desiccant cooling system is high, it can compete economically with vapor compression systems [2].
The thermal performance of the system depends on the efficiencies of each component. The state of the technology for all the components except the dehumidifier is well understood, and components with effectivenesses as high as 0.9 are available. ·For example, evaporators can operate with effectivenesses of 0.8 to 0.9, while heat exchangers operate from 0.9 to 0.95 [l]. The state of the technology for dehumidifiers is not as well understood, and the greatest potential for improving system performance lies in developing highly efficient and low cost dehumidifiers.
The efficiency of a desiccant dehumidifier depends strongly on the properties of the desiccant used and the geometry of the unit. The most common desiccant material used for solar desiccant cooling applications [3,4,5, 6] is silica gel because of its high moisture cycling capacity compared with other industrial desiccants in the temperature range available from solar collectors (60°C-90°C). A molecular sieve is used in gas-fired desiccant cooling applications [7] because of its physical stability and high moisture cycling capacity in a temperature range available from gas-fired heaters (120°c-220°c).
To meet the thermal performance goals of desiccant cooling systems dehumidifier geometries with high heat and mass transfer performance and low pressure drop should be developed. The ratio of Stanton number (heat and mass transfer) to friction factor is then used as the preliminary design criterior. for selecting the dehumidifier design. Compactness, ease of fabrication and operation, desiccant material, and costs are other factors that must be considered for final design of a dehumidifier.
Packed particle beds were chosen in early designs of dehumidifiers and tested by Pla-Barly [ 4], Gunderson [8], and Clark et al. [9]. Thin desiccant beds were used to meet the system pressure drop constraints for economical operation. However, this resulted in a dehumidifier with a large frontal area, which makes the system large and undesirable. The dynamic performance of packed beds were then investigated [1,3,4,8,10]. The ratio of heat transfer Stanton
number to friction factor St /f for packed beds is habout 0.06 (Re = 50), although the ratio of effective mass transfer Stanton number to friction factor St /fmof the packed bed is even lower (about 0.02) because of the large diffusional solid-side resistance in the particles [11].
Researchers [7) at the Institute of Gas Technology (IGT) used corrugated fiber material impregnated with molecular sieve particles to fabricate a dehumidifier with an improved Stanton-number-to-friction-factor ratio. The St /f of a fully developed laminar flow hwith constant heat flux at walls in a corrugated structure is about 0.32, and the St if of IGT configurationmis expected to be 30%-60% lower than the St / f becausehof the mass transfer solid-side resistance [11].
Researchers at the Illinois Institute of Technology (IIT), the University of California at Los Angeles (UCLA), and the Solar Energy Research Institute (SERI) used the concept of parallel-walled configuration for improving the two Stanton-number-to-friction-factor ratios. The dehumidifier designed at IIT (12) basically consists of silica gel sheets that form laminarflow channels. The silica gel sheets are made by bonding silica gel particles (average diameter: 9 µm) within a fine Teflon web. The St /f of the IIT concepthunder fully developed laminar flow conditions with a constant heat flux at the walls is 0.49, while its St /f is about 0.16-0. 24 [12] because of the mass mtransfer resistance in the Teflon web. The resistance of the particles is estimated to be very small.
The UCLA dehumidifier concept [13] consists of parallel passages coated with a single layer of fine silica gel particles ( 120-250 µm), Researchers [ 14] at SERIcombined the UCLA concept with one using a rotary heat exchanger construction developed by CSIRO in Australia [ 15], The SERI parallel passage dehumidifier has parallel channels of double-sided polyester tapes with a thermosetting adhesive on which fine particles ( 80-250 µm) of silica gel are bonded. The St /f ofhthis concept is 0.49 under constant heat flux condition, the same as that of the IIT concept. However, the UCLA and SERI concept projects a St /f aboutm0.39-0. 41, which is higher than that of the IIT concept [11,13]. Since large St /f and St /f would result in a h mmore compact and efficient dehumidifier, the coated parallel-passage concept may provide an efficient dehumidifier.
UCLA [16] tested a bench scale parallel passage dehumidifier under adiabatic operation and compared the experimental results with transient pseudo-gas-side controlled model predictions obtaining some agreement. The observed discrepancy can be attributed to uncertainties in the heat of adsorption of silica gel, the exact nature of transfer coefficients' and heat losses from the dehumidifier walls.
SERI tested a small-scale, prototype, parallel passage dehumidifier under adiabatic conditions, and the results were compared with a pseudo-steady-state model. A simple, steady-state, counterflow heat and mass exchanger model was used for predicting its performance. The predictions (outlet air temperature and humidity) were in reasonable agreement with the experimental results for adsorption cases and relatively poor for desorption cases. The observed discrepancies (10% for humidity and 20% for temperature) can be attributed to the uncertainties involved in the heat of adsorption, heat capacities, and property variations caused by temperature changes in adiabatic operation. To
55�1
3
TP-252-2630
eliminate these uncertainties one solution is to perform the experiments under isothermal conditions and compare the results with predictions of mass transfer models for their validations.
The purpose of this study was to investigate the performance of a silica gel, parallel passage configuration under isothermal conditions both experimentally and theoretically. A sorption apparatus (17], which was available at SERI, was modified for this study. A test cell with a single passage, which simulated one of the channels of the SERI parallel passage dehumidifier, was fabricated and tested under isothermal conditions.
This paper describes the experimental apparatus, the test cells used, and a pseudo-gas-side-controlled mass transfer model. The experimental results and model predictions are compared and discussed. The experimental results of this study can be used to compare other mass transfer models of dehumidifiers. The validated mass transfer models can be combined with heat transfer models that later can be used in predicting the performance of desiccant dehumidifiers under actual operating conditions.
ANALYSIS (A PSEUDO-GAS-SIDE CONTROLLED MODEL)
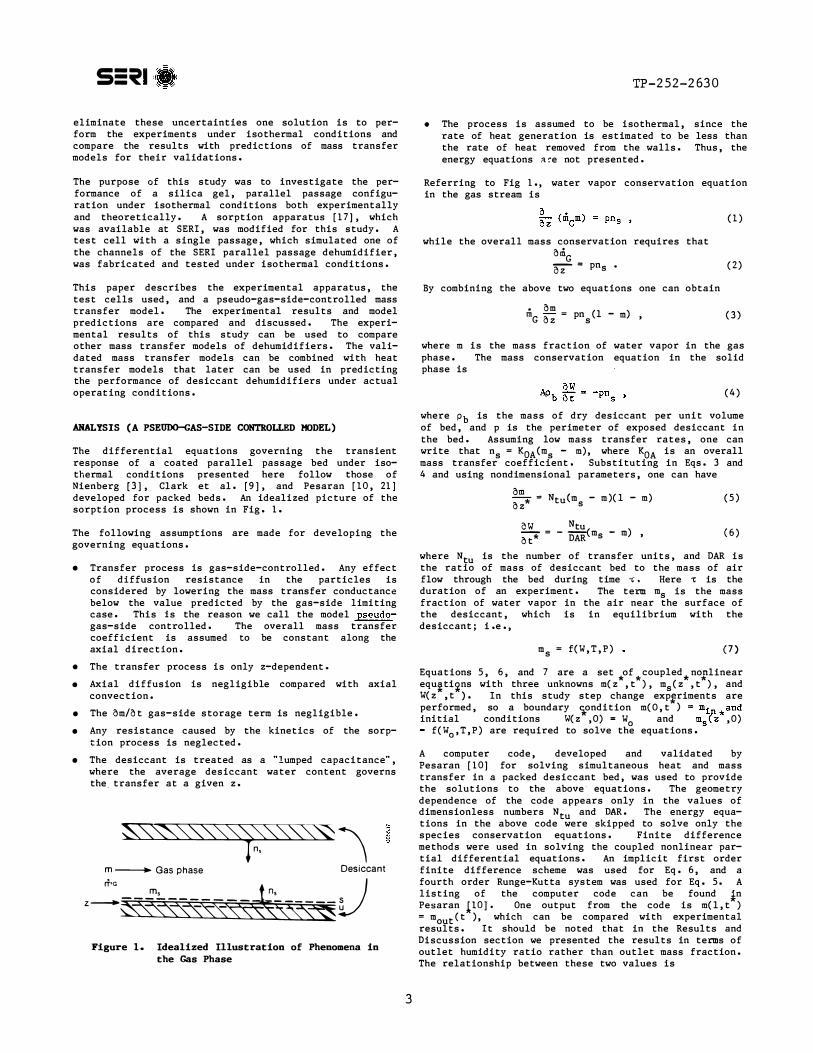
The differential equations governing the transient response of a coated parallel passage bed under isothermal conditions presented here follow those of Nienberg [3], Clark et al. (9], and Pesaran (10, 21) developed for packed beds. An idealized picture of the sorption process is shown in Fig. 1.
The following assumptions are made for developing the governing equations.
• Transfer process is gas-side-controlled. Any effect of diffusion resistance in the particles is considered by lowering the mass transfer conductance below the value predicted by the gas-side limiting case. This is the reason we call the model pseudogas-side controlled. The overall mass transfer coefficient is assumed to be constant along the axial direction.
• The transfer process is only z-dependent • • Axial diffusion is negligible compared with axial
convection.• The om/at gas-side storage term is negligible • • Any resistance caused by the kinetics of the sorp
tion process is neglected. • The desiccant is treated as a "lumped capacitance",
where the average desiccant water content governs the� transfer at a given z.
��\ m - Gas phase Desiccant
rT,G Jz-����w� Figure 1. Idealized Illustration of Phenomena in
the Gas Phase
• The process is assumed to be isothermal, since the rate of heat generation is estimated to be less than the rate of heat removed from the walls. Thus, the energy equations a�e not presented.
Referring to Fig 1., water vapor conservation equation in the gas stream is
(1)
while the overall mass conservation requires that oaiG '§Z"- = pns • (2)
By combining the above two equations one can obtain
om iii = pn (l - m ) G (3) oz s '
where m is the mass fraction of water vapor in the gas phase. The mass conservation equation in the solid phase is
(4)
where P is the mass of dry desiccant per unit volume b of bed, and p is the perimeter of exposed desiccant in the bed. Assuming low mass transfer rates, one can write that n = Ko (m - m), where Ks A s o is an overall A mass transfer coefficient. Substituting in Eqs. 3 and 4 and using nondimensional parameters, one can have
om = NtuCm - m)(l - m) (5) * oz s
oW N-- = tu - --(m - m) , (6) * at DAR s
where N is the number of transfer uni ts, and DAR istu the ratio of mass of desiccant bed to the mass of air flow through the bed during time ., • Here i: is the duration of an experiment. The term m is the mass s fraction of water vapor in the air near the surface of the desiccant, which is in equilibrium with the desiccant; i.e.,
ms = f(W,T,P) (7)
Equations 5, 6, and 7 are a set of coupled*no,plinear * *equ�ti�ns with three unknowns m(z ,t ) , m (z ,t ) , and sW(z , t ) • In this study step change expfriments are performed, so a boundary 'i-ondition m(O,t ) = miJl *and initial conditions W(z ,O) = W0 and m tz ,O) s
f(W0,T,P) are required to solve the equations.
A computer code, developed and validated by Pesaran (10] for solving simultaneous heat and mass transfer in a packed desiccant bed, was used to provide
� the solutions to the above equations. The geometrydependence of the code appears only in the values of dimensionless numbers N and DAR. The energy equatu tions in the above code were skipped to solve only the species conservation equations. Finite difference methods were used in solving the coupled nonlinear partial differential equations. An implicit first order finite difference scheme was used for Eq. 6, and a fourth order Runge-Kut ta system was used for Eq. 5. A listing of the computer code can be found in Pesaran poJ. One output from the code is m(l, t ) = m (t ), which can be compared with experimental outresults. It should be noted that in the Results and Discussion section we presented the results in terms of outlet humidity ratio rather than outlet mass fraction. The relationship between these two values is
s=�• TP.,..252.,..2630
4
= m w I-=-m , (8)
where w is the ratio mass of water vapor to mass of dry air.
EXPERIMENTAL METHOD
Apparatus
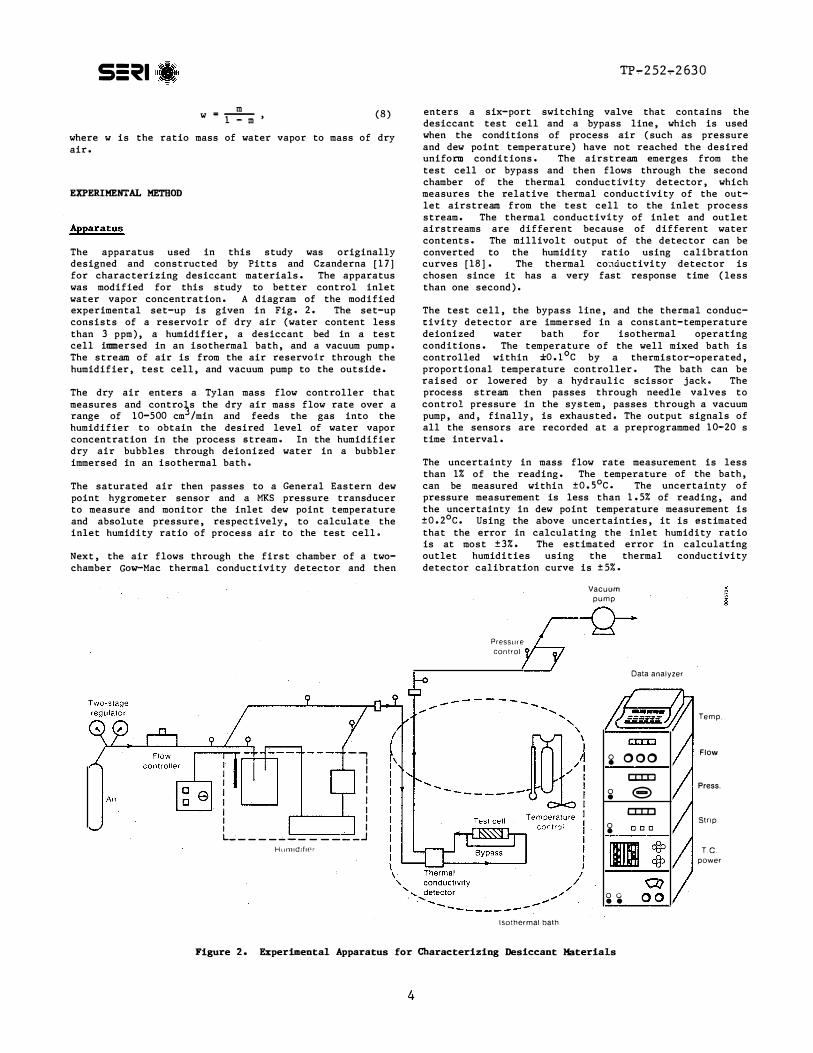
The apparatus used in this study was originally designed and constructed by Pitts and Czanderna [17] for characterizing desiccant materials. The apparatus was modified for this study to better control inlet water vapor concentration. A diagram of the modified experimental set-up is given in Fig. 2. The set-up consists of a reservoir of dry air (water content less than 3 ppm), a humidifier, a desiccant bed in a test cell immersed in an isothermal bath, and a vacuum pump. The stream of air is from the air reservoir through the humidifier, test cell, and vacuum pump to the outside.
The dry air enters a Tylan mass flow controller that measures and contro�s the dry air mass flow rate over a range of 10-500 cm /min and feeds the gas into the humidifier to obtain the desired level of water vapor concentration in the process stream. In the humidifier dry air bubbles through deionized water in a bubbler immersed in an isothermal bath.
The saturated air then passes to a General Eastern dew point hygrometer sensor and a MKS pressure transducer to measure and monitor the inlet dew point temperature and absolute pressure, respectively, to calculate the inlet humidity ratio of process air to the test cell.
Next, the air flows through the first chamber of a twochamber Gow-Mac thermal conductivity detector and then
enters a six-port switching valve that contains the desiccant test cell and a bypass line, which is used when the conditions of process air (such as pressure and dew point temperature) have not reached the desired uniform conditions. The airstream emerges from the test cell or bypass and then flows through the second chamber of the thermal conductivity detector, which measures the relative thermal conductivity of the outlet airstream from the test cell to the inlet process stream. The thermal conductivity of inlet and outlet airstreams are different because of different water contents. The millivolt output of the detector can be converted to the humidity ratio using calibration curves [18]. The thermal co·.1ductivity detector is chosen since it has a very fast response time (less than one second).
The test cell, the bypass line, and the thermal conductivity detector are immersed in a constant-temperature deionized water bath for isothermal operating condi tions. The temperature of the well mixed bath is . °controlled within ±o.1 c by a thermistor-operated,proportional temperature controller. The bath can be raised or lowered by a hydraulic scissor jack. The process stream then passes through needle valves to control pressure in the system, passes through a vacuum pump, and, finally, is exhausted. The output signals of all the sensors are recorded at a preprogrammed 10-20 s time interval.
The uncertainty in mass flow rate measurement is less than 1% of the reading. The temperature of the bath, can be measured within 0±o.s c. The uncertainty of pressure measurement is less than 1.5% of reading, and the uncertainty in dew point temperature measurement is °±o.2 c. Using the above uncertainties, it is estimated that the error in calculating the inlet humidity ratio is at most ±3%. The estimated error in calculating outlet humidities using the thermal conductivity detector calibration curve is ±5%.
--, I I I I I I
I I I I L---------____ J
HtJrllldlflPI
Pressufe control
Isothermal bath
Vacuum
pump
-Q-Data analyzer
� 000 a::tD e0 •
c:a::c � coo
RJ 0 (; • •
Temp.
Flow
Press.
Strip
T.C
power
Figure 2. Experimental Apparatus for Characterizing Desiccant Materials
55�1 TP-252-2630
5
Procedure
Tests were performed to determine the transient response of a desiccant bed after step change in the inlet air humidity under isothermal operating conditions. A bed of known initial water content was prepared using the isothermal bath and the humidifier. The process airstream conditions, such as temperature, pressure, dew point temperature, and air flow rate, were brought up to the desired operating values while the air flows through the bypass line.
Once all operating parameters were set and equilibrium was assured, the process airstream was fed into the test cell, and the transient data were obtained by measuring the thermal conductivity detector outputs as a function of time. The outputs were converted to the humidity ratio of air using a calibration curve [18]. The experiments were stopped after 15 minutes when no change in the detector output was observed. When inlet and outlet humidity ratios were the same and the desiccant in the test cell was in equilibrium with the air, no change in the output of the detector was expected.
Test Cells
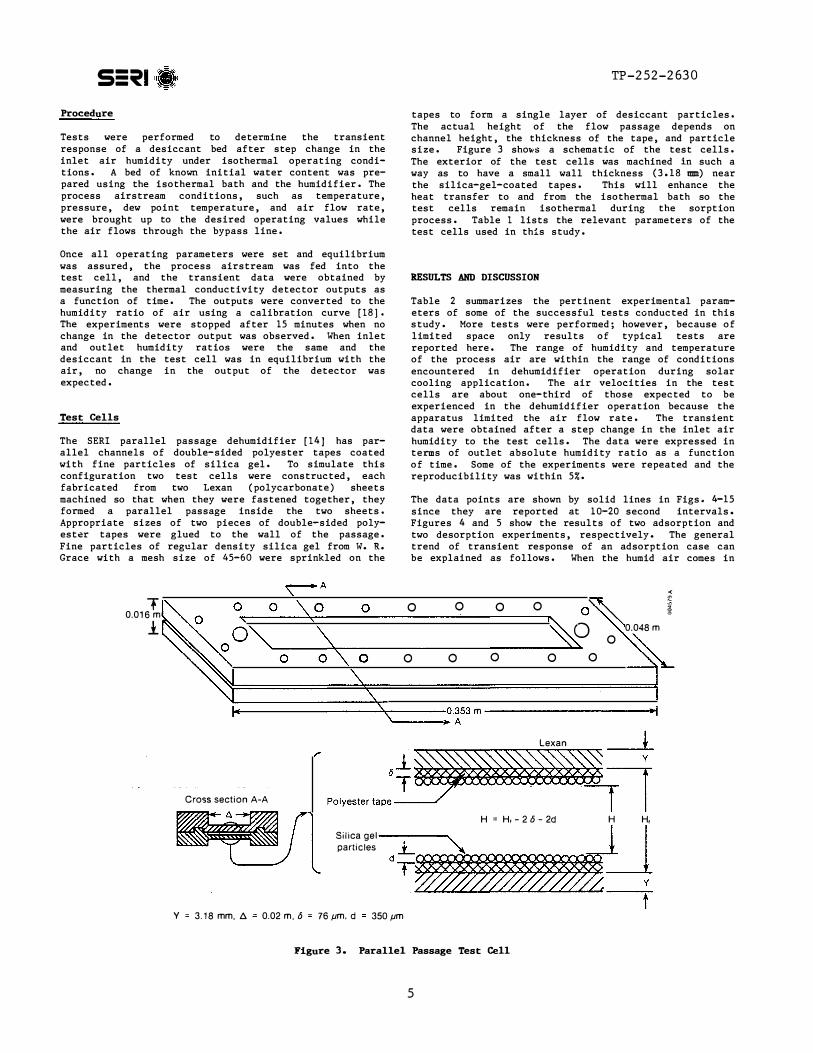
The SERI parallel passage dehumidifier [ 14] has parallel channels of double-sided polyester tapes coated with fine particles of silica gel. To simulate this configuration two test cells were constructed, each fabricated from two Lexan (polycarbonate) sheets machined so that when they were fastened together, they formed a parallel passage inside the two sheets. Appropriate sizes of two pieces of double-sided polyester tapes were glued to the wall of the passage. Fine particles of regular density silica gel from W. R. Grace with a mesh size of 45-60 were sprinkled on the
tapes to form a single layer of desiccant particles. The actual height of the flow passage depends on channel height, the thickness of the tape, and particle size. Figure 3 shm.;•s a schematic of the test cells. The exterior of the test cells was machined in such a way as to have a small wall thickness (3 .18 mm) near the silica-gel-coated tapes. This will enhance the heat transfer to and from the isothermal bath so the test cells remain isothermal during the sorption process. Table 1 lists the relevant parameters of the test cells used in this study.
RESULTS AND DISCUSSION
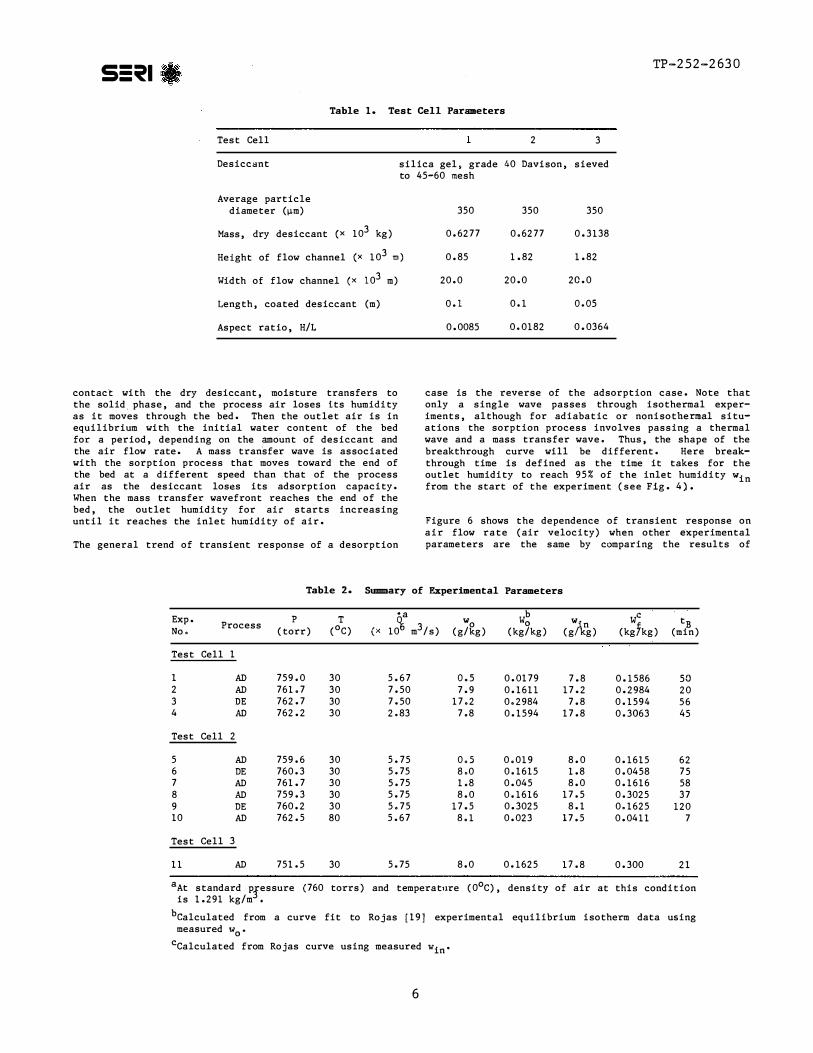
Table 2 summarizes the pertinent experimental parameters of some of the successful tests conducted in this study. More tests were performed; however, because of limited space only results of typical tests are reported here. The range of humidity and temperature of the process air are within the range of conditions encountered in dehumidifier operation during solar cooling application. The air velocities in the test cells are about one-third of those expected to be experienced in the dehumidifier operation because the apparatus limited the air flow rate. The transient data were obtained after a step change in the inlet air humidity to the test cells. The data were expressed in terms of outlet absolute humidity ratio as a function of time. Some of the experiments were repeated and the reproducibility was within 5%.
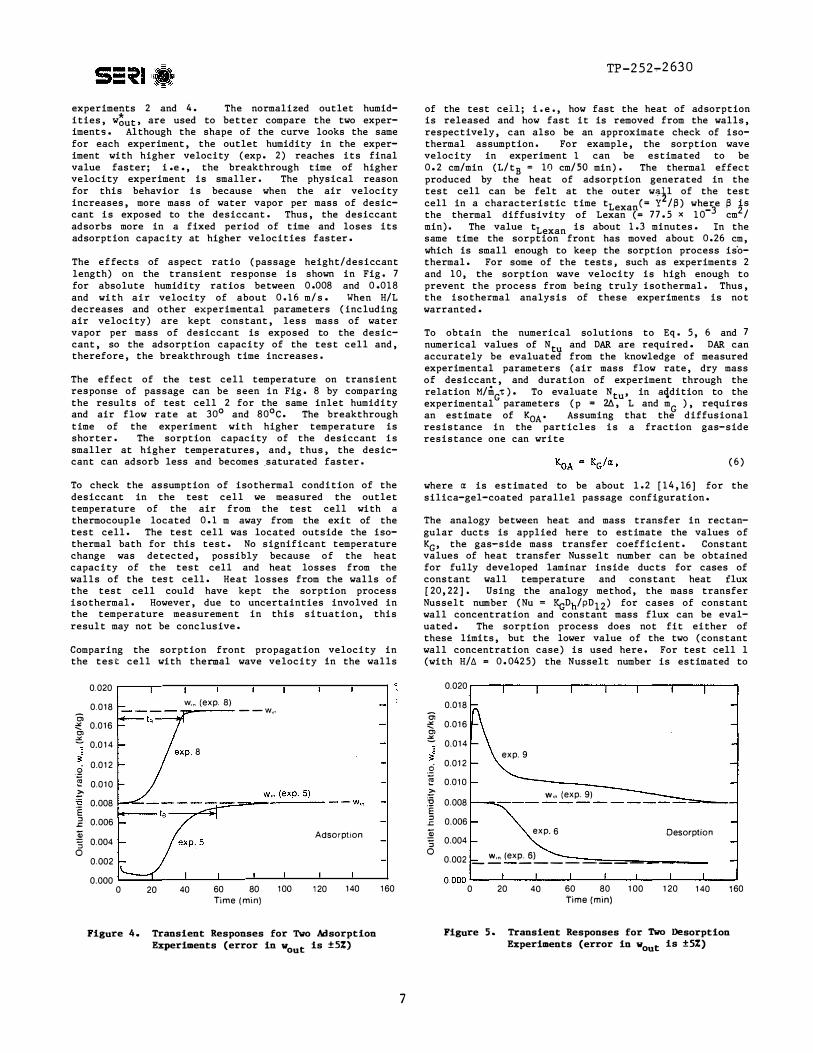
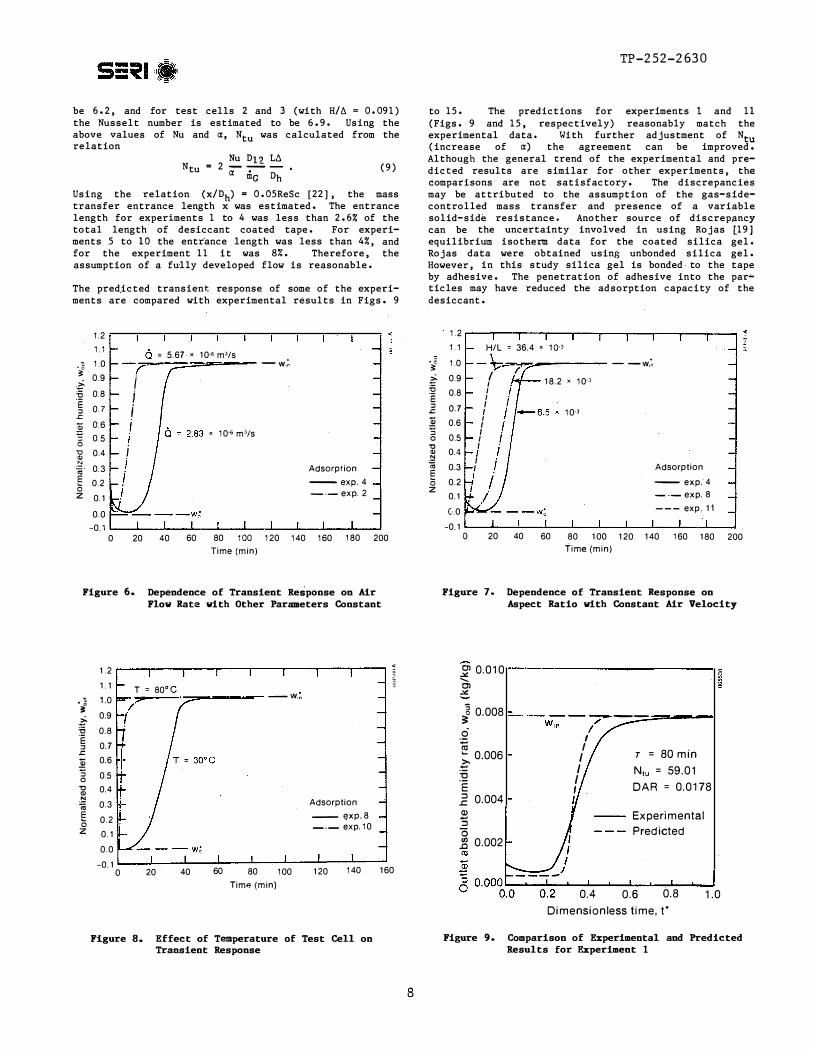
The data points are shown by solid lines in Figs. 4-15 since they are reported at 10-20 second intervals. Figures 4 and 5 show the results of two adsorption and two desorption experiments, respectively. The general trend of transient response of an adsorption case can be explained as follows. When the humid air comes in
T0.016 m 1
"' 0 0 0 0 o� i
Q 0.048m 0 0 � 0 0 0 0 0
i.------------.....------0.353 m --------------
Cross section A-A
'------.A
Lexan t
PolY"'""":*�4 H = H. - 2 6 - 2d H H,
Silica gel I '"'"'"' '*��
t Y 3.18 mm, t;. 0.02 m, 6 76 µm, d 350 µm
Figure 3. Parallel Passage Test Cell
s=�• TP-252-2630
6
Table 1. Test Cell Parameters
Test Cell 2 3
Desiccant silica gel, grade 40 Davison, sieved to 45-60 mesh
Average particle diameter (µm) 350 350 350
Mass, dry desiccant (x 3 10 kg) 0.6277 0.6277 0.3138
Height of flow channel ( 3 x 10 m) 0.85 1.82 1.82
Width of flow channel 3 (x 10 m) 20.0 20.0 20.0
Length, coated desiccant (m) 0.1 0.1 o.os
Aspect ratio, H/L 0.0085 0.0182 0.0364
contact with the dry desiccant, moisture transfers to the solid. phase, and the process air loses its humidity as it moves through the bed. Then the outlet air is in equilibrium with the initial water content of the bed for a period, depending on the amount of desiccant and
.the air flow rate. A mass transfer wave is associated with the sorption process that moves toward the end of the bed at a different speed than that of the process air as the desiccant loses its adsorption capacity. When the mass transfer wavefront reaches the end of the bed, the outlet humidity for air starts increasing until it reaches the inlet humidity of air.
The general trend of transient response of a desorption
case is the reverse of the adsorption case. Note that only a single wave passes through isothermal experiments, although for adiabatic or nonisothemal situations the sorption process involves passing a thermal wave and a mass transfer wave. Thus, the shape of the breakthrough curve will be different. Here breakthrough time is defined as the time it takes for the outlet humidity to reach 95% of the inlet humidity '"infrom the start of the experiment (see Fig. 4).
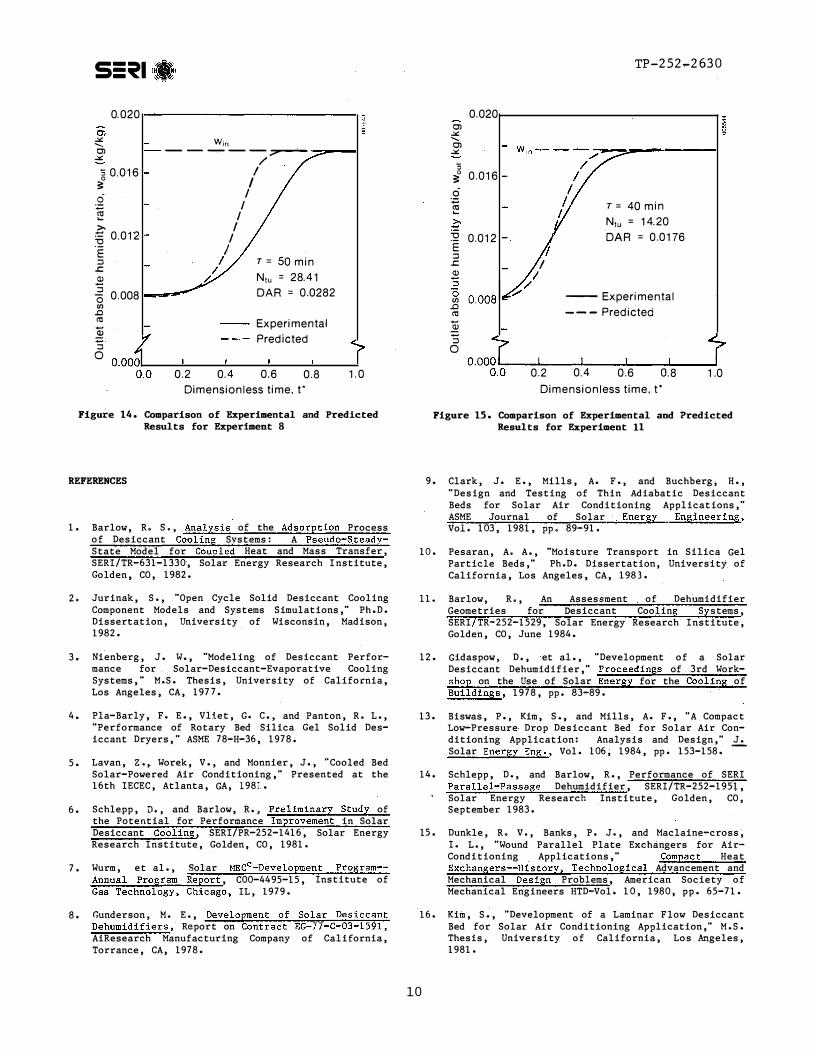
Figure 6 shows the dependence of transient response on air flow rate (air velocity) when other experimental parameters are the same by comparing the results of
Table 2. Sununary of Experimental Parameters
Exp. p •a b C T w W tProcess '"o o 0 '" n B No. (torr) ( C) (x 10� 3m /s) (g/kg) (kg/kg) (g Akg) (kglkg) (min)
Test Cell 1
1 AD 759.0 30 S.67 o.s 0.0179 7.8 0.1586 so 2 AD 761.7 30 7.50 7.9 0.1611 17.2 0.2984 20 3 DE 762. 7 30 7.50 17.2 0.2984 7.8 0.1594 56 4 AD 762.2 30 2.83 7.8 0.1594 17.8 0.3063 45
Test Cell 2
5 AD 759.6 30 S.75 o.s 0.019 8.0 0.1615 62 6 DE 760.3 30 5.75 8.0 0.1615 1.8 0.0458 75 7 AD 761.7 30 5.75 1.8 0.045 8.0 0.1616 58 8 AD 759.3 30 5.75 8.0 0.1616 17.5 0.3025 37 9 DE 760.2 30 5,75 17.S 0.3025 8.1 0.1625 120 10 AD 762.S 80 S.67 8.1 0.023 17.S 0.0411 7
Test Cell 3
11 AD 751.5 30 S.75 8.0 0.1625 17.8 0.300 21
aAt standard pressure (760 torrs) and temperat11re (0°C) , density of air at this condition is 1.291 3kg/m ,
bcalculated from a curve fit to Rojas [19] experimental equilibrium isotherm data using measured w0•
cCalculated from Rojas curve using measured '" " in
7
TP-252.,...2630
experime ts 2 and 4. The normalized outlet humid;;ities, Wout, are used to better compare the two experiments. Although the shape of the curve looks the same for each experiment, the outlet humidity in the experiment with higher velocity (exp. 2) reaches its final value faster; i.e., the breakthrough time of higher velocity experiment is smaller. The physical reason for this behavior is because when the air velocity increases, more mass of water vapor per mass of desiccant is exposed to the desiccant. Thus, the desiccant adsorbs more in a fixed period of time and loses its adsorption capacity at higher velocities faster.
The effects of aspect ratio (passage height/desiccant length) on the transient response is shown in Fig. 7 for absolute humidity ratios between 0.008 and 0.018 and with air velocity of about 0.16 m/s. When H/L decreases and other experimental parameters (including air velocity) are kept constant, less mass of water vapor per mass of desiccant is exposed to the desiccant, so the adsorption capacity of the test cell and, therefore, the breakthrough time increases.
The effect of the test cell temperature on transient response of passage can be seen in Fig. 8 by comparing the results of test cell 2 for the same inlet humidity and air flow rate at 30° and 80°c. The breakthrough time of the experiment with higher temperature is shorter. The sorption capacity of the desiccant is smaller at higher temperatures, and, thus, the desiccant can adsorb less and becomes _saturated faster.
To check the assumption of isothermal condition of the desiccant in the test cell we measured the outlet temperature of the air from the test cell with a thermocouple located 0.1 m away from the exit of the test cell. The test cell was located outside the isothermal bath for this test. No significant temperature change was detected, possibly because of the heat capacity of the test cell and heat losses from the walls of the test cell. Heat losses from the walls of the test cell could have kept the sorption process isothermal. However, due to uncertainties involved in the temperature measurement in this situation, this result may not be conclusive.
Comparing the sorption front propagation velocity in the test cell with thermal wave velocity in the walls
Ci � Cl '2:. .; .2 '§ Z:-:;:; E :::J .r: � :; 0
0.020
0.018 w,0 (exp. 8) --w,.,
0.016
0.014 8
0.012
0.010
0.008
0.006
0.004 Adsorption
0.002
0.000 0 20 40 60 80 100 120 140
Time (min)
Figure 4. Transient Responses for Two Adsorption Experiments (error in wout is ±5%)
160
of the test cell; i. e., how fast the heat of adsorption is released and how fast it is removed from the walls, respectively, can also be an approximate check of isothermal assumption. For example, the sorption wave velocity in experiment l can be estimated to be 0. 2 cm/min (L/t = 10 cm/SO min). The thermal effect B produced by the heat of adsorption generated in the test cell can be felt at the outer wall of the test cell in a characteristic time t < Y2
Lexan = /�) wh�re � is 3 2the thermal diffusivity of Lexan (= 77 .5 x 10 cm /
min). The value t is about 1.3 minutes. In the Lexan same time the sorption front has moved about 0.26 cm, which is small enough to keep the sorption process is'othermal. For some of the tests, such as experiments 2 and 10, the sorption wave velocity is high enough to prevent the process from being truly isothermal. Thus, the isothermal analysis of these experiments is not warranted.
To obtain the numerical solutions to Eq. 5, 6 and 7
numerical values of N and DAR are required. DAR can tu accurately be evaluated from the knowledge of measured experimental parameters (air mass flow rate, dry mass of desiccant, and duration of experiment through the relation M/m i;). To evaluate N • in a4dition to the G tuexperimental parameters (p = U., L and m ) , requiresG an estimate of Ko . Assuming that the diffusionalAresistance in the particles is a fraction gas-side resistance one can write
(6)
where a: is estimated to be about l.2 (14, 16] for the silica-gel-coated parallel passage configuration.
The analogy between heat and mass transfer in rectangular ducts is applied here to estimate the values of KG, the gas-side mass transfer coefficient. Constant values of heat transfer Nusselt number can be obtained for fully developed laminar inside ducts for cases of constant wall temperature and constant heat flux [ 20, 22] • Using the analogy method, the mass transfer Nusselt number (Nu = �D /pD ) for cases of constant h 12wall concentration and constant mass flux can be evaluated. The sorption process does not fit either of these limits, but the lower value of the two (constant wall concentration case) is used here. For test cell l (with H/D. = 0.0425) the Nusselt number is estimated to
0.020 �-�--�-----�-�--�----� 0.018
o; � 0.016 Cl '2:. 0.014 J .9 0.012
'§ 0.010 Z;-:0 0.008 .E.E 0.006
exp. 9
Wm (exp. 9)
� exp. 6 :; 0.004 0
0.002 -�(ex��------
Desorption
0.000 .___� __ ...._ __ _.._ __ �-�--�---'-----' 0 20 40 60 80 100 120 140 160
Time (min)
Figure s. Transient Responses for Two Desorption Experiments (error in wout is ±5%)
8
TP-252-2630
be 6.2, and for test cells 2 and 3 (with H/!:i = 0.091) the Nusselt number is estimated to be 6. 9. Using the above values of Nu and a:, N was calculated from the tu relation
Nu Dl? L!:i Ntu = 2 - -- - (9) a: me oh
Using the relation (x/D ) h = 0.05ReSc [22], the mass transfer entrance length x was estimated. The entrance length for experiments 1 to 4 was less than 2.6% of the total length of desiccant coated tape. For experiments 5 to 10 the entrance length was less than 4%, and for the experiment 11 it was 8%. Therefore, the assumption of a fully developed flow is reasonable.
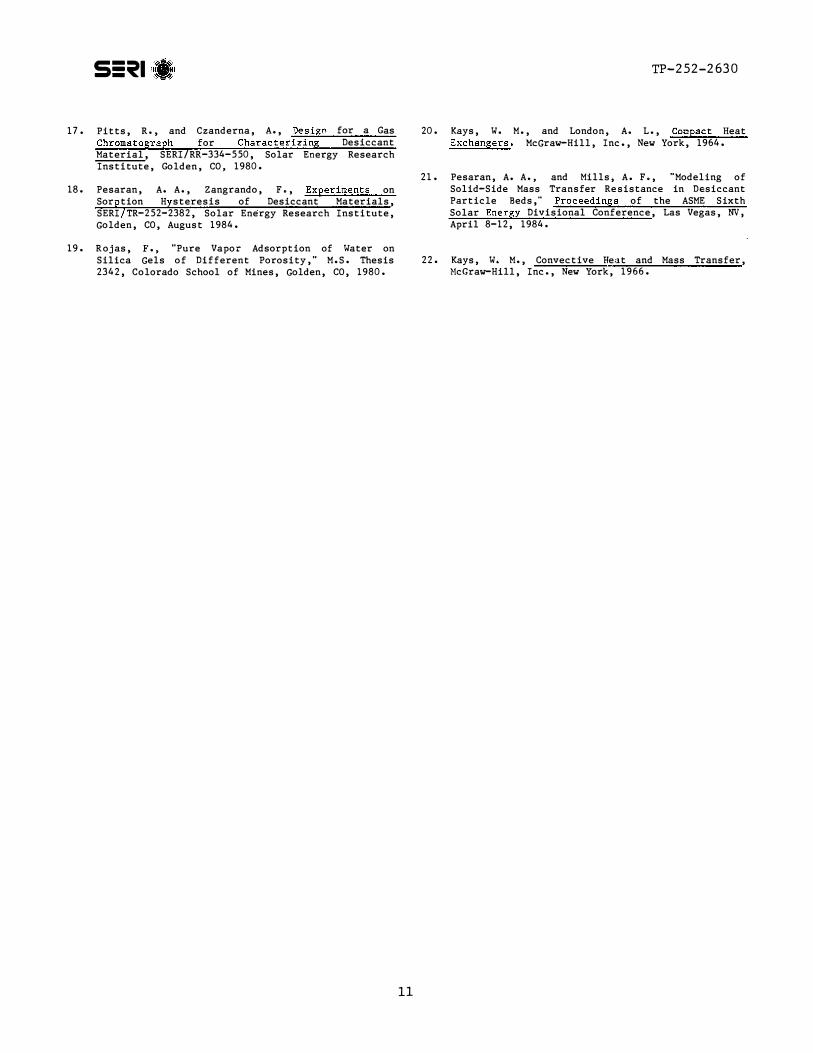
The predicted transient response of some of the experiments are compared with experimental results in Figs. 9
to 15. The predictions for experiments l and 11 (Figs. 9 and 15, respectively) reasonably match the experimental data. With further adjustment of Ntu (increase of a:) the agreement can be improved. Although the general trend of the experimental and predicted results are similar for other experiments, the comparisons are not satisfactory. The discrepancies may be attributed to the assumption of the gas-sidecontrolled mass transfer and presence of a variable solid-side resistance. Another source of discrepancy can be the uncertainty involved in using Rojas [19] equilibrium isotherm data for the coated silica gel. Rojas data were obtained using unbonded silica gel. However, in this study silica gel is bonded to the tape by adhesive. The penetration of adhesive into the particles may have reduced the adsorption capacity of the desiccant.
1.2 1.1 6 = 5.67 x 10·6 m'/s 1.0 - -
·; ,. w,� .
0.9 :::. i'O 0.8 iE :i 0.7 .!: i� 0.6 ; x 10·• m'/s 0.5 I 0 -0 "' 0.4 i.!::! c;; 0.3 i Adsorption E 0.2 i -- exp.4 a -z --exp. 2 0.1
0.0 -0.1
0 20 40 60 80 100 120 140 160 180 200 Time (min)
Figure 6. Dependence of Transient Response on Air Flow Rate with Other Parameters Constant
1.2 � ' 1.1 H/L 10·3
·; 1.0 -\;:-�--= 36.4 x
--w.� I / :::. 0.9 I 18.2 x 10" 'O
.E 0.8 I I
:i I .c 0.7 I 10" I § 0.6 :; I I 0 0.5 I
-0 I "' 0.4 I .!::! I c;; 0.3 I Adsorption E I a 0.2 -- exp. 4 z
0.1 -·-exp. 8 --- exp. 11 C-.0
-0.1 0 20 40 60 80 100 120 140 160 180 200
Time (min)
Figure 7. Dependence of Transient Response on Aspect Ratio with Constant Air Velocity
• g 3: :::. 'O .E :i .!: § :;0 -0 Q) .!::! c;; E 0 z
1.2 1.1 1.0 0.9 0.8 0.7 0.6 0.5 0.4 0.3 0.2 0.1 0.0
-0.1
....----,---,----.---...----,---,----,----, iT = 80°C
0
�--- -:=_. ____ -- Wm
20 40 60 80 100 Tim" (min)
Adsorption -- exp.8 -·- exp.10
120 140 160
Figure 8. Effect of Temperature of Test Cell on Transient Response
� 0.010....._ Cl .:.:.
; 0.008
.2 -ro -� 0.006
-0 .E E 0.004 Q) :;0 1:l 0.002ca
-w:;-T __ _ I I I I I I I
0.4
r = 80 min
Niu = 59.01
DAR = 0.0178
Experimental
Predicted
0.6 0.8 1.0
Dimensionless time, t*
Figure 9. Comparison of Experimental and Predicted Results for Experiment 1

Ol 0.020 ,....---------------.""' ' Ol ""'
i5 3: 0 .016 c5 � ..... c "O ·E 0.012:i
.s::::. 2 :i 0 1l 0.008 Cll
2:i 0
0.0
T = 30 min
Niu = 44.56 DAR = 0 .036
/ _,,. I
I I
I I
I I
I I
I
"/
-- Experimental
-- - Predicted
0.2 0.4 0.6 0.8 Dimensionless time, 1·
1.0
Figure 10. Comparison of Experimental and Predicted Results for Experiment 2
� 0.018 ...-----------------..... , � � ""'
0 3: 0 0.01
� c "O 5 0.010.s::::. Q) :; 0en .0 Cll
2:i
0
r = 80 min
Ntu = 44.56 DAR = 0.0133
--- Experimental
- -- Predicted
0.2 0 .4 0 .6 (l.8
Dimensionless time, t•
1.0
Figure 11. Comparison of Experimental and Predicted Results for Experiment 3
Ol 0.020 ,.,..-----------------.
� g Ol .;;:
:; 0 � 0 .016 0
� . £"O .E 0.012 :i
.s::::. Q) :; 0 en .g 0 .008
2:;0
0 .0
T = 50 min
Ntu = 118.09
DAR = 0 .0573
-- Experimental
-- - Predicted
____________ .,../
0.2 0.4 0.6
I I I
I I I I I I
I I
I /
0 .8 1.0
Dimensionless time, t•
Figure 12. Comparison of Experimental and Predicted Results for Experiment 4
0 .016.----------------. '
.; 0.012
.Q (;; ..... c "O 0.008 E :i
.s::::. 2 :i
5l 0.004 .0 Cll
2:;
r = 70 min
Niu = 28.41
DAR = 0 .020
Experimental
Predicted
0 0.000 .___ _ ___._ __ __._ __ _._ __ ....._ _ _. 0.0 0 .2 0 .4 0.6 0.8 1.0
Dimensionless time, t•
Figure 13. Comparison of Experimental and Predicted Results far Experiment 7
CONCLUSIONS
The transient response of silica-gel-coated, parallel passage test cells under is�thermal conditions was obtained after a step change in the inlet humidity of air. The dependence of sorption process on air velocity and aspect ratio and temperature was obtained. As air velocity, aspect ratio, and temperature increase, the breakthrough time decreases. The practical application of this conclusion is that with an increase in air velocity and aspect ratio, the cycling time between adsorption and regeneration of desiccant dehumidifie·cs should decrease. Comparison between results from a pseudo-gas-side-controlled model and some of the experimental results were not satisfactory. The discrep-
ancies were attributed t:o the unc�ertainties in equilibrium isotherm and overall mass transfer coefficient and the presence of a variable, solid-side resistance. Future works should involve further refinement of the model, including adding energy equations for nonisothermal cases and obtaining equilibrium isotherms of the coated silica gel, so the predictions agree better with the experimental results.
ACKNOWLEDGMENT
This work was supported by the U.S. Department of Energy's Office of Solar Heat Technologies. Thanks to Harry Pohl for performing the experiments.
9
TP-252.,-2630
0.020
Ol § � Win -... Ol -----::::---� / � 0.016 I
� I 0 I
� I I
£ I 0.012 I "O .
E I :::i I r = 50 min .c I (].) /. Niu = 28.41 :;
0.008 DAR = 0 .02820 (Jl .0 Cll Experimental ]2 Predicted :; 0
0 .2 0.4 0.6 0 .8 1.0
Dimensionless time, t*
Figure 14. Comparison of Experimental and Predicted Results for Experiment 8
s=�• TP-252.,-2630
10
0.020 Ol � -... Ol� :; 0 0 .016�
.2 <ti .... � "O 0.012.E :::i
.c 2 :::i 0 y (Jl
.0 Cll
:§:}:;0
r I
I /
0 .2
r = 40 min
Niu = 14.20
DAR = 0 .0176
-- Experimental
-- - Predicted
0.4 0 .6 0 .8
g
1.0
Dimensionless time. t*
Figure 15. Comparison of Experimental and Predicted Results for Experiment 11
REFERENCES
;; ;; ..; ..; _ _ ,,. ..;
_ _v_e_l_o_.r _e_n_t _ =- _ = _ .,,.
1. Barlow, R. s., Analysis of the Adsorption Process of Desiccant Cooling Svstems: A Pseudo-SteadyState Model for Coupled Heat and Mass Transfer, SERI/TR-631-1330, Solar Energy Research Institute, Golden, CO, 1982.
2. Jurinak, S., "Open Cycle Solid Desiccant Cooling Component Models and Systems Simulations," Ph.D. Dissertation, University of Wisconsin, Madison, 1982.
3. Nienberg, J. W., "Modeling of Desiccant Performance for Solar-Desiccant-Evaporative Cooling Systems," M.S. Thesis, University of California, Los Angeles, CA, 1977.
4. Pla-Barly, F. E., Vliet, G. c., and Panton, R. L., "Performance of Rotary Bed Silica Gel Solid Desiccant Dryers," ASME 78-H-36, 1978.
5. Lavan, Z., Worek, V., and Monnier, J., "Cooled Bed Solar-Powered Air Conditioning," Presented at the 16th IECEC, Atlanta, GA, l 98i..
6. Schlepp, D., and Barlow, R., Preliminary Study of the Potential for Performance Improvement in Solar Desiccant Cooling, SERI/PR-252-1416, Solar Energy Research Institute, Golden, CO, 1981.
c7. Wurm, et al., Solar MEC -Development Program-An.;.;n.;.;ual .;;.Prog,_r m_Repo"' .;;..;..rt , C00-44 9 5-15 , Institute of.;;; ;...., .,. �Gas Technology, Chicago, IL, 1979.
8. <;underson, M. E., _D m _of solar Desiccan-t ,... _,,,..,,.....,,,, ...,,. ,,.. .,,.�Dehumidifiers, Report on Contract EG-77-C-03-1591, AiResearch Manufacturing Company of California, Torrance, CA, 1978.
9. Clark, J, E., Mills, A. F., and Buchberg, H.,"Design and Testing of Thin Adiabatic Desiccant Beds for Solar Air Conditioning Applications,"ASME Journal of Solar Energy Engineering, Vol. 103, 1981, PP• 89-91.
10. Pesaran, A. A., "Moisture Transport in Silica Gel Particle Beds," Ph.D. Dissertation, University ofCalifornia, Los Angeles, CA, 1983.
ll. Barlow, R., An Assessment of Dehumidifier Geometries for Desiccant Coolin S stems, SERI TR-252-1529, Solar Energy Research Institute, Golden, CO, June 1984.
12. Gidaspow, D., et al., "Development of a Solar Desiccant Dehumidifier," Proceedings of 3rd Workshop on the Use of Solar Energy for the Cooling ofBuildings, 1978, PP• 83-89.
13. Biswas, P., Kim, s., and Mills, A. F., "A CompactLow-Pressure Drop Desiccant Bed for Solar Air Conditioning Application: Analysis and Design," J.Solar Energy Eng., Vol. 106, 1984, PP • 153-158. --
14. Schlepp, D., and Barlow, R., Performance of SERIParallel-Passage Dehumidifier, SERI/TR-252-1951,Solar Energy Research Institute, Golden, CO,September 1983.
15. Dunkle, R. V,, Banks, P. J., and Maclaine-cross, I. L., "Wound Parallel Plate Exchangers for AirConditioning . Applications," Compact HeatExchangers--History, Technological Advancement andMechanical Design Problems, American Society of ;; ;; a;; ;..Mechanical Engineers HTD-Vol. 10, 1980, pp. 65-71.
16. Kim, S., "Development of a Laminar Flow Desiccant eBed for Solar Air Conditioning Application," M.S. Thesis, University of California, Los Angeles, 1981.
s=�•
11
TP-252-2630
17. Pitts, R., and Czanderna, A., Design for a Gas Chromatograph for Characterizing Desiccant Material, SERI/RR-334-550, Solar Energy Research Institute, Golden, CO, 1980.
18. Pesaran, A. A., Zangrando, F., Experiments on Sor tion H steresis of Desiccant Materials,SERI TR-252-2382, Solar Energy Research Institute,Golden, CO, August 1984.
19. R ojas, F'., "Pure Vapor Adsorption of Water on Silica Gels of Different Porosity," M.S. Thesis 2342, Colorado School of Mines, Golden, CO, 1980.
20. Kays, W. M., and London, A. L., Compact Heat Exchangers. McGraw-Hill, Inc., New York, 1964.
21. Pesaran, A. A., and Mills, A. F., "Modeling ofSolid-Side Mass Transfer Resistance in Desiccant Particle Beds," Proceedings of the ASME SixthSolar Energy Divisional Conference, Las Vegas, NV, April 8-12, 1984.
22. Kays, W. M., Convective Heat and Mass Transfer, McGraw-Hill, Inc., New York, 1966.