isolation and characterization of kinetoplast dna and rna of phytomonas davidi
TRANSCRIPT

PLASMID 1, 297-315 (1978)
Isolation and Characterization of Kinetoplast DNA and RNA of Phytomonas davidi
DAVID CHENG AND LARRY SIMPSON
Biology Department and Molecular Biology Institute, University of California, Los Angeles, California 900
Accepted February 1, 1978
‘24
Kinetoplast DNA networks were isolated from stationary-phase culture forms of Phyromonas davidi. The networks banded in CsCl at a density of 1.699 g/ml and consisted of covalently closed circular molecules. The networks were sensitive to shear forces and exhibited several discrete sedimenting components in neutral and alkaline sucrose. Closed monomeric minicircles were isolated from sonicated networks by alkaline band sedimenta- tion. Closed monomers showed a heterogeneous banding pattern on electrophoresis in acrylamide-agarose gels and had sedimentation coefficients of 20.5 S in alkaline sucrose and 11 S in neutral sucrose. The mean minicircle molecular weight as measured by co- spreading with +XRF II was 0.70 x lo6 or 1064 nucleotide pairs. Minicircles exhibited a sequence microheterogeneity as evidenced by restriction enzyme analysis, melting analysis, and renaturation kinetics. Network maxicircles were evidenced by the ap- pearance of high molecular weight fragments after restriction with several enzymes and by the existence of supertwisted “edge loops” extending out from the periphery of networks. The maxicircle molecular weight was estimated to be approximately 24 x 106. A purified kinetoplast-mitochondrion fraction was found to contain 9 and 12 S RNA species that comigrated with L. tarentolae 9 and 12 S kinetoplast RNAs.
Phytomonas davidi was first described by Lafont (1909), and the occurrence, trans- mittance, and life cycle of this hemoflagel- late were described by Franca (1911, 1914, 1919, 1920). This organism belongs to the family Trypanosomatidae and infects the euphorbid plants; transmittance is by means of an insect vector. In the latex of the plants or in the salivary gland of the insect vector, P. davidi has a slender body with an anterior flagellum. An axenic culture of P. davidi in Mansour’s medium was recently achieved by McGhee and Postell (1976).
Kinetoplast DNA has been isolated from many species of hemoflagellate protozoa in the family Trypanosomatidae (Kleisen et al. , 1976; Kleisen et al., 1976; Renger and Wolstenholme, 1972; Simpson and da Silva, 1971; Simpson and Berliner, 1974; Simpson and Simpson, 1974; Renger and Wolstenholme, 1970; Riou and Yot, 1975, 1972; Price et al., 1976; Borst and Fairlamb, 1976; Borst et al., 1976) and has been shown to consist of thousands of minicircles and a lesser number of maxicircles catenated to-
gether into a large structure termed a net- work, which exists in vivo as the visible kinetoplast nucleoid body within the single mitochondrion of the cell. The function of the kinetoplast DNA is unknown, but it has been shown that several kinetoplast RNAs in Leishmania tarentolae are transcribed from the maxicircle sequences (Simpson and Simpson, 1978). A comparative study of the kinetoplast DNA from the different genera of hemoflagellates may prove to be important in achieving an evolutionary understanding of this unusual mitochondrial DNA. Therefore we have isolated and characterized the kinetoplast DNA of P. davidi and have also made some preliminary observations on the stable RNA species localized in purified kinetoplast fractions.
MATERIALS AND METHODS
Cell Culture
Clonal strain PC-2 cells were grown in Difco brain-heart infusion medium with 10 pg of hemin/ml in rotating bottles at 27°C.
297 0147-619X/78/0013-0297$02.00/O Copyright 0 1978 by Academic Press, Inc. All rights of reproduction in any form reserved.

298 CHENG AND SIMPSON
One-liter cultures were inoculated with 1 ml of late log-phase cells 3 days before har- vesting.
K-DNA Isolation
Method 1. This is a modification of the method of Simpson and Berliner (1974) for the isolation of K-DNA from L. tarentolae. Lysis was for 2 h at 60°C in 0.15 M NaCl- 0.1 M EDTA (pH 8) with 3% sarkosyl and 0.25 mg/ml of RronaseCB. The lysate was then sheared by passage through a No. 18 needle at 2.5-25 psi and the networks were pelleted by centrifugation in the SW27 rotor for 2 h at 24,000 t-pm (YC). The pellets were resuspended in 0.1 x SSC (0.015 M
NaCl-0.0015 M Nacitrate) and then brought to SSC for digestion with RNase A and RNase Tl (20 pg/ml and 20 U/ml, respec- tively; 30 min, 37°C). Pronase was then added to 100 pg/ml and the incubation con- tinued for 30 min. Solid CsCl and concen- trated ethidium bromide (EthBr) were added to a final refractive index of 1.3875 (25°C) and a dye concentration of 300 CLg/ml. The tubes were centrifuged in the Ti60 rotor for 40 h at 40,000 rpm and 2O”C, and the lower DNA band was collected and the dye removed by extraction with isoamyl alcohol. The DNA was then dialyzed versus 10 mM Tris-HC1:O.l mM EDTA (pH 7.9)(TE) and ethanol-precipitated. The final pellet was suspended in TE at 0.5 pg/ ~1 and stored at 5°C with chloroform.
Method ZZ. The kinetoplast-mitochon- drion fraction was obtained by a modifica- tion of the method of Braly et al. (1974) as described by Simpson and Simpson (1978). The final kinetoplast-mitochon- drion fraction was diluted with 0.25 M sucrose:0.02 M Tris-HCl (pH 7.9):2 mM MgC& and centrifuged in the SS34 rotor at 11,500 rpm for 15 min at 5”C, and the pellet was washed once in the same medium. The pellet was then resuspended in 0.15 M
NaCl-0.1 M EDTA (pH 7.9) and lysed with 3% sarkosyl and 0.5 mg/ml of PronaseCB at 60°C for 1.5 h. The lysate was then ex-
tracted with phenol and precipitated with 2 vol of ethanol. The DNA was then digested with RNase and F’ronase and the closed net- works were recovered by EthBr-CsCl equilibrium centrifugation as described pre- viously.
K-RNA Isolation
The purified kinetoplast-mitochondrion fraction was resuspended in 0.01 M Tris- HCl (pH 7.4):O.Ol M MgC& and lysed by the addition of 1% sodium dodecyl sulfate. The lysate was phenol-extracted and precipi- tated twice with 2 vol of ethanol. The pre- cipitate was resuspended in TE.
Light Microscopy of Cells and K-DNA Networks
This was performed as described previ- ously (Simpson and Berliner, 1974).
Analytical CsCl Centrifugation
This was performed as described previ- ously (Simpson and da Silva, 1971).
Band Sedimentation of K-DNA
K-DNA networks (lo-20 pug in 0.2 ml of TE) were sedimented in 5 ml of 5-20% sucrose gradients in 0.15 M NaCl-0.015 M Na citrate (pH 7) @SC) in the SW65 rotor for 20 min at 15,000 rpm, and the gradients were fractionated and the A,,, nm monitored with an Isco D fractionator. The szo, w values were calculated by use of the method of Burgi and Hershey (1963). This equation was found to be valid for the SW65 rotor by use of standards of known s values- intact K-DNA networks from L. tarentolae (Simpson and Berliner, 1974) and C. fasci- culata (Simpson and Simpson, 1974).
K-DNA was sonicated (20 pg of DNA in 200 ~1 of TE; 5-s sonication at a power of 20; Biosonic III microprobe) and sedimented in a 5-ml 5-20% sucrose gradient in either SSC or 1 M NaCl:O.Ol M Tris-HCl (pH 12.8):1 mM EDTA for 4-4.5 h at 60,000 rpm in the SW65 rotor at 5°C. Tubes were

KINETOPLAST DNA IN PHYTOMONAS DAVID1 299
fractionated as above. For preparative pur- poses, 300 pg of K-DNA in 5 ml of TE was sonicated in a IS-ml Corex tube for 45 s at a power of 20 with the Medium Probe and sedimented in a 38-ml 5-20% sucrose gradient in either SSC or the same alkaline solution as above for 27-30 h at 24,000 rpm and 5°C.
Melting Analysis
Sonication. To break closed circular molecules, 20 pg of K-DNA in 1 ml of SSC (argon saturated) was sonicated in a 15-ml Corex tube at 4°C for 4 min with the medium probe, at a power of 20, in 30-s bursts. The DNA was then passed through a Sephadex G-25 + Chelex 100 column in TE, ethanol- precipitated, and resuspended in 1 ml of SSC saturated with helium. Melting was performed as described previously (Simp- son and da Silva, 1971). After melting, the DNA was annealed at 61°C for more than 20 h before remelting.
Single nicking. This was performed as de- scribed previously (Greenfield et al., 1976), using a final DNase I concentration of 0.1 pg/ml and an EthBr concentration of 90 pg/ml. Dye was removed by phenol extrac- tion and the DNA was ethanol-precipitated. Both monomeric minicircles and networks were quantitatively single-nicked by this procedure. The extent of nicking of the net- works was assayed by alkaline sucrose band sedimentation of 3H-labeled nicked net- works. Approximately 45% of the labeled DNA banded at the position of unit length single stranded linear-s and the remaining labeled DNA pelleted. Melting and re- melting were performed as above.
Labeling of K-DNA
Cells were grown in Neo YE medium (Simpson and Berliner, 1974) to a cell density of 2 x lo6 cells/ml, and 3H-thy- midine (11 C/mM) was added to 5 @/ml and growth was continued for 2 days. The specific activity of the isolated K-DNA was 98,000 cprn/pg.
Restriction Endonuclease Digestion of K-DNA
This was performed as described else- where (Simpson and Hyman, 1978). Usually 2 pg of K-DNA was digested in a final volume of 50 ~1 in 1.5-ml Eppendorf tubes. Digestion proceeded for 20 h at 37°C. A second addition of enzyme was carried out 4-6 h after incubation had begun. The reac- tion was terminated by ethanol precipita- tion. The final pellets were resuspended in 25% glycerol, 2.5% sarkosyl, 0.03% brom- phenol blue, 0.03% xylene cyan01 CFF. The following restriction endonucleases were purchased from New England Biolabs: HpaII, HaeIII, BamHl, EcoRI, SalI, AluI, PstI, HhaI, HpaI.
Acrylamide -Agarose Gel Electrophoresis
This was performed as described by Simpson and Hyman (1978). The gel dimen- sions were 17 x 13 x 0.2 cm. The electro- phoresis buffer was 40 mM Tris-acetate (pH 7.8):0.5 mM EDTA:5 mM Mg acetate. Electrophoresis was carried out at 40 V for 20 h at 25°C. The gel was then stained with 1 pg of EthBr/ml and photographed as de- scribed previously (Brunk and Simpson, 1977).
Acrylamide Gradient Gel Electrophoresis
This was performed as described else- where (Simpson and Hyman, 1978). The gels consisted of 3.5 or 6.0 to 10.0% linear acrylamide gradients with a 3.0% stacking gel. Electrophoresis was performed for 14- 16 h at 50 V and 25°C. The electrophore- sis buffer was 90 mM Tris-borate:2.5 mM EDTA, pH 8.3 (TBE buffer). Staining with EthBr and photography were performed as described previously.
Agarose Gel Electrophoresis
The horizontal gel apparatus of Kaplan et al. (1977) was used. The electrophoresis buffer was TBE. The gel dimensions were 20 x 40 x 0.5 cm. The l-2% gel was run at

180 V for 14.4 h at 10°C. The OS-1.5% gel 3H-Labeled +XRF fragments were used as a was run for 23 h at 50 V and 6 h at 100 V complexity standard (Wesley and Simpson, and 25°C. hH80dara DNA digested with 1973c). BumHI was supplied by Dr. G. Wilcox. DNA fragments were sized by cosedi- ADNA was purchased from Miles Labora- mentation with 32P-single-nicked L. taren- tories. Ml3 RF was isolated as described tolae monomers (870 nucleotide pairs) elsewhere (Simpson and Hyman, 1978). T, through a 5-20% alkaline sucrose gradient DNA was the gift of Dr. P. Englund. in the SW65 rotor at 52,000 rpm for 16 hr at
5°C. Acrylamide Gel Electrophoresis for RNA
This was performed as described by RESULTS
Simpson and Simpson (1978). The gel con- Cell Culture sisted of a running portion of 5% acrylamide and a stacking portion of 3% acrylamide The original stock of P. davidi (obtained
and had dimensions of 10 x 13 x 0.2 cm. from Dr. R. B. McGhee) was successfully
Purified 9 and 12 S RNAs isolated from transfered to BHI medium with hemin, and
L. tarentolae kinetoplast fraction (Simp- a clonal strain (PC-2) was obtained by plat-
son and Simpson, 1978) were used as mark- ing on BHI agar. The log-phase doubling
ers. Electrophoresis was performed for 17 h time of the clonal strain was 4.5 h at 27°C
at 70 V and 25°C. Staining with EthBr and and the cells reached a maximum density of
photography were performed as described 2 x 10B/ml. The cells were mostly short
by Simpson and Hyman (1978). and stumpy with very short flagella. Long slender forms with long flagella appeared
Electron Microscopy of K-DNA infrequently at a maximum rate of approxi- mately 1%.
This was performed as described previ- ously (Simpson and da Silva, 1971), using a Fragmentation of K-DNA Networks during water hypophase and carbon-coated 400- Zsolation mesh grids. 4XRF II DNA was isolated as described previously (Wesley and Simpson, The yield and intactness of the K-DNA
1973a) and cospread as an internal standard. networks from P. davidi depended on the conditions of isolation. The standard isola-
Reassociation Analysis tion procedure had a yield of approximately 300 pg of K-DNA/liter of stationary-phase
3H-Labeled K-DNA (98,000 cpm/pg) in 5 cells at a density of 2.2 x lo* cells/ml. The ml of Argon-saturated 10 mM NaCl:lO mM intactness of the networks was monitored Tris-HCl (pH 8):l mM EDTA was frag- by band sedimentation in neutral sucrose mented by sonication for a total of 15 min gradients and light microscopy of Giemsa- with the medium probe at a power of 20. stained smears. The standard isolation The DNA was then precipitated with method yielded highly fragmented net- ethanol and resuspended in 0.12 M Na phos- works, as shown both by the appearance of phate buffer (pH 6.8). For C$ analysis the two distinct sedimenting bands with average DNA was kept at 100°C for 10 min and s&,,, values of 710 ? 40 (12) and 1250 ? 100 allowed to anneal at 60°C. Hydroxyapatite (6) (Fig. 2D) and by the Giemsa smear in chromatography was performed as de- Fig. 1A. Reduction in the pressure applied scribed previously (Wesley and Simpson, during the lysate shearing step led to the 1973~). The “Finger” least-squares com- appearance of a third sedimenting com- puter program of Britten et al. (1974) was ponent with an approximate sedimentation _ _ used to fit second-order curves to the data. coefficient of 2125 ? 100 S (8) (Figs. 2A,
300 CHENG AND SIMPSON

KINETOPLAST DNA IN PHYTOMONAS DAVID1 301
FIG. 1. Light microscopy of Giemsa-stained K-DNA networks isolated by different methods. Smears of the K-DNA were prepared as described under Materials and Methods. (A) Isolation method I. (B) Isolation method II. (C) (D) Isolation method of Kleisen ef al. (1975).

302 CHENG AND SIMPSON
VOLUME (ml1
FIG. 2. Band sedimentation of K-DNA networks in neutral sucrose gradients. Approximately 10 pg of DNA was layered on a 5-ml 5-20% sucrose gradient (SSC) and centrifuged in the SW6S rotor at 15,000 rpm for 20 min at 5°C. Peaks a, b, and c represent the three sedimentation components of K-DNA net- works. (A) Isolation method II. (B) Isolation method I (6-psi shear step). (C) Modification of the method of Kleisen et al. (1975). (D) Isolation method I (25- psi shear step). The recorder chart speed in D was half that of the gradients in A, B, and C.
B, and C). The sedimentation analysis was substantiated by the improved appearance of the networks in Giemsa-stained smears (Figs. lB, C, and D).
Several sedimenting network com- ponents were also seen in alkaline band sedimentation (Fig. 3). Isolation method I (25psi shear step) (Fig. 3A) yielded a major peak (b) and a minor peak (a). A reduction in the pressure applied during the lysate shearing step led to the appearance of a more rapidly sedimenting peak (Fig. 3B), (peak C).
Buoyant Densities and Melting Temperatures of K-DNA and N-DNA
The buoyant densities and T, values for the K-DNA and N-DNA are presented in Table 1 and Fig. 4. A minor buoyant band (arrow, 1.687 g/ml) was present in all preparations of K-DNA, but was not studied further. The percentage G + C of both the K-DNA and the N-DNA calculated from the buoyant densities agreed fairly well with that calculated from the T,, implying the absence of unusual bases.
Percentage of K-DNA in Total Cell DNA
Total cell DNA was isolated from sta- tionary-phase cells and analyzed in buoyant CsCl (Fig. 4C). The 1.699 K-DNA satellite represented approximately 21% of the total cell DNA. It was shown by EthBr-CsCl equilibrium centrifugation (data not pre- sented) that essentially all of the 1.699 g/ml CsCl peak consisted of covalently closed circular molecules.
Band Sedimentation of Sonicated Closed Networks
Sonication conditions were used which gave optimal yields of closed monomeric minicircles from L. tarentolae networks. A typical band sedimentation profile in alka- line sucrose is shown in Fig. 5. Peak 2 was demonstrated to consist of closed mono- meric minicircles by electron microscopy; approximately 25% of the total K-DNA was recovered in this fraction. Peaks 1, 3, and 4 represented single-stranded fragments, closed dimers, and closed trimers, respec- tively .
Cosedimentation of sonicated P. davidi
4
L I LO 4.0 30 2.0 $0 0
VOLUME lmll
FIG. 3. Band sedimentation of K-DNA networks in alkaline sucrose gradients. Approximately 10 pg of DNA was layered on a 5-ml 5-20% alkaline sucrose gradient (pH 12.8) and centrifuged in the SW65 rotor for 20 min at 15,000 rpm and 5°C. (A) Isolation method I (25-psi shear step). (B) Isolation method I (6-psi shear step). Peaks a, b, and c represent the three sedimentation components of K-DNA networks.

KINETOPLAST DNA IN PHYTOMONAS DAVID1 303
FIG. 4. Analytical C&l equilibrium centrifugation of K-DNA and N-DNA. (A) Lower band from an EthBr- CsCl gradient ofpelleted networks (method I). The arrow indicates the minor low-density peak of unknown origin. (B) Upper band from an EthBr-CsC1 gradient of pelleted networks (method I). Note the presence of contaminat- ing N-DNA in addition to open networks. (C) Total cell DNA. The density reference is Micrococcus lyso- deikticus.
networks with sonicated L. tarentolae net- identities of the peaks in Fig. 6 were veri- works gave an s value of 20.5 for the P. fied by electron microscopy. Fraction 1 con- davidi closed monomers, assuming a value tained mainly linears less than unit mono- of 18.2 S for the L. tarentolae closed mer length, fraction 2 contained mainly unit monomers (Wesley and Simpson, 1973b). length linears and monomeric minicircles,
Neutral sucrose band sedimentation of fraction 3 contained mainly catenated sonicated networks was also performed. As dimeric minicircles and figure eight-type shown in the two experiments presented in molecules, and fraction 4 contained mainly Fig. 6, the closed monomer peak (c) was trimeric minicircles and higher oligomers. poorly separated from the linear fragment peaks (a,b). More breakage of monomers M 1 o ecular occurred in B than in A, as shown by the
Weight of Minicircies
increased relative proportion of the unit Closed monomeric minicircles were iso- length linear peak compared to the mono- lated by alkaline sucrose band sedimenta- merit minicircle peak. Using L. tarentolae tion and then single-nicked by the DNase 10.2 S monomers as a reference, s values of I-EthBr method of Greenfield et al. (1975) 11.0, 15.5, and 18.9 were obtained, respec- and cospread with +XRF II [5375 base tively, for P. davidi closed monomers, pairs (Sanger et al., 1977)]. The mean dimers, and trimers in neutral sucrose. The molecular weight of the open minicircles
TABLE 1
BUOYANT DENSITIES, MELTING TEMPERATURES, AND G + C CONTENTS OF NUCLEAR AND KINET~PLAST DNA
DNA
Nuclear Kinetoplast X peak
pCsCl (g/ml) G + C” (%) Tm (“‘3 G + C” (%)
1.718 + 0.001 (3)c 59.2 92.2 r 0.4 (2) 55.9 1.699 & 0.001 (9) 39.5 84.2 5 1.4 (2) 36.4 1.687 % 0.001 (7) 27.5 - -
D Calculated from pCsCl (Szybalski and Szybalski, 1971). * Calculated from T,,, (Marmur and Doty, 1962). c Mean f one standard deviation (number of runs).

304 CHENG AND SIMPSON
36 30 24 18 (2 6 0
VOLUME (ml)
FIG. 5. Alkaline band sedimentation of sonicated K-DNA. K-DNA networks were sonicated as de- scribed under Materials and Methods and 300 /.~g of DNA was layered on a 36-ml 5-20% alkaline sucrose gradient (pH 12.8) and centrifuged in the SW27 rotor for 26 h at 24,000 rpm and 5°C.
was 0.70 x 1Ofi or 1064 + 54 base pairs of 0.37 + 0.02~pm contour length. The fre- quency length distribution of the open mon- omers was somewhat non-Gaussian, but in this calculation we ignore any possible minor length heterogeneity.
Superhelical Density of Networks
It was demonstrated above that essen- tially all of the K-DNA present as a 1.699 g/ml satellite in total cell DNA from sta-
FIG. 6. Band sedimentation of sonicated networks in neutral sucrose. Two separate preparations of K-DNA were sonicated and sedimented through 5-20% sucrose gradients in SSC for 4 h at 60,000 rpm and 5°C in the SW65 rotor. (A) The peaks are labeled a-e. (B) This gradient was preparative; the indicated fractions 1, 2, and 3 were collected and the DNA was processed for electron microscopy and gel electrophoresis.
0 0 5 10 15 20 25 30 35 40
FRACTION NUMBER
FIG. 7. EthBr-CsCI equilibrium gradient of JH- labeled closed minicircles together with unlabeled K-DNA networks and N-DNA. The 3H-labeled closed minicircles were obtained by alkaline sedimentation of sonicated networks. Centrifugation was for 72 h at 40,000 rpm in the Ti60 rotor at 20°C. Fractions were collected from the bottom and diluted for measurement of radioactivity and DNA fluorescence. The positions of the unlabeled networks and N-DNA are indicated by arrows.
tionary cells banded in EthBr-CsCl gra- dients in the position characteristic of covalently closed circular molecules. How- ever, a variable minor portion of isolated K-DNA banded in EthBr-CsCl gradients in the upper position characteristic of open and linear molecules.
The relative superhelical density of closed networks isolated from the late log-phase cells by several methods was measured by cobanding unlabeled closed networks and N-DNA together with 3H-labeled closed monomeric minicircles. As shown in Fig. 7, the networks banded a little above the closed monomers, implying that these net- works contained some nicked minicircles. K-DNA networks isolated by the method of Kleisen et al. (1975) cobanded with the networks in Fig. 7. No extremely low- density EthBr-CsCl network band was seen, as reported for C. luciliae K-DNA (Kleisen et al., 1975).
Heterogeneity of Closed Monomeric Minicircles
Purified closed monomers isolated by alkaline sucrose sedimentation of sonicated networks exhibited a complex banding pat-
KINETOPLAST DNA IN PHYTOMONAS DAVID1 305
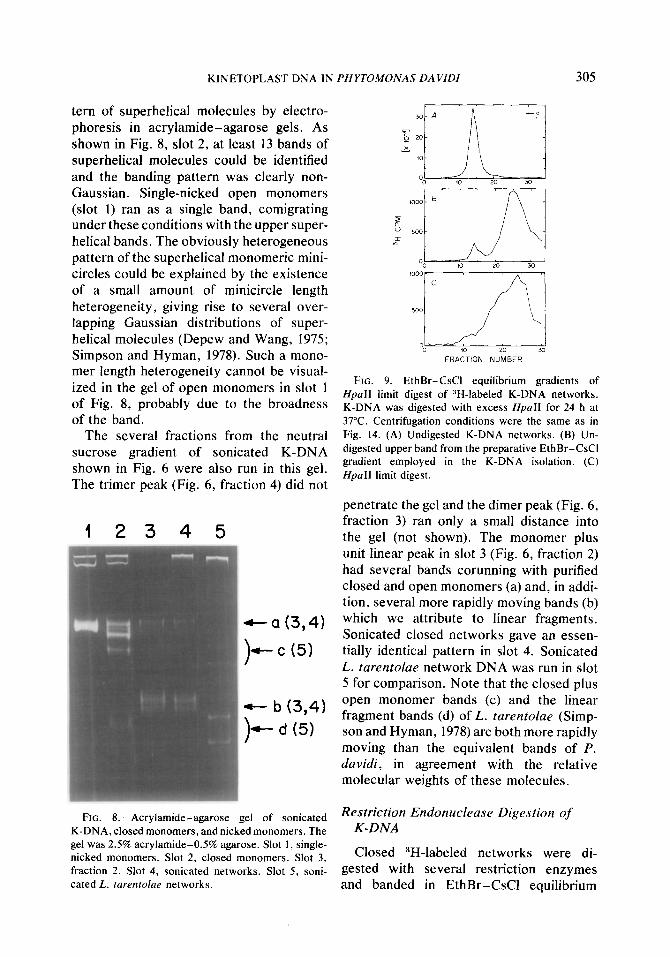
tern of superhelical molecules by electro- phoresis in acrylamide-agarose gels. As shown in Fig. 8, slot 2, at least 13 bands of superhelical molecules could be identified and the banding pattern was clearly non- Gaussian. Single-nicked open monomers (slot 1) ran as a single band, comigrating under these conditions with the upper super- helical bands. The obviously heterogeneous pattern of the superhelical monomeric mini- circles could be explained by the existence of a small amount of minicircle length heterogeneity, giving rise to several over- lapping Gaussian distributions of super- helical molecules (Depew and Wang, 1975; Simpson and Hyman, 1978). Such a mono- mer length heterogeneity cannot be visual- ized in the gel of open monomers in slot 1 of Fig. 8, probably due to the broadness of the band.
The several fractions from the neutral sucrose gradient of sonicated K-DNA shown in Fig. 6 were also run in this gel. The trimer peak (Fig. 6, fraction 4) did not
123 4 5
c-a (3,4)
> c-c (5)
- b (3,4)
> - d (5)
FIG. 8. Acrylamide-agarose gel of sonicated K-DNA, closed monomers, and nicked monomers. The gel was 2.5% acrylamide-0.5% agarose. Slot 1, single- nicked monomers. Slot 2, closed monomers. Slot 3, fraction 2. Slot 4, sonicated networks. Slot 5, soni- cated L. tarentolae networks.
FRACTION NUMBER
FIG. 9. EthBr-CsC1 equilibrium gradients of HpaII limit digest of 3H-labeled K-DNA networks. K-DNA was digested with excess HpaII for 24 h at 37°C. Centrifugation conditions were the same as in Fig. 14. (A) Undigested K-DNA networks. (B) Un- digested upper band from the preparative EthBr-CsCI gradient employed in the K-DNA isolation. (C) HpaII limit digest.
penetrate the gel and the dimer peak (Fig. 6, fraction 3) ran only a small distance into the gel (not shown). The monomer plus unit linear peak in slot 3 (Fig. 6, fraction 2) had several bands corunning with purified closed and open monomers (a) and, in addi- tion, several more rapidly moving bands (b) which we attribute to linear fragments. Sonicated closed networks gave an essen- tially identical pattern in slot 4. Sonicated L. tarentofae network DNA was run in slot 5 for comparison. Note that the closed plus open monomer bands (c) and the linear fragment bands (d) of L. tarentolae (Simp- son and Hyman, 1978) are both more rapidly moving than the equivalent bands of P. davidi, in agreement with the relative molecular weights of these molecules.
Restriction Endonuclease Digestion of K-DNA
Closed 3H-labeled networks were di- gested with several restriction enzymes and banded in EthBr-CsCl equilibrium

FIG. 10. Acrylamide gradient gel of restricted The minicircle fragment banding patterns
K-DNA. The gel was a 3.5-10% linear acrylamide in both acrylamide and agarose are clearly gradient with a 3% stack. Slot I, networkslHpaI1. heterogeneous, in that the bands are not in Slot 2, networksiHaeII1. Slot 3, Ml3 RFIHpaII. The molar yields and the sum of the molecular gel was stained with EthBr and photographed as de- scribed.
weights of the fragments adds up to greater than unit monomer molecular weight.
gradients to determine the extent of break- down. Significant cleavage of the closed
Extent of Minicircle Sequence
circular molecules was observed with the Heterogeneity
enzymesHpaII,HueIII,NpaI,andBamHI, This was examined by comparing the while little cleavage was observed with melting temperature of the K-DNA before EcoRI and SalI. For example, the closed and after self-annealing. It was found that network EthBr-CsC1 lower band in Fig. 9A the melting temperature of the annealed was converted to the broad upper band in K-DNA depended somewhat on the method Fig. 9C by complete digestion with HpaII. used to break the closed minicircular mole- Note that there is still some undigested cules in the network. lower band material in Fig. 9C. This is ex- As shown in Figs. 12B and C, annealed amined further below and shown to be K-DNA which had been broken by sonica- HpaII-resistant K-DNA. tion melted 1.8”C below the original T,,
The HpuII and Hue111 digestion products whereas annealed K-DNA which had been were separated by electrophoresis in an opened by single-nicking with DNase I acrylamide gradient gel, as shown in Fig. 10. + EthBr melted at almost the original T,.
Electrophoresis in agarose is thought in The latter only differed in a 0.7”C shift in the some cases to give more reliable molecular minor low meltine comuonent. The melting
306 CHENG AND SIMPSON
weights than electrophoresis in acrylamide (Thomas and Davis, 1975; Simpson and Hy- man, 1978). A l-2% agarose gel of networks restricted with several different enzymes is shown in Fig. 11. Also run in this agarose gel are the several fractions isolated by neutral sucrose sedimentation of sonicated networks (Fig. 6B). Note the similarity be- tween the low molecular weight bands (a) released by sonication (slots 1 and 4) and those released by HpuII digestion [slot 6, cf. (a) in Fig. 10, slot 11. These bands may possibly represent single-cleaved mini- circles of slightly different contour lengths; the apparent fragment sizes vary from 1100 to 1400 base pairs. The same group of bands is seen after digestion with EcoRI (slot 9), Sal1 (slot lo), and A/u1 (slot 13). High molecular weight bands are seen after diges- tion with HpaII, HueIII, S&I, BumHI, AfuI, and HhaI, and represent presump- tive maxicircle-derived fragments. The HpuII and HhuI upper bands cannot be seen in this gel due to underloading.

a (
KINETOPLAST DNA IN PHYTOMONAS DAVID1 307
1 2 3 4 5 6 7 8 9 10 11 12 13 44 15 BP
- - -
-
-
-
-
-
-
-
-
20,000 10,000 8,000
6,000
1,000
800
600
400
FIG. II. Agarose gel of K-DNA restriction fragments and sonication fragments. The upper portion horizon tal gel was 1% agarose, while the lower portion was 2% agarose. Electrophoresis was performed fo at 180 V ’ and 10°C. The gel was stained with 1 pg of EthBriml and destained for 2 h. Slot 1, fraction 2 of the sucrose gradient in Fig. 6B. Slot 2, fraction 3, Fig. 6B. Slot 3, fraction 4, Fig. 6B. Slot 4, sonicated net Slot 5, Ml3 RFIHpaIII. Slot 6, networkslHpaI1. Slot 7, networks/HueIII. Slot 8, AHSOdaralBamHI. networl rs/EcoRI. Slot 10, networks/S&. Slot 11, networkslBamH1. Slot 12, A/EcoRI. Slot 13, net Alul. Sl ot 14, networks/Pstl. Slot 15, networks/Hha 1.
of the r 14.4 h neutral works. Slot 9,
tworksl

308 CHENG AND SIMPSON
/I 020 70 80 ~ 90
T “T m2 m
J 0
TEMPERATURE (“C)
FIG. 12. Melting curves of K-DNA. (A) K-DNA was sonicated extensively and melted in SSC. (B) After the first melting, the DNA was annealed at 61°C for 24 h and then remelted. (C) K-DNA networks were single- nicked with DNase I plus EthBr and then melted in SSC (T,,,,). After annealing at 57°C for 24 h, the DNA was remelted (T,,).
curve of the original sonicated K-DNA showed a minor low melting component and a major apparently single component (Fig. 12A). These results imply that the sequence heterogeneity in the minicircle DNA (which is the major component of total K-DNA) amounts to no more than 2-4% of the base pairs.
Evidence for Maxicircle Sequences in the Network DNA
As mentioned above, several enzymes produced high molecular weight fragments with network DNA (Fig. Il). Such network- specific upper bands were seen with HpaII, HaeIII, EcoRI, HpaI, SalI, BumHI, AluI, and HhaI. The molecular weights of the two Hue111 upper bands and the three HpaII upper bands are given in Table 2. Note that the sum of the molecular weight of the upper bands from both enzymes is approxi- mately 24 x 106. This value agrees well with the molecular weight of the single high molecular weight fragment liberated by digestion with HpuII in the presence of EthBr. Parker et al. (1977) have shown that, under the right conditions, EthBr can limit the cleavage of a closed circular molecule by a restriction endonuclease to only one of
the several possible sites on the molecule, thus producing a set of single-cleaved per- muted linears. We conclude that the P. duvidi maxicircle molecular weight is ap- proximately 24 x lo6 (36-kb or 12-pm DNA).
Electron microscopic evidence for the existence of large “edge loops” extending from purified K-DNA networks was also obtained. Figures 13A, B, and C show sev- eral micrographs of apparently supertwisted maxicircle edge loops extending from K-DNA networks. Long molecules not supertwisted were also seen attached to net- works (Fig. 13D).
Hpu II-Resistant K-DNA
K-DNA was extensively digested with HpuII and the undigested material was recovered by EthBr-CsCl equilibrium centrifugation (Fig. SC). A control sample was treated exactly the same, except that no enzyme was added. Both the experi- mental and control lower band materials were then digested with HpuII or Hue111 and the fragments were separated by elec- trophoresis in an acrylamide gradient gel, as shown in Fig. 14. The HpuII-resistant K-DNA was entirely resistant to further di-

KINETOPLAST DNA IN PHYTOMONAS DAVID1 309
gestion with @aI1 (slot 6), whereas the control K-DNA showed the identical diges- tion pattern with HpaII as did the original K-DNA (slots 1 and 3). The HpaII-resist- ant K-DNA was cleaved by Hae III (slot 7), but by comparing slots 7, 8, and 2 it is clear that several bands are missing in the Hue111 digest of the HpaII-resistant K-DNA. This implies that the HpaII-resistant K-DNA is a variant of the HpaII-sensitive K-DNA and lacks several HueIII restriction sites.
Also shown in this gel are profiles of a double HpaII + Hue111 digest of total K-DNA (slot 8) and, for comparison, an HpuII + Hue111 digest of L. turentolue K-DNA (slot 9). Sonicated P. duvidi net- works are run in slot 10 and sonicated L. turentolue networks in slot 11. The labeled arrows indicate the positions of (a) the linear fragment bands of sonicated P. duvidi net- works (cf. Fig. 8, slots 3 and 4), (b) closed monomeric minicircles from sonicated L. turentofue networks (cf. Fig. 8, slot S), and (c) linear fragments from sonicated L. turentolue networks (cf. Fig. 8, slot 6).
Renuturution Kinetics of K-DNA
Closed 3H-labeled networks were frag- mented to an average size of 485 nucleo- tide pairs and subjected to C,t analysis by hydroxyapetite chromatography. 3H- Labeled 4XRF DNA fragmented to an average size of 470 nucleotide pairs was used as a complexity standard. The kinetics of renaturation are shown in Fig. 15. The K,,,, for the single second-order component of the K-DNA renaturation curve is 388 and that for the 4XRF curve is 103. This yields a complexity of 1427 nucleotide pairs for the K-DNA, which is about 1.3 times the size of the minicircle as measured in the electron microscope. We did not at- tempt to Cd-fractionate the K-DNA to search for a high-complexity component.
Presence of 9 and 12 S Kinetoplust RNA
A highly purified kinetoplast-mito- chondrion fraction was obtained by isopyc-
TABLE 2
MOLECULAR WEIGHT OF K-DNA MAXICIRCLE FRAGMENTS
Enzyme Band Molecular weight
(X 106)O
HpaIIb
Total
HaeIIIb
Total
HpaII + EthBr’
1 18.8 2 3.0 3 2.8
24.0
1 20.0 2 3.7
23.7
23.6
(1 Molecular weights were determined by electro- phoresis in a horizontal 0.5% agarose slab gel, as described under Materials and Methods. The following standards were corun: T, DNA (25 x 10”) (Freifelder, 1970); AlEcoR digest (Helling et al., 1974); ADNA (30.8 x 10⁶); L. tarenrolae K-DNA maxicircle HpaII fragments (9.14 x 10⁶, 4.54 x lo”, 2.66 x 10⁶) (Simp- son and Hyman, 1978). A nonlinear curve-fitting program (Parker et al., 1977) was used to fit a smooth standard curve with an error of 2.6%.
b P. duvidi K-DNA (5 pg) was digested for 26 h at 37°C with 14 U of HpaII or Hue111 in the appropriate buffer.
c P. duvidi K-DNA (20 pg) was digested for 26 h at 37°C with 21 LJ of HpaII in the presence of 40 pg of EthBr. The digest was cooled and centrifuged at 30,000 rpm in the No. 50 rotor for 30 min to pellet any undigested networks, and the DNA in the supemate was ethanol-precipitated. The single high molecular weight fragment liberated is presumed to represent permuted single-cleaved maxicircle linears (Parker et al., 1977).
nit centrifugation in Renografin density gradients of a hypotonic lysate of late log- phase cells as described under Materials and Methods. Total RNA was extracted from this fraction and run in a 3-5% acrylamide gel. As shown in Fig. 16A, two EthBr- stained species migrated at identical rates as the kinetoplast 9 and 12 S RNAs from L. turentolue. These bands were unaffected by prior digestion with DNase I (Fig. 16B, slot 2) and were entirely eliminated by prior digestion with RNase (Fig. 16B, slot 3). The nature of the intermediate band be- tween the 9 and 12 S RNAs in Fig. 16A is

310 CHENG AND SIMPSON
FIG. 13. Electron micrographs of K-DNA networks showing edge loops. Supertwisted and extending long molecules at the edges of networks are indicated by arrows. The bar indicates 1 pm.

KINETOPLAST DNA IN PHYTOMONAS DAVID1 311
BP 1234567891011
820 800 650 560 460
,-
I-
Ml) a (10)
FIG. 14. Evidence for HpnII-resistant K-DNA. A 6-10% gradient acrylamide gel of restricted and sonicated K-DNA. Slot 1, original K-DNAIHpaII. Slot 2, original K-DNAIHueIII. Slot 3, control K-DNAIHpaII. Slot 4, control K-DNAIHueIII. Slot 5, Ml3 RFIHpaII. Slot 6, HpaII-resistant K-DNAIHpaII. Slot 7, HapII-resistant K-DNAIHueIII. Slot 8, control K-DNA/HpaII + HueIII. Slot 9, L. tarentolae K-DNA/HpaII + HaeIII. SLot 10, sonicated P. davidi networks. Slot 11, sonicated L. rarentolae networks. HpaII-resistant K-DNA was isolated as shown in Fig. 9C. The control DNA was treated identically, except that no enzyme was used.
not known; this band was no longer present after storage at -20°C as seen in the gel in Fig. 16, slot 1.
DISCUSSION
The properties of the K-DNA of P. duvidi are essentially the same as those of other K-DNAs that have been reported. The size of the minicircle is larger than that of L. tarentolae and T. brucei and smaller than that of T. cruzi, T. lewisi, or Crithidia. The size of the network and the sensitivity to damage by shear are similar to the situation in L. tarentolae (Simpson and Berliner,
1974), but quite different from the situation in Crithidia where the networks are larger and quite stable during the isolation. It is of some interest that the networks fragment into several discrete sedimenting species with approximate average s values of 700, 1200, and 2100 in neutral sucrose. We specu- late that this pattern of fragmentation is related to the topological organization of minicircles within the network. The frag- mentation of P. davidi networks was also observed in the light and electron micro- scopes. Several different methods for isola- tion of K-DNA were compared in an attempt to recover entirely intact networks. In terms

312 CHENG AND SIMPSON
FIG. 15. Renaturation kinetics of P. davidi K-DNA and +XRF DNA. The 3H-labeled K-DNA fragments and SH-labeled $XRF fragments were subjected to renaturation kinetic analysis by hydroxyapetite chromatography, as described under Materials and Methods. The lines represent the best single second- order component fits to the data. A control experi- ment showed that the DNA fragment size did not change during the renaturation experiment.
of morphology and sedimentation, the best network preparations were obtained by the methods which avoided a shearing step.
As in the case of L. tarentolae, essen- tially all of the K-DNA from stationary- phase cells is covalently closed and bands fairly close to the position of closed mono- meric minicircles in equilibrium EthBr- CsCl gradients. However, K-DNA isolated by methods that involved shearing always had minor amounts of entirely open net- works that banded in the upper position in the EthBr-CsCl gradient. These open networks either may be artifacts of frag- mentation or may have been selectively en- riched by differential centrifugation during the isolation procedure, since Englund et al. (1977) have reported that net- works in replication are “open” and possess a larger s value than nonreplicating networks.
Minicircle sequence microheterogeneity has been reported to occur in C. luciliae (Kleisen et al., 1976), T. cruzi (Riou and Yot, 1975, 1977), T. brucei (Borst and Fairlamb, 1976), andL. tarentolae (Simpson and Hyman, 1976, 1978). P. davidi K-DNA minicircles show a similar type of sequence
microheterogeneity, as evidenced by the limit restriction profiles with several en- zymes, the presence of a portion of the K-DNA totally resistant to digestion with certain enzymes, the small decrease in the melting temperature of reannealed K-DNA, and the rapid rate of renaturation of total K-DNA. A minicircle size heterogeneity, while not observable in the electron micro- scope, was evidenced by the heterogeneous agarose-acrylamide banding pattern of closed monomers and by the group of bands ranging from 1100 to 1400 nucleotide pairs released by sonication of networks and also by digestion with several different restric- tion enzymes. A limited minicircle size
+9s
-D
-b
FIG. 16. Acrylamide gel of nucleic acids from purified kinetoplast fraction. The gel consisted of a 5% running gel and a 3% stacking gel. (A) Total nucleic acids from purified kinetoplast fraction. The positions of L. tarentolae 9 and 12 S K-RNAs are indicated. (B) Slot 1, undigested control kinetoplast nucleic acids. Slot 2, digest with DNase I prior to electrophoresis. Slot 3, digested with RNase A and RNase Tl prior to electro- phoresis. After the DNase and RNase treatments, the samples were extracted with phenol and ethanol- precipitated.

KINETOPLAST DNA IN PHYTOMONAS DAVID1 313
heterogeneity has also been reported for C. luciliae (Kleisen et al. 1976) and L. tarentolae (Simpson and Hyman, 1976, 1977).
The HpaII-resistant K-DNA was shown to lack certain Hue111 sites. This implies that the HpaII-resistant minicricles differ somewhat in base sequence from the HpaII- sensitive minicircles.
As reported for the K-DNA of C. lucilae (Kleisen et al., 1976), T. brucei (Borst and Fairlamb, 1976), and L. tarentolae (Simpson and Hyman, 1976, 1978), the net- works of P. davidi contain a minor DNA component apparently more complex than the minicircle sequence, which has been termed the “maxicircle” by Kleisen et al. (1976). Digestion of networks with several restriction enzymes was shown to give rise to high molecular weight gel upper bands larger than minicircle unit size. We also could visualize in the electron microscope long, usually supertwisted “edge loops” extending out from networks, and we pre- sume that these represent closed maxi- circles attached to networks probably by catenation. We have estimated the maxi- circle molecular weight to be approximately 24 x 10” by summation of the upper bands produced by digestion with &a11 or Hue111 and by the liberation of once-cleaved per- muted linears by digestion with HpaII in the presence of EthBr.
Using the isolation technique developed for L. tarentolae (Braly et al., 1974), we were able to recover a purified kinetoplast- mitochondrion fraction from late log-phase P. duvidi cells. It is of some interest that this fraction contained 9 and 12 S RNAs which were identical in mobility to the 9 and 12 S RNAs isolated from purified kineto- plasts of L. tarentolae. In the case of L. tarentolae, we have shown elsewhere (Simpson and Simpson, 1978) that the kinetoplast 9 and 12 S RNAs are synthe- sized in an EthBr-sensitive process off the K-DNA maxicircle sequence. We have also shown (Simpson and Simpson, 1978) that
L. tarentolae 9 and 12 S K-RNAs hybridize to the upper band produced by Hue111 diges- tion of P. duvidi networks, whereas no observable hybridization was found be- tween cRNA transcribed in vitro off purified L. tarentolae minicircles and P. davidi K-DNA (unpublished results). Other work- ers have previously described the lack of homology between minicircles from dif- ferent species and even from different strains of the same species (Steinert et al., 1973; Steiner-t et al., 1976; Chance, 1976). The implication may be that there is some evolutionary conservation of the maxicircle DNA sequence, but little conservation of the minicircle sequence.
ACKNOWLEDGMENTS
This work was supported in part by research grants from the National Institute of Allergies and Infectious Diseases and from the UCLA Academic Senate. We thank Dr. B. McGhee for the original culture of Phytomonas davidi.
REFERENCES
BORST, P., AND FAIRLAMB, A. (1976). In “Biochemis- try of Parasites and Host-Parasite Relationships” (H. Van Den Bossche, ed.), pp. 169-191. North Holland, Amsterdam.
BORST, P., FAIRLAMB, A., FASE-FOWLER, F., HOEIJMAKERS, J., AND WEISLOGEL, $$ (1976). In “The Genetic Function of Mitochondrial DNA” (C. Saccone and A. M. Kroon, eds.), pp. 59-69. North Holland, Amsterdam.
BRALY, P., SIMPSON, L., AND KRETZER, F. (1974). Isolation of kinetoplast-mitochondrial complexes from L. tarentolae. J. Protozool. 21, 782-790.
BRITTEN, P., GRAHAM, D., AND NEUFELD, B. (1974). In “Methods in Enzymology, Vol. 29” (L. Gross- man and K. Moldave, eds.), pp. 363-418. Academic Press, New York.
BRUNK, C., AND SIMPSON, L. (1977). Comparison of various uv sources for fluorescent detection of EthBr-DNA, complexes in polyacrylamide gels. Anal. Biochem. 82, 455-462.
&JRGI, E., AND HERSHEY, A. (1963). Sedimentation rate as a measure of molecular weight. Biophys. J. 3, 309-321.
CHANCE, M. (1976). In “Biochemistry of Parasites and Host-Parasite Relationships” (H. Van den Bosche, ed.), pp. 229-235. North Holland, Amsterdam.
ENGLUND, P. T., DIMAIO, D. C., AND PRICE, S. S. (1977). A nicked form of kinetoplast DNA in

314 CHENG AND SIMPSON
Leishmania tarentolae. J. Biol. Chem. 252, 6208-6216.
FRANCA, C. (1911). Quelques notes sur Leptomonas davidi Lafont. Bull. Sot. Pathol. Exot. 4, 669-671.
FRANCA, C. (1911). Sur I’ existence en Portugal de Leptomonas davidi Lafont dans le latex de Euphorbia peplus L. et E. segetalis L. Bull. Sot. Pathol. Exot. 4, 532-536.
FRANCA, C. (1914). La flagellose des Euphorbes. Arch. Protistenk. 34, 108-132.
FRANCA, C. (1919). L’ insecte transmetteur de Leptomonas davidi. Bull. Sot. Pathol. Exot. 12, 513-514.
FRANCA, C. (1920). La flagellose des Euphorbes. Ann. Inst. Pasteur. 34, 432-466.
FREIFELDER, V. (1970). Molecular weights of coli- phages and coliphage DNA IV. Molecular weights of DNA from bacteriophages T4, T5, and T7 and the general problem of determination of M. J. Mol. Biol. 54, 567-577.
GREENFIELD, L., SIMPSON, L., AND KAPLAN, D. (1975). Conversion of closed circular molecules to single-nicked molecules by digestion with DNase I in the presence of ethidium bromide. Biochem. Bio- phys. Acta 407, 365-375.
HELLING, R. B., GOODMAN, H., AND BOYER, H. (1974). Analysis of endonuclease R. EcoRI fragments of DNA from lambdoid bacteriophages and other viruses by agarose-gel electrophoresis. J. Virol. 14, 1235-1244.
KAPLAN, D., Russo, R., AND WILCOX, G. (1977). An improved horizontal slab gel electrophoresis ap- paratus for DNA separation. Anal. Biochem. 78, 235-243.
KLEISEN, C. M., AND BORST, P. (1975). Sequence heterogeneity of the minicircle of kinetoplast DNA of Crithidia luciliae and evidence for the presence of a component more complex than minicircle DNA in the kinetoplast network. Biochem. Biophys. Acta 407, 473-478.
KLEISEN, C., BORST, P., AND WEIJERS, P. (1975). Properties of the intact multicellular complex from C. luciliae. Biochim. Biophys. Acta 390, 155-167.
KLEISEN, C., BORST, P., AND WEIJERS, P. (1976). The structure of kinetoplast DNA. 1. The mini- circles of Crithidia luciliae are heterogeneous in base sequence. Eur. J. Biochem. 64, 141-151.
KLEISEN, C., WEISLOGEL, P., FONCK, K., AND BORST, P. (1976). The structure of kinetoplast DNA. 2. Characterization of a novel component of high complexity present in the kinetoplast DNA network of Crithidia luciliae. Eur. J. Biochem. 64, 153-160.
LAFONT, A. (1909). Sur la presence dun parasite de la classe des flagelles dans le latex de I’Euphorbia pilutifera. C.R. Sot. Biol. 66, 1011-1013.
LASKEY, R., AND MILLS, A. (1975). Quantitative film detection of 3H and r4C in polyacrylamide gels by fluorography. Eur. J. Biochem. 56, 335-341.
MARMUR, J., AND DOTY, P. (1962). Determination of the base composition of DNA from its thermal denaturation temperature. J. Mol. Biol. 5, 109-l 18.
MCGHEE, R. B., AND POSTELL, F. (1976). Axenic cultivation of Phytomonas davidi Lafont (Try- panosomatidae). A symbiote of lacticiferous plants (Euphorbiaceae). J. Protozool. 23, 238-240.
PARKER. R., WATSON, R., AND VINOGRAD, J. (1977). Mapping of closed circular DNAs by cleavage with restriction endonucleases and calibration by agarose gel electrophoresis. Proc. Nat. Acad. Sci. USA 74, 851-855.
POSTELL, F. J., AND MCGHEE, R. (1975). Phytomonas davidi (Trypanosomatidae)-Transmission and uhrastructure. J. Protozool. 22, 10A.
PRICE, S., DIMAIO, D., AND ENGLUND, P. (1976). In “The Genetic Function of Mitochondrial DNA” (C. Saccone and A. M. Kroon, eds.), pp. 83-94. North Holland, Amsterdam.
RENGER, H., AND WOLSTENHOLME, D. (1970). Kinet- oplast DNA of the hemoflagellate T. lewisi. J. Cell. Biol. 47, 689-702.
RENGER, H., AND WOLSTENHOLME, D. (1972). The form and structure of kinetoplast DNA of Crithidia. J. Cell Biol. 54, 346-364.
RIOLJ, G., AND YOT, P. (1977). Heterogeneity of the kinetoplast DNA molecules of T. cruzi. Biochemis- try 16, 2390-2395.
SANGER, F., AIR, G., BARREL, B., BROWN, N., COULSON, A., FIDDES, J., HUTCHINSON, C., SLOCOMBE, P., AND SMITH, M. (1977). Nucleotide sequence of bacteriophage 4x174 DNA. Nature (London) 265, 687-695.
SIMPSON, L. (1972). The kinetoplast of the hemogla- gellates. Int. Rev. Cytol. 32, 139-209.
SIMPSON, L., AND BERLINER, J. (1974). Isolation of the kinetoplast DNA of L. tarentolae in the form of a network. J. Protozool. 21, 382-393.
SIMPSON, L., and DA SILVA, A. (1971). Isolation and characterization of kinetoplast DNA from Leish- mania tarentolae. J. Mol. Biol. 56, 443-473.
SIMPSON, L., AND HYMAN, B. (1976). Restriction enzyme analysis of Leishmania tarentolae kineto- plast DNA. In “Biochemistry of Parasites and Host-Parasite Relationships” (H. Van den Bossche, ed.), pp. 219-244. North Holland, Amsterdam.
SIMPSON, L., AND HYMAN, B. (1978). Heterogeneity of kinetoplast DNA of Leishmania tarentolae (in preparation).
SIMPSON, A. M., AND SIMPSON, L. (1974). Isolation and characterization of kinetoplast DNA networks and minicircles from C. fasciculata. J. Protozool. 21, 774-781.
SIMPSON, L., AND SIMPSON, A. M. (1978). Kineto- plast RNA of Leishmania tarentola. Cell (in press).
STEINERT, M., VAN ASSEL, S., BORST, P., AWD B. A. NEWTON, (1976). Evolution of kinetoplast DNA.

KINETOPLAST DNA IN PHYTOMONAS DAVIDI 315
In “The Genetic Function of Mitochondrial DNA” (C. Saccone and A. M. Kroon, eds.), pp. 71-81. North Holland, Amsterdam.
STEINERT, M., VAN ASSEL, S., BORST, P., MOL, .I., KLEISEN, C., AND NEWTON, B. (1973). Specific detection of kinetoplast DNA in cytological prepara- tions of trypanosomes by hybridization with com- plementary RNA. Exp. Cell Res. 76, 175-185.
SZYBALSKI, W., AND SZYBALSKI, E. (1971). In “Procedures in Nucleic Acid Research” (G. L. Cantoni and D. R. Davies, eds.), Vol. 2, pp. 311-354. Harper and Row, New York.
THOMAS, M., AND DAVIS, R. (1975). Studies on the cleavage of bacteriophage lambda DNA with EcoRI restriction endonuclease. J. Mol. Biol. 91, 315-328.
VAN DEN HONDEL, A., AND SCHOENMAKERS, J. (1975). Studies on bacteriophage Ml3 DNA. 1. A Cleavage Map of the M 13 Genome. Eur. J. Biochem. 53, 547-5.58.
WESLEY, R. D., AND SIMPSON, L. (1973a). Studies on kinetoplast DNA. 1. Isolation of kinetoplast DNA minicircles from Leishmaniu farentolae. Biochem. Biophys. Acta 319, 237-253.
WESLEY, R. D., AND SIMPSON, L. (1973b). Studies on kinetoplast DNA. II. Biophysical properties of minicircular DNA from Leishmania tarentolae. Bio- chim. Biophys. Acta 319, 254-266.
WESLEY, R. D., AND SIMPSON, L. (1973~). Kinetic complexity of kinetoplast and nuclear DNA from L. tarentolae. Biochim. Biophys. Acta 319, 267- 276.