isolation and characterisation of polylactic …studentsrepo.um.edu.my/5864/1/thesis.pdf ·...
TRANSCRIPT
ISOLATION AND CHARACTERISATION OF
POLYLACTIC ACID-DEGRADING ACTINOBACTERIA
LIM PEEK EEK
FACULTY OF SCIENCE
UNIVERSITY OF MALAYA
KUALA LUMPUR
2013

ISOLATION AND CHARACTERISATION OF
POLYLACTIC ACID-DEGRADING ACTINOBACTERIA
LIM PEEK EEK
DISSERTATION SUMITTED IN FULFILMENT OF THE
REQUIREMENT FOR THE DEGREE OF
MASTER OF SCIENCE
INSTITUTE OF BIOLOGICAL SCIENCES
FACULTY OF SCIENCE
UNIVERSITY OF MALAYA
KUALA LUMPUR
2013

ii
ABSTRACT
Polylactic acid (PLA) is one of the biodegradable plastics available in the market where the
monomers lactic acids are joined together by ester bonds. Actinobacteria is a bacterial
group with high G+C mol% and capability to produce various kinds of useful secondary
substrates due to their unique metabolic pathways. In this study, soil samples from a
contaminated landfill site and a non-contaminated soil at camp site were collected and
screened for actinobacteria that have the ability to degrade PLA. PLA-emulsified medium,
which contains only PLA as carbon source, was used as selective isolation medium to
isolate PLA degraders from soil samples. Isolated strains were characterized by using
polyphasic method. A total of 235 strains of PLA degrading actinobacteria were isolated
from ten soil samples. Among these 235 strains, PLA degraders were found from different
genera such as Agromyces, Rhodococcus, Micromonospora, Mycobacterium and
Streptomyces, contrary to previous reports. In addition, two novel strains, which are
members of Agromyces and Mycobacterium, were identified. Relative enzyme activity of
isolated strains was checked and most of the strains have relative enzyme activity from
1.00 to 3.00 toward both low and high molecular weight PLA. Crude enzyme was extracted
from strains P253 and P256, which had a relative enzyme activity higher than 3.00 for both
low and high molecular weight PLA. Molecular weight of PLA-degrading enzyme was
determined by using SDS PAGE and zymography method. The PLA-degrading enzyme
from strains P253 and P256 were found to have molecular weight ranging from 10-35kDa
and 35-40kDa, respectively.

iii
ABSTRAK
Polylactic acid (PLA) merupakan sejenis plastik yang boleh diurai secara semula jadi.
Polimer ini adalah diperbuat daripada unit-unit asas iaitu acid laktik. Actinobacteria adalah
kumpulan bakteria yang mempunyai kandungan G+C yang tinggi dalam DNA dan juga
keupayaan untuk menghasilkan substat yang berguna. Oleh itu, beberapa sampel tanah
daripada dua lokasi yang berlainan, iaitu tapak pelupusan yang tercemar dan tapak
perkhemahan yang tidak dicemari oleh sampah plastik, telah dikumpul supaya
actinobacteria yang berupaya untuk mengurai PLA dapat ditemui. Agar PLA yang hanya
mempunyai PLA sebagai sumber karbon telah digunakan dalam proses isolasi. Ciri-ciri
strain telah dikaji dan dicatatkan. Sejumlah 235 strain actinobacteria telah ditemui daripada
sepuluh sampel-sampel tanah dengan menggunakan agar PLA, di mana mereka adalah
daripada genera Agromyces, Rhodococcus, Micromonospora, Mycobacterium dan juga
Streptomyces. Selain daripada ini, dua strain daripada 235 strain ini merupakan strain yang
baru ditemui. Mereka adalah dari genera Agromyces dan Mycobacterium. Aktiviti enzim
relatif untuk setiap strain telah dikaji dan kebanyakan strain mempunyai nilai aktiviti enzim
relatif di antara 1.00 kepada 3.00 terhadap PLA yang mempunyai berat molekul yang
rendah dan juga yang tinggi. Selepas itu, berat molekul bagi enzim penguraian PLA telah
dikaji dengan menggunakan SDS PAGE. Enzim mentah telah diestrakkan daripada strain
P253 dan P256. Ini adalah kerana dua-dua strain ini mempunyai nilai activiti enzim relatif
yang tinggi. Berat molekul enzim penguraian PLA daripada strain P253 adalah di antara
10-35kDa, manakala berat molekul enzim penguraian PLA daripada strain P256 adalah di
antara 35-40kDa.

iv
ACKNOWLEDGEMENT
First of all, I would like to thank my Almighty Lord for providing me wisdom, strength and
knowledge which enable me to complete my master degree project.
A sincere thanks and appreciation dedicated to my supervisor, Associate Professor Dr.
Geok Yuan Annie Tan for her guidance and advice throughout the project. Also, I am
grateful to Mr. Hafiz for his assistance along the time.
Moreover, I would like to thank my fellow coursemates, Guang Han, Xiu Bei, Soo Tein,
Lai Kuan, and Wing Sze, and my lab mates for their invaluable help in this project.
A special thanks to my lovely friend, Wei Yin, for her continuous encouragement and
support in all kinds of situations.
Last but not least, I would like to convey my deepest appreciation to my parents, Mr and
Mrs Lim, and brother for their endless support upon me.
My thesis would not have been success without the help of each one of the person
mentioned above. Thank you.
v
TABLE OF CONTENT
Abstract………………………………………………………………………….………….ii
Acknowledgement…………………………………………………………………………iv
Table of contents……………………………………………………………….…………..v
List of figures…………………………………………………………………….………...ix
List of tables………………………………………………………………………..………xi
List of symbols and abbreviation……………………………………………………….xiii
List of appendices…………………………………………………………………………xv
1.0 Introduction…………………………………………………………………………….1
2.0 Literature review……………………………………………………………………….3
2.1 Characterization and identification of actinobacteria…………………………………3
2.2 Examples of actinobacterial PLA degraders…………………………………………..6
2.3 Polylactic acid (PLA)……………………………………………………………….7
2.4 PLA degradation and PLA-degrading enzyme……………………………………..10
3.0 Methodology……………………………………………………………………….….14
3.1 Soil samples……………………………………………………………………….…14
3.2 Culture media ……………………………………………………………………..…15
3.3 Isolation of PLA-degrading actinobacteria……………………………………….….16
3.3.1 Preparation of PLA film………………………………………………………….16

vi
3.3.2 Preparation of PLA-emulsified medium………………………………………....16
3.3.3 Isolation procedures……………………………………………………………...17
3.4 Characterization……………………………………………………………………...17
3.4.1 Gram staining…………………………………………………………………….17
3.4.2 Colour grouping…………………………………………………………….……18
3.4.3 Oxidase test………………………………………………………………….…...18
3.4.4 Catalase test…………………………………………………………………..…..18
3.4.5 Analysis of cell wall composition by using thin layer chromatography………..19
3.4.6 Dereplication of strains.………………………………………………….…..20
3.4.7 Identification of strains……...……………………………………………….…..21
3.4.8 Relative enzyme activity…………………………………………………………24
3.4.9 Crude extraction of PLA-degrading enzyme…………………………………..25
3.4.10 Concentration of crude PLA-degrading enzyme………………………..……25
3.4.11 SDS-PAGE………………………………………………………………..…….26
3.4.12 Determination of PLA-degrading enzyme’s molecular weight by
zymography……………………………………………………………….…….30
4.0 Results…………………………………………………………………………….…...31
4.1 Pretreatment of soil sample……………………………………………………..……31
vii
4.2 Isolation of PLA-degrading actinobacteria……………………………………..……31
4.3 Characterization of isolated strains…………………………………………………33
4.3.1 Grouping of isolated strains according to phenotypic characteristics………..…..33
4.3.1.1 Grouping based on cell morphology………………………………………..33
4.3.1.2 Colour grouping………………………………………………………….…..34
4.3.2 Oxidase test and catalase test………………………………………………….…36
4.3.3 Novel strains identification ……………………………………………………...36
4.3.4 PLA degradation ………………….………………………………………….….39
4.3.4.1 Relative enzyme activity of PLA-degrading strains………………………....39
4.4 Crude enzyme extraction………………………………………………………...40
4.5 Determination of crude enzyme’s molecular weight……………………………....40
5.0 Discussions………………………………………………………………………….…42
5.1 Isolation of PLA-degrading actinobacteria……………………………………….….42
5.2 Characterization and grouping of isolated strains……………………………….….45
5.3 PLA-degradation……………………..……………………………………………....55
6.0 Conclusion………………………………………………………………………..…57
Appendix A
Preparation of reagents……………………………………..…………………………….58
viii
Appendix B
Raw data of characterization of PLA-degrading actinobacteria……………………….…..59
Appendix C
Pictures of representative strain for each colour group………………………...…………65
Appendix D
16S rRNA gene sequence for novel strains…………………………………………..….78
Appendix E
National Bureau of Standard Colour Name Chart……………………………………….80
References…………………………………………………………………………….…..82
ix
LIST OF FIGURES
Figure 3.1: Streaking of isolate onto the PLA-emulsified plate for clear zone formation test.
Figure 3.2: Flow chart of SDS PAGE procedure.
Figure 4.1: PLA-emulsified plate with and without PLA degradation activity. From left to
right: fresh PLA-emulsified agar plate; PLA-emulsified agar plate without PLA
degradation activity; PLA-emulsified agar plate with PLA degradation activity.
Figure 4.2: Different types of cell morphology of isolated strains. (a) strain P6 which is
filamentous with rod-shape spores; (b) strain P27 which is filamentous in cell morphology;
(c) strain P251 which is rod-shape; (d) strain P279 which has thick filament with spores on
it; (e) strain P141 which is filamentous with coccus spores; (f) strain P252 which is coccus
in shape.
Figure 4.3: Number of strains for each type of cell morphology.
Figure 4.4: Phylogenetic tree of strain P86 and its closely related strains. This phylogenetic
tree was generated by MEGA4 software using Neighbor-Joining method, Jukes-Cantor
model, and with 1000 bootstrap replicates.
Figure 4.5: Phylogenetic tree of strain P86 and its closely related strains. This phylogenetic
tree was generated by MEGA4 software using Maximum Parsimony method with 1000
bootstrap replicates.
Figure 4.6: Phylogenetic tree of strain P224 and its closely related strains. This
phylogenetic tree was generated by MEGA4 software using Neighbor-Joining method,
Jukes-Cantor model, and with 1000 bootstrap replicates.
x
Figure 4.7: Phylogenetic tree of strain P224 and its closely related strains. This
phylogenetic tree was generated by MEGA4 software using Maximum Parsimony method
with 1000 bootstrap replicates.
Figure 4.8: Number of strains in each group of relative enzyme activity.
Figure 4.9: PLA-emulsified broth and filtered broth of strain P253 (left); PLA-emulsified
broth and filtered broth of strain P256 (right).
Figure 4.10: SDS PAGE and PLA gel indicator plate of zymography. (a) Crude enzymes of
strain P253 (lane 2 and 3) and strain P256 (lane 4 and 5) on Commasie Blue stained SDS-
PAGE. (b) PLA indicator gel with clearing zones (dash line indicating the clearing zone).
Figure 5.1: Dendogram generated by PAST software according to phenotypic and
physiological characteristics.
Figure 5.2: Cluster 1 which consists of strains from genus Micromonospora.
Figure 5.3: Cluster 2 which consists of strains from genus Mycobacterium.
Figure 5.4: Cluster 3 which consists of strains from genus Agromyces, Rhodococcus and
Mycobacterium.
Figure 5.5: Cluster 4 which consists of strains from genus Streptomyces.
Figure 5.6: Dendrogram generated based on molecular fingerprints of strains from Cluster
3 using GelCompar II. This dendogram was generated by using UPGMA method, Jaccard
model, 1.0% optimization, and 0.7% tolerance.

xi
LIST OF TABLES
Table 3.1: Recipe for master mix of box fingerprinting PCR.
Table 3.2: Recipe for master mix by using PROMEGA reagent.
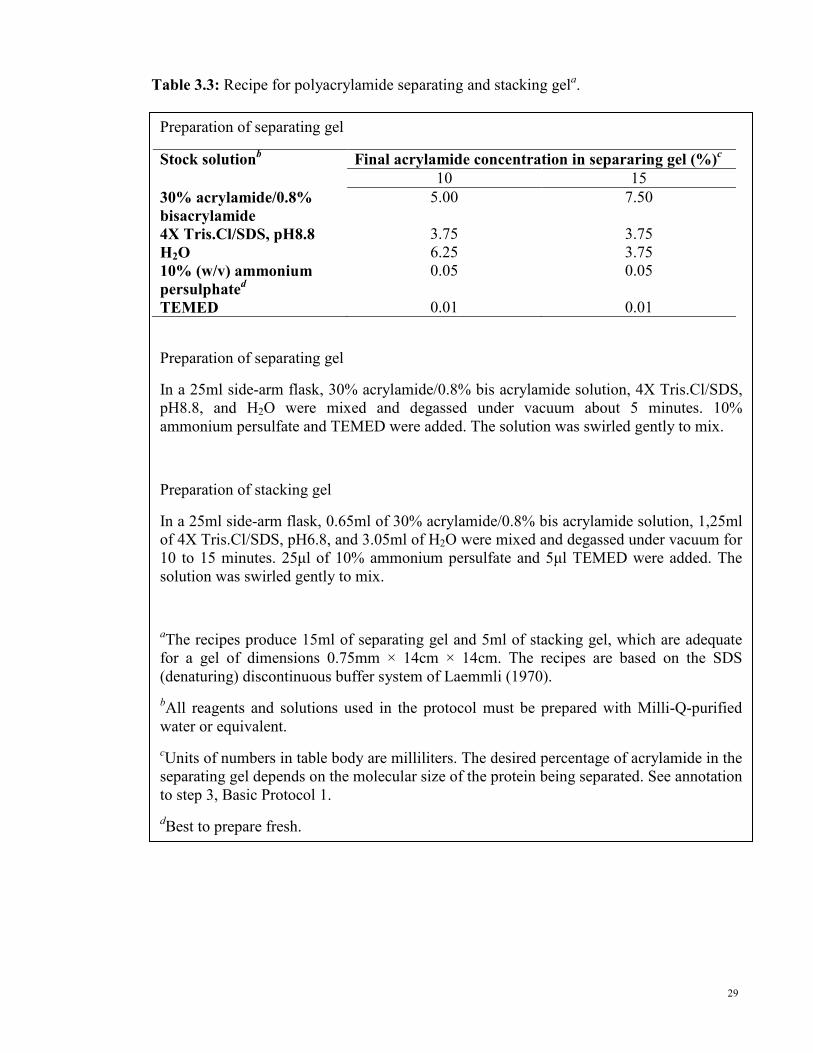
Table 3.3: Recipe for polyacrylamide separating and stacking gela.
Table 4.1: Comparison of the effects of soil enrichment by using PLA film.
Table 4.2: Number of isolated strain from each soil sample. There was no presumptive
actinobacterial strain isolated from soil sample DS1C, DS1D, DS2C, DS2E, DS3A, DS3B,
DS3D, DS3E, DS4A, DS4B, DS4C, DS4D, DS5A, DS5C, DS5D, DS5E, SP1, SP2, SP4
and SP5.
Table 4.3: Colour grouping of isolated strains based on colour of their aerial mycelia,
substrate mycelia and pigmentation. Colour was determined by using National Bureau of
Standards Colour Name Charts.
Table 5.1: Strains of each cluster, which was generated by using PAST, their cell wall type,
and their closest match in BLAST results.
Table B.1: Grouping of isolated strains based on their cell morphology.
Table B.2: Colour groups and strains belong to each group.
Table B.3: Characteristics that differentiate P86 and their closest relatives within the genus
Agromyces. 1: strain P86; 2: A. Humatus; 3: A. neolithicus; +, positive; -, negative;
V,variable (data in parentheses are for the type strain); W, weakly positive; ND, not
determined or not described; Glc, glucose; Gal, galactose; Man, mannose; Rha, rhamnose;
Rib, ribose. All strains produced acid from L-arabinose, D-fructose, galactose, glucose,
glycerol, maltose, mannitol, D-mannose, but not from B-gentiobiose, lactose or D-turanose.

xii
All strains do not decompose adenine, xanthine or urea. All strains can grow in the
presence of 2% NaCl but not at 10% NaCl. All strains can grow at 28oC and 37
oC. All
strains showed positive reaction in catalase test.
Table C.1: Pictures of representative strain from each colour group

xiii
LIST OF SYMBOLS AND ABBREVIATIONS
(NH4)2SO4 ammonium sulphate
µl microliter
bp base pair
DAP diaminopimelic acid
DNA deoxyribonucleic acid
g gravity
HCl hydrochloric acid
ISP2 International Streptomyces Project 2
K2HPO4 di-potassium hydrogen phosphate
kDa kilo Dalton
KH2PO4 potassium di-hydrogen phosphate
LAB lactic acid bacteria
MgSO4.7H2O magnesium sulphate
Mw molecular weight
N normality
PAGE polyacrylamide gel electrophoresis
PCL polycaprolactone
xiv
PCR polymerase chain reaction
PGA polyglycolic acid
PHA polyhydroxyalkanoate
PHB poly-3-hydroxybutyrate
PLA polylactic acid
psi pound-force per square inch
PVA polyvinyl alcohol
REI relative enzyme activity
rpm rotation per minute
rRNA ribosomal ribonucleic acid
SB sodium borate
SDS sodium dodecyl sulphate
V voltage
v/v volume per volume
w/v weight per volume

xv
LIST OF APPENDICES
Appendix A
Preparation of reagents
Appendix B
Raw data of characterization of PLA-degrading actinobacteria
Appendix C
Pictures of representative strain for each colour group
Appendix D
16S rRNA gene sequence for novel strains
Appendix E
National Bureau of Standard Colour Name Chart

1
CHAPTER 1
1.0 Introduction
Polylactic acid (PLA) or polylactide is one of the biodegradable plastics that belongs to the
family of aliphatic polyester. It is now commercially available in the market for various
uses. For example it is widely used in medical applications such as surgical suture,
orthopedic implant device, cosmetic surgery products and drug delivery system. Besides, it
is also used to produce packaging materials, and nets and non-woven products for
agriculture field and fishery. PLA has comparable strength to polyethylene or polystyrene,
high transparency, weather resistance, heat resistance and workability compare to other
biodegradable plastics (Matsumura, 2008). Production cost of PLA can be lower since it is
produced from polymerization of lactic acid, which is a renewable resource. Therefore,
PLA has high potential and market value for various applications. However, can PLA be
degraded by microorganisms instead of accumulated in the environment?
In this study, PLA-degrading actinobacteria were isolated from soil samples and
characterized. Soil samples were collected from two different places, a contaminated
landfill site in Gopeng, Perak and a non-contaminated camp site in Gurun, Kedah. Landfill
site was chosen as a sampling site because large number of plastic wastes had been thrown
and left there for a long period. Therefore, the hypothesis is that microorganisms with
plastic-degrading and hydrolytic ability could be found there because they may need this
ability to absorb nutrient necessary for their survival. Another soil sample was collected
from a non-polluted camp site on Gunung Jerai, Gurun, Kedah to check whether PLA-
degrading actinobacteria could be ubiquitous in different kinds of environment.
2
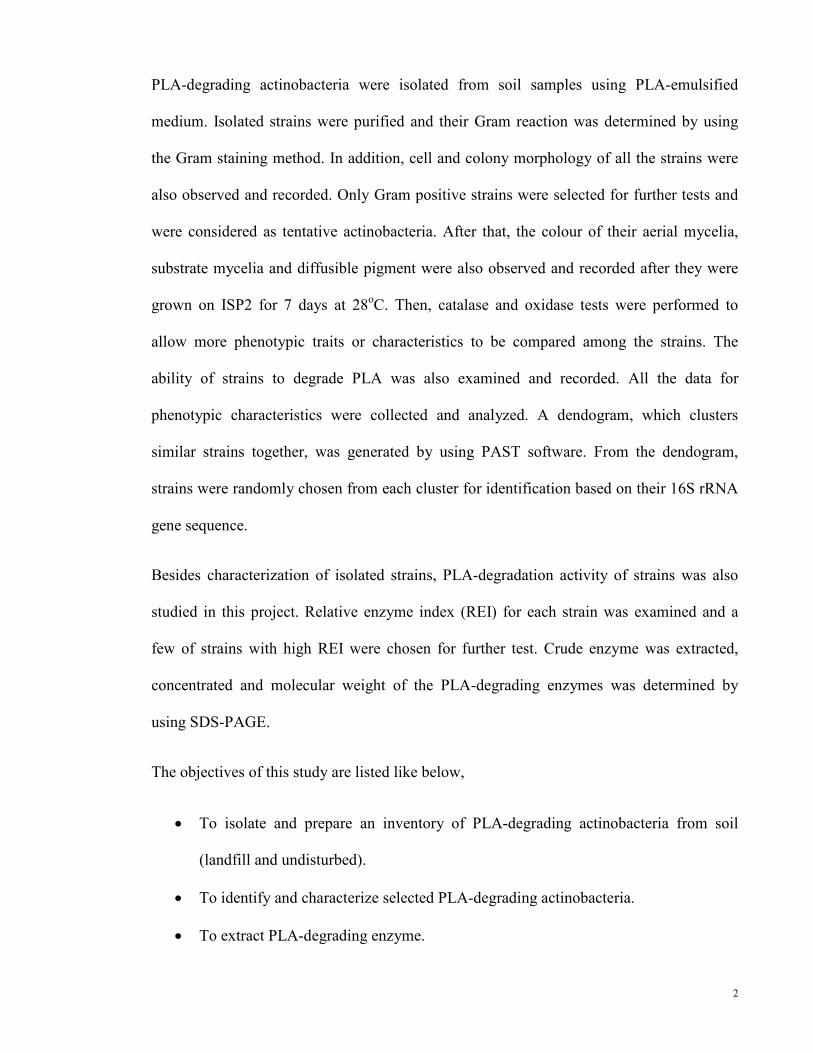
PLA-degrading actinobacteria were isolated from soil samples using PLA-emulsified
medium. Isolated strains were purified and their Gram reaction was determined by using
the Gram staining method. In addition, cell and colony morphology of all the strains were
also observed and recorded. Only Gram positive strains were selected for further tests and
were considered as tentative actinobacteria. After that, the colour of their aerial mycelia,
substrate mycelia and diffusible pigment were also observed and recorded after they were
grown on ISP2 for 7 days at 28oC. Then, catalase and oxidase tests were performed to
allow more phenotypic traits or characteristics to be compared among the strains. The
ability of strains to degrade PLA was also examined and recorded. All the data for
phenotypic characteristics were collected and analyzed. A dendogram, which clusters
similar strains together, was generated by using PAST software. From the dendogram,
strains were randomly chosen from each cluster for identification based on their 16S rRNA
gene sequence.
Besides characterization of isolated strains, PLA-degradation activity of strains was also
studied in this project. Relative enzyme index (REI) for each strain was examined and a
few of strains with high REI were chosen for further test. Crude enzyme was extracted,
concentrated and molecular weight of the PLA-degrading enzymes was determined by
using SDS-PAGE.
The objectives of this study are listed like below,
• To isolate and prepare an inventory of PLA-degrading actinobacteria from soil
(landfill and undisturbed).
• To identify and characterize selected PLA-degrading actinobacteria.
• To extract PLA-degrading enzyme.

3
CHAPTER 2
2.0 Literature review
2.1 Characterization and identification of Actinobacteria
Actinobacteria is a group of Gram positive bacteria with high G+C mol% in their DNA. In
the past, they have been classified as fungi due to the fact that they share some similarity in
morphological characteristics with fungi. Their morphological characteristics vary from
species to species or even individuals in the same species. For example, they may exist as
coccoid, rod-coccoid, fragmented hyphal form or filamentous. Moreover, due to the fact
that they are diverse in their metabolic and physiological characteristics, they are well
known in the production of various useful secondary metabolites. Examples of secondary
metabolites from actinobacteria are antibiotics such as streptomycin and rifamycin (Kim et
al., 2006), and enzymes like chitinase (Kawase et al., 2004), lignocelluloses-degrading
enzyme (McCarthy, 1987), and PLA-degrading enzyme (Tokiwa & Jarerat, 2004). Perhaps
because of their special metabolic and physiological characteristics, they are capable to
survive in various kinds of habitats and conditions which include some harsh environments
such as the polluted or contaminated and low-nutrient environment. Another reason for
their high survival rate in various environments is their capability in spore formation when
the conditions become unfavorable to them. Therefore, actinobacteria are very useful in
bioremediation due to the fact that their survival rate in the environment is relatively higher
than other bacteria. Members of genera Agromyces, Micromonospora, Mycobacterium,
Rhodococcus and Streptomyces were isolated in this study. Therefore, the following
paragraphs are to introduce the general characteristics and applications of members of these
several genera.

4
Agromyces is a genus that contained in the family Microbacteriaceae. Members of
Agromyces generally have opaque, paste, entire colonies which usually penetrate into agar
and are without mycelia. Their hyphae will branch and break up into diphtheroid and rod-
like, irregular, non-motile fragments. Moreover, they are aerobic to microaerophilic,
mesophilic, and show variable reaction in catalase and oxidase test for different species.
They have been used in various applications such as waste-gas treatment and pollutants
degradation (Bendinger et al., 1990), aniline degradation (Aoki et al., 1983), and oxidizing
steroids (Arnaudi, 1954).
Species of Micromonospora have general characteristics such as having raised and folded
colony with areas of different colors and their colonies are completely covered by mucoid,
black mass of spores. They can survive in aerobic and anaerobic conditions such as deep
sea sediment for a very long period. They are able to degrade biopolymers (Erikson, 1940)
and lignin (McCarthy & Broda, 1984).
Generally, mycobacterium can be separated into two main groups based on their growth
rate, which are, slow grower and fast grower. Most of the slow growers are associated with
human and animal diseases while most of the fast growers are saprophytes found in the
environment. Environmental mycobacteria are categorized as the non-medical
mycobacterium. Some of the typical characteristics of mycobacterium: they are aerobic,
acid fast, form curved or straight non-motile rod, their mycelium will fragmented into
either rod or cocoid elements, and having wall chemotype IV, that is, their cell wall contain
meso-diaminopimelic acid. Many species form whitish or cream-coloured colonies and for
those that contain carotenoid pigments form bright yellow or orange colonies.
Mycobacteria are found to have various catabolic or degradation activities for examples,
the ability to degrade the morpholine (Cech et al., 1988) and polycyclic aromatic

5
hydrocarbons such as pyrene (Heitkamp et al., 1988) and phenanthrene (Guerin & Jones,
1988), simple molecules such as methanol and methylamines (Kato et al., 1988; Urakami
& Yano, 1989). In 1965, Jones and Jenkins had shown the abundance of mycobacterium in
soils (Jones & Jenkins, 1965). Mycobacteria are able to survive in a wide range of
environmental conditions and also utilize different kind of growth substrates.
Members of the genus Rhodococcus are aerobic, catalase positive, Gram positive to Gram
variable, and non-motile in nature. They form rods to extensively branched substrate
mycelia. Their colonies morphology varies among different species, i.e. they can be rough,
smooth or mucoid, and have colours like buff, cream, yellow, orange or red. Moreover,
they also have wall chemotype IV just like mycobacterium. Rhodococci had been found to
have the ability to degrade various compounds such as phenol (Straube et al., 1990),
oligocarbophily (Tarnok, 1976), petroleum (Nesterenko et al., 1978), humic acid (Cross et
al., 1976), lignin-related compounds (Eggeling & Sahm, 1980; Eggeling & Sahm, 1981;
Rast et al., 1980), pesticides (Nagy et al., 1995), acrylamide (Arai et al., 1981), aromatic
hydrocarbons (Raymond et al., 1971), and haloalkanes (Kesseler et al., 1996).
Last but not least, members of genus Streptomyces which are generally known as
streptomycetes are Gram positive, aerobic and catalase positive actinobacteria. They use
form long and highly branched mycelia with minimal fragmentation and there are non-
motile spores which are attached to the end of their mycelia. Their colonies can be discrete
and lichenoid, leathery or butyrous. At the early stage of their life cycle, their colonies are
relatively smooth in surface, however, after they have developed their aerial mycelium,
their colonies become floccose, granular, powdery or velvety. Besides, they also tend to
produce various pigments which are responsible for their colourful aerial and substrate
mycelia and also diffusible pigments throughout their life cycle. Streptomycetes are well

6
known for their ability in producing antibiotics. Furthermore, they are also known to have
the ability to degrade various recalcitrant substances such as chitin, cellulose, and lignin.
2.2 Examples of actinobacterial PLA degrader
Amycolatopsis sp. was first discovered as PLA-degrading bacteria by Pranamuda et al., that
is, Amycolatopsis sp. strain HT-32 (Pranamuda et al., 1997). Then, PLA-degrading activity
was found to be widely distributed in this particular genus (Chomchoei et al., 2011;
Nakamura et al., 2001; Pranamuda & Tokiwa, 1999; Pranamuda et al., 2001; Tokiwa et al.,
1999). PLA-degrading enzyme from Amycolatopsis sp. strain K104-1 has been isolated,
purified, and characterized (Nakamura et al., 2001). The molecular weight of the isolated
enzyme is 24kDa and it has similar properties to alkaline serine protease.
Other than genus Amycolatopsis, PLA-degrading activity among other genera was studied
by Jarerat and his group. Strains from the genera Lentzea and Kibdelosporangium that are,
Lentzea waywayandensis and Kibdelosporangium aridum, were also found to possess the
ability to degrade PLA. They have the ability to reduce the weight of PLA film by more
than 90% and also assimilate the degradation product (Jarerat & Tokiwa, 2003; Jarerat et
al., 2003).
Besides, members of genera Paecilomyces, Thermomonospora, and Thermopolyspora are
likely to have the capability to degrade PLA. This is because their gene sequences were
found in the aerobic compost for PLA degradation by using molecular ecological
techniques (Sangwan & Wu, 2008). Most recently, Pseudonocardia alni was found capable
to degrade PLA too (Konkit et al., 2012).

7
Moreover, PLA-degrading strains from several other genera like Actinomadura
keratinilytica, Micronomospora echinospora, Micromonospora viridifaciens, Nonomuraea
terrinata, Nonomuraea fastidiosa, Laceyella sacchari, and Thermoactinomyces vulgalis
were isolated from soil samples (Sukkhum et al., 2009). An enzyme was isolated and
purified from Actinomadura keratinilytica. This enzyme has molecular weight of 30kDa
and similar properties as serine protease (Sukkhum et al., 2009).
2.3 Polylactic acid (PLA)
Biodegradable plastic is biopolymer that synthesized from renewable resources and can be
biodegraded. Nowadays, biodegradable plastics have been used as alternative or
replacement to petrochemical plastics due to its biodegradable characteristic. Generally,
they can be synthesized biologically or chemically using biological materials (Demirbas,
2007).
Biodegradable plastics are mostly made from polyester because it is cheaper compare to
other biopolymers such as polyamino acid. Polyesters can either be synthesized chemically
or biologically. Examples of chemically synthesized polyesters are polyglycolic acid
(PGA), polylactic acid (PLA), polycaprolactone (PCL), and polyvinyl alcohol (PVA).
While biologically synthesized polyesters include polyhydroxyalkanoate
(Teeraphatpornchai et al., 2003) and poly-3-hydroxybutyrate (PHB) (Demirbas, 2007).
Until now, there is only 1% of bioplastics in the market and PLA is one of them
(Nampoothiri et al., 2010). Initially, PLA was patented by DuPont in 1954 and this make
the commercialization of PLA available. Thereafter, there are several companies which

8
have become active in PLA market also such as Cargill Inc., Teijin Ltd., and Shimadzu
(Nampoothiri et al., 2010).
PLA has high market value because of several reasons. First, it has comparable strength to
polyethylene or polystyrene, high transparency, weather resistance, heat resistance and
workability compare to other biodegradable plastics (Matsumura, 2008). Second, its
production cost can be lowered since it is produced from polymerization of lactic acid,
which is a renewable resource. Third, it seldom contaminated by microorganisms because it
is degraded primarily by hydrolysis instead of microbial degradation. Therefore, it is
commonly used in food packaging, mulching film and also medical application (Gross &
Kalra, 2002). Up to date, PLA is the biodegradable plastic which has been developed
furthest towards practical use in different fields such as covering materials in agriculture,
fibers, earth retaining netting, weed-preventing bags and others (Matsumura, 2008).
Lactic acid, which is a naturally occurring organic acid, is the monomer for PLA. It can be
produced either by chemical synthesis or fermentation. Lactic acid can be synthesized
chemically through many different pathways such as degradation of sugar by using base,
hydrolysis of lactonitrile by strong acid, oxidation of propylene glycol and etc.. However,
increasing interest is shown to biotechnology production of lactic acid, that is through
fermentation, because it is more economic and also environmental friendly compared to
chemical synthesis. This is due to the fact that biotechnological method uses low cost
renewable substrates instead of petrochemicals, low production temperature and low
energy consumption. Moreover, high product specificity of biotechnology technique makes
it the preferable method to produce lactic acid. There are two main groups of
microorganism that involve in the fermentation to produce lactic acid, that are, lactic acid
bacteria (LAB) and some filamentous fungus. The substrate or carbon source for the
9
microbial production of lactic acid can be pure sugar, sugar containing materials, or starchy
materials. That means production cost can be lowered because cheaper substrates are being
used. Recent studies even show that it is possible to combine the saccharification and
fermentation steps to further cut down the production cost by avoiding high energy
consuming biomass saccharification (Nampoothiri et al., 2010).
Due to the presence of both hydroxyl and carboxyl end in lactic acid, polycondensation
method can be used to polymerize lactic acid to PLA directly. However, this method can
only produce low molecular weight PLA (Nampoothiri et al., 2010).
In order to produce high molecular weight PLA, open-ring polymerization reaction can be
used. In this reaction, lactic acid will be polymerized into high molecular weight polymer
through two steps. A cyclic lactic acid dimer, which is an intermediate lactide, is formed in
the first step through oligomerization reaction. There are three stereoforms of the
intermediate lactide: L-lactide, D-lactide, and meso-lactide. Purified intermediate lactides
are converted into high molecular weight PLA in the second step through open-ring
polymerization reaction. This reaction is carried out by catalysts such as stannous octoate
(Pranamuda et al. 2001) and tin chloride (Nampoothiri et al., 2010).
Later, this open-ring polymerization process is modified by Cargill Dow LLC into a low-
cost continuous process for PLA production, that is, PLA is synthesized in melt rather than
in solution. That means, usage of high cost solvent, which is environmental unfriendly, is
completely eliminated in this modified process (Gruber et al., 1992; Gruber et al., 1993;
Gruber et al., 1994).
10
2.4 PLA degradation and PLA-degrading enzyme
Degradation of PLA is mainly due to the scission of its ester bond and this process can be
done either biologically or chemically (Nampoothiri et al., 2010).
Biological degradation or biodegradation of PLA is carried out through the utilization of
enzymes or microorganisms. Up to now, almost all the isolated PLA-degrading
microorganisms belong to the class Actinobacteria. They are members of different genera
such as Amycolatopsis, Kibdelosporangium, Lentzea, Pseudonocardiacea, and others.
These PLA-degrading microorganisms may or may not utilize the degradation products as
their carbon source. For those that do not utilize PLA as carbon source, PLA degradation is
the result of co-degradation (Teeraphatpornchai et al., 2003). This kind of PLA-degrading
microorganism is preferred to be used in situ because they are not affected by the presence
of other carbon sources.
PLA-degrading enzymes generally belong to hydrolases such as esterase, lipase and
protease, which are capable in catalyzing the hydrolysis of ester bond (Akoh et al., 2004;
Teeraphatpornchai et al., 2003) that join the monomers of PLA together. For examples,
protease and esterase were identified and purified as PLA depolymerase from
Amycolatopsis sp. and Bacillus sp., respectively (Nakajima & Shigeno, 2006; Pranamuda et
al., 2001). Besides, up to date, proteinase K is the only enzyme that can degrade or
hydrolyze high molecular weight PLA (Tsuji & Miyauchi, 2001). Hydrolases are useful in
bioremediation of pollutants due to their low substrate specificity, which means that their
activity will not be affected even when pollutants present as a mixture (Gianfreda et al.,
2006).
11
Two types of enzymes have been used in the biodegradation of PLA, which are,
intracellular and extracellular enzymes. If intracellular enzymes are used to degrade or
transform PLA, presence of whole microbial cells in the polluted site is required. On the
other hand, in the case of extracellular enzymes, presence of whole cells may be required
because of their specific metabolic pathway, or else, cell free enzyme alone is enough for
the biodegradation process (Gianfreda et al., 2006). Utilization of cell free enzymes in situ
has several advantages over the utilization of whole cell, that are, there are no predators for
the enzymes, they are not sensitive to the presence of inhibitor of cell metabolism and
drastic change in pollutants’ concentration, they are not affected by the presence of toxic
pollutants, and they are able to withstand a wide range of environmental conditions, which
are usually unfavorable to the microbial cells (Gianfreda et al., 2006).
After the PLA-degrading enzyme is discovered, extracted and purified, it can be
commercialized in granule, powder, tablet, or any other forms. Besides, other components
such as stabilizer, excipient, pH adjustor, extender or binder may be added into the tablet
for better performance of the enzyme (Nakajima & Shigeno, 2006).
For chemical degradation methods, pyrolysis and copyrolysis are two main choices.
Pyrolysis is a process where heat is to degrade PLA while copyrolysis can be considered as
an upgrading step of the pyrolysis. This is due to the fact that copyrolysis has several
advantages over the pyrolysis process such as chemicals recovery, reduction of the wastes’
volume and replacement of fossil fuels (Wang & Li, 2008). Other than pyrolysis and
copyrolysis processes, acid and alkali are also use to hydrolyze the PLA.
All the mechanism has their advantages and disadvantages. For biodegradation of PLA
which uses the enzymes and/or microorganisms, it is more environmental friendly and most

12
probably it is cheaper than chemical and physical processes. Besides that, monomers
produced in biodegradation will have regular terminals, which allow the re-polymerization
of the monomers, while monomers produced in chemical and physical processes have
irregular terminals (Matsumura, 2008; Nakajima & Shigeno, 2006). This is because
enzymes are specific towards their substrates while chemical processes that use acid or
alkali are random in action. Hence, downstream process for enzyme depolymerization
process is always simpler and cheaper compare to chemical recycling process, which
requires additional purification step for the mixture of monomers (Nakajima & Shigeno,
2006). However, biodegradation of PLA in situ can be affected by factors like humidity,
nutrient supply, pH, redox condition and temperature. These factors will either affect the
enzyme or the growth of microorganisms or both (Nampoothiri et al., 2010). On the other
hand, chemical and physical degradation processes are more stable since they are not be
affected by environmental conditions, however, both of them are high in energy
consumption and produce large amount of carbon dioxide (Matsumura, 2008).
Despite the method that is used to degrade PLA, there are some general problems in PLA
degradation. One of the problems is that plastic wastes are always mixed with different
kinds of materials like domestic wastes (Nakajima & Shigeno, 2006). This will decreases
the rate of biodegradation because PLA-degrading microorganisms, which supposed to use
PLA as their carbon source, tend to use other organic materials as their carbon source rather
than the PLA (Nakajima & Shigeno, 2006). Besides, PLA has lower biodegradability than
other biodegradable plastics such as PCL or PHB, that is, PLA will only be degraded into
water and carbon dioxide after several years depending on the environmental condition
(Matsumura, 2008). It is well known that PLA is not degraded by microorganisms unless it
is present in suitable conditions, which are, high temperature and high humidity. This is

13
due to the fact that PLA is degraded by a two-stage reaction. It is first hydrolyzed at high
temperature and high humidity, which result in the drop of molecular weight, then only
degraded by microorganisms (Matsumura, 2008).

14
CHAPTER 3
3.0 Methodology
3.1 Soil samples
Soil samples were collected from two different sites, that are, landfill site in Gopeng, Perak
(N04o23’35”, E101
o10’54”) and campsite on Gunung Jerai, Gurun, Kedah (N05
o48’21”,
E100o25’56”).
From the landfill site in Gopeng, a total of five soil samples with five replicates each
(DS1A-E, DS2A-E, DS3A-E, DS4A-E and DS5A-E) were collected. These replicates of
soil samples were to maximize the number of PLA-degrading actinobacteria isolated from
each sampling point. While five soil samples (SP1-5) were collected from Gunung Jerai,
which is an uncontaminated camp site. Soil samples were collected from both contaminated
and non-contaminated site to determine the stimulation effect of plastics pollution on the
PLA-degrading activity or PLA-degrading enzyme production from microorganisms.
Surface soil (1-3cm depth) was collected using clean spatula and kept in sterile falcon tubes.
For each soil sample, replicates were collected within 50cm radius. Soil samples were
stored in room temperature until for further use. Soil samples were used directly for pH
determination and isolation without being air dried. This is because the air drying method is
one of the selective or pretreatment methods which will limit the type of actinobacteria to
be isolated from the soil samples.
For soil sample’s pH determination, soil sample (1g) was transferred into a sterile universal
bottle with 9ml of ¼ strength Ringer’s solution. The mixture was mixed by vortex for half

15
an hour and left to stand for 30 minutes before pH was taken. pH was taken as mean
average of three readings measured with pH meter.
To compare the effects of pretreatment, one soil sample (DS2D) was pretreated by mixing
PLA film (5000Mw) into 1g of soil sample and incubated at 30oC for 1 week prior to being
used in isolation of PLA-degrading actinobacteria (Tomita et al., 2004).
3.2 Culture media
Two main culture media, which were used in this study, were PLA-emulsified medium and
International Streptomyces Project medium 2 (ISP2). Their formulation per liter was listed
as below. Two types of antifungals, which are nystatin (50µg/ml) and cyclohexamide
(50µg/ml), were added into the isolation medium to exclude or reduce the number of
fungus in the isolation. The medium was prepared and heated to dissolve all the ingredients
by using microwave. Then, the pH of the medium was checked and adjusted accordingly
before sterilizing at 121oC, 15psi for 20 minutes.
PLA-emulsified medium (modified from (Sukkhum et al., 2009))
(NH4)2SO4 4.00g
K2HPO4 2.00g
KH2PO4 1.00g
MgSO4.7H2O 0.50g
Yeast extract 0.10g
PLA (5000Mw/20000Mw, WAKO, Japan) 1.00g
Bromocresol purple 0.10g

16
Bacto agar 15.00g
pH 7.00
ISP2 (Shirling & Gottlieb, 1966)
Yeast extract 4.00g
Malt extract 10.00g
Glucose 4.00g
Bacto agar 15.00g
pH 7.00
3.3 Isolation of PLA-degrading actinobacteria
3.3.1 Preparation of PLA film (modified from (Jarerat et al., 2003))
PLA powder (0.1g; 5000Mw; WAKO, Japan) was dissolved in 50ml of dichloromethane.
After that, the solution was poured and dried in a petri dish. The PLA film formed was
washed by using 70% ethanol and cut into small pieces.
3.3.2 Preparation of PLA emulsified medium (modified from Sukkhum et al., 2009)
PLA suspension was prepared by dissolving 0.1% (w/v) of low molecular weight (5000Mw)
or high molecular weight (20000Mw) PLA in 50ml of dichloromethane, followed by 1
hour of sonication in 100ml of distilled water with 1% (v/v) Tween 80. After emulsification,
dichloromethane was removed by stirring the solution at 90oC in fume hood. After that,
medium was sterilized by autoclaving at 121oC, 15psi for 20 minutes.
17
3.3.3 Isolation procedures (Cappuccino, 2005)
Soil samples were diluted through the serial dilution method before spread plating was
performed. 1g of soil sample was suspended in 9ml of ¼ strength Ringer’s solution to form
a 10-1
soil suspension. 1ml of the 10-1
soil suspension was transferred into another 9ml of
Ringer’s solution to form 10-2
soil suspension. This step was repeated until 10-4
dilution.
Then, 100µl of the soil suspension from each dilution were inoculated onto the surfaces of
selective isolation plates. The soil suspensions were then spread by using a glass rod
spreader (Cappuccino, 2005). Each dilution was spread in duplicate plates. All plates were
incubated at 28oC for 7 days or more until yellow colour or zone was observed on the
isolation medium that is, PLA-emulsified medium. The yellow zone is an indicator of PLA
degradation activity carried out by PLA degrader.
3.4 Characterization
3.4.1 Gram staining (Cappuccino, 2005)
Bacterial smear was prepared on glass slide and heat fixed. The fixed slide was flooded
with crystal violet and allowed to remain for 1 minute. After that, the crystal violet was
rinsed off with distilled water. Then the slide was flooded with iodine and allowed to
remain for 1 minute. After 1 minute, the iodine was rinsed off with distilled water. The
slide was then flooded with acetone for 3 seconds. The acetone was rinsed off with distilled
water. For the counterstain step, the slide was flooded with safranin for 30 seconds. After
that, the safranin was rinsed off with distilled water. The slide was blot dried with bibulous
paper and observed under light microscope.

18
The Gram reaction and cell morphology of isolates were observed under the light
microscope and recorded.
3.4.2 Colour grouping
All the presumptive actinobacterial strains were grown on ISP2 medium for 7 days. The
colour of aerial mycelia, substrate mycelia and diffusible pigment for each strain were
observed and recorded according to National Bureau of Standard Colour Name Chart
(Appendix E, page 80).
Medium ISP2 instead of ISP3 was chosen as medium for colour grouping because ISP2
medium can support the growth of all types of actinobacteria while ISP3 can only support
the growth of streptomycetes.
3.4.3 Oxidase test (Cappuccino, 2005)
Reagent solution was prepared by dissolving 1% (w/v) of N, N, N’, N’-tetramethyl-p-
phenylenediamine in distilled water. Filter paper was soaked with fresh prepared reagent
solution. Fresh growth colony was scraped by using sterile toothpick and rubbed onto the
filter paper. Blue colour examined within 10 seconds was recorded as a positive result.
3.4.4 Catalase test (Cappuccino, 2005)
Hydrogen peroxide (3%; v/v) was prepared. Approximately 0.2ml of hydrogen peroxide
solution was placed on a clean glass slide. Presumptive actinobacteria colony was carefully

19
picked by using sterile toothpick. The colony was rubbed within the hydrogen peroxide
solution. Vigorous bubbling observed within 10 seconds was recorded as positive result.
3.4.5 Analysis of cell wall composition by using thin layer chromatography
(Lechevalier & Lechevalier, 1980)
Two loopful of actinobacterial cell were placed in 250µl of 6N hydrochloric acid (HCl).
Actinobacterial cells were homogenized by vortexing. This mixture was autoclaved for 20
minutes at 121oC, 15psi. After that, the mixture was centrifuged at 10,000rpm to
13,000rpm for 15 minutes. The supernatant was removed into a new eppendorf tube and
kept at 100oC to evaporate and concentrate it. The residue formed was resuspended in 30µl
sterile distilled water and repeat this step for another time. After evaporate for second time,
the residue was resuspended in 10µl sterile distilled water for spotting purpose. The cell
extracts were spotted on TLC cellulose plate (No. 1.05552.0001, Merck) for 20 times. A
standard, 2,6-diaminopimelic acid (0.01%; D1377, Sigma-Aldrich), was applied together
with the samples. Mobile phase which consists of methanol, sterile distilled water, 6N HCl
and pyridine was developed in the proportion of 80:26:4:10 (v/v), respectively. For
visualization, cellulose plate was sprayed with 0.2% (w/v) ninhydrin in acetone and dryed
in 80oC for 5 to 7 minutes. A strain that has LL-DAP spot indicates that it is a
streptomycete while a strain that has meso-DAP spot is a non-streptomycete such as
mycobacterium or Rhodococcus.

20
3.4.6 Dereplication of strains
Crude genome DNA extraction
A loopful of pure actinobacterial culture was suspended into 150µl of Tris-EDTA (TE)
buffer that containing glass beads. Lysozyme (5µl; 50mg/ml) was added into the
suspension. Proteinase K (25µl; 20mg/ml) was added into the suspension. The suspension
was mix by vortexing. After that, the suspension was incubated at 37oC for 2 hours and
then 56oC for 3 hours or longer. Then the suspension was centrifuged at 13,500rpm for 10
minutes. The supernatant was transferred into new eppendorf tube. This supernatant was
incubated at 75oC for 20 minutes. Gel electrophoresis was performed to confirm the
presence and quality of DNA in the supernatant.
The extracted DNA was kept at -20oC. Extracted DNA was used for dereplication of strains
by using BOXA1R primer.
PCR by using BOXA1R primer (Marques et al., 2008)
A 25µl master mix with reagents as listed in Table 3.1 was prepared for BOX
fingerprinting PCR.
Table 3.1: Recipe for master mix of BOX fingerprinting PCR.
Final concentration 1X reaction (µl)
5X buffer 1X 5
25mM MgCl2 1.5Mm 1.5
10mM dNTPs 0.2mM 0.5
20µM BOXAIR primer 2µM 2.5
5U/µlTaq 1.5U 0.075
Sterile distilled water 14.425
DNA 1 1
21
BOX fingerprinting PCR was carried out by using the BOXA1R primer. The condition for
amplification consisted of an initial denaturation step of 7 minutes of 95oC, followed by 30
cycles of denaturation at 94oC for 1 minute, annealing at 53
oC for 1 minute, elongation at
65oC for 8 minutes, and a final extension step at 65
oC for 15 minutes.
Gel electrophoresis
Agarose gel (2%, w/v) was prepared by mixing 0.8g of agarose into 40ml of Sodium
Borate (SB) buffer. 100bp ladder and DNA samples were loaded into wells on the gel.
Then gel electrophoresis was run with 100V for 120 minutes. Gels were stained in ethidium
bromide (0.04%, v/v) before being visualised in a UV transilluminator.
Analysis of molecular fingerprinting using GelCompar II (Applied Maths, Belgium)
Molecular fingerprints, which were generated using BOXA1R primer, were analysed by
using GelCompar II (Applied Maths, Belgium). Dendogram was generated by using the
UPGMA method with the Jaccard model, 0.1% optimization and 0.7% tolerance.
3.4.7 Identification of strains
Genome DNA extraction using NucleoSpin® Tissue kit (Macherey-Nagel, Germany)
Genome DNA of presumptive actinobacteria strain was extracted by using the DNA
extracton kit (MN, Germany) according to manufacturer’s instructions as below.
Up to 1ml of bacterial culture can be used for the preparation depending on, for example,
density of culture, culture medium, and bacterial strain. The bacterial culture was
centrifuged up to 1ml for 5 minutes at 8000g. Supernatant was removed. The pellet was
resuspended in 180µl Buffer T1 by pipetting up and down. Lysozyme (5µl; 20mg/ml) was
22
added into the sample and incubated for 1 hour. Then, Proteinase K (25µl) was added.
Sample was vortexed vigorously and incubated at 56oC until complete lysis is obtained (at
least 1-3 hours). Vortex the sample occasionally during incubation, or use a shaking
incubator. Samples can be incubated overnight as well. After that, the sample was vortexed .
Buffer B3 (200µl) was added, vortexed vigorously and incubated at 70oC for 10 minutes.
Sample was vortexed briefly again. If insoluble particles are visible, sample was
centrifuged for 5 minutes at high speed (i.e., 11000g) and supernatant was transferred to a
new microcentrifuged tube. Ethanol (210µl; 96-100%) was added to the sample and vortex
vigorously. For each sample, one NucleoSpin® Tissue Column was placed into a
Collective Tube. The sample was applied to the column and centrifuged for 1 minute at
11000g. The flow-through was discarded and the column was placed back into the
Collection Tube. If the sample is not drawn completely through the matrix, repeat the
centrifugation step and discard the flow-through. Buffer BW (500µl) was added and
centrifuged for 1 minute at 11000g. The flow-through was discarded and the column was
placed back into the Collection Tube. Buffer B5 (600µl) was added to the column and
centrifuged for 1 minute at 11000g. The flow-through was discarded and the column was
placed back into the Collection Tube. The column was centrifuged for 1 minute at 11000g.
The NucleoSpin® Tissue Column was placed into a 1.5ml microcentrifuge tube and
prewarmed Buffer BE (100µl; 70oC) was added. The column was incubated at room
temperature for 1 minute and centrifuged for 1 minute at 11000g.
The extracted DNA was kept at -20oC. Extracted DNA was used as template for the
amplification of 16S rRNA gene.

23
Polymerase chain reaction (PCR) for 16S rRNA gene amplification (Tan et al., 2006)
A 50µl master mix with reagents as listed in Table 3.2 was prepared for 16S rRNA gene
amplification.
Table 3.2: Recipe for master mix by using PROMEGA reagent.
Final concentration 1X reaction (µl)
5X buffer 1X 10
25mM MgCl2 1.5mM 3
10mM dNTPs 0.2mM 1
Primer 27F 100mM 1
Primer 1492R 100mM 1
5U/µl Taq 1.25U 0.25
Sterile distilled water 32.75
DNA 1 1
16S rRNA genes was amplified with primer 27F and 1492R using the condition: hot start
of 5 minutes at 95oC followed by 35 cycles of denaturation at 94
oC for 45 seconds,
annealing at 57oC for 45 seconds, elongation at 72
oC for 1 minute, and a final extension
step at 72oC for 10 minutes.
Gel electrophoresis
Agarose gel (1%, w/v) was prepared by mixing 0.4g of agarose into 40ml of Sodium
Borate (SB) buffer. 100bp ladder and nucleic acid sample were loaded into wells on the gel.
Then gel electrophoresis was run with 100V for 45 minutes. Gels were stained in ethidium
bromide (0.04%, v/v) before being visualised in a UV transilluminator.

24
16S rRNA gene sequencing
The amplified 16S rRNA gene product was sent to 1st BASE, which is a commercial
servicing company, for sequencing. BigDye® Terminator v3.1 cycle sequencing kit
chemistry (Applied Biosystems) is used by 1st BASE as their sequencing analyser.
Strains identification
Gene sequence of 16S rRNA of a strain was analysed by using EzTaxon (Chun et al., 2007).
From the results, strains with similarity values less 97% were treated as novel strains.
Phylogenetic tree was generated by MEGA4 software (Tamura et al., 2007) using
Neighbor-Joining method, Jukes-Cantor model with 1000 bootstrap replicates, and
Maximum Parsimony method with 1000 bootstrap replicates.
3.4.8 Relative enzyme activity (Bradner et al., 1999)
Isolate was streaked in circular shape onto the PLA-emulsified plate (Figure 1) and
incubated at 28oC for 7 days. After the incubation period, the diameter of the colony and
clear zone were measured and recorded. Relative enzyme activity of the particular isolate
was calculated by using the formula as below.

25
3.4.9 Crude extraction of PLA-degrading enzyme (Nakamura et al., 2001)
Strains P253 and P256 were grown in basal medium for 7 days. This seed culture was
inoculated into PLA-emulsified broth and incubated for 7 days. After incubated for 7 days,
broth culture was filtered using filter paper (F2042, CHM, Spain) and then 0.2µm filter to
filter out the cell biomass. The remaining broth was treated as crude PLA-degrading
enzyme.
3.4.10 Concentration of crude PLA-degrading enzyme (Wenk & Fernandis, 2007)
Saturated ammonium sulphate solution was prepared by dissolving 750g of ammonium
sulphate into 1000ml of water. The solution was stirred at room temperature with magnetic
stirrer for 15 minutes or until saturation. The clear supernatant solution was poured out
after the undissolved solids settle on the bottom of the flask. Total volume of crude enzyme
was measured and recorded. Saturated ammonium sulphate was added to the crude enzyme
solution up to 20% concentration and the solution was stirred for 30 minutes. If any
precipitate formed, the mixture was centrifuged at 2,000g for 20 minutes. The precipitate
Isolate
PLA-
emulsified
agar plate
Figure 3.1: Streaking of isolate onto the PLA-
emulsified plate for clear zone formation test.

26
was collected by carefully remove the supernatant. The precipitate was suspended in
distilled water until desirable volume. Same steps were applied to the remaining
supernatant with increasing concentration of saturated ammonium sulphate, that is, 40%,
60%, and 80%. The concentration of saturated ammonium sulphate for each precipitate
formed was recorded. All the steps that involve enzyme solution must be done in 0-4oC.
The suspension was dialysed against several hundred volumes of water for 16 hours at 4oC.
3.4.11 SDS PAGE (Laemmli, 1970)
The glass plate sandwich of the electrophoresis apparatus (BioRad) was assembled
according to the manufacturer’s instruction using two clean glass plates and two 0.75mm
spacers. The sandwich was locked to the casting stand. The separating gel solution was
prepared as Table 3.3 and degassed using a rubber-stopper 25ml Erlenmeyer side arm flask
connected with vacuum tubing to a vacuum pump with a cold trap. After adding a specific
amount of 10% ammonium persulfate and tetramethylethylenediamine (TEMED) to the
degassed solution, it was stirred gently to mix. Using a Pasteur pipette, the separating gel
solution was applied to the sandwich along an edge of one of the spacers until the height of
the solution between the glass plates was around 11cm. Using another Pasteur pipette, the
top of the gel was slowly covered with a layer (around 1cm thick) of H2O-saturated
isobutyl alcohol by gently layering the isobutyl alcohol against the edge of one and then the
other of the spacers. The gel was allowed to be polymerized for 30 to 60 minutes at room
temperature. The layer of H2O-saturated isobutyl alcohol was poured off and rinsed with
1X Tris.Cl/SDS, pH8.8. The stacking gel solution was prepared according to Table 3.3.
Using a Pasteur pipette, the stacking gel was allowed to trickle slowly into the center of the
sandwich along an edge of one of the spacers until the height of the solution in the
27
sandwich was around 1cm from the top of the plate. A 0.75mm Teflon comb was inserted
into the layer of the stacking gel solution. If necessary, additional stacking gel was added to
fill the spaces in the comb completely. The stacking gel solution was allowed to polymerize
for 30 to 45 minutes at room temperature. A portion of the protein sample was diluted 1:1
(v/v) with 2X SDS sample buffer and heated 3 to 5 minutes at 100oC in a sealed screw-cap
microcentrifuge tube. If the sample is a precipitated protein pellet, the protein was
dissolved in 50 to 100µl of 1X SDS sample buffer and boiled 3 to 5 minutes at 100oC. The
Teflon comb was removed carefully without tearing the edge of the polyacrylamide wells.
After the comb was removed, the wells were rinsed with 1X SDS electrophoresis buffer.
Using a Pasteur pipette, the wells were filled with 1X SDS electrophoresis buffer. The gel
sandwich was attached to upper buffer chamber using manufacturer’s instructions. The
lower buffer chamber was filled with the recommended amount of 1X SDS electrophoresis
buffer. Sandwich that attached to upper buffer chamber was placed into lower buffer
chamber. Using a 25 to 100µl syringe with a flat-tipped needle, the protein sample was
loaded into one or more wells by carefully applying the sample as a thin layer at the bottom
of the wells. Control well was loaded with molecular weight standards. An equal volume of
1X SDS sample buffer was added to any empty wells to prevent spreading of adjoining
lanes. The remainder of the upper buffer chamber was filled with additional 1X SDS
electrophoresis buffer so that the upper platinum electrode is completely covered. This step
was done slowly so that samples were not swept into adjacent wells. The power supply was
connected to the cell and run at 10mA of constant current for a slap gel 0.75mm thick, until
the bromophenol blue tracking dye enters the separating gel. Then the current was
increased to 15mA. After the bromophenol blue tracking dye has reached the bottom of the
separating gel, the power supply was disconnected. The electrode buffer was discarded and
the upper buffer chamber with the attached gel sandwich was removed. The gel was

28
oriented so that the order of the sample wells was known. The sandwich was removed from
the upper buffer chamber and layered on a sheet of absorbent paper or paper towels. One of
the spacers was slided halfway from the edge of the sandwich along its entire length. The
exposed spacer was used as a lever to pry opens the glass plate, exposing the gel. The gel
was removed carefully from the lower plate. A small triangle from one corner of the gel
was cut off so that the lane orientation was not lost during staining and drying.
Figure 3.2: Flow chart for SDS PAGE procedure.
29
Table 3.3: Recipe for polyacrylamide separating and stacking gela.
Preparation of separating gel
Stock solutionb Final acrylamide concentration in separaring gel (%)
c
10 15
30% acrylamide/0.8%
bisacrylamide
5.00 7.50
4X Tris.Cl/SDS, pH8.8 3.75 3.75
H2O 6.25 3.75
10% (w/v) ammonium
persulphated
0.05 0.05
TEMED 0.01 0.01
Preparation of separating gel
In a 25ml side-arm flask, 30% acrylamide/0.8% bis acrylamide solution, 4X Tris.Cl/SDS,
pH8.8, and H2O were mixed and degassed under vacuum about 5 minutes. 10%
ammonium persulfate and TEMED were added. The solution was swirled gently to mix.
Preparation of stacking gel
In a 25ml side-arm flask, 0.65ml of 30% acrylamide/0.8% bis acrylamide solution, 1,25ml
of 4X Tris.Cl/SDS, pH6.8, and 3.05ml of H2O were mixed and degassed under vacuum for
10 to 15 minutes. 25µl of 10% ammonium persulfate and 5µl TEMED were added. The
solution was swirled gently to mix.
aThe recipes produce 15ml of separating gel and 5ml of stacking gel, which are adequate
for a gel of dimensions 0.75mm × 14cm × 14cm. The recipes are based on the SDS
(denaturing) discontinuous buffer system of Laemmli (1970).
bAll reagents and solutions used in the protocol must be prepared with Milli-Q-purified
water or equivalent.
cUnits of numbers in table body are milliliters. The desired percentage of acrylamide in the
separating gel depends on the molecular size of the protein being separated. See annotation
to step 3, Basic Protocol 1.
dBest to prepare fresh.

30
3.4.12 Determination of PLA-degrading enzyme’s molecular weight by zymography
The crude enzyme was run with SDS-PAGE. The gel was soaked in 2.5% (v/v) Triton X-
100 for 1 hour at room temperature. A PLA agar indicator gel plate (Appendix A, page 58)
was prepared to detect the molecular weight of PLA-degrading enzyme which responsible
to the PLA-degrading activity. After 1 hour, the SDS-PAGE gel was washed with distilled
water and laid on the PLA agar indicator gel plate. The indicator gel plate was incubated at
30oC overnight in humid condition to ensure the gel wasn’t dried up. The position of
clearance zone formed on the indicator gel plate was compared with the protein molecular
weight ladder.

31
CHAPTER 4
4.0 Results
4.1 Pretreatment of soil sample
PLA degradation in the PLA-emulsified plate was indicated by the formation of yellow
zone on PLA-emulsified medium. Shorter incubation period was needed for
microorganisms in the pretreated soil to show PLA degradation activity compared to those
in non-pretreated soil. However, the colony forming unit per milliliter (cfu/ml) and also the
number of presumptive actinobacteria isolated from the pretreated soil was lower than the
non-pretreated soil (Table 4.1). Most of the isolates isolated from pretreated DS2D soil
sample were Gram negative bacteria.
Table 4.1: Comparison of the effects of soil pretreatment by using PLA film.
cfu/ml Incubation period Number of isolated strain
(presumptive actinobacteria)
Pretreated DS2D 3.00 x 10⁵ 2 weeks 15
Non-pretreated
DS2D
1.51 x 10⁶ 5 weeks 35
4.2 Isolation of PLA-degrading actinobacteria
Bromocresol purple, a pH indicator, was added into the PLA-emulsified medium to act as
an indicator for the PLA degradation activity. The colour of the medium (at pH7) with
bromocresol purple supposed to be in purple colour. However, after the agar medium was
poured into the Petri dish, the colour of the medium was diluted into green in colour
(Figure 4.1). After incubation period, agar plates without PLA degradation activity were

32
remained green in colour while those with degradation activity were changed into yellow in
colour. Strains were only picked and purified from those agar plates which turn yellow. A
total of 251 strains were isolated in this study (Table 4.2).
Table 4.2: Number of isolated strain from each soil sample. There was no presumptive
actinobacterial strain isolated from the landfill soil samples DS1C, DS1D, DS2C, DS2E, DS3A,
DS3B, DS3D, DS3E, DS4A, DS4B, DS4C, DS4D, DS5A, DS5C, DS5D, DS5E, and the non-
contaminated soils SP1, SP2, SP4 and SP5.
Soil sample Source of soil sample Number of strain
DS1A Landfill site 2
DS1B Landfill site 5
DS1E Landfill site 19
DS2A Landfill site 94
DS2B Landfill site 36
DS2D Landfill site 50
DS3C Landfill site 17
DS4E Landfill site 1
DS5B Landfill site 11
SP3 Non-contaminated camp site 16
Figure 4.1: PLA-emulsified plate with and without PLA degradation activity. From
left to right: fresh PLA-emulsified agar plate; PLA-emulsified agar plate without
PLA degradation activity; PLA-emulsified agar plate with PLA degradation
33
4.3 Characterization of isolated strains
4.3.1 Grouping of isolated strains according to phenotypic characteristics
4.3.1.1 Grouping based on cell morphology
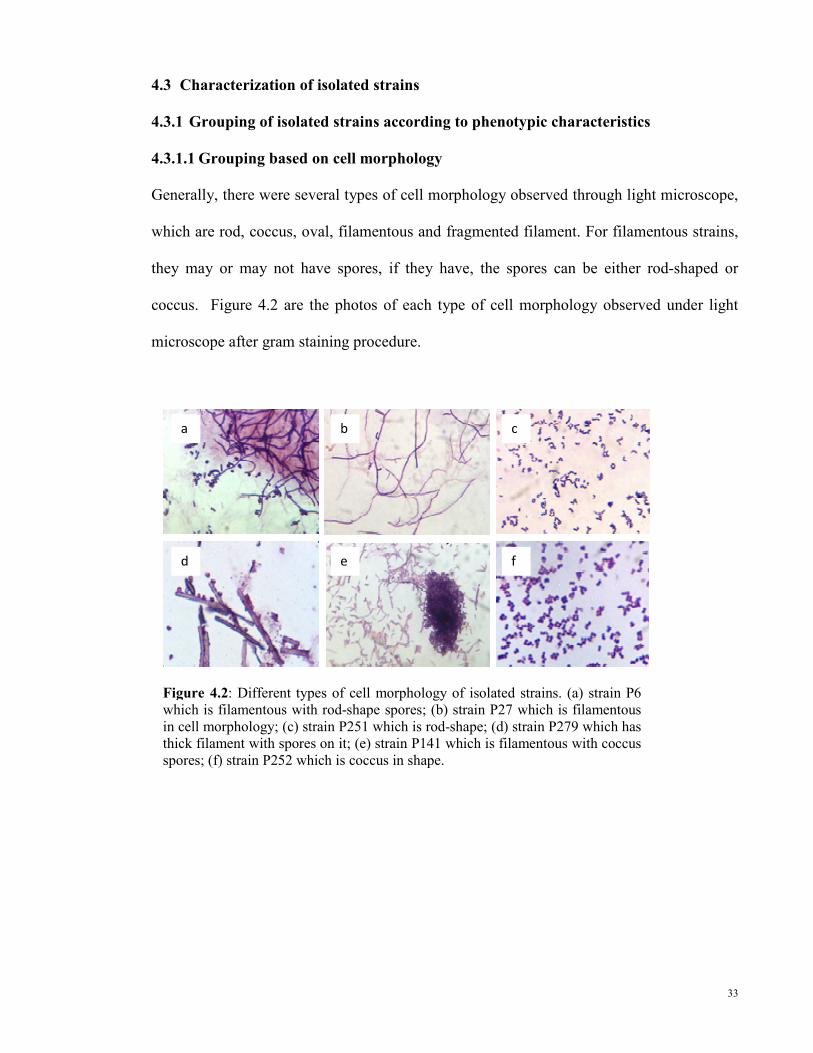
Generally, there were several types of cell morphology observed through light microscope,
which are rod, coccus, oval, filamentous and fragmented filament. For filamentous strains,
they may or may not have spores, if they have, the spores can be either rod-shaped or
coccus. Figure 4.2 are the photos of each type of cell morphology observed under light
microscope after gram staining procedure.
Figure 4.2: Different types of cell morphology of isolated strains. (a) strain P6
which is filamentous with rod-shape spores; (b) strain P27 which is filamentous
in cell morphology; (c) strain P251 which is rod-shape; (d) strain P279 which has
thick filament with spores on it; (e) strain P141 which is filamentous with coccus
spores; (f) strain P252 which is coccus in shape.
a b c
d e f

34
Three main types of cell morphology which were observed through light microscope are
rod-shaped, filamentous and also fragmented filament (Figure 4.3). Cell morphology
grouping with strain’s details can be found in Table B.1 in Appendix B (page 59).
91
3 2
48
2823
56
0102030405060708090
100
Nu
mb
er
of
stra
in
Cell Morphology
Number of strains
4.3.1.2 Colour grouping
All the 251 strains were grouped into a total of 50 colour groups based on the colour of
their aerial mycelia, substrate mycelia and pigmentation. All the strains were grown for 7
days at 28oC and compared for their colour (Table 4.3).
Figure 4.3: Number of strains for each type of cell morphology.

35
Table 4.3: Colour grouping of isolated strains based on colour of their aerial mycelia, substrate
mycelia and pigmentation. Colour was determined by using National Bureau of Standards Colour
Name Charts.*
No. Colour group No. of
strains Aerial mycelia Substrate mycelia Pigmentation
1 Vivid yellow Vivid yellow No 18
2 Vivid orange Vivid orange No 42
3 Vivid orange yellow Deep yellow No 9
4 Vivid orange yellow Vivid orange yellow No 4
5 Strong yellow Strong yellow No 2
6 Vivid greenish yellow Vivid greenish yellow No 6
7 Deep orange yellow Deep orange yellow No 1
8 Brilliant greenish
yellow
Strong greenish yellow No 3
9 Brilliant yellow green Brilliant yellow green No 42
10 Light greenish yellow Brilliant greenish yellow No 50
11 Pale orange yellow Brilliant greenish yellow No 2
12 White Strong greenish yellow No 6
13 Light gray Vivid yellow Deep yellow 2
14 Light gray Vivid yellow No 3
15 White Vivid yellow No 1
16 Light grayish olive Dark brown No 1
17 Light gray Deep yellow Vivid greenish
yellow
1
18 Grayish olive green Deep orange yellow Strong greenish
yellow
2
19 Light grayish brown Strong greenish yellow No 1
20 Light gray Strong greenish yellow No 1
21 White Deep orange yellow Deep yellow 1
22 White Deep orange yellow Vivid greenish
yellow
1
23 White Deep orange yellow Dark orange yellow 1
24 White Deep orange yellow No 1
25 White Deep yellowish pink Strong greenish
yellow
1
26 Light grayish brown Deep orange yellow No 1
27 White Moderate olive green No 1
28 Light gray Deep yellow No 1
29 Grayish olive green Deep yellow Moderate olive 1
30 Reddish black Strong greenish yellow No 1
31 Light gray Reddish black Moderate olive
brown
1
32 Vivid yellow green Deep greenish yellow No 1
33 Vivid reddish orange Vivid reddish orange No 1
34 Deep reddish orange Deep reddish orange No 3
35 Black Deep orange Moderate yellow
green
4
36 Black Deep orange No 6
37 Black Black No 2
38 Black Black Dark olive green 1

36
‘Table 4.3, continue’
39 Reddish black Brownish black Moderate olive
brown
9
40 Reddish black Brownish black No 3
41 Reddish black Brownish black Deep yellow 1
42 Reddish black Brownish black Light olive 1
43 White Brownish black Moderate olive
brown
1
44 Light yellow green Light yellow green No 1
45 Brilliant greenish
yellow
Brilliant greenish yellow No 2
46 Olive black Bluish black Bluish white 3
47 Light orange Deep yellowish pink Strong yellow 1
48 Deep yellowish pink Deep yellowish pink Brilliant yellow
green
1
49 Dark olive green Dark olive green Dark olive green 1
50 Deep orange Deep orange Moderate yellow
green
1
*Colour grouping with strain’s details can be found in Table B.2 in Appendix B (Page 60).
4.3.2 Oxidase test and catalase test
All isolated strains showed negative oxidase reaction except for strains P208, P226, P230,
P202, P147, P148, P149, P146, P145, P69, P204, P56, P166, P236, P84, P85, P89, P109,
P120, P121, P123, P122 and P125.
All isolated strains showed positive catalase reaction except for strains P141, P200, P227,
P229, P217, P41, P79, P80, P71, P36, P104, and P131.
4.3.3 Novel strains identification
Two of the isolated strains, P86 and P224, were identified as novel strains through their
16S rRNA gene sequences. Strain P86 has 97.77% similarity with Agromyces humatus
CD5T with 30 nucleotides differences over 1344 nucleotides while strain P224 has 98.19%
similarity with Mycobacterium tokaiense ATCC 27282T
with 24 nucleotides differences
over 1328 nucleotides. Phylogenetic trees for strains P86, P224 and their closely related

37
strains were generated by using MEGA 4 software (Figures 4.4, 4.5, 4.6 and 4.7) (Tamura
et al., 2007).
Agromyces salentinus (AY507129)
Agromyces terreus (EF363711)
Agromyces allii (DQ673873)
Agromyces italicus (AY618215)
Agromyces lapidis (AY618217)
Strain P86 (KF499320)
Agromyces humatus (AY618216)
Agromyces neolithicus (AY507128)100
100
54
60 60
0.002
Agromyces salentinus (AY507129)
Agromyces terreus (EF363711)
Agromyces allii (DQ673873)
Agromyces italicus (AY618215)
Agromyces lapidis (AY618217)
Agromyces humatus (AY618216)
Agromyces neolithicus (AY507128)
Strain P86 (KF499320)
43
98
40
53
99
Figure 4.4: Phylogenetic tree of strain P86 and its closely related strains. This phylogenetic
tree was generated by Mega4 software using Neighbor-Joining method, Jukes-Cantor model,
and with 1000 bootstrap replicates.
Figure 4.5: Phylogenetic tree of strain P86 and its closely related strains. This phylogenetic
tree was generated by Mega4 software using Maximum Parsimony method with 1000
bootstrap replicates.

38
Figure 4.6: Phylogenetic tree of strain P224 and its closely related strains. This phylogenetic tree
was generated by Mega4 software using Neighbor-Joining method, Jukes-Cantor model, and with
1000 bootstrap replicates.
Mycobacterium goodii (Y12872) Mycobacterium smegmatis (AJ131761)
Mycobacterium agri (AJ429045)
Mycobacterium phlei (AF480603)
Mycobacterium confluentis (AJ634379)
Mycobacterium elephantis (AJ010747)
Mycobacterium pulveris (AJ429046)
Mycobacterium fallax (AF480600)
Strain P224 (KF499321)
99
60
46
50
14
11
0.002
Mycobacterium goodii (Y12872)
Mycobacterium smegmatis (AJ131761)
Mycobacterium agri (AJ429045)
Mycobacterium phlei (AF480603)
Mycobacterium elephantis (AJ010747)
Mycobacterium pulveris (AJ429046)
Mycobacterium confluentis (AJ634379)
Mycobacterium fallax (AF480600)
Strain P224 (KF499321)
91
49
43
18
6
34
Figure 4.7: Phylogenetic tree of strain P224 and its closely related strains. This phylogenetic
tree was generated by Mega4 software using Maximum Parsimony method with 1000
bootstrap replicates.

39
4.3.4 PLA degradation by strains
Clear zone formation test was performed onto all the 251 strains to confirm on their PLA-
degrading ability. There were only 235 strains confirmed to have the ability to degrade
PLA. The remaining 16 strains were not able to form a clear zone on the PLA-emulsified
agar plate, which indicate that they were not capable in degrading PLA.
4.3.4.1 Relative enzyme activity of PLA-degrading strains
Relative enzyme activity of the 235 PLA-degrading strains on both low and high molecular
weight PLA was determined. Strains were grouped according to their relative enzyme
activity and a chart was generated according to that (Figure 4.8). The relative enzyme
activity of all the strains was following a normal distribution pattern, that is, there are more
strains with average relative activity.
21
111
73
3022
9482
37
0
20
40
60
80
100
120
0.01 - 1.00 1.01 - 2.00 2.01 - 3.00 > 3.00
Nu
mb
er
of
stra
ins
Relative enzyme activity
Low molecular
weight PLA
High molecular
weight PLA
Figure 4.8: Number of strains in each group of relative enzyme activity.

40
4.4 Crude enzyme extraction
Strains P253 and P256 were chosen for crude enzyme extraction because these two strains
had relative enzyme activity higher than 3.00. After the cell biomass was filtered out, the
broth was clear in colour (Figure 4.9) instead of the milky white colour of the PLA-
emulsified broth. The clear colour of the broths indicates that the PLA present in the broth
was either degraded or assimilated by strains P253 and P256. The broth without cell
biomass was treated as crude enzyme and was used for further tests.
4.5 Determination of PLA-degrading enzyme’s molecular weight
Crude enzymes were run by using SDS-PAGE to visualize the extracted enzymes (Figure
4.10a). After that, the denatured enzymes in the PAGE were renatured by washing with
Triton-X 100 before the PAGE gel was overlaid onto the PLA indicator gel plate for PLA-
degrading enzyme(s) detection (Figure 4.10b).
Figure 4.9: PLA-emulsified broth and filtered broth of strain P253 (left); PLA-emulsified
broth and filtered broth of strain P256 (right).

41
(a) (b)
Figure 4.10: SDS PAGE and PLA gel indicator plate of
zymography. (a) Crude enzymes of strain P253 (lane 2 and
3) and strain P256 (lane 4 and 5) on Commasie Blue stained
SDS-PAGE. (b) PLA indicator gel with clearing zones (dash
line indicating the clearing zone).
1 2 3 4 5 6 7 8 9
10kDa
40kDa
35kDa
42
CHAPTER 5
5.0 Discussions
5.1 Isolation of PLA-degrading actinobacteria
In this study, there were two groups of soil samples, which were used to isolated PLA-
degrading actinobacteria. First group of soil samples (labeled as “DS”) were collected from
landfill site in Perak, Malaysia. This is because we believe that in a landfill site, which has
large number of buried plastics, will have higher number of microorganisms that could
degrade plastic and utilize the degradation products as carbon source compared to site
which is not contaminated with plastic materials. Another group of soil samples (labeled as
“SP”) were obtained from a camp site on Gunung Jerai, Gurun, where it is free from plastic
wastes contamination. This site was chosen randomly to check whether PLA-degrading
actinobacteria are commonly present in any conditions or places. From the results, a total
of 16 strains were isolated from soil sample SP3 while there were 235 strains isolated from
landfill site. This shows that PLA-degrading actinobacteria are also present in non-polluted
places. However, their number is much lower than those present in plastic wastes polluted
places. This may indicate that the carbon metabolism mechanism for those actinobacteria
present in plastic wastes contaminated sites is shifting from normal organic carbon sources
to plastic wastes over long period of time after the organic carbon sources become depleted.
Surface soils were collected and used for isolation of PLA-degrading actinobacteria
because actinobacteria is aerobic bacteria.
Soil sample DS2D was randomly chosen and used to check the effects of pretreatment on
the isolation, especially the effect on the number of PLA degrader isolated and the
incubation period. Isolation was performed using both pretreated and non-pretreated DS2D

43
soil sample. During the pretreatment step, PLA degraders, including both Gram positive
and Gram negative bacteria, increased in numbers. Therefore, shorter incubation period
was needed for the PLA degraders in the pretreated DS2D soil sample to grow, degrade the
PLA in the isolation medium and change the medium into yellow colour compared to non-
pretreated DS2D soil sample (Table 4.1, page 31). However, at the second week of
incubation where the isolation medium started to turn yellow, colony of most of the slow
growers like actinobacteria were not formed yet or they were probably too small and were
overlooked when counted by naked eye. This is the reason why the cfu/ml count of
pretreated DS2D soil sample was lower than non-pretreated DS2D soil sample. On the
other hand, non-pretreated DS2D soil sample required longer incubation period for the
yellow zone to be observed and has higher cfu/ml count because the number of PLA
degrader in the non-pretreated DS2D soil sample was lower and most of the slow growers
start to form colony after a longer incubation period. Therefore, there was no pretreatment
step carried out for other soil samples since our aim is to isolate more actinobacteria so that
more PLA-degrading actinobacteria can be discovered.
In this study, a total of 251 presumptive actinobacteria strains were isolated from 10
different soil samples. Throughout the whole isolation process, modified PLA-emulsified
medium was used as selective isolation medium (Sukkhum et al., 2009). This medium
consists of mineral salts, yeast extract, PLA-powder, polysorbate-80 and bromocresol
purple. There are only minimum amount of mineral salts and yeast extract present in this
medium to fulfill the basic requirement of microorganisms’ growth. Hence, PLA will be
the sole carbon source in this medium, which means, only microorganism that can degrade
and utilize PLA as their carbon source can grow on this medium. Besides, 1% of
polysorbate 80 was added into the medium as emulsifier so that the PLA can disperse

44
evenly in the medium. Moreover, polysorbate 80 also has the ability to inhibit the biofilm
formation by both Gram positive and Gram negative bacteria, therefore, has a positive
effect in the isolation of slow grower, actinobacteria (Toutain-Kidd et al., 2009). Other than
this, 0.01% of bromocresol purple, which is a pH indicator, was added into the medium to
detect the degradation of the PLA. Bromocresol purple will change to yellow colour when
the pH drops to below 5.2. If the PLA in the PLA-emulsified agar plate is degraded, that
particular agar plate will change to yellow colour (Figure 4.1, page 32). This is due to the
fact that PLA-oligomer and lactic acid will be produced as PLA degradation product
(Tokiwa & Jarerat, 2004). All the strains were picked and purified from the isolation plate
once the plate change to yellow colour. After they were purified on the ISP2 medium,
Gram reaction of all isolated strains were determined. Only strains that gave Gram positive
reaction were kept for further tests since actinobacteria are Gram positive bacteria. Number
of presumptive actinobacteria strains isolated from each soil sample was shown in Table
4.2 (page 32). However, non-PLA-degrader may also grow in the yellow zone coincidently
especially actinobacteria, which has the ability to survive in the environment with low
nutrient content. Therefore, isolated strains were subject to clear zone formation test to
confirm their ability to degrade PLA. In this clear zone formation test, clear zone will be
formed around the strain’s colony if the strain has the ability to degrade PLA. Two types of
antifungals, which are nystatin and cyclohexamide, were added into the isolation medium
to exclude or reduce the number of fungus in the isolation.
45
5.2 Characterization and grouping of isolated strains
All isolated strains were grouped based on their phenotypic and physiological
characteristics, which are, colour of their aerial mycelia, substrate mycelia and
pigmentation, gram reaction, cell morphology, and their ability to produce enzyme
cytochrome oxidases and catalase. A dendrogram (Figure 5.1) was generated based on
these characteristics by using PAST software (Hammer et al., 2001). Isolated strains were
clustered together based on similarities in their characteristics, which means, strains with
similar characteristics were joined into clusters and most similar clusters were joined into
superclusters and the process go on until all the clusters are joined.
From Figure 5.1, the dendrogram can be separated into 4 main clusters, where the strains
were listed in Table 5.1. For cluster 1, it consists of strains that are having characteristics
similar to micromonospora, which is, their colonies were completely covered by mucoid,
black mass of spores. Strains in cluster 2 were having characteristics resemble to
mycobacterium, which are, they all have whitish or cream-coloured colonies and their cells
are fragmented or rod-shaped. While cluster 3 consists of strains with bright yellow, orange
or red coloured colonies, and their cells were in rod, fragmented filament or filamentous
shape. These characteristics were resembled to those agromyces, rhodococcus, and also
mycobacterium. The last cluster, cluster 4, consists of strains varies in the colour of their
aerial mycelia and substrate mycelia, some of them produce diffusible pigment, and they
sporulate. These characteristics suggest that they are streptomycetes.
Then, a few strains from each cluster were selected for identification through their partial
16S rRNA gene sequence to confirm the clustering result generated using phenotypic and
physiological characteristics. Identification results by using partial 16S rRNA gene
sequence were consistent with the clustering result (Table 5.1).
46
After that, strains from cluster 3 were further grouped based on their molecular
characteristics that is, their molecular fingerprint, in order to have a finer grouping of the
strains (Figure 5.6). This is because cluster 3 consists of genera Agromyces, Rhodococcus
and Mycobacterium which cannot be separate into distinct groups based on limited
phenotypic and physiological characteristics. Strains from same genus were grouped
together based on their molecular fingerprints.
Previous studies showed that almost all PLA degraders are members of Amycolatopsis
(Pranamuda & Tokiwa, 1999). However based on the grouping results in this study,
members from other genera, which are Agromyces, Rhodococcus, Micromonospora,
Mycobacteria and Streptomyces, were shown to have the ability to degrade PLA too.

47
Figure 5.1: Dendogram generated by PAST software according to phenotypic and physiological
characteristics.
Cluster 1
Cluster 2
Cluster 3
Cluster 4

48
Figure 5.2: Cluster 1 which consists of strains from genus Micromonospora.

49
Figure 5.3: Cluster 2 which consists of strains from genus Mycobacterium.
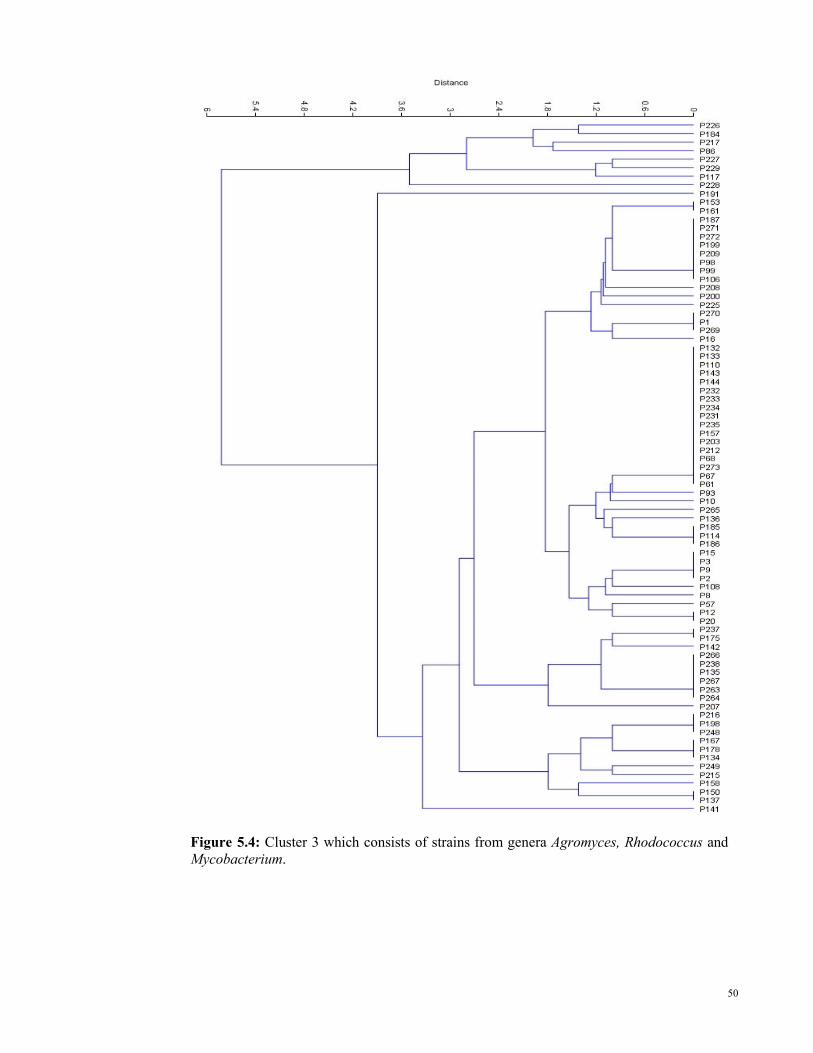
50
Figure 5.4: Cluster 3 which consists of strains from genera Agromyces, Rhodococcus and
Mycobacterium.

51
Table 5.1: Strains of each cluster, which was generated by using PAST, their cell wall type, and
their closest match in BLAST results.
Strain label PAST
cluster
Cell wall
analysis
Strain (Closest match in
BLAST results)*
P214, P275, P274, P168,
P246, P210, P211, P239,
P177, P131, P213, P252,
P247, P251, P250, P104
1 meso-DAP P168, P131
(Micromonospora chersina,
DSM 44151T)
P118, P164, P63, P46,
P60, P276, P41, P79,
P80, P36, P47, P48,
P206, P38, P37, P204,
P162, P230, P194, P195,
P36
(Mycobacterium fortuitum
subsp. Fortuitum, ATCC
6841T)
Figure 5.5: Cluster 4 consists of strains from genus Streptomyces.
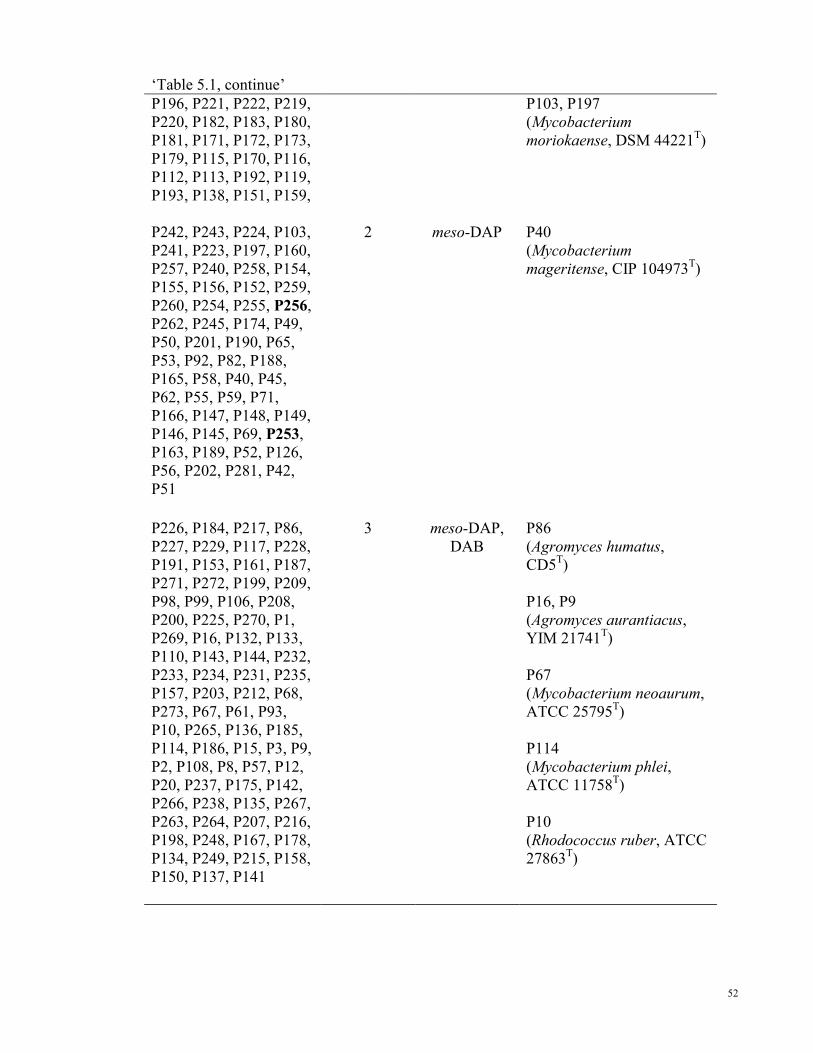
52
‘Table 5.1, continue’
P196, P221, P222, P219,
P220, P182, P183, P180,
P181, P171, P172, P173,
P179, P115, P170, P116,
P112, P113, P192, P119,
P193, P138, P151, P159,
P103, P197
(Mycobacterium
moriokaense, DSM 44221T)
P242, P243, P224, P103,
P241, P223, P197, P160,
P257, P240, P258, P154,
P155, P156, P152, P259,
P260, P254, P255, P256,
P262, P245, P174, P49,
P50, P201, P190, P65,
P53, P92, P82, P188,
P165, P58, P40, P45,
P62, P55, P59, P71,
P166, P147, P148, P149,
P146, P145, P69, P253,
P163, P189, P52, P126,
P56, P202, P281, P42,
P51
2 meso-DAP P40
(Mycobacterium
mageritense, CIP 104973T)
P226, P184, P217, P86,
P227, P229, P117, P228,
P191, P153, P161, P187,
P271, P272, P199, P209,
P98, P99, P106, P208,
P200, P225, P270, P1,
P269, P16, P132, P133,
P110, P143, P144, P232,
P233, P234, P231, P235,
P157, P203, P212, P68,
P273, P67, P61, P93,
P10, P265, P136, P185,
P114, P186, P15, P3, P9,
P2, P108, P8, P57, P12,
P20, P237, P175, P142,
P266, P238, P135, P267,
P263, P264, P207, P216,
P198, P248, P167, P178,
P134, P249, P215, P158,
P150, P137, P141
3 meso-DAP,
DAB
P86
(Agromyces humatus,
CD5T)
P16, P9
(Agromyces aurantiacus,
YIM 21741T)
P67
(Mycobacterium neoaurum,
ATCC 25795T)
P114
(Mycobacterium phlei,
ATCC 11758T)
P10
(Rhodococcus ruber, ATCC
27863T)
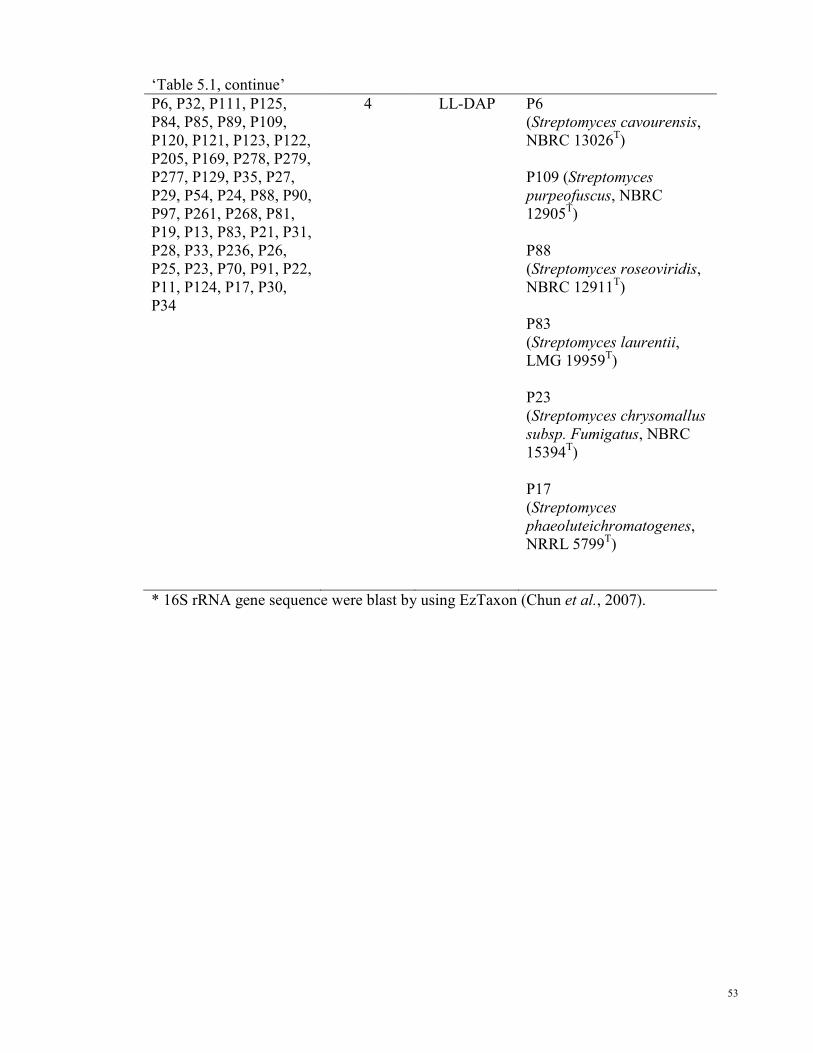
53
‘Table 5.1, continue’
P6, P32, P111, P125,
P84, P85, P89, P109,
P120, P121, P123, P122,
P205, P169, P278, P279,
P277, P129, P35, P27,
P29, P54, P24, P88, P90,
P97, P261, P268, P81,
P19, P13, P83, P21, P31,
P28, P33, P236, P26,
P25, P23, P70, P91, P22,
P11, P124, P17, P30,
P34
4 LL-DAP P6
(Streptomyces cavourensis,
NBRC 13026T)
P109 (Streptomyces
purpeofuscus, NBRC
12905T)
P88
(Streptomyces roseoviridis,
NBRC 12911T)
P83
(Streptomyces laurentii,
LMG 19959T)
P23
(Streptomyces chrysomallus
subsp. Fumigatus, NBRC
15394T)
P17
(Streptomyces
phaeoluteichromatogenes,
NRRL 5799T)
* 16S rRNA gene sequence were blast by using EzTaxon (Chun et al., 2007).

54
50
96
94
92
98
64
72
100
74
76
77
66
97
69
77
72
84
83
77
78
77
77
70
65
55
78
88
63
91
62
72
84
98
98
68
74
75
60
65
P strains
100
90
80
70
60
50
40
30
20
P strains
P232
P233
P235
P234
P227
P228
P225
P98
P263
P264
P266
P136
P184
P199
P135
P237
P231
P137
P238
P185
P150
P203
P93
P273
P108
P157
P110
P142
P161
P187
P153
P99
P106
P212
P209
P248
P86
P200
P216
P134
P178
P167
P215
P191
P269
P198
P12
P8
P16
P2
P158
P10
P15
P57
P20
P3
P114(1)
P141
P229
Figure 5.6: Dendrogram generated based on molecular fingerprints of strains from Cluster 3
using GelCompar II. This dendogram was generated by using UPGMA method, Jaccard model,
1.0% optimization, and 0.7% tolerance.
Mycobacterium sp.
Agromyces sp.
Rhodococcus sp.
Agromyces
humatus
Agromyces
aurantiacus
Rhodococcus
ruber
Mycobacterium
phlei

55
5.3 PLA degradation
All isolated strains were streaked onto the PLA-emulsified agar plate following the method
in 3.4.8 (page 24) to confirm their capability to degrade PLA and their relative enzyme
activity. This is because some of the isolated strains just coincidently grew inside the
yellow zone instead of really having the ability to degrade PLA. Result shows that 235
strains from the total of 251 isolated strains were confirmed to have the ability to degrade
PLA. Among these 235 strains, most of them have medium relative enzyme activity, that is,
between 1.00 and 3.00. Strains P253 and P256, which were members of genus
Mycobacterium (Table 5.1, page 51), with higher relative enzyme activity were selected for
crude enzyme extraction. Both strains P253 and P256 have relative enzyme activity that
were higher than 3.00 for both low and high molecular weight PLA. Their higher relative
enzyme activity indicates that either they can produce higher volume of enzyme or their
enzymes have stronger enzyme activity than other strains. Choosing these strains will ease
the downstream processes because loss of enzyme quantity in these steps is expected.
The cell biomass of each strain was removed from the PLA-emulsified broth by filtration.
The remaining broth was treated as crude enzyme and concentrated by using ammonium
salt precipitation method. Enzyme present in the remaining broth was concentrated and
check for its activity by using the method stated in section 3.4.10 (page 25). These results
also indicate that the enzyme produced was released into and remained in the broth since
the extraction method did not involve any step that destructs the cells. Hence, the enzyme
produced is an extracellular enzyme (Nakamura et al., 2001).
Crude enzyme of strains P253 and P256 were separated based on their molecular weight
using SDS PAGE. Then, the separated enzymes in the PAGE gel were soaked the gel in

56
2.5% (v/v) Triton-X 100 for one hour. This step was to renature the denatured enzymes in
the PAGE gel by washing away the SDS using Triton-X100. After the renaturation step, the
PAGE gel was laid on the PLA indicator gel plate to allow the enzyme to diffuse from the
PAGE gel into the PLA indicator gel plate. By doing this, the particular band that is
responsible to the PLA degradation activity and its molecular weight can be determined
simultaneously. From the result, clearing zone was observed in the area with molecular
weight of 10-35kDa and 35-40kDa for strains P253 and P256, respectively. This indicates
that the molecular weight of PLA-degrading enzymes from strains P253 and P256 are in
that particular range. However, there were more than one protein band within the clearing
zone. Therefore, further steps such as protein purification have to be done in order to
determine the exact molecular weight of the PLA-degrading enzyme and identify them.
Enzymes from strain P253 with molecular weight range of 10-35kDa was similar to those
found by Li and his group (Li et al., 2008), and Nakamura (Nakamura et al., 2001). While
enzyme extracted from strain P256 may be a novel enzyme because no PLA-degrading
enzyme with this range of molecular weight was reported up to date.
57
CHAPTER 6
6.0 Conclusion
A total of 251 strains of PLA degrading actinobacteria were isolated from collected soil
samples. They were members of genera Agromyces, Rhodococcus, Micromonospora,
Mycobacterium and Streptomyces. These results showed that PLA-degrading activities
were also present in genera other than Amycolatopsis (Pranamuda et al., 1997)
Kibdelosporangium (Jarerat et al., 2003), Pseudonocardia (Konkit et al., 2012) and
Saccharothrix (Jarerat & Tokiwa, 2003). Among these strains, two novel strains, strains
P86 and P224, were discovered and they are members of Agromyces and Mycobacterium,
respectively. Full characterization of these two strains will be carried out in future for
species description. Crude enzyme was extracted from strains with the highest relative
enzyme activity, strains P253 and P256, which were members of genus Mycobacterium.
PLA-degrading enzymes extracted from strain P253 were found to have molecular weight
between 10 to 35kDa, which was similar to Li’s and Nakamura’s finding, while the
molecular weight of PLA-degrading enzyme from strain P256 was between 35 to 40kDa
indicating it may be a novel enzyme. In order to have a clearer insight on the extracted
enzymes and their mechanisms, further studies have to be carried out to identify the PLA-
degrading enzyme and the genes that code for the enzymes.

58
APPENDICES
Appendix A
Preparation of reagents.
¼ strength Ringer’s solution
A Ringer’s pellet (Oxoid) was dissolved in 500ml of distilled water.
6N HCl
One liter of 6N HCl was prepared by mixing 617ml of HCl (35%) to 382ml of distilled
water.
PLA agar indicator gel plate
PLA (0.1%; w/v) with 5000Mw was dissolved by using dichloromethane. The dissolved
PLA together with 1% (v/v) Tween 80 were added into 50ml distilled water. The solution
was sonicated for 5 minutes. Then, dichloromethane was evaporated by using a hot plate
stirrer. After that, 2.5% (w/v) agarose powder was mixed into the solution. The solution
was heated until the agarose powder dissolves completely. The solution was poured into a
cast and allows to be solidified at room temperature.

59
Appendix B
Raw data for characterization of PLA-degrading actinobacteria.
Table B.1: Grouping of isolated strains based on their cell morphology.
Cell
morphology
Present
of spores
Strains Number of strain
Rod No P1, P153, P161, P187, P208, P271, P272,
P200, P199, P209, P98, P99, P106, P270,
P269, P132, P133, P110, P143, P144, P232,
P233, P234, P231, P235, P157, P203, P212,
P68, P273, P67, P185, P114, P186, P12, P20,
P10, P136, P61, P57, P216, P198, P248, P167,
P178, P134, P150, P137, P226, P184, P86,
P51, P162, P230, P202, P82, P92, P41, P79,
P80, P147, P148, P149, P146, P145, P58, P71,
P40, P45, P62, P55, P59, P47, P48, P204,
P206, P38, P37, P166, P188, P165, P36, P174,
P49, P50, P252, P247, P251, P39, P281, P42
91
Coccus No P225, P69, P93 3
Oval No P52, P56 2
Filamentous No P16, P108, P15, P158, P190, P53, P197, P160,
P257, P240, P258, P236, P27, P22, P280, P35,
P3, P9, P2, P265, P215, P249, P217, P65,
P154, P155, P156, P152, P23, P25, P26, P29,
P11, P13, P261, P19, P168, P246, P210, P84,
P85, P89, P109, P120, P121, P123, P122,
P125
48
Rod P201, P254, P255, P256, P259, P260, P91,
P124, P83, P253, P8, P262, P28, P33, P81,
P97, P54, P31, P24, P88, P6, P70, P17, P32,
P21, P104, P211, P111
28
Coccus P141, P250, P107, P213, P105, P130, P177,
P205, P275, P268, P279, P277, P129, P140,
P131, P239, P244, P214, P169, P274, P278,
P245, P90
23
Fragmented
filament
No P237, P175, P142, P266, P238, P135, P267,
P263, P264, P191, P207, P227, P228, P229,
P117, P163, P126, P164, P63, P46, P60, P276,
P189, P194, P195, P196, P221, P222, P219,
P220, P182, P183, P180, P181, P171, P172,
P173, P179, P115, P170, P116, P112, P113,
P192, P119, P193, P138, P151, P118, P159,
P242, P243, P224, P103, P241, P223
56

60
Table B.2: Colour groups and strains belong to each group.
No.
Colour group
Strains No. of
strains Aerial
mycelia
Substrate
mycelia Pigmentation
1 Vivid yellow Vivid yellow No P1, P16, P141,
P153, P161, P187,
P208, P271, P272,
P200, P199, P209,
P98, P99, P106,
P270, P269, P225
18
2 Vivid orange Vivid orange No P132, P133, P110,
P143, P144, P232,
P233, P234, P231,
P235, P157, P203,
P212, P68, P273,
P67, P185, P114,
P186, P237, P175,
P108, P93, P142,
P15, P8, P3, P9,
P12, P2, P20, P10,
P136, P266, P238,
P135, P267, P263,
P264, P265, P61,
P57
42
3 Vivid orange
yellow
Deep yellow No P215, P216, P198,
P248, P167, P178,
P134, P191, P249
9
4 Vivid orange
yellow
Vivid orange
yellow
No P150, P137, P207,
P158
4
5 Strong yellow Strong yellow No P226, P184 2
6 Vivid
greenish
yellow
Vivid greenish
yellow
No P227, P228, P229,
P117, P217, P86
6
7 Deep orange
yellow
Deep orange
yellow
No P51 1
8 Brilliant
greenish
yellow
Strong
greenish
yellow
No P162, P230, P202 3

61
‘Table B.2, continue’
9 Brilliant
yellow green
Brilliant
yellow green
No P201, P82, P163,
P190, P65, P53,
P92, P52, P126,
P164, P63, P46,
P41, P79, P80,
P147, P148, P149,
P146, P145, P58,
P71, P40, P45,
P62, P55, P59,
42
P69, P47, P48,
P204, P206, P38,
P37, P60, P276,
P56, P166, P188,
P189, P165, P36
10 Light greenish
yellow
Brilliant
greenish
yellow
No P197, P194, P195,
P196, P221, P222,
P219, P220, P182,
P183, P180, P181,
P171, P172, P173,
P179, P115, P170,
P116, P112, P113,
P192, P119, P193,
P138, P151, P118,
P159, P160, P254,
P255, P256, P257,
P245, P240, P242,
P243, P259, P260,
P224, P258, P154,
P155, P156, P152,
P103, P241, P223,
P262, P174
50
11 Pale orange
yellow
Brilliant
greenish
yellow
No P49, P50 2
12 White Strong
greenish
yellow
No P23, P25, P26,
P28, P33, P236
6
13 Light gray Vivid yellow Deep yellow P27, P29 2
14 Light gray Vivid yellow No P22, P11, P91 3
15 White Vivid yellow No P124 1
16 Light grayish
olive
Dark brown No P81 1
17 Light gray Deep yellow Vivid greenish
yellow
P54 1

62
‘Table B.2, continue’
18 Grayish olive
green
Deep orange
yellow
Strong
greenish
yellow
P90, P97 2
19 Light grayish
brown
Strong
greenish
yellow
No P13 1
20 Light gray Strong
greenish
yellow
No P31 1
21 White Deep orange
yellow
Deep yellow P24 1
22 White Deep orange
yellow
Vivid greenish
yellow
P88 1
23 White Deep orange
yellow
Dark orange
yellow
P6 1
24 White Deep orange
yellow
No P70 1
25 White Deep
yellowish pink
Strong
greenish
yellow
P261 1
26 Light grayish
brown
Deep orange
yellow
No P83 1
27 White Moderate
olive green
No P19 1
28 Light gray Deep yellow No P17 1
29 Grayish olive
green
Deep yellow Moderate olive P32 1
30 Reddish black Strong
greenish
yellow
No P21 1
31 Light gray Reddish black Moderate olive
brown
P111 1
32 Vivid yellow
green
Deep greenish
yellow
No P104 1
33 Vivid reddish
orange
Vivid reddish
orange
No P250 1

63
‘Table B.2, continue’
34 Deep reddish
orange
Deep reddish
orange
No P252, P247, P251 3
35 Black Deep orange Moderate
yellow green
P107, P140, P105,
P130
4
36 Black Deep orange No P168, P246, P210,
P211, P131, P213
6
37 Black Black No P239, P177 2
38 Black Black Dark olive
green
P244 1
39 Reddish black Brownish
black
Moderate olive
brown
P84, P85, P89,
P109, P120, P121,
P123, P122, P205
9
40 Reddish black Brownish
black
No P214, P275, P274 3
41 Reddish black Brownish
black
Deep yellow P268 1
42 Reddish black Brownish
black
Light olive P169 1
43 White Brownish
black
Moderate olive
brown
P125 1
44 Light yellow
green
Light yellow
green
No P39 1
45 Brilliant
greenish
yellow
Brilliant
greenish
yellow
No P281, P42 2
46 Olive black Bluish black Bluish white P278, P279, P277 3
47 Light orange Deep
yellowish pink
Strong yellow P253 1
48 Deep
yellowish
pink
Deep
yellowish pink
Brilliant
yellow green
P280 1
49 Dark olive
green
Dark olive
green
Dark olive
green
P35 1
50 Deep orange Deep orange Moderate
yellow green
P129 1

64
Table B.3: Characteristics that differentiate P86 and their closest relatives within the genus
Agromyces. 1: strain P86; 2: A. Humatus; 3: A. neolithicus; +, positive; -, negative; V,variable (data
in parentheses are for the type strain); W, weakly positive; ND, not determined or not described;
Glc, glucose; Gal, galactose; Man, mannose; Rha, rhamnose; Rib, ribose. All strains produced acid
from L-arabinose, D-fructose, galactose, glucose, glycerol, maltose, mannitol, D-mannose, but not
from B-gentiobiose, lactose or D-turanose. All strains do not decompose adenine, xanthine or urea.
All strains can grow in the presence of 2% NaCl but not at 10% NaCl. All strains can grow at 28oC
and 37oC. All strains showed positive reaction in catalase test.
Characteristic 1 2 3
Acid production:
Arbutin - + +
D-Arabinose - - +
Cellobiose + V +
L-Fucose - - +
Melibiose + - +
Inulin - + -
N-acetylglucosamine + V (+)
Rhamnose + + -
Ribose + - -
Salicin + - -
Trehalose + - -
D-xylose + - -
Decomposition of:
Tyrosine - + +
Tween 80 + - -
Casein - + +
Starch - + +
Aesculin - + +
Utilization of:
Malate - + -
Succinate - + -
Growth in the presence of:
4% NaCl - - -
Growth at:
10oC + - -
Microaerophilic growth + - +
Oxidase test - - +/-
Enzyme activities
a-Chymotrypsin + - +
a-Galactosidase + - +
b-Galactosidase + + -
b-Glucuronidase - + +
N-Acetyl-b-
glucosaminidase
+ - -
a-Mannosidase + + +

65
Appendix C
Pictures of representative strain from each colour group
Table C.1: Pictures of representative strain from each colour group
Colour group
(Representative
strain)
Aerial mycelia Substrate mycelia
Group 1(P161)
Group 2 (P132)
Group 3 (P216)
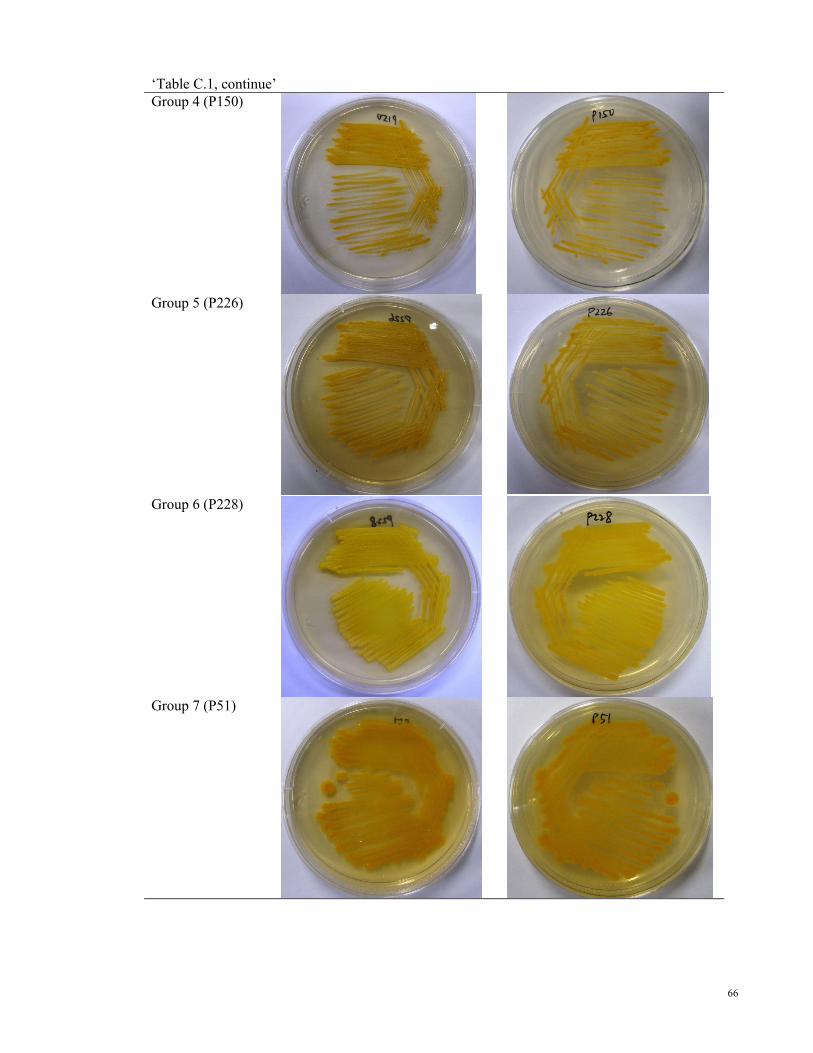
66
‘Table C.1, continue’
Group 4 (P150)
Group 5 (P226)
Group 6 (P228)
Group 7 (P51)

67
‘Table C.1, continue’
Group 8 (P162)
Group 9 (P201)
Group 10 (P194)
Group 11 (P50)

68
‘Table C.1, continue’
Group 12 (P28)
Group 13 (P27)
Group 14 (P22)
Group 15 (P124)

69
‘Table C.1, continue’
Group 16 (P81)
Group 17 (P54)
Group 18 (P97)
Group 19 (P13)
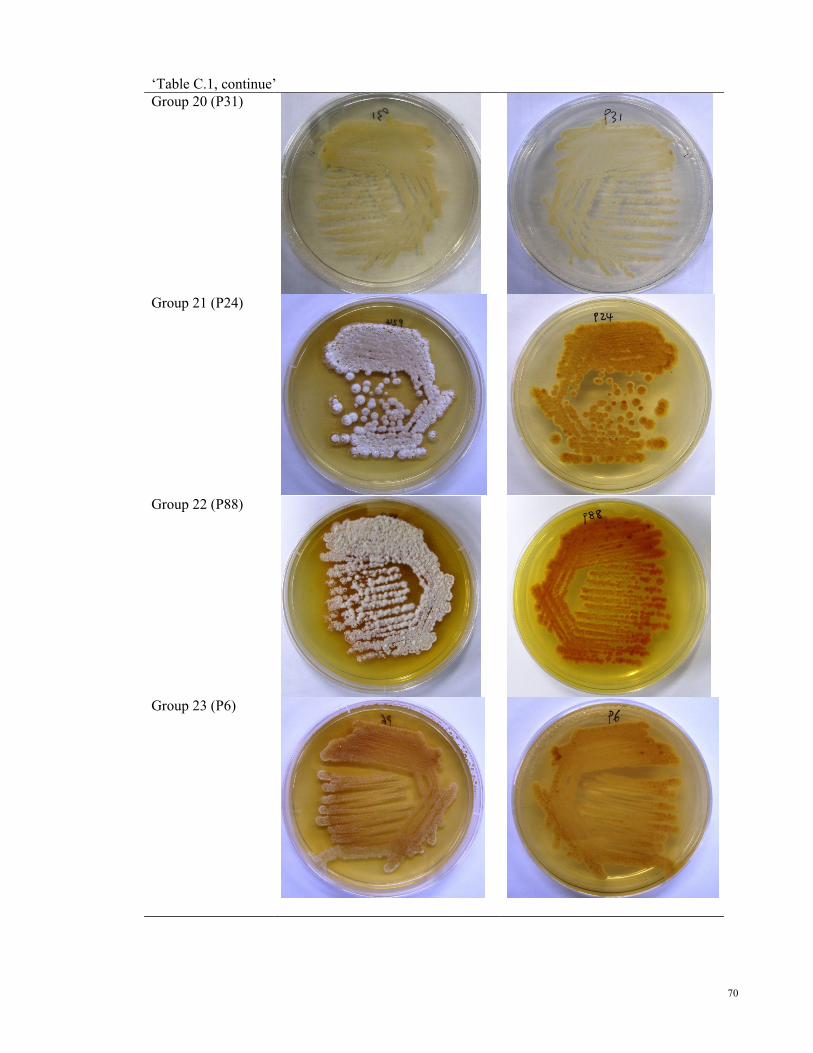
70
‘Table C.1, continue’
Group 20 (P31)
Group 21 (P24)
Group 22 (P88)
Group 23 (P6)

71
‘Table C.1, continue’
Group 24 (P70)
Group 25 (P261)
Group 26 (P83)
Group 27 (P19)

72
‘Table C.1, continue’
Group 28 (P17)
Group 29 (P32)
Group 30 (P21)
Group 31 (P111)
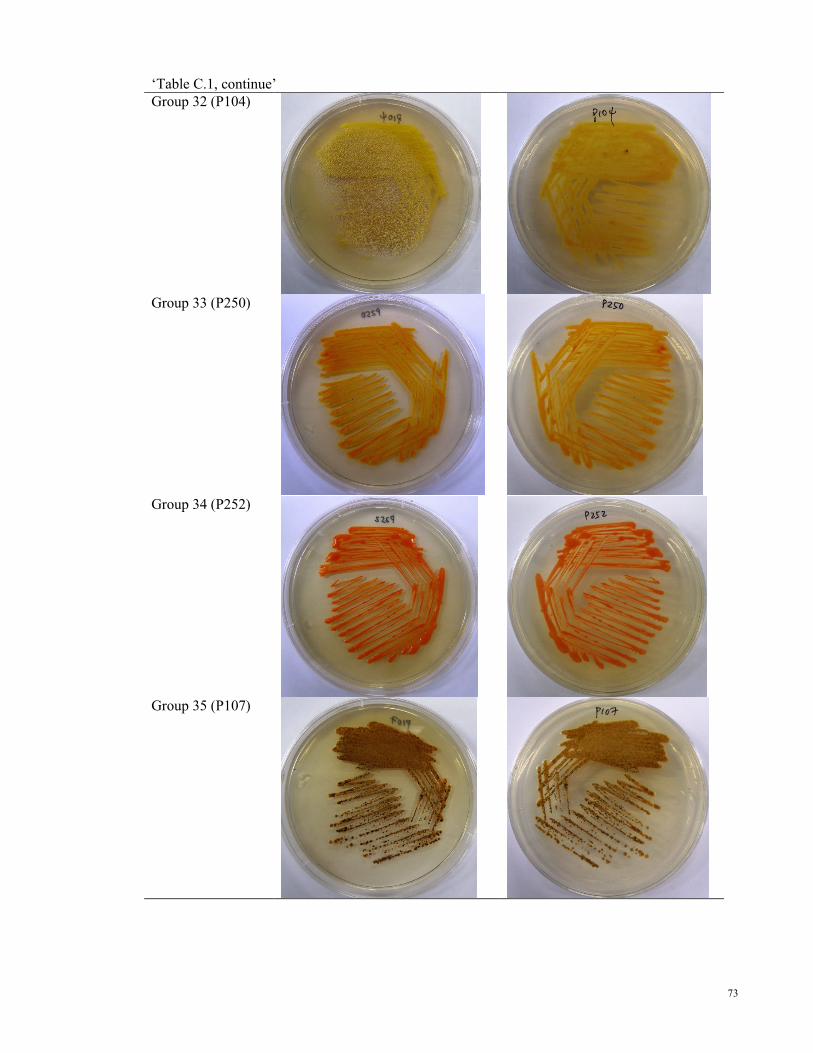
73
‘Table C.1, continue’
Group 32 (P104)
Group 33 (P250)
Group 34 (P252)
Group 35 (P107)
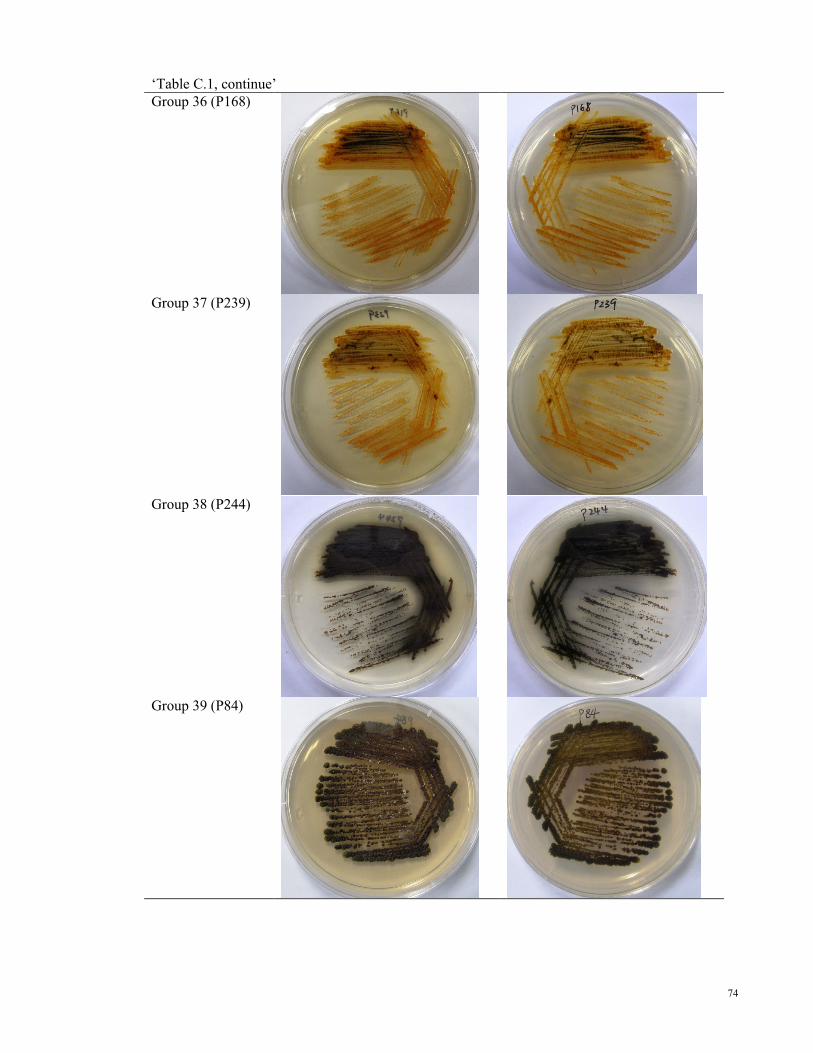
74
‘Table C.1, continue’
Group 36 (P168)
Group 37 (P239)
Group 38 (P244)
Group 39 (P84)

75
‘Table C.1, continue’
Group 40 (P214)
Group 41 (P268)
Group 42 (P169)
Group 43 (P125)

76
‘Table C.1, continue’
Group 44 (P39)
Group 45 (P281)
Group 46 (P278)
Group 47 (P253)
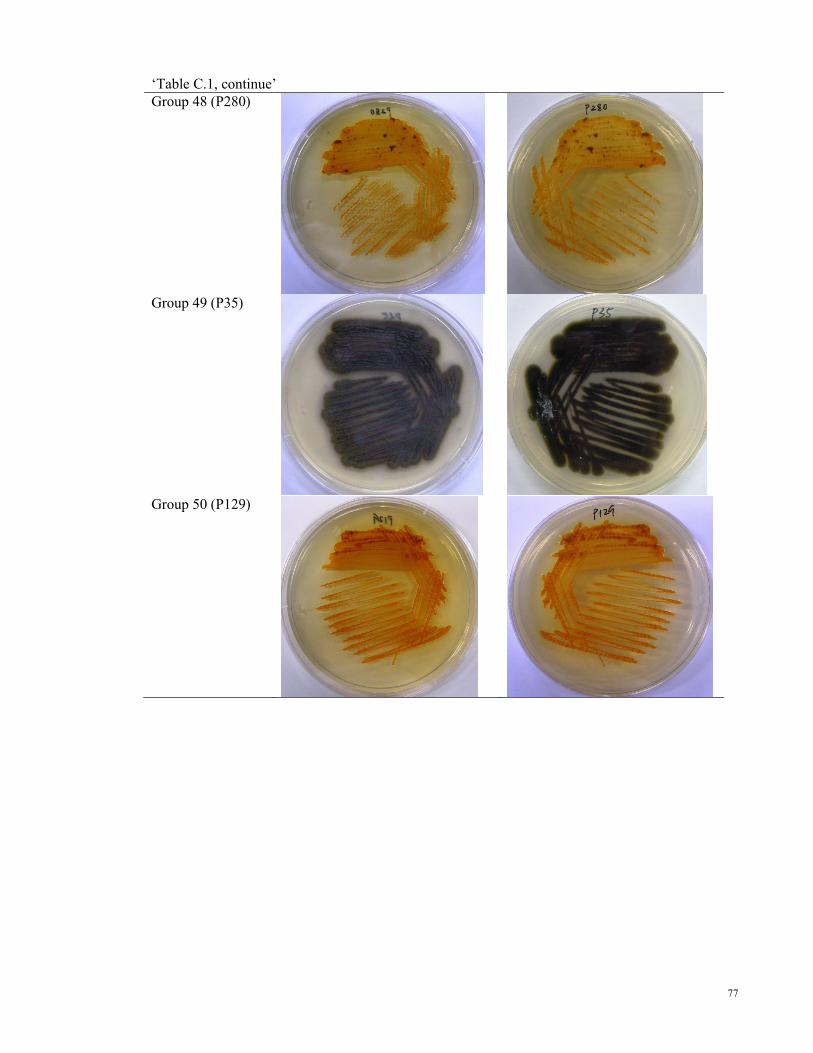
77
‘Table C.1, continue’
Group 48 (P280)
Group 49 (P35)
Group 50 (P129)

78
Appendix D
16S rRNA gene sequences for novel strains
Sequence for strain P86 (KF499320)
CAAGTCGAACGATGAACTGAGAGCTTGCTCTTGGGGATTAGTGGCGAACGGGT
GAGTAACACGTGAGTAACCTGCCCTGGACTCTGGGATAACCCCGAGAAATCGG
AGCTAATACCGGATAGGACCTTGAGCGGCATCGCTTGGGGTGGAAAGTTTTTTC
GGTTTGGGATGGACTCGCGGCCTATCAGCTTGTTGGTGAGGTAATGGCTCACCA
AGGCGTCGACGGGTAGCCGGCCTGAGAGGGTGACCGGCCACACTGGGACTGA
GACACGGCCCAGACTCCTACGGGAGGCAGCAGTGGGGAATATTGCACAATGGG
CGCAAGCCTGATGCAGCAACGCCGCGTGCGGGATGACGGCCTTCGGGTTGTAA
ACCGCTTTTAGTAAGGAAGAAGGGGAGCTTGCTCCTTGACGGTACTTGCAGAA
AAAGGACCGGCTAACTACGTGCCAGCAGCCGCGGTAATACGTAGGGTCCGAGC
GTTGTCCGGAATTATTGGGCGTAAAGAGCTCGTAGGCGGTTTGTCGCGTCTGCT
GTGAAAACTAGAGGCTCAACCTCTAGCCTGCAGTGGGTACGGGCAGACTGGAG
TGCGGTAGGGGAGAATGGAATTCCTGGTGTAGCGGTGGAATGCGCAGATATCA
GGAGGAACACCGATGGCGAAGGCAGTTCTCTGGGCCGTAACTGACGCTGAGGA
GCGAAAGCGTGGGGAGCGAACAGGATTAGATACCCTGGTAGTCCACGCCGTAA
ACGTTGGGCGCTAGATGTGGGGACCTTTCCACGGTTTCCGTGTCGTAGCTAACG
CATTAAGCGCCCCGCCTGGGGAGTACGGCCGCAAGGCTAAAACTCAAAGGAAT
TGACGGGGGCCCGCACAAGCGGCGGAGCATGCGGATTAATTCGATGCAACGCG
AAGAACCTTACCAAGGCTTGACATAACCGAGAACACCGTAGAAATACGGGACT
CTTTGGACACTCGGTTACAGGTGGTGCATGGTTGTCGTCAGCTCGTGTCGTGAG
ATGTTGGGTTAAGTCCCGCAACGAGAGCAACCCTCGTCGCATGTTGCCAGCAC
GTCATGGTGGGAACTCATGTGAGACTGCCGGGGTCAACTCGGAGGAAGGTGGG
GATGACGTCAAATCATCATGCCCCTTATGTCTTGGGCTTCACGCATGCTACAAT
GGCCGGTACAAAGGGCTGCGATGTCGTAAGGCGGAGCGAATCCCAAAAAGCC
GGTGTCAGTTCGGATTGAGGTCTGCAACTCGACCTCATGAAGTCGGAGTCGCTA
GTAATCGCAGATCAGCAACGCTGCGGTGAATACGTTCCCGGGCCTTGTACACA
C C G C C C G T C A A G T C A T G A A A G T C G G T A A C A C C C G A A G C C G
Sequence for strain P224 (KF499321)
GGACTCGAGTGGCGAACGGGTGAGTAACACGTGGGTGATCTGCCCTGCAC
TTTGGGATAAGCCTGGGAAACTGGGTCTAATACCGGATAGGACTACGCAC
TGCATGGTGTGTGGTGGAAAGCTTTTGCGGTGTGGGATGGGCCCGCGGCC
TATCAGCTTGTTGGTGGGGTGATGGCCTACCAAGGCGACGACGGGTAGCC
GGCCTGAGAGGGTGTCCGGCCACACTGGGACTGAGATACGGCCCAGACTC
CTACGGGAGGCAGCAGTGGGGAATATTGCACAATGGGCGCAAGCCTGATG
CAGCGACGCCGCGTGAGGGATGACGGCCTTCGGGTTGTAAACCTCTTTCA
GCATCGACGAAGCGCAAGTGACGGTAGATGCAGAAGAAGCACCGGCCAAC
TACGTGCCAGCAGCCGCGGTAATACGTAGGGTGCGAGCGTTGTCCGGAAT
TACTGGGCGTAAAGAGCTCGTAGGTGGTTTGTCGCGTTGTCCGTGAAAAC
TCACAGCTTAACTGTGGGCGTGCGGGCGATACGGGCAGACTGGAGTACTG
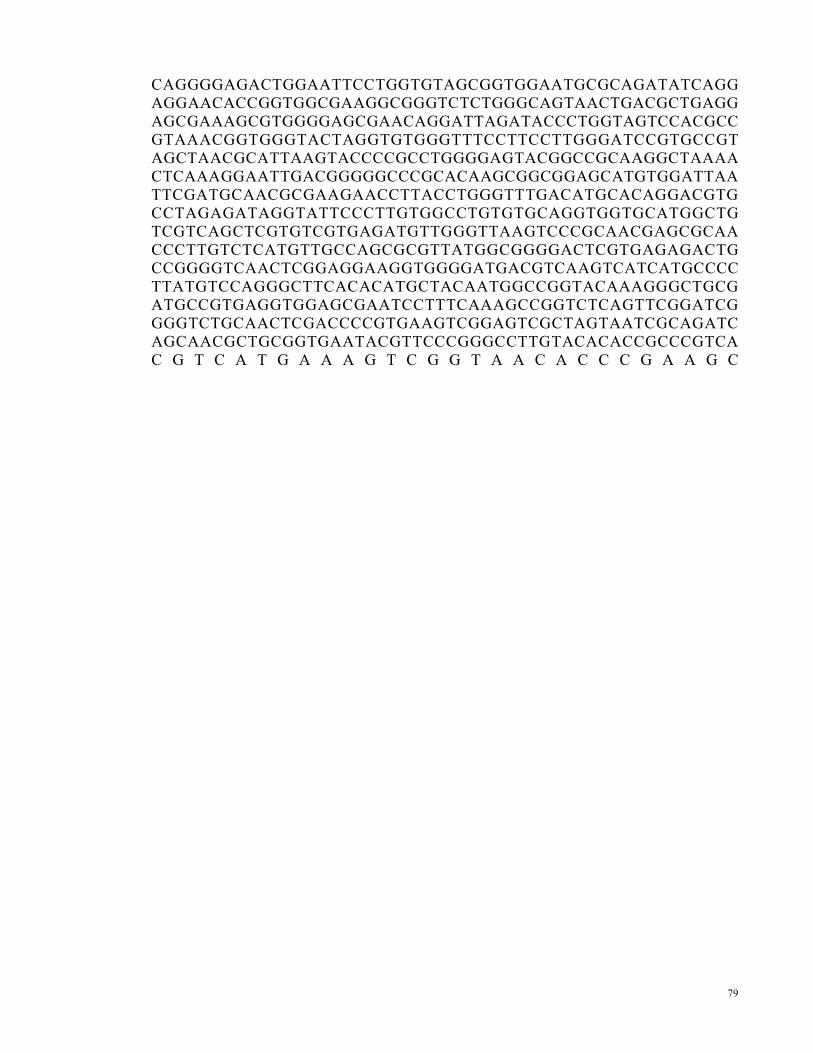
79
CAGGGGAGACTGGAATTCCTGGTGTAGCGGTGGAATGCGCAGATATCAGG
AGGAACACCGGTGGCGAAGGCGGGTCTCTGGGCAGTAACTGACGCTGAGG
AGCGAAAGCGTGGGGAGCGAACAGGATTAGATACCCTGGTAGTCCACGCC
GTAAACGGTGGGTACTAGGTGTGGGTTTCCTTCCTTGGGATCCGTGCCGT
AGCTAACGCATTAAGTACCCCGCCTGGGGAGTACGGCCGCAAGGCTAAAA
CTCAAAGGAATTGACGGGGGCCCGCACAAGCGGCGGAGCATGTGGATTAA
TTCGATGCAACGCGAAGAACCTTACCTGGGTTTGACATGCACAGGACGTG
CCTAGAGATAGGTATTCCCTTGTGGCCTGTGTGCAGGTGGTGCATGGCTG
TCGTCAGCTCGTGTCGTGAGATGTTGGGTTAAGTCCCGCAACGAGCGCAA
CCCTTGTCTCATGTTGCCAGCGCGTTATGGCGGGGACTCGTGAGAGACTG
CCGGGGTCAACTCGGAGGAAGGTGGGGATGACGTCAAGTCATCATGCCCC
TTATGTCCAGGGCTTCACACATGCTACAATGGCCGGTACAAAGGGCTGCG
ATGCCGTGAGGTGGAGCGAATCCTTTCAAAGCCGGTCTCAGTTCGGATCG
GGGTCTGCAACTCGACCCCGTGAAGTCGGAGTCGCTAGTAATCGCAGATC
AGCAACGCTGCGGTGAATACGTTCCCGGGCCTTGTACACACCGCCCGTCA
C G T C A T G A A A G T C G G T A A C A C C C G A A G C

80
Appendix E
National Bureau of Standard Colour Name Chart

81

82
References
Akoh, C. C., Lee, G. C., Liaw, Y. C., Huang, T. H. & Shaw, J. F. (2004). Gdsl family of
serine esterases/lipases. Progress in lipid research 43, 534-552.
Aoki, K., Ohtsuka, K., Shinke, R. & Nishira, H. (1983). Isolation of aniline-assimilation
bacteria and physiological characterization of aniline biodegradation in Rhodococcus
erythropolis an-13. Agricultural and biological chemistry 47, 2569-2575.
Arai, T., Kuroda, S. & Watanabe, I. (1981). Biodegradation of acrylamide monomer by a
Rhodococcus strain. Actinomycetes, Schaal, KP und Pulverer, G(Eds), Gustav Fischer
Verlag, Stuttgart, New York, 297-307.
Arnaudi, C. (1954). Researches on the microbiological degradation of sterols. Applied
microbiology 2, 274.
Bendinger, B., Kroppenstedt, R., Runaarts, H., Gent, H. V. L. & Oberthur, R. (1990).
Studies on the microbiology and the degradation capacities of a biofilter. In Biotechnology
Conference, pp. 529-533.
Bradner, J. R., Gillings, M. & Nevalainen, K. M. H. (1999). Qualitative assessment of
hydrolytic activities in antarctic microfungi grown at different temperatures on solid media.
World Journal of Microbiology and Biotechnology 15, 131-132.
Cappuccino, J. G. (2005). Microbiology: A laboratory manual:
Pearson/Benjamin/Cummings.
Cech, J. S., Hartman, P., Slosarek, M. & Chudoba, J. (1988). Isolation and
identification of a morpholine-degrading bacterium. Applied and Environmental
Microbiology 54, 619-621.
83
Chomchoei, A., Pathom-aree, W., Yokota, A., Kanongnuch, C. & Lumyong, S. (2011).
Amycolatopsis thailandensis sp. nov., a poly(l-lactic acid)-degrading actinomycete, isolated
from soil. International Journal of Systematic and Evolutionary Microbiology 61, 839-843.
Chun, J., Lee, J.-H., Jung, Y., Kim, M., Kim, S., Kim, B. K. & Lim, Y. W. (2007).
Eztaxon: A web-based tool for the identification of prokaryotes based on 16s ribosomal rna
gene sequences. International Journal of Systematic and Evolutionary Microbiology 57,
2259-2261.
Cross, T., Rowbotham, T. J., Mishustin, E. N., Tepper, E. Z., Antoine-Portaels, F.,
Schaal, K. P. & Bickenbach, H. (1976). The ecology of nocardioform actinomycetes. The
Biology of the Nocardiae London: Acad Pr p, 337-371.
Demirbas, A. (2007). Biodegradable plastics from renewable resources. Energy Sources,
Part A 29, 419-424.
Eggeling, L. & Sahm, H. (1980). Degradation of coniferyl alcohol and other lignin-related
aromatic compounds by Nocardia sp. Dsm 1069. Archives of Microbiology 126, 141-148.
Eggeling, L. & Sahm, H. (1981). Degradation of lignin-related aromatic compounds by
Nocardia sp. Dsm 1069 and specificity of demethylation. Zentralbl Bakteriol Mikrobiol
Hyg Abt 1, 361-366.
Erikson, D. (1940). Studies on some lake-mud strains of Micromonospora. Journal of
Bacteriology, 277-300.
Gianfreda, L., Mora, M. L. & Diez, M. C. (2006). Restoration of polluted soils by means
of microbial and enzymatic processes. Revista de la ciencia del suelo y nutricivegetal 6, 20-
40.

84
Gross, R. A. & Kalra, B. (2002). Biodegradable polymers for the environment. Science
297, 803.
Gruber, P. R., Hall, E. S., Kolstad, J. J., Iwen, M. L., Benson, R. D. & Borchardt, R. L.
(1992). Continuous process for manufacture of lactide polymers with controlled optical
purity. In: Google Patents.
Gruber, P. R., Hall, E. S., Kolstad, J. J., Iwen, M. L., Benson, R. D. & Borchardt, R. L.
(1993). Continuous process for the manufacture of a purified lactide from esters of lactic
acid. In: Google Patents.
Gruber, P. R., Hall, E. S., Kolstad, J. J., Iwen, M. L., Benson, R. D. & Borchardt, R. L.
(1994). Continuous process for manufacture of lactide polymers with purification by
distillation. In: Google Patents.
Guerin, W. F. & Jones, G. E. (1988). Mineralization of phenanthrene by a
Mycobacterium sp. Applied and Environmental Microbiology 54, 937-944.
Hammer, Ø., Harper, D. A. T. & Ryan, P. D. (2001). Past: Paleontological statistics
software package for education and data analysis. Palaeontologia Electronica 4, 9.
Heitkamp, M. A., Franklin, W. & Cerniglia, C. E. (1988). Microbial metabolism of
polycyclic aromatic hydrocarbons: Isolation and characterization of a pyrene-degrading
bacterium. Applied and Environmental Microbiology 54, 2549-2555.
Heitkamp, M. A., Freeman, J. P., Miller, D. W. & Cerniglia, C. E. (1988). Pyrene
degradation by a Mycobacterium sp.: Identification of ring oxidation and ring fission
products. Applied and Environmental Microbiology 54, 2556-2565.
Jarerat, A. & Tokiwa, Y. (2003). Poly(l-lactide) degradation by Saccharothrix
waywayandensis. Biotechnology Letters 25, 401-404.

85
Jarerat, A., Tokiwa, Y. & Tanaka, H. (2003). Poly (l-lactide) degradation by
Kibdelosporangium aridum. Biotechnology Letters 25, 2035-2038.
Jones, R. J. & Jenkins, D. E. (1965). Mycobacteria isolated from soil. Canadian Journal
of Microbiology 11, 127-133.
Kato, N., Miyamoto, N., Shimao, M. & Sakazawa, C. (1988). 3-hexulose phosphate
synthase from a new facultative methylotroph, Mycobacterium gastri mb19 (microbiology
& fermentation industry). Agricultural and biological chemistry 52, 2659-2661.
Kawase, T., Saito, A., Sato, T., Kanai, R., Fujii, T., Nikaidou, N., Miyashita, K. &
Watanabe, T. (2004). Distribution and phylogenetic analysis of family 19 chitinases in
actinobacteria. Applied and Environmental Microbiology 70, 1135.
Kesseler, M., Dabbs, E. R., Averhoff, B. & Gottschalk, G. (1996). Studies on the
isopropylbenzene 2, 3-dioxygenase and the 3-isopropylcatechol 2, 3-dioxygenase genes
encoded by the linear plasmid of Rhodococcus erythropolis bd2. Microbiology 142, 3241-
3251.
Kim, T. K., Hewavitharana, A. K., Shaw, P. N. & Fuerst, J. A. (2006). Discovery of a
new source of rifamycin antibiotics in marine sponge actinobacteria by phylogenetic
prediction. Applied and Environmental Microbiology 72, 2118.
Konkit, M., Jarerat, A., Kanongnuch, C., Lumyong, S. & Pathom-aree, W. (2012).
Poly(lactide) degradation by Pseudonocardia alni as4.1531t. Chiang Mai Journal of
Science 39, 128-132.
Laemmli, U. K. (1970). Cleavage of structural proteins during the assembly of the head of
bacteriophage t4. Nature 227, 680-685.
86
Lechevalier, M. P. & Lechevalier, H. A. (1980). The chemotaxonomy of actinomycetes. .
In Actinomycete taxonomy, pp. 227-291. Edited by Dietz and D. W. Thayer: Arlington, Va:
Society for Industrial Microbiology.
Li, F., Wang, S., Liu, W. & Chen, G. (2008). Purification and characterization of poly(l-
lactic acid)-degrading enzymes from Amycolatopsis orientalis ssp. Orientalis. FEMS
microbiology letters 282, 52-58.
Marques, A. S. A., Marchaison, A., Gardan, L. & Samson, R. (2008). Box-PCR-based
identification of bacterial species belonging to Pseudomonas syringae - P. Viridiflava
group. Genetic and Molecular Biology 31, 106-115.
Matsumura, S. (2008). Enzymatic depolymerization process of polylactic acid, and
producing process of polylactic acid using depolymerization product. In: Google Patents.
McCarthy, A. J. (1987). Lignocellulose-degrading actinomycetes. FEMS microbiology
letters 46, 145-163.
McCarthy, A. J. & Broda, P. (1984). Screening for lignin-degrading actinomycetes and
characterization of their activity against [14
c]lignin-labelled wheat lignocellulose. Journal
of General Microbiology 130, 2905-2913.
Nagy, I., Compernolle, F., Ghys, K., Vanderleyden, J. & De Mot, R. (1995). A single
cytochrome p-450 system is involved in degradation of the herbicides eptc (s-ethyl
dipropylthiocarbamate) and atrazine by Rhodococcus sp. Strain ni86/21. Applied and
Environmental Microbiology 61, 2056-2060.
Nakajima, T. & Shigeno, Y. (2006). Novel polyester plastic-degrading microorganism,
polyester plastic-degrading enzyme and polynucleotide encoding the enzyme. In: WO
Patent WO/2006/078,011.
87
Nakamura, K., Tomita, T., Abe, N. & Kamio, Y. (2001). Purification and
characterization of an extracellular poly(l-lactic acid) depolymerase from a soil isolate,
Amycolatopsis sp. Strain k104-1. Applied and Environmental Microbiology 67, 345-353.
Nampoothiri, K. M., Nair, N. R. & John, R. P. (2010). An overview of the recent
developments in polylactide (PLA) research. Bioresource Technology 101, 8493-8501.
Nesterenko, O. A., Kasumova, S. A. & Kvasnikov, E. I. (1978). Microorganisms of the
genus Nocardia and the "rhodochrous" group in the soils of the ukrainian ssr.
Mikrobiologiia 47, 866.
Pranamuda, H. & Tokiwa, Y. (1999). Degradation of poly(l-lactide) by strains belonging
to genus Amycolatopsis. Biotechnol Lett 21, 901-905.
Pranamuda, H., Tokiwa, Y. & Tanaka, H. (1997). Polylactide degradation by an
Amycolatopsis sp. Applied and Environmental Microbiology 63, 1637.
Pranamuda, H., Tsuchii, A. & Tokiwa, Y. (2001). Poly (l lactide) degrading enzyme
produced by Amycolatopsis sp. Macromolecular Bioscience 1, 25-29.
Rast, H. G., Engelhardt, G., Ziegler, W. & Walln 枚枚枚枚 fer, P. R. (1980). Bacterial
degradation of model compounds for lignin and chlorophenol derived lignin bound residues.
FEMS microbiology letters 8, 259-263.
Raymond, R. L., Jamison, V. M. & Hudson, J. O. (1971). Hydrocarbon cooxidation in
microbial systems. Lipids 6, 453-457.
Sangwan, P. & Wu, D. Y. (2008). New insights into polylactide biodegradation from
molecular ecological techniques. Macromolecular Bioscience 8, 304-315.

88
Shirling, E. t. & Gottlieb, D. (1966). Methods for characterization of Streptomyces species.
International Journal of Systematic Bacteriology 16, 313-340.
Straube, G., Hensel, J., Niedan, C. & Straube, E. (1990). Kinetic studies of phenol
degradation by Rhodococcus sp. P1 i. Batch cultivation. Antonie van Leeuwenhoek 57, 29-
32.
Sukkhum, S., Tokuyama, S. & Kitpreechavanich, V. (2009). Development of
fermentation process for PLA-degrading enzyme production by a new thermophilic
Actinomadura sp. T16-1. Biotechnol Bioprocess Eng 14, 302-306.
Sukkhum, S., Tokuyama, S., Tamura, T. & Kitpreechavanich, V. (2009). A novel poly
(L-lactide) degrading actinomycetes isolated from thai forest soil, phylogenic relationship
and the enzyme characterization. The Journal of general and applied microbiology 55, 459-
467.
Tamura, K., Dudley, J., Nei, M. & Kumar, S. (2007). Mega4: Molecular evolutionary
genetics analysis (mega) software version 4.0. Molecular Biology and Evolution 24, 1596-
1599.
Tan, G. Y. A., Ward, A. C. & Goodfellow, M. (2006). Exploration of Amycolatopsis
diversity in soil using genus-specific primers and novel selective media. Systematic and
applied microbiology 29, 557-569.
Tarnok, I. (1976). Metabolism in Nocardiae and related bacteria. The Biology of the
nocardiae, 451-500.
Teeraphatpornchai, T., Nakajima-Kambe, T., Shigeno-Akutsu, Y., Nakayama, M.,
Nomura, N., Nakahara, T. & Uchiyama, H. (2003). Isolation and characterization of a

89
bacterium that degrades various polyester-based biodegradable plastics. Biotechnology
Letters 25, 23-28.
Tokiwa, Y. & Jarerat, A. (2004). Biodegradation of poly(L-lactide). Biotechnology
Letters 26, 771-777.
Tokiwa, Y., Konno, M. & Nishida, H. (1999). Isolation of silk degrading microorganisms
and its poly (L-lactide) degradability. Chemistry Letters, 355-356.
Tomita, K., Nakajima, T., Kikuchi, Y. & Miwa, N. (2004). Degradation of poly(L-lactic
acid) by a newly isolated thermophile. Polymer Degradation and Stability 84, 433-438.
Toutain-Kidd, C. M., Kadivar, S. C., Bramante, C. T., Bobin, S. A. & Zegans, M. E.
(2009). Polysorbate 80 inhibition of Pseudomonas aeruginosa biofilm formation and its
cleavage by the secreted lipase lipa. Actinomicrobial Agents and Chemotherapy 53, 136-
145.
Tsuji, H. & Miyauchi, S. (2001). Enzymatic hydrolysis of poly(lactide)s: Effects of
molecular weight, L-lactide content, and enantiomeric and diastereoisomeric polymer
blending. Biomacromolecules 2, 597-604.
Urakami, T. & Yano, I. (1989). Methanol-utilizing mycobacterium strains isolated from
soil. Journal of General and Applied Microbiology 35, 125-133.
Wang, G. & Li, A. (2008). Thermal decomposition and kinetics of mixtures of polylactic
acid and biomass during copyrolysis. Chinese Journal of Chemical Engineering 16, 929-
933.
Wenk, M. R. & Fernandis, A. Z. (2007). A manual for biochemistry protocols: World
Scientific Publishing Company Incorporated.