isobaric vapor-liquid equilibria for methyl esters + butan-2-ol at different pressures
TRANSCRIPT

RlllM[ [OglUgRlil
ELSEVI E R Fluid Phase Equilibria 118 (1996) 249-270
Isobaric vapor-liquid equilibria for methyl esters + butan-2-ol at different pressures
Juan Or tega *, Pab lo H e r n a n d e z
Laboratorio de Termodindmica y Fisicoqufmica, Escuela Superior de lngenieros lndustriales, 3507 I-University of Las Palmas de G.C., Spain
Received 10 May 1995; accepted 5 July 1995
Abstract
Vapor-liquid measurements for the mixtures of three methyl esters (ethanoate, propanoate, butanoate) and butan-2-ol were obtained at 74.66, 101.32 and 127.99 kPa in a small capacity still. All systems were found to be thermodynamically consistent and the maximum likelihood principle was chosen as the regression technique to determine the parameters of different available equations. Only the mixture methyl butanoate + butan-2-ol presented a minimum azeotrope which shifted toward concentrations richer in alcohol as working pressure increased. Experimental results were compared with prediction by UNIFAC and ASOG methods.
Keywords: Experiments; VLE Data; Esters; Butan-2-ol
1. I n t r o d u c t i o n
There are a number of reasons for collecting VLE data at pressures other than atmospheric. Not only are such values of interest in engineering applications, there is also a need for observations on changes in mixture behavior with pressure, particularly the presence of singular points, which are relevant; for purification methods, and on effects of these intensive magnitudes in the theoretical analysis of solutions.
Therefore, this paper is part of an ongoing research project into the behavior of isobaric vapor- l iquid equilibria (VLE) in binary mixtures of alkyl esters and alcohols at our laboratory (Ortega et al., 1986; Ortega et al., 1987). Research analyzing the VLEs for the lowest methyl esters with normal and isomeric alcohols at different pressures have been undertaken with a view to systematizing that study (Ortega et al., 1990a; Ortega and Susial, 1990a; Ortega and Susial, 1993).
* Corresponding author.
0378-3812/96/$15.00 © 1996 Elsevier Science B.V. All rights reserved SSDI 0378-3812(95)02821-8

250 J. Ortega, P. Hernandez / Fluid Phase Equilibria 118 (1996) 249-270
However, within the framework of the project, it has been considered both necessary and appropriate to report new values for systems containing isomeric alcohols, for which there are insufficient literature values at the present time. Thus, extending the range of working pressures contemplated in previous research, VLE values have now been determined experimentally for binary mixtures consisting of three methyl esters (ethanoate, propanoate, butanoate) and butan-2-ol at pressures of 74.66, 101.32, and 127.99 kPa. No VLE values for these systems have been found in the literature consulted. However, Horsley (1973) proposed an azeotrope for the mixture (methyl butanoate + butan-2-ol) at atmospheric pressure for the conditions Taz < 370.85 K and Xeste r > 0.335.
Besides reporting new experimental values, this paper also presents the results of correlations employed for those magnitudes measured by direct experimentation and those calculated indirectly from the experimental measurements. Furthermore, the experimental values have been compared with the predictions calculated using the ASOG model (Kojima and Tochigi, 1979) and two versions of the UNIFAC model, UNIFAC-1 (Fredenslund et al., 1975) and UNIFAC-2 (Larsen et al., 1987; Weidlich and Gmehling, 1987).
2. Experimental
2.1. Materials
The components used in the experiment were supplied by Fluka and were the highest commercial grade. The most relevant physical properties of the methyl esters used in this study, p, n(D, 298.15 K), and Tb, ~, did not differ greatly from the values reported earlier (Susial et al., 1989, Susial and Ortega, 1995; Ortega and Susial, 1991). The following experimental values were obtained for butan-2-ol at the temperature 298.15 K: p / ( k g m -3) = 802.29, 802.6 (Riddick et al., 1986), 802.3 (TRC, 1991); n(D) = 1.3949, 1.395 (Riddick et al., 1986), 1.3949 (TRC, 1991); Tb, 2 = 372.36 K, 372.65 (TRC, 1991), 372.66 K (Ambrose and Sprake, 1970), 372.7 (Reid et al., 1977; Riddick et al., 1986).
2.2. Apparatus and procedure
The experimental equilibrium still was a dynamic still in which both phases were refluxed. The still and the auxiliary fittings and equipment necessary for isobaric operation have been described in previous papers (Ortega et al., 1986; Ortega and Susial, 1993). The concentrations of the liquid and vapor phases were measured using an Anton Parr model DMA-55 vibrating-tube digital densimeter to a precision of +0.02 kg m -3, previously calibrated using water and n-nonane. Densities for the binary systems studied {x1CuH2u+jCOOCH3(u = 1, 2, 3)+xzCH3CH2CH(OH)CH~} at (298.15 ___ 0.01) K were validated by verifying the uniform distribution of excess volumes, V E, on methyl ester concentration. The resulting correlations, p = p(x~), were used to determine the equilibrium liquid and vapor concentrations, to a precision of ___ 0.002 units for the liquid phase and somewhat higher, +0.004, for the vapor phase. Comparing the concentrations of both phases calculated using V E = VE(xl) and p = p(xj) did not yield any significant differences.

J. Ortega. P. Hernandez/Fluid Phase Equilibria 118 (/9961249-270 251
3. Results
3.1. Densit ies and excess volumes
The densities, p, and excess volumes, V E, for each of the binary mixtures {x~ a methyl ester + x 2 butan-2-ol} were determined before calculating the equilibrium compositions, x~ and y~. The values
Table 1 Excess volumes for the binary mixtures methyl esters(I)+ butan-2-ol(2) at 298.15 K
xl P 109 V E x I P l0 ~) V E (kgm 3) (m 3 mo1-1) ( k g m - 3 ) (m 3 mol i)
xICH .~COOCH 3 + x2CH.~CH(OH)CH2CH 3 0.0000 802.29 0.0 0.6099 866.66 715.5 0.0238 804.11 74.6 0.6565 873.16 652.9 0.0984 810.63 260.0 0.7512 886.32 571.0 0.1532 815.24 423.9 0.8405 899.97 413.6 0.1890 818.66 490.0 0.8728 905.23 337.2 0.2704 826.90 599.3 0.8992 909.57 275.0 0.3426 834.40 691.5 0.9323 915.08 195.9 0.4259 843.57 762.4 0.9729 922.01 92.8 0.5249 855.58 760.7 1.0000 926.97 0.0 xIC2HsCOOCH 3 + x2CH3CH(OH)CH2CH 3 0.00(X) 802.29 0.0 0.4649 847.80 583.8 0.0433 806.18 92.2 0.5221 853.90 582. I 0.0782 809.38 169.9 0.5584 857.81 573.7 0. I 148 812.82 241.0 0.5944 861.65 569.4 0.1300 814.15 280.9 0.6065 867.48 530.2 0.2042 821.34 391.2 0.6828 871.50 505.0 0.2239 823.22 422.1 0.7266 876.50 457.0 0.2364 824.50 432.2 0.7668 881.00 422.0 0.2673 827.38 487.9 0.7913 883.86 386.7 0.3319 834.10 518.9 0.8545 891.01 317.8 0.3700 838.03 539.1 0.8930 895.73 234.7 0.3747 838.52 541.8 0.9392 901.33 140.7 (I.4117 842.24 569.4 0.9705 905.18 70.5 0.4560 846.84 585.2 1.0000 908.84 0.0 x iC 3 H v COOCH 3 + x2CH 3 CH(OH)CH 2 CH 3 0.0000 802.29 0.0 0.5001 847.79 522.5 0.0328 805.16 73.5 0.5458 852.00 502.8 0.0756 809.28 136.5 0.6414 860.42 480.1 0.0911 810.45 194.3 0.7072 866.31 429.5 0.1249 813.72 232.9 0.8309 877.21 304.3 0.1620 816.95 309.8 0.8624 879.94 268.6 0.2306 823.30 387.7 0.9015 883.41 206.9 0.3268 832.07 473.3 0.9636 889.07 79.5 0.3842 837.30 503.0 1.0000 892.35 0.0

252 J. Ortega, P. Hernandez / Fluid Phase Equilibria 118 (1996) 249-270
Table 2 Coefficients A i and k obtained using Eq. (1) and standard deviations, s(V z), for the mixtures of methyl esters(I)+ butan-2- o1(2) Mixture k A 0 A t A 2 109 s(V z ) / ( m 3 mo l - 1 )
x 2 butan-2-ol + x Methyl ethanoate 0.067 3620.2 - 595.1 - 8.8 Methyl propanoate 0.133 2494.7 - 161.9 - 9.6 Methyl butanoate 2.559 2278.5 - 1116.8 1467.7 8.5
of these magnitudes are set out in Table 1. Table 2 presents the values for the coefficients k and A i in Eq. (1) used to correlate the (x~, V E) data for each system.
Q= XlX2 Y'.Ai[ x , / ( x, + k x 2 ) ] i w h e r e Q = V E / ( m 3 m o l - ' )
i
(1)
Fig. 1 plots the experimental values and the fitted curves for the three mixtures considered in this study. The V E values were positive in all cases, although the expansion effects decreased regularly with methyl ester chain length due to the weakening of the polar forces that occurs in this type of compound, as already reported in previous papers for similar mixtures. The regular distribution of the
800
600
Y
200
o
o xlmethyl ethan°ate+xzbutan-2-°l 1 • xffnethyl propanoate+xzbutan-2-ol v xlrnethyl butanoate+x2butan-2-ol
0.2 0.4 0.6 0.8 xl
Fig. 1. Excess molar volumes at 298.15 K for the mixtures (x~ methyl esters + x 2 butan-2-ol).

J. Ortega, P. Hernandez / Fluid Phase Equilibria 118 ~ 1996) 249-270 253
Table 3 Experimental vapor pressures for butan-2-ol
T (K) p0 (kPa) T (K) pi ° (kPa) 7" (K) p~) (kPa)
348.12 38.24 367.52 85.07 376.98 120.58 350.18 41.94 368.57 88.53 377.60 123.19 352.41 46.21 369.28 90.94 378.26 126.14 354.03 49.50 370.80 96.27 378.56 127.99 355,73 53.18 371.73 99.70 378.89 129.00 358,25 59.02 372.36 101.32 379.46 131.54 359,84 62.97 372.44 102.30 380.03 134.22 361,38 66.99 373.08 104.67 380.63 136.96 362.62 70.29 373.69 107.03 381.19 139.66 363.93 74.02 374.20 109.7(I 381.26 140.07 364.12 74.53 374.92 111.98 365.58 78.94 375.54 114.52 366.45 81.65 376.24 117.38
(x~, V >~) data points is indicative of good density values, and consequently, as stated above, there were no discrepancies between the estimates of the equilibrium concentrations calculated from the density values or those calculated from the excess volume values.
3.2. Vapor pressures
The influence of vapor pressures on the thermodynamic treatment of VLE data is well known. Therefore, new experimental (T, pO) values for butan-2-ol were obtained using the same equilibrium still for a range of temperatures approaching the boiling points of the pure components at the working pressures used. The values thus obtained were then correlated using a method of non-linear regression employing the classic Antoine equation. New values had already been published for methyl esters (Ortega and Susial, 1990b; Ortega and Susial, 1990a; Ortega et al., 1990b). Table 3 contains the
Table 4 Coefficients A, B, C used in this work along to the standard deviations, s(pi°), for butan-2-ol in the Antoine equation: log(pi°/kPa) = A - B / [ T / K + C]
Mixture A B C s(p0) Ref. (kPa)
Methyl ethanoate Methyl propanoate Methyl butanoate Butan-2-ol
6.49340 1329.46 - 33.52 6.58882 1469.36 - 30.99 6.30360 1381.64 - 53.60 6.31286 1159.84 - 102.90 6.59921 1314.19 - 86.60 6.32621 1159.00 - 104.87 6.26852 1126.67 - 108.36
0.04
Ortega and Susial (1990b) Ortega and Susial (1990a) Ortega et al. (1990b) This work TRC (1991) Boublik et al. (1973) Ambrose and Sprake (1970)

254 J. Ortega, P. Hernandez / Fluid Phase Equilibria 118 (1996) 249-270
[ • - - 1 ¸
°#. I
~ 2 .
- 3 320
Boublick et aL (1973)
. 9 9 . "-.-..~".£...
2.5,¢" 7 " " . .
T/K
Fig. 2. Representation of differences, 6p~, between the curves obtained by Antoine equation using the parameters from literature o o The dashed line (- - .) corresponds to a difference of 2.5% with respect to Pi,lit and those determined by us, Pi,exp" the Antoine equation obtained with our experimental results.
experimental vapor pressures while Table 4 shows the constants A, B, and C used to correlate the data with the Antoine equation. Fig. 2 graphically represents the differences in the vapor pressure curves obtained using the Antoine equation for a given temperature range, along with the constants for butan-2-ol calculated in this study and the literature values (Ambrose and Sprake, 1970; Boublik et al., 1973; TRC, 1991). The figure shows that the differences in the curves plotted by Ambrose and Sprake (1970), Boublik et al. (1973), and TRC (1991) were small and though they increased slightly with temperature over a given range, they were in all cases less than 3%.
3.3. Equilibrium data and correlations
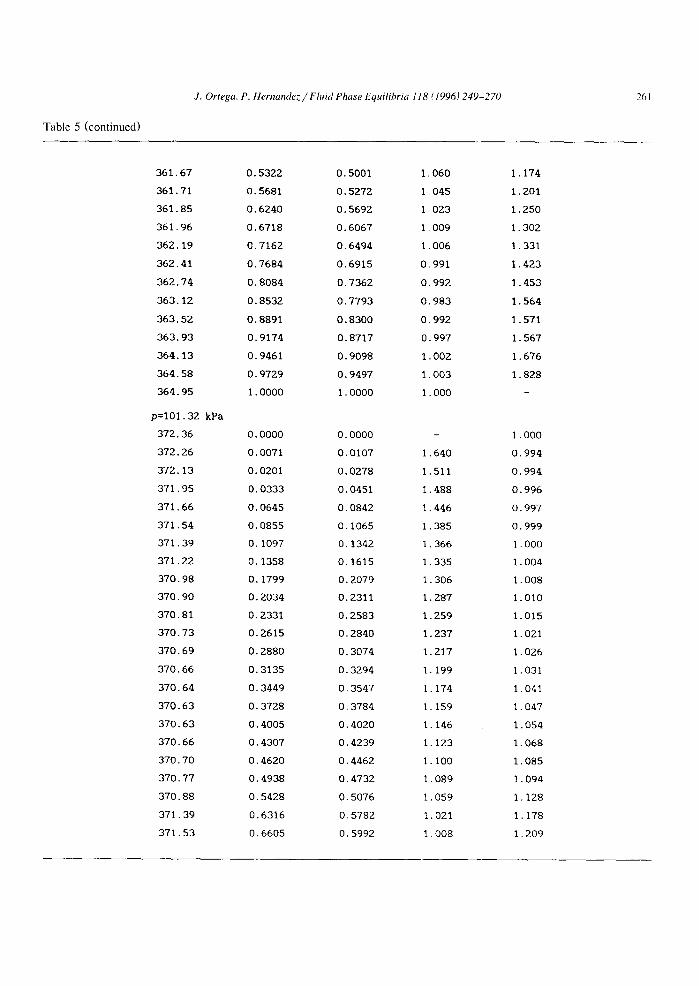
The p, T, x~, y~ values compiled by direct experimentation at the different working pressures (74.66, 101.32, 127.99) + 0.02 kPa and the corresponding values of y~ and "/2 for all three binary systems are listed in Table 5. Fig. 3(a)-3(c) shows the representation of (y~ - x Z) on xl and T on x~ and y~ for all cases. The activity coefficients for the mixtures characterized by { xlC ~H 2~ + 1COOCH 3( u = 1,2,3 ) + x2CH 3CH 2CH(OH)CH 3} were calculated using
"Yi = [fbiYiP/( xi 05i°P°)] exp[( pO_ p)viL/RT] (2)
taking the vapor phase to be non-ideal and calculating the fugacity coefficients, ~b~ and qSi ° by means of:
exp[(2 i yi j yiyj ij) JRT]

J. Ortega, P. Hernandez / Fluid Phase Equilibria 118 11996) 249-270 255
where the molar volumes, Vi L, for the pure components and their variations with temperature were assessed using a modified version of Rackett's equation (see Spencer and Danner, 1972). The values of the virial coefficients, B~j, in the equation of state, truncated at the second term, were calculated
Table 5 Experimental data for the mixtures (x t methyl esters + x 2 butan-2-ol) at different working pressures
T x I Yl ~* ~2
xICH3COOCH3+x2CH3CH(OH)CH2CH3
p=74.66 kPa
364.04 0.0000 0.0000 - 1.000
362.19 0,0144 0.0787 1.553 1.007
361.16 0.0231 0.1213 1.533 1.008
358.52 0.0485 0.2344 1,514 0,999
355.40 0.0789 0.3464 1.498 0.999
353.80 0,0959 0.3971 1,477 1.002
352.56 0.1098 0.4369 1.468 1.000
351.13 0.1255 0.4778 1.464 1.002
350.12 0.1369 0.5049 1.460 1,005
349.06 0.1532 0.5341 1.423 1.008
347.43 0.1732 0.5740 1.419 1.013
346.10 0.1923 0.6055 1.402 1.018
344.55 0.2145 0.6397 1.391 1.024
343.30 0.2367 0.6697 1.370 1.021
341.00 0.2764 0.7157 1.345 1.029
339,22 0.3144 0.7500 1.310 1.037
337,34 0.3533 0.7800 1.286 1.057
336.26 0.3794 0.7977 1,267 1.066
335.37 0.4047 0.8118 1.244 1.079
334.50 0.4300 0.8257 1.225 1.088
332.80 0,4838 0.8517 1.187 1,111
331.00 0,5491 0.8765 1.142 1.158
329.63 0.5899 0.8934 1.134 1.178
328.37 0.6462 0.9090 1.099 1.242
326,97 0.7095 0.9236 1.067 1.365
325.49 0.7692 0.9407 1.054 1.441
324.23 0.8171 0.9546 1.052 1.488
323.38 0.8730 0.9668 1.027 1.639
322.53 0.9169 0.9776 1.019 1,770

256
Table 5 (continued)
J. Ortega, P. Hernandez / Fluid Phase Equilibria 118 (1996) 249-270
321.90 0.9526 0.9867 1.013 1.906
321.12 1.0000 1.0000 1.000
p=101.32 kPa
372.36 0.0000 0.0000 1.000
369.82 0.0203 0.0987 1.528 1.001
369.20 0.0260 0.1220 1.498 1.002
366.39 0.0561 0.2347 1.433 0.999
360 ,10 0 .1313 0 .4463 1.372 0 .997
358 .20 0 .1564 0 .4980 1.352 1 .003
356 .58 0 .1805 0 ,5437 1.337 1,001
355 .07 0 .2029 0 ,5813 1.326 1 .003
352 .40 0 .2444 0 .6405 1.307 1 .014
351.11 0 .2679 0 .6693 1.292 1 .016
349 .48 0 .2968 0.6991 1.277 1.031
348 .33 0 .3205 0 .7210 1.261 1 ,039
347 .28 0 .3430 0.7401 1.247 1 .047
346 .30 0 .3669 0 .7577 1.228 1 .057
344 .98 0 .4023 0 .7817 1.202 1,069
344 .35 0 .4232 0 .7918 1.179 1 .087
342 .95 0 .4623 0 .8149 1.159 1 .103
341 .53 0 .5129 0 .8375 1.121 1 .140
338 .52 0 .6119 0.8811 1,085 1 .202
337 .27 0 .6738 0 .8967 1.043 1 .318
335 .16 0 .7601 0 .9257 1.021 1 .425
333 .89 0 .8066 0 .9416 1.019 1 .477
332.81 0 .8573 0 .9563 1.009 1 .579
331.90 0.8988 0.9695 1.005 1.626
330.92 0.9423 0.9829 1.004 1.678
330.34 0.9699 0.9908 1.002 1.782
329.81 1 .0000 1.0000 1.000
p=127 .99 kPa
378 .56 0 .0000 0 .0000 1 .000
377 .19 0 .0152 0 .0670 1.452 0 .996
375 .95 0 .0304 0 .1135 1.266 1.002
374 .83 0.0461 0 .1615 1.220 1.001
371 ,83 0 .0863 0 .2763 1.199 1 .002
370 .42 0 .1066 0 .3294 1.198 0 .998

J. Ortega, P. Herna~lez / Fluid Phase Equilibria 118 ¢ 1996) 249-270 257
Table 5 (continued)
368.80 0.1300 0.3831
366.87 0.1585 0.4452
365.35 0.1824 0.4886
361.77 0.2365 0.5759
359.33 0 .2834 0 .6367
357 .67 0 .3145 0 .6720
356.16 0 .3442 0.7021
354.80 0.3734 0.7248
353.55 0.4014 0.7491
352.32 0.4303 0.7707
351.12 0.4581 0.7926
348.77 0.5224 0.8325
346.51 0.5879 0.8624
345.90 0.6048 0.8686
344.98 0.6337 0.8800
344.06 0.6640 0.8910
343.57 0.6899 0.9004
342.70 0.7249 0.9133
342.26 0.7597 0.9238
341.29 0.8002 0.9383
340.70 0.8302 0.9453
339.97 0.8671 0.9572
339.10 0.9037 0.9681
337.78 0.9528 0.9855
336.49 1.0000 1.0000
p=74.66
364.04
363.50
362.73
361.26
359.78
359.20
358.00
357 .50
357 .00
kPa
1 ,189
1,190
1.179
1.177
1.158
1.152
1 146
1 132
1 127
1 120
1 119
1 103
1.085
1.081
1 .074
1.067
1 .053
1.044
1.021
1.014
1.003
0.994
0.991
0.997
1 .000
x C H COOCH +x CH CH(OH)CH CH 1 2 5 3 2 3 2 3
0 .999
0 ,997
1,000
1.017
1.020
1.027
1.036
1.058
1.062
1.073
1.073
1.086
1.139
1,165
1.195
1.232
1.247
1.272
1.305
1.328
1.423
1.471
1.575
1.553
0 . 0 0 0 0 0 . 0 0 0 0 - 1 . 000
0.0133 0.0337 1.322 1.003
0.0300 0.0819 1.456 0.998
0.0620 0.1596 ].433 1.000
0.0959 0.2347 1.423 1.001
0.1118 0.2606 1.379 1.007
0.1468 0.3202 1.338 1.010
0.1657 0.3497 ].314 1.008
0.1835 0.3755 1.293 1.009

258
Table 5 (continued)
J. Ortega, P. Hernandez / Fluid Phase Equilibria 118 (1996) 249-270
356.13 0.2103 0.4171 1.287 1.008
355.15 0.2418 0.4562 1.261 1.020
354.75 0.2605 0.4775 1.240 1.021
354.23 0.2807 0.5017 1.229 1.022
353.67 0.2982 0.5210 1.222 1.031
352.97 0.3213 0.5458 1.215 1.040
351.85 0.3679 0.5913 1.190 1.053
351.27 0.3941 0.6124 1.172 1.067
350.71 0.4209 0.6358 1.159 1.074
350.11 0.4493 0.6570 1.144 1.091
349.51 0 .4803 0 .6813 1.131 1.102
348 .82 0 .5146 0 .7056 1.118 1 .123
348 .23 0 .5484 0 .7264 1.100 1.150
347 .50 0 .5916 0 .7526 1.082 1.187
346.86 0.6319 0.7767 1.067 1.222
346.28 0.6699 0.7986 1.055 1.261
345.69 0.7098 0.8249 1.048 1.280
345.21 0.7554 0.8458 1.026 1.366
344.70 0.8015 0.8798 1.023 1.342
344.28 0.8395 0.9021 1.015 1.378
343.94 0.8733 0.9188 1.005 1.470
343.59 0.9070 0.9354 0.997 1.618
343.32 0.9340 0.9525 0.995 1.697
343.18 1.0000 1.0000 1.000 -
p=I01.32 kPa
372.36 0.0000 0.0000 - 1.000
370.68 0.0397 0.0941 1.355 0.995
369.80 0.0644 0.1443 1.312 0.995
368.82 0.0910 0.1953 1.292 0.998
366.96 0.1511 0.2951 1.238 1.002
366.34 0.1693 0.3233 1.232 1.006
365.40 0.1960 0.3638 1.229 1.011
364.14 0.2435 0.4289 1.209 1.012
363.61 0.2656 0.4564 1.198 1.012
363 .18 0 .2799 0.4701 1.185 1.022
362.77 0 .2940 0 .4873 1.184 1.025
362 .25 0 ,3138 0 .5084 1.175 1.031

J. Ortega, P. Hernandez/Fluid Phase Equilibria 118 (1996)249-270 259
Table 5 (cont inued)
3 6 1 . 7 6 0 . 3 3 3 4 0 .5301
3 6 1 . 2 7 0 . 3 5 3 8 0 . 5 5 0 4
3 6 0 , 8 2 0 . 3 7 5 4 0 , 5 6 9 5
3 6 0 . 3 2 0 . 3 9 7 8 0 . 5 9 0 3
3 5 9 . 8 6 0 . 4 2 0 9 0 . 6 1 0 2
3 5 9 . 3 4 0 . 4 4 6 9 0 , 6 3 2 7
3 5 8 . 7 0 0 . 4 7 9 8 0 . 6 5 9 6
3 5 8 . 1 2 0 . 5 1 3 7 0 . 6 8 4 6
3 5 7 . 2 2 0 . 5 6 0 5 0 . 7 1 7 5
3 5 6 , 6 0 0 , 6 0 0 3 0 , 7 4 4 3
3 5 5 . 9 0 0 . 6 4 8 9 0 . 7 7 3 0
3 5 5 . 3 2 0 . 6 9 0 1 0 .8001
3 5 5 . 0 2 0 . 7 1 7 2 0 . 8 1 5 2
3 5 4 . 4 9 0 , 7 6 2 9 0 . 8 4 6 2
3 5 3 . 8 1 0 . 8 1 9 9 0 . 8 7 8 0
3 5 3 . 6 4 0 . 8 3 5 5 0 . 8 9 0 3
3 5 3 . 5 0 0 . 8 5 3 0 0 . 9 0 0 3
3 5 3 . 0 4 0 . 8 9 3 0 0 .9211
352.84 0.9252 0.9427
352.74 0.9464 0.9571
352.66 1.0000 1.0000
p=127.99 kPa
378.56 0.0000 0.0000
377.76 0.0288 0.0632
376.92 0.0549 0.1159
375.86 0.0878 0.1748
375.30 0.1091 0.2101
374.92 0.1207 0.2287
374.01 0.1556 0.2816
372.90 0.1940 0.3405
372.12 0.2205 0.3755
371.42 0.2453 0.4092
370.36 0.2880 0.4630
369.87 0.3039 0.4785
368.83 0.3374 0.5174
368.23 0.3640 0.5421
367.00 0.4193 0.5959
1 .169
1 .161
1 .147
1 .138
1 .127
1 . 1 1 8
1 .106
1 .091
1 .077
1 . 0 6 3
1 . 0 4 3
1 . 0 3 3
1 .022
1 .014
1 ,000
1 .000
0 . 9 9 5
0 . 9 8 6
0.980
0.979
1 .000
1 598
1 276
1 237
1 215
1 207
1 181
1 180
1 .169
1 .167
1 .158
1 .149
1 .152
1 ,137
1 .123
1 . 0 3 4
1 , 0 4 0
1 . 0 4 8
1 . 0 5 5
1 . 0 6 3
1 . 0 7 0
1 .081
1 . 0 9 6
1 . 1 2 6
1 149
1 194
1 220
1 251
1 269
1 363
1 351
1 . 3 8 2
1 .531
1 . 6 0 4
1 . 6 9 0
1.000
0.995
0.992
0.995
0.994
0.996
0.997
0.997
1 . 0 0 3
1 . 0 0 4
1 . 0 0 5
1 .016
1 . 0 2 5
1 . 0 3 6
1 . 0 4 7

260
Table 5 (continued)
J. Ortega, P. Hernandez / Fluid Phase Equilibria 118 (1996) 249-270
366 .16 0 .4563 0 .6293 1 .116 1.058
365 .58 0 .4870 0 .6545 1.106 1.068
365 .12 0 .5105 0 .6707 1.095 1.085
364 .48 0 .5498 0 .6989 1.079 1.105
363 .69 0 .6059 0 .7359 1.055 1.141
363 .30 0 .6387 0 .7577 1.042 1.158
362 .67 0 .6826 0 .7858 1 .029 1.194
362 .10 0 .7293 0 .8145 1 .015 1.239
361 .66 0 .7610 0 .8357 1.011 1.264
361 .26 0 .7949 0.8581 1 .006 1.292
360.85 0.8299 0.8792 0.999 1.348
360.44 0.8634 0.8985 0.993 1.433
360.20 0.8913 0.9145 0.986 1.531
359.91 0.9204 0.9369 0.986 1.561
359.76 0.9311 0.9435 0.986 1.624
359.67 1.0000 1.0000 1.000 -
xlC3HTCOOCH3+x2CH3CH(OH)CH2CH3
;)=74.66 kPa
364.04 0.0000 0.0000 - 1.000
363.93 0.0105 0.0175 1.751 1.001
363.69 0.0248 0.0359 1.532 1.005
363.53 0.0506 0.0707 1.486 1.002
363 .28 0 .0785 0 .1042 1 .423 1.004
363 .06 0 .1027 0 .1350 1.419 1.004
362 .85 0 .1265 0 .1635 1.405 1.006
362 .62 0 .1540 0 .1957 1.391 1.007
362 .44 0 .1840 0 .2252 1 .347 1 .013
362 .30 0 .2086 0 .2536 1 .344 1.011
362 .14 0 .2396 0 .2832 1.314 1.017
362 .00 0 .2737 0 .3116 1.271 1.028
361 .89 0 .3014 0.3391 1.260 1.031
361 .78 0 .3606 0 .3900 1.216 1.044
361 .76 0 .3849 0 .4076 1.191 1.054
361 .69 0 .4213 0 .4305 1 .152 1.080
361 .66 0 .4655 0 .4568 1 .107 1.117
361 .66 0 .4950 0.4731 1.078 1.147
J. Ortega, P. Hernandez / Fluid Phase Equilibria 118 (1996) 249-270 261
Table 5 (continued)
361.67 0.5322 0,5001
361,71 0.5681 0.5272
361.85 0.6240 0.5692
361.96 0.6718 0.6067
362.19 0.7162 0.6494
362,41 0.7684 0.6915
362,74 0.8084 0.7362
363.12 0.8532 0.7793
363.52 0.8891 0.8300
363.93 0.9174 0.8717
364.13 0.9461 0,9098
364.58 0.9729 0.9497
364.95 1.0000 1.0000
p=101 .32 kPa
372 .36 0 .0000 0 .0000
372 .26 0.0071 0 .0107
372 .13 0.0201 0 .0278
371 .95 0 .0333 0.0451
371 .66 0 .0645 0 .0842
371 .54 0 .0855 0 .1065
371 .39 0 .1097 0 .1342
371 .22 0 .1358 0 .1615
370.98 0.1799 0.2079
370.90 0.2034 0.2311
370.81 0.2331 0.2583
370.73 0.2615 0.2840
370.69 0.2880 0.3074
370.66 0.3135 0.3294
370.64 0.3449 0,3547
370.63 0,3728 0,3784
370.63 0.4005 0.4020
370.66 0.4307 0.4239
370.70 0.4620 0.4462
370.77 0.4938 0.4732
370.88 0.5428 0.5076
371.39 0.6316 0.5782
371.53 0.6605 0.5992
1.060
1.045
1.023
1.009
1.006
0.991
0 .992
0 .983
0.992
0.997
1.002
1 .003
1.000
1 640
1 511
1 488
1 446
1 385
I 366
1 335
1.306
1,287
1.259
1.237
1.217
1.199
1,174
1.159
1.146
1.123
i . I00
1.089
1.059
1.021
1.008
1 .174
1.201
1.250
1 .302
1.331
1 .423
1 .453
1 .564
1.571
1.567
1,676
1.828
I. 000
O. 994
O. 994
0.996
O. 997
O. 999
I. 000
I. 004
1. 008
1.010
1.015
1.021
1. 026
1. 031
1 . 0 4 1
1.047
1.054
I . 068
1.085
1.094
I . 128
1. 178
1. 209

262
Table 5 (continued)
J. Ortega, P. Hernandez / Fluid Phase Equilibria 118 (1996) 249-270
371.81
372.39
372.64
372.97
373.35
373.73
374.23
374.77
375.07
375.17
375.35
p=127.99
378.56
378.47
378.29
378.19
378.06
377.95
377.82
377.69
377.62
377.60
377.59
377.58
377.59
377.60
377.64
377.71
377.77
377.87
377.97
378.09
378.13
378.33
378.41
378.88
379.12
kPa
0.7025 0.6392 1.002 1.230
0.7746 0.7064 0.987 1.294
0.8031 0.7349 0.983 1.326
0.8349 0.7684 0.979 1.366
0.8666 0.8060 0.978 1.398
0.8992 0.8458 0.978 1.451
0.9299 0.8904 0.981 1.458
0.9618 0.9406 0.987 1.423
0.9806 0.9696 0.989 1.420
0.9917 0.9864 0.992 1.480
1.0000 1.0000 1.000 -
0 . 0 0 0 0 0 . 0 0 0 0 - 1 . 0 0 0
0.0142 0.0183 1.460 1.003
0.0434 0.0552 1.448 1.001
0.0640 0.0775 1.383 1.002
0.0891 0.1065 1.370 1.001
0.1191 0.1375 1.327 1.003
0.1559 0.1744 1.290 1.007
0 .2075 0 .2229 1.243 1 .014
0 .2336 0 .2468 1.225 1.018
0 .2593 0 .2710 1 .213 1.021
0 .2818 0 .2927 1.206 1 .022
0 ,3083 0 .3146 1.185 1 .028
0.3327 0.3371 1.176 1.031
0.3510 0.3518 1.163 1.036
0.3846 0.3760 1.133 1.050
0 .4118 0.4009 1.126 1 .052
0 .4450 0 .4237 1.099 1.071
0 .4724 0 .4468 1.088 1 .078
0 .5010 0 .4702 1.077 1.088
0 .5331 0 .4947 1.061 1 .104
0 .5532 0 .5183 1.070 1.099
0 .5821 0 .5392 1.052 1.116
0 .6195 0.5591 1.022 1.170
0 .6856 0 .6178 1.007 1.209
0 .7196 0 .6490 1.001 1.235

J. Ortega, P. Hernandez / Fluid Phase Equilibria 118 ~ 1996) 249-270 263
Table 5 (continued)
379.34 0.7458 0.6768 1.001 1.245
379.64 0.7809 0.7082 0,992 1.292
379.71 0.7965 0.7277 0.997 1,295
379.95 0.8220 0.7559 0.997 1.317
380.55 0.8540 0.7939 0.991 1.329
380.83 0.8894 0.8404 0.999 1.346
381.66 0.9471 0.9205 1.004 1.365
381.93 0.9692 0.9522 1.008 1.398
382.24 0.9862 0.9780 1.008 1.422
382.54 1.0000 1.0000 1.000 -
using the empirical correlations of Tsonopoulos (1974). These calculations for V~ t and Bij were also included in the consistency test put forward by Fredenslund et al. (1977). Applying this test, all the mixtures proved to be thermodynamically consistent. All the systems studied displayed a positive shift
o.5 1 (a)
0.4
0.3
0.1
0.0
-0 .1 o o'.2 o'.4 o'.6 o'.8
Xf
370 (a)
360 -
3 3 0 -
320 I I o o'.2 o'.. o'.8 1
x l
Fig. 3. Plots of Y l - x] vs. x 1 and T vs. x~ or y] for the mixtures xt methyl esters+ x 2 butan-2-ol for (O) , methyl ethanoate, (O), methyl propanoate, and ( v ) , methyl butanoate at different working pressures: (a), 74.66 kPa, (b), 101.32 kPa: (c), 127.99 kPa.

264 J. Ortega, P, Hernandez / Fluid Phase Equilibria 118 (1996) 249-270
0.5 380 .
(b)
0.4
0.3
0.1
0.0
- 0 . 1 330 0 0.2 0.4 0.6 0.8 I 0
Xl
370"
3 4 0 "
0 . 5 , 390"
I
0.4
-,,.,
(c)
0.3
0 .1 -
380"
0 .0 m.,, . . . ~,~_ "~] 3 4 0
- 0 . 1 0 0'.2 0'.4 0'.8 0'.8 I 330 1 0 Xl
Fig. 3 (continued).
(b)
0.2 0.4 0.6 0.8 1 XI
(c)
ole o14 o16 ot8 x!

J. Ortega, P. Hernandez / Fluid Phase Equilibria 118 ! 19961249-270 265
away from ideality, with the values of Yi decreasing slightly as the working pressure increased. The values of Y2 were also recalculated using Eq. (2) with the values of pO calculated by means of the Antoine equation and the constants A, B and C for butan-2-ol reported by other workers. However,
T a b l e 6
P a r a m e t e r s o b t a i n e d in t he d i f f e r e n t e q u a t i o n s u s e d f o r the b i n a r y m i x t u r e s x ~ m e t h y l e s t e r s + x 2 b u t a n - 2 - o l a t t he d i f f e r e n t
p r e s s u r e s
x ICH 3 C O O C H 3 + x 2 C H 3 C H ( O H ) C H 2 C H 3
p = 7 4 . 6 6 k P a
M a r g i i l e s A12 = 0 . 4 4 4 A21 = 0 . 2 1 3
V a n L a a r A I 2 = 0 . 4 3 5 A21 = 0 . 7 5 1
W i l s o n Ai2 = 6 7 . 8 "~ A21 = 2 0 1 4 . 6 a
N R T L , cr = 0 . 4 7 A g l 2 = 2 3 5 7 . 3 a Age1 = 3 3 2 . 1 a
U N I Q U A C , z = 10 Aul2 = 5 2 3 3 a Au21 = - 1921 a
R e d l i c h - K i s t e r A o = 0 , 5 5 5 A~ = 0 . 1 3 1 A 2 = 0 . 0 8 5
E q , ( 1 ), k = 0 . 5 0 A o = 0 , 6 6 9 A ~ = - 0 . 5 4 2 A 2 = 0 . 5 9 1
p = 1 0 1 . 3 2 k P a
M a r g i i l e s Al2 = 0 , 4 0 4 Ae l = 0 . 2 8 3
V a n L a a r A l z = 0 , 4 1 9 A2t = 0 . 5 2 9
W i l s o n A12 = 6 9 3 . 7 a A21 = 8 0 0 . 7 a
N R T L , a = 0 . 4 7 Agl2 = 1 2 5 5 . 4 a Ag?l = 2 3 3 . 3 '~
U N I Q U A C , z = 10 A U t 2 = 4 3 4 4 . 5 a Au2j = - 1777.1 "~
R e d l i c h - K i s t e r A o = 0 . 4 6 3 A~ = 0 . 0 7 0 A 2 = - 0 . 0 4 6
Eq . ( I ) , k = 0 . 3 7 Ao = 0 . 4 2 3 A t = - 0 . 0 6 1 A 2 = 0 . 1 6 7
p = 1 2 7 . 9 9 k P a
M a r g t i l e s A ~ 2 = 0 . 1 1 6 A 21 = - 0 . 2 6 2
V a n L a a r A le = 0 . 2 2 7 A21 = 0 . 4 9 2
W i l s o n A12 = - 6 5 5 . 4 a A21 = 2 2 8 7 . 2 a
N R T L , o~ = 0 . 4 7 A g l 2 = 2 7 6 0 . 9 a Ag21 = -- 1 1 4 6 . 8 a
U N I Q U A C , z = 10 AUl2 = 5 1 4 8 . 7 ~ Au21 = - - 2 2 6 3 . 9 a
R e d l i c h - K i s t e r A o = 0 . 3 0 7 A~ = 0 . 1 4 8 A 2 = 0 . 0 0 8
E q . (1) , k = 0 .41 Ao = 0 . 2 9 3 A l = - - 0 . 4 0 0 A2 = 0 , 5 2 5
x iC 2 H s C O O C H 3 + x 2 C H 3 C H ( O H ) C H 2 C H 3
p = 7 4 . 6 6 k P a
M a r g i i l e s A 12 = 0 . 4 5 7 A 21 = 0 , 4 9 2
V a n L a a r AI2 = 0 . 3 5 3 A21 = 0 . 5 2 9
W i l s o n AI2 = - 4 0 4 , 5 a A21 = 1938 .5 a
N R T L , a = 0 , 4 7 A g l 2 = 1 8 5 0 . 6 a Agel = - - 3 2 9 . 7 a
U N I Q U A C , z = 10 Au12 = 4 7 4 8 . 9 a z~U21 = - - 2 1 1 4 . 6 a
R e d l i c h - K i s t e r A o = 0 . 4 2 3 A I = 0 . 0 8 2
E q . ( I ) , k = 0 , 4 5 A o = 0 . 4 8 8 A~ = - 0 . 3 4 5
p = 1 0 1 . 3 2 k P a
Marg i~ les AL2 = 0 . 3 1 3 A?I = 0 , 2 4 6
V a n L a a r A12 = 0 . 3 1 2 A2 t = 0 . 3 7 5
W i l s o n A I 2 = 4 0 . 5 a A2~ = 1060.1 "~
N R T L , a = 0 . 4 7 Agl2 = 9 9 9 . 7 a Ag21 = 100.5 a
U N 1 Q U A C , z = 10 Au12 = 4 1 5 0 . 2 a Au21 = - 2 0 3 4 . 8 a
R e d l i c h - K i s t e r A o = 0 . 3 4 5 A~ = 0 . 0 5 9
Eq . ( 1 ), k = 0 , 3 8 A o = 0 . 2 4 7 A I = - 0 . 0 4 8
A 2 = 0 . 0 3 3
A 2 = 0 , 3 3 8
A 2 = - 0 . 0 8 5
A 2 = 0 . 1 6 1
6 (T /K) ~( y~) s(GE/RT) 0 . 0 3 0 . 0 0 5 0 . 0 2 5
0 . 0 2 0 . 0 0 2 0 . 0 0 8
0 . 0 2 0 . 0 0 2 0 . 0 0 7
0 . 0 2 0 . 0 0 2 0 . 0 0 8
0 . 0 2 0 . ( /03 0 . 0 t 0
0 . 0 2 0 . 0 0 2 0 . 0 0 7
0 . 0 2 0 . 0 0 3 0 . 0 0 9
0 .01 0 . 0 0 5 0 . 0 1 5
0 .01 0.(X)3 0 . 0 0 7
0 .01 0 . 0 0 3 0 . 0 0 6
0 .01 0 .0( /3 0 . 0 0 6
0 .01 0 . 0 0 4 0 . 0 0 7
0 .01 0 . 0 0 4 0 . 0 0 8
0 .01 0 . 0 0 4 0 . 0 1 1
0 . 0 2 0 . 0 1 0 0 . 0 3 7
0 . 0 2 0 . 0 0 5 0 . 0 1 4
0 . 0 2 0 . 0 0 5 0 . 0 1 4
0 . 0 2 0 . 0 0 5 0 . 0 1 4
0 . 0 2 0 . 0 0 6 0 . 0 1 8
0 . 0 2 0 . 0 0 5 0 . 0 1 5
0 .01 0 . 0 0 4 0 . 0 0 9
0 . 0 4 0 . 0 0 6 0 . 0 0 7
0 . 0 2 0 . 0 0 5 0 . 0 0 5
0 . 0 2 0 . 0 0 4 0 . 0 0 5
0 . 0 2 0 . 0 0 4 0 . 0 0 5
0 . 0 2 0 . 0 0 6 0 . 0 0 6
0 . 0 2 0 . 0 0 4 0 . 0 0 6
0 .01 0 . 0 0 3 0 . 0 0 3
0 . 0 4 0 . 0 0 8 0 . 0 0 8
0 . 0 4 0 . 0 0 5 0 . 0 0 6
0 . 0 4 0 . 0 0 5 0 . 0 0 6
0 . 0 4 0 . 0 0 5 0 . 0 0 6
0 . 0 3 0 . 0 0 5 0 . 0 0 6
0 . 0 3 0 . 0 0 5 0 . 0 0 6
0 . 0 2 0 . 0 0 6 0 . 0 0 5

266
Table 6 (continued)
J. Ortega, P. Hernandez / Fluid Phase Equilibria 118 (1996) 249-270
p = 127.99 kPa
Margi~les A I 2 = 0.292 A 2 1 = 0.253 Van Laar At2 = 0.237 A2~ = 0.384 Wilson /112 = - 795.4 ~ /12~ = 2033.9 a NRTL, a ~ 0.47 Agt2 = 2007.2 a /1g21 = - 760.8 a
UNIQUAC, z = 10 /1ux2 = 4693 a /1U21 = - -2295.9 a Red l i ch -K i s t e r A o = 0.304 A t = 0.110
Eq. (1), k ~ 0.29 A o = 0.267 A 1 = - 0 . 3 4 7
x IC 3HvCOOCH3 -I- x 2CH3CH(OH)CH2CH 3
A 2 = - 0 . 1 0 5
A 2 = 0.432
p = 74,66 kPa
Margi~les A t 2 = 0 . 4 5 5 A21 = 0.506 Van Laar At2 = 0.421 A21 = 0.459 Wilson A I 2 = - - 172.5 a /121 = 1589.6 a NRTL, a = 0 . 4 7 /1gtz = 998.1 a /1gzt = 413 a
UNIQUAC, z = 10 /1ut2 = 4208.9 a /1/,121 = - 1990.3 a
Red l i ch -K i s t e r A o = 0.439 A t = 0.018
Eq. (1), k = 0.51 A o = 0.487 A t = - 0 . 0 7 6 A 2 = - 0 . 0 6 0 p = 101.32 kPa
MargiJles A~2 = 0.318 A21 = 0.237 Van Laar A I 2 = 0.411 A 2 1 = 0.291 Wilson At2 = 1096.2 a /121 = 198.2 ~ NRTL, a = 0.47 Ag12 = - -438.6 a Ag21 = 1731.1 ~
UNIQUAC, z = 10 Aut2 = 3159.9 a /1u21 = - 1676.8 a Red l i ch -K i s t e r A 0 = 0.351 A i = - 0.069 A 2 = - 0.079 Eq. (1), k = 0.40 A 0 = 0.255 A~ = 0.262 A 2 = - 0 . 2 3 3 p = 127.99 kPa
Margiiles A I 2 = 0.328 A2t = 0.330 Van Laar A 12 = 0.349 A2t = 0.307 Wilson Al2 = 326.4 a A2j = 770.1 a NRTL, cr = 0.47 / 1 g 1 2 = 147.4 a /1g2t = 946.3 a UNIQUAC, z = 10 Aut2 = 3489.7 a Au2t = - 1858.1 a Red l i ch -K i s t e r A o = 0.323 A 1 = - 0.020 Eq. (1), k = 0.34 Ao = 0.344 A 1 = 0 . 1 0 2 A 2 = - 0 . 1 4 6
0.06 0.013 0.010 0.05 0.008 0.007
0.05 0.008 0.007 0.04 0.008 0.007 0.03 0.007 0.006
0.02 0.006 0.005 0.01 0.007 0.004
0.02 0.008 0.003
0.04 0.009 0.004 0.04 0.009 0.004
0.04 0.009 0.004
0.05 0.008 0.003 0.04 0.009 0.004 0.02 0.007 0.003
0.04 0.009 0.005 0.05 0.010 0.005 0.05 0.010 0.005 0.05 0.010 0.004
0.04 0.009 0.004 0.04 0.007 0.003 0.03 0.009 0.004
0.06 0.006 0.003 0.04 0.005 0.003 0.04 0.005 0.003 0.04 0.005 0.003 0.05 0.005 0.002 0.04 0.005 0.003 0.03 0.005 0.003
a All parameters in J mol 1.
t h e d i f f e r e n c e s w e r e n o t v e r y a p p r e c i a b l e , r e a c h i n g o n l y 4 % in t h e w o r s t c a s e s . U s i n g t h e c o n s t a n t
v a l u e s f o r t h e m e t h y l e s t e r s p u b l i s h e d in t h e l i t e r a t u r e , n a m e l y , b y T R C ( 1 9 9 1 ) , B o u b l i k e t a l . ( 1 9 7 3 ) ,
a n d A m b r o s e e t a l . ( 1 9 8 1 ) f o r e t h a n o a t e ; b y T R C ( 1 9 9 1 ) a n d B o u b l i k e t a l . ( 1 9 7 3 ) f o r p r o p a n o a t e ;
a n d b y T R C ( 1 9 9 1 ) f o r b u t a n o a t e , t h e d i f f e r e n c e s in t h e Yi v a l u e s w e r e c o m p a r a b l e t o t h e p r e c e d i n g
c a s e , t h a t i s , < 4 % . T h e s e r e s u l t s p r o v e d v a l i d a t i o n o f t h e v a p o r p r e s s u r e s a n d c o r r e l a t i o n s c o m p u t e d
a t o u r l a b o r a t o r y f o r t h e t e m p e r a t u r e r a n g e s e t o u t in T a b l e 3.
T h e t r e a t m e n t o f t h e e x p e r i m e n t a l d a t a i n v o l v e d f i t t i n g t h e a c t i v i t y c o e f f i c i e n t s u s i n g t h e m a x i m u m
l i k e l i h o o d p r i n c i p l e , m i n i m i z i n g t h e o b j e c t i v e f u n c t i o n
4
O . F . = E [Mi ,ca l - 2 2 Mi,exp. ] / S M i ( M i = P , T , x , y ) ( 4 ) i = l

J. Ortega, P. Hernandez / Fluid Phase Equilibria 118 ¢ 1996) 249-270 267
A series of changes previously effected by our laboratory were made in the original program of Prausnitz et al. (1980), as reported earlier. The data were correlated using various now classic equations for the treatment of VLE data, such as the van Laar, Margi~les, Wilson, NRTL and UNIQUAC equations and other polynomial equations, such as the Redlich-Kister equation and an equation analogous to Eq. (1) above, which were also used in the data reduction procedure. The values of the standard deviations, SMi, for each of the magnitudes in Eq. (4) used in the simultaneous regression procedure were 0.02 kPa for p, 0.01 K for T, 0.002 for x~, and 0.004 for Yl-
Table 6 gives the constant values calculated for each of the correlations. Generally, they all appeared to be suitable for correlating the data for the mixtures considered here. Fig. 3 plots the experimental values and the curves obtained by setting Q = Y l - x l and Q = T-~,VXITb, i in an expression analogous to Eq. (1). The figures clearly reveal the variation in the magnitudes considered with ester type and, in particular, the presence of an azeotrope in the mixture (methyl butanoate + butan-2-ol), which shifted toward the fractions less rich in the methyl ester as working pressure increased. The exact location of the singular point, a minimum azeotrope, was calculated using the relations referred to above and Eq. (1), which yielded the following contour conditions for determin- ing the location of the azeotrope:
y, = x l ( O T / O x , ) p = ( O T / O y l ) p = O (s)
If Q = Yl - X l in Eq. (1), then:
0 = ]~_~Aiz i where z = x , / [ x I + kx2] (6)
Table 7 Error percentage obtained in prediction of activity coefficients using different models on the mixtures methyl esters + butan- 2-ol at various working pressures
ASOG UNIFAC-2 UNIFAC- 1
O H / C O O a O H / C O O C b O H / C O O C c O H / C O O C d C O H / C O O e C C O H / C O O C f O H / C O O ~
Butanol-2-ol + 74.66 kPa Methyl ethanoate 7.9 2.9 2.5 7.6 2.4 3.6 1.8 Methyl propanoate 7.8 4.0 5.2 8.2 3.9 5.5 3.6 Methyl butanoate 5.3 3.5 3.5 9.0 3.1 6.0 3.8 101.32 kPa Methyl ethanoate 9.6 2.8 3.1 8.8 2.8 4.7 1.5 Methyl propanoate 9.2 4.5 6.5 9.8 5.3 7.3 5.1 Methyl butanoate 7.7 4.4 3.6 12.4 3.7 9.5 6.1 127.99 kPa Methyl ethanoate 14.5 5.4 5.4 12.9 7'.0 9.1 4.5 Methyl propanoate 10.7 4.6 6.9 10.9 (:~.5 8.7 6.2 Methyl butanoate 8.0 3.9 3.5 12.5 4.3 9.9 6.6
:' Kojima and Tochigi (1979). b Larsen et al. (1987). c Gmehling et al. (1993). cl Gmehling et al. (1982). " Fredenslund et al. (1975). t Fredenslund et al. (1977). g Macedo et al. (1983).

268 J. Ortega, P. Hernandez / Fluid Phase Equilibria 118 (1996) 249-270
but if instead Q = T - XlTb, l -- X2Tb. 2 for condition (5), then:
0 = - rb ,2 + (1 - 2xl), ( 7 )
where a = E A i zi and /3= (dcr /dz) .
The coefficients A~ in cr correlated the temperature values and hence differed from the coefficients in expression (6), where they were correlations for yl - x~. Solving these equations yielded numerical values for the azeotropes at the different working pressures:
p = 74.66 kPa T = 361.7 K p = 101.32 kPa T = 370.6 K p = 127.99 kPa T = 377.6 K
Yl = xl = 0.451 y~ = x~ = 0.399 yj = x I : 0.351
which agrees with the proposal by Horsley (1973) at atmospheric pressure.
4. Theoretical prediction of VLE using group-contribution models
Isobaric VLE values for the systems considered in this study were predicted using the ASOG model (Kojima and Tochigi, 1979) and two versions of the UNIFAC model, here designated by UNIFAC-1 (Fredenslund et al., 1975) and the more recent, UNIFAC-2 (Larsen et al., 1987; Weidlich and Gmehling, 1987). The accuracy of the predictions was assessed in all cases by comparing the values of the activity coefficients, Yi, derived implicitly from Eqs. (2) and (3). Table 7 presents the percentage errors in the estimates of the % values.
The original UNIFAC-1 model was used with various alcohol/ester interaction pairs existing in the literature, including the interaction pair O H / C O O , not recommended for alkyl esters (Macedo et al., 1983). Unexpectedly, this interaction pair yielded the best prediction results, whereas the interaction pair originally proposed, O H / C O O C , produced the highest errors, of around 10%. Both the version of the Lyngby group (Larsen et al., 1987) and the version of the Dortmund group (Weidlich and Gmehling, 1987) yielded excellent results for all the mixtures under all the experimental conditions, with mean errors of around 5%. Finally, in the ASOG model estimation errors increased progressively with working pressure; conversely, the predictions improved with methyl ester chain length. This latter finding is significant, because the ASOG model uses the more flexible C O 0 group for all alkyl esters instead of the COOC group employed in UNIFAC-1, which uses different areas depending upon whether or not the esters are an alkyl ethanoates.
Summing up, even though this study used an isomer of an alcohol, which usually results in poorer predictions, the overall results were positive, with mean errors in the range of 5 -10% for all the mixtures under all the experimental considered.

J. Ortega, P. Hernandez / Fluid Phase Equilibria I 18 (1996) 249-270 269
5. List of symbols
A,B,C n(D)
P po R T Th.~ V L
x~
Yi
coefficients of Antoine equation refractive index at D-sodium line working pressure vapor pressure of species i gases universal constant absolute temperature normal boiling temperature of species i liquid molar volume liquid mole fraction of species i vapor mole fraction of species i
Greek letters 7~ activity coefficient of species i p density ~b i fugacity coefficient of species i
Acknowledgements
We are thankful (PB92-0559).
to the DGICYT (MEC) frem Spain for financial support for this project
References
Ambrose, D., Ellender, J.H., Gundry, H.A., Lee, D.A. and Townsend, R., 1981. Thermodynamic properties of organic oxygen compounds. LI. The vapour pressures of some esters and fatty acids. J. Chem. Thermodyn., 13: 795-802.
Ambrose, D. and Sprake, C.H.S., 1970. Thermodynamic properties of organic oxygen compounds. XXV. Vapor pressures and normal boiling temperatures of aliphatic alcohols. J. Chem. Thermodyn., 2: 631-645.
Boublik, T., Fried, V. and H~la, H., 1973. The Vapour Pressures of Pure Substances. Elsevier, Amsterdam. Fredenstund, Aa., Jones, R.L. and Prausnitz, J.M., 1975. Group contribution estimation of activity coefficients in nonideal
liquid mixtures. AIChE J., 21: 1086-1099. Fredenslund, Aa, Gmehling, J. and Rasmussen, P, 1977. Vapor-Liquid Equilibria Using UNIFAC. A Group Contribution
Method. Elsevier, Amsterdam. Gmehling, J., Li, J. and Schiller, M., 1993. A modified UNIFAC model. 2. Present parameter matrix and results for different
thermodynamic properties. Ind. Chem. Eng. Res., 32: 178-193. Gmehling, J., Rasmussen, P. and Fredenslund, Aa., 1982. Vapor-liquid equilibria by UNIFAC group contribution. Revision
and extension. 2 lnd. Eng. Chem. Process Des. Dev., 21:118-127. Horsley, L.H., 1973. Azeotropic Data--I l l . Advances in Chemistry Series 116, A.C.S. Washington DC. Kojima, K. and Tochigi, K., 1979. Prediction of Vapor-Liquid Equilibria by the ASOG Method. Kodansha Ltd.. Tokyo. Larsen, B.L., Rasmussen, P. and Fredenslund, Aa., 1987. A modified UNIFAC group contribution model for prediction of
phase equilibria and heats of mixing. Ind. Eng. Chem. Res., 26: 2274-2286. Macedo, E.A., Weidlich, U., Gmehling, J. and Rasmussen, P., 1983. Vapor-liquid equilibria by UNIFAC group contribution
Revision and extension 3. Ind. Eng. Chem. Process Des. Dev.. 22: 676-678.

270 J. Ortega, P. Hernandez / Fluid Phase Equilibria 118 (1996) 249-270
Ortega, J., Pefia, J.A. and de Alfonso, C., 1986. Isobaric vapor-liquid equilibria of ethyl acetate+ethanol mixtures at 760_+0.5 mmHg. J. Chem. Eng. Data, 31: 339-342.
Ortega, J., Oc6n, J., Pefia, J.A., de Alfonso, C., PazAndrade, M.I. and Fern~indez, J., 1987. Vapor-liquid equilibrium of the binary mixtures CnH2n + I(OH) (n = 2, 3, 4)+ propyl ethanoate and ethyl ethanoate. Can. J. Chem. Eng., 65: 982-990.
Ortega, J. and Susial, P., 1990a. Measurements and prediction of VLE of methyl propanoate/ethanol/propan-l-ol at 114.66 and 127.66 kPa. J. Chem. Eng. Jpn., 23: 349-353.
Ortega, J. and Susial, P., 1990b. VLE at 114.66 and 127.99 kPa for the systems methyl acetate+ethanol and methyl acetate +propan-l-ol. Measurements and prediction. J. Chem. Eng. Jpn., 23: 621-626.
Ortega, J. and Susial, P., 1993. Vapor-liquid equilibria behavior of methyl esters and propa-2-ol at 74.66, 101.32, and 127.99 kPa. J. Chem. Eng. Jpn., 26: 259-265.
Ortega, J., Susial, P. and de Alfonso, C., 1990a. Vapor-liquid equilibrium measurements at 101.32 kPa for binary mixtures of methyl acetate+ethanol or propan-l-ol. J. Chem. Eng. Data, 35: 350-352.
Ortega, J., Susial, P. and de Alfonso, C., 1990b. Isobaric vapor-liquid equilibrium of methyl butanoate with ethanol and 1-propanol binary systems. J. Chem. Eng. Data, 35: 216-219.
Ortega, J. and Susial, P., 1991. Vapor-liquid equilibria of mixtures of methyl butanoate +propan-2-ol at 74.66, 101.32, and 127.99 kPa. Ber. Bunsenges Phys. Chem., 95: 1214-1219.
Prausnitz, J.M., Anderson, T.F., Greens, E.A., Eckert, C.A., Hsieh, R. and O'Connell, J.P., 1980. Computer calculations for multicomponent V-L and L-L equilibria. Prentice-Hall, Inc., Englewood Cliffs, NJ.
Reid, R.C., Prausnitz, J.M. and Sherwood, T.K., 1977. The Properties of Gases and Liquids, 3rd edn., MacGraw-Hill, New York.
Riddick, J.A., Bunger, W.B. and Sakano, T.K., 1986. Organic Solvents. Techniques of Chemistry, Vol. II, 4th edn., Wiley-Interscience, New York.
Spencer, C.F. and Danner, R.P.J., 1972. Improved equation for predicting of saturated liquid density. J. Chem. Eng. Data, 17: 236-241.
Susial, P., Ortega, J., de Alfonso, C. and Alonso, C., 1989. Vapor-liquid equilibrium measurements for methyl propanoate-ethanol and methyl propanoate-propan-l-ol at 101.32 kPa. J. Chem. Eng. Data, 34: 247-250.
Susial, P. and Ortega, J., 1995. Vapor-liquid equilibria of methyl ethanoate with n-butyl and iso-butyl alcohol at 74.66 and 127.99 kPa. J. Chem. Eng. Jpn., 28: 66-70.
TRC, 1991. Thermodynamic Tables of Non-hydrocarbons, Texas A and M University, College Station, TX. Tsonopoulos, C., 1974. An empirical correlation of second virial coefficients. AIChE J., 20: 263-272. Weidlich, U. and Gmehling, J., 1987. A modified UNIFAC model. 1. Prediction of VLE, and H E. Ind. Eng. Chem. Res.,
26: 1372-1381.