iso submission to productivity commission freight … · 2018-01-11 · submission to the...
TRANSCRIPT

Submission to the Productivity Commission Inquiry into International Freight Services 30 August 2011
1 Introduction The Productivity Commission is inquiring into international freight transport policy at the request of the Government. This presents an opportunity to influence the future direction of freight transport policy, particularly relating to access to infrastructure and contestability of freight services.
ISO Limited (ISO) welcomes the opportunity to respond to the Productivity Commission’s issues paper as part of its enquiry into International Freight Transport Services.
ISO’s background and operations As a leading service provider at ports throughout New Zealand, ISO has a comprehensive understanding of New Zealand’s port operations and the issues impacting on competition and productivity. As an operator that is not aligned to a port, we also provide an independent view of these issues and potential solutions.
Established in 1995, ISO is a New Zealand-owned business that offers a range of waterfront cargo logistics services, including transport and distribution, marshalling and warehousing, IT solutions, and stevedoring. ISO specialises in providing logistic solutions for commodity products, palletised products, containers, bulk products, break-bulk and liner vessel commodities and project cargoes.
ISO has operations at 10 New Zealand ports, with a head office in Tauranga. We engage more than 400 personnel under contract with their employer New Zealand Associates Limited (NZAL), who are members of the independent Amalgamated Stevedores Union (ASU), a registered union since 2000 under the Employment Relations Act.
ISO’s competitors in waterfront cargo logistics services include port companies, other New Zealand-owned stevedores, and foreign-owned subsidiaries of multinational companies. Issues for the Inquiry Based on ISO’s experience as an independent operator on the New Zealand waterfront, there are a number of issues that need to be addressed for New Zealand’s ports to become more competitive and therefore more productive. Particular issues include the contestability of services and industrial relations issues inhibiting competition. As requested by the Commission, we have provided specific examples which highlight the presence of these issues, as well as examples of innovations that have helped to improve productivity.
Ports form a vital part of exporters’ supply chains, linking them with markets—particularly where timing and reliable delivery is a key demand driver. Consequently, port efficiency can be an important factor for achieving competitive advantage in certain markets. Many believe, including ISO, that private sector participation in the ownership and operation of port infrastructure and services can help improve port efficiency.

2
Therefore, we consider it crucial that the Productivity Commission attempt to identify the relationship between ports’ ownership structure and port efficiency, as well as the link between efficiency and the levels of contestability of different port services. Whilst a lot of focus around the world has been on containerised cargo services and the improvements in productivity, New Zealand’s export profile suggests there should be a focus on higher-volume, non-containerised cargoes.
Outline of Submission This report forms the basis ISO’s submission to the Productivity Commission. There are two elements to this submission:
§ Building an evidence base to understand the drivers of productivity in port operations and efficiency in New Zealand exporters’ supply chains, and
§ Developing a principled framework for assessing current competition settings and evaluating potential policy interventions.
The following section sets out how the markets for different port activities that take place within a port area are structured, and how services tend to be procured. Section Three outlines the different contestability options for port services, contrasting the upstream market for the provision of port land and infrastructure and the downstream port activities. Section Three also identifies where vertical integration may be detrimental to the interests of shippers, particularly exporters.
Section Four briefly looks at some high-level indicators of port efficiency in New Zealand, and how the Productivity Commission could look for signs that shippers are able to drive supply-chain efficiency. Section Five addresses the effect of labour legislation, and Section Six discusses the potential benefits of a hub and spoke sea-freight configuration, identifying the potential options, risks, and opportunities.
2 Background Ports are complex service organizations and the services provided to port users are multi-dimensional, including important logistics chain functions such as cargo handling, warehousing and towage of ships. Ports also often diversify beyond traditional infrastructure provision into value-added logistics services, including repacking, assembly and repair.
The essential element for receiving and shipping cargo by sea is infrastructure provision—the use of harbours, wharf space and port equipment. This includes channels (requiring the associated up-keep, including dredging), cranes, berths, docks, and other fixtures. These services are essential, regardless of the provider of other services, and entry into any downstream port services depends on access to port infrastructure.

3
Figure 2.1: Port Operations: Upstream Infrastructure and Downstream Services
Figure 2.1 shows the activities that commonly occur on port land that can be considered separate downstream markets from the port’s essential services:
1. Transport and Storage, where inland cargo arrives or leaves the port via alternative distribution modes (road and rail), and is stored in premises built on or near port land. Storage space may be leased from the port owner
2. Marshalling involves assembly, sorting, and tracking of cargo in preparation for its presentation under hook to the stevedore
3. Stevedoring involves loading and tracking cargo and stowing it securely in the hold of a ship (to the vessel master’s satisfaction) for carriage. Stevedoring also involves discharging cargo from ships
4. Marine services, such as pilotage and towage of vessels to and from their berths, and
5. Other services, including security, servicing and cleaning containers, dredging harbour channels, ship services and maintenance, and other port-related activities.
While some services are localised to the port infrastructure, substitution between different providers is possible, particularly marshalling and stevedoring of bulk and break-bulk services. Larger port customers will often insist on their own preferred stevedore and marshalling provider(s) for specific or specialised, such as bulk cargo, due to a scarcity of waterfront labour at a small port or an on-going services agreement with their preferred supplier (among other reasons).
There are three broad institutional models for providing these downstream services:
1. Port provision—The owner of the land also owns key port infrastructure and provides port services such as piloting vessels, stevedoring, marshalling, and storage (vertical integration)
2. Contestable contracts for total operation—The port owner tenders for a sole provider or provider of stevedoring or marshalling services and competition occurs between port service providers for the privilege of getting a concession contract. This model provides competition for the market, and
3. Contestable services—The port owner, shipping companies, shippers, or a combination of the three, purchases one or more of the services for particular

4
times, terminals, or consignments. This is also known as side-by-side operations, as there may be different providers working in the port at any one time, and there is open access to stevedores and marshallers wanting to offer services (possibly subject to minimum concession requirements). This model provides competition in the market.
3 Comparison of different contestability options In broad terms, there are principally two market segments within New Zealand ports—containerised and non-containerised cargoes. Non-containerised cargoes can be broken down into:
§ Refrigerated (“reefer”) cargo
§ Bulk cargo
§ Break bulk cargo, and
§ Unitised break bulk cargo.
Higher value cargoes tend to be containerised and unitised break bulk, including reefer. To a certain extent, these cargoes are capable of bearing additional transport costs which enable the potential for competitive choice of essential port infrastructure. However, a large percentage of New Zealand export trade by tonnage is captive to the nearest available port to harvest or manufacture, which limits the bargaining abilities for shipper interests.
The top six New Zealand sea ports by volume are shown in Figure 3.1, representing 76 percent of total New Zealand seaport trade by weight. In 2009, 61 percent of total New Zealand trade by weight was non-containerised cargo.1
Figure 3.1: Imports and Exports by Top Six Sea Ports (2011)
Source: Calculated from Statistics New Zealand data
1 NZIER (2010) Freight Futures: Long Term Sea Freight Scenarios, Report to the Ministry of Transport, at page 10.
0
2,000,000
4,000,000
6,000,000
8,000,000
10,000,000
12,000,000
14,000,000
Gro
ss T
onne
s Im
port
s an
d Ex
port
s
Imports
Exports

5
In the containerised segment of the market, New Zealand is unusual in having vertically-integrated ports where the party who owns the port also operates the port terminal and provides many of the services. This is quite different from many ports overseas, where a port authority or corporation owns the assets of the port (land and buildings) and a separate firm operates the port.
We consider that significant gains in the efficiency of port operations can be achieved through increased contestability of port services and by greater access by alternative service providers to port infrastructure. Why have vertically integrated ports? There are valid arguments why vertical integration by ports into the provision of operational port services, and long-term contracting for port services, can be an efficient way of coordinating activity—particularly in the containerised cargo segment. Utilisation can be improved, particularly in smaller ports, where labour and capital inputs can be shared between activities rather than separately engaged. Transaction costs between parties contracted by the shipper can also be reduced.
There may also be externalities that shippers may value by having certainty of one party to deal with for all aspects of the freight service from ocean freight to inland transport and distribution. The ability to plan and coordinate the entire logistics chain can therefore enhance the reputation of the port company. Risks with vertical integration There may nevertheless be good reasons for promoting the unbundling of services offered by port owners from their provision of essential port infrastructure in both the container and non-containerised markets. Given New Zealand’s small scale of operations, these may not be as strong in every port or for every cargo mode, but where there is export demand for specialist logistics support, particularly in break-bulk and non-homogenous shipments, shippers would benefit from more choice in service providers.
Where services are integrated into the port and provided or exclusively procured by the port company, there may be barriers to efficiency improvements that result from better integration into a firm’s supply chain—rather than into a port’s functional operations. It should not be assumed that efficiency improvements that result from a port’s exclusive licensing of services outweigh the more important opportunities that could be available through separate procurement by the shipper or shipping company.
Potential for anti-competitive conduct
Any efficiency benefits from a port owner vertically integrating into markets for the provision of port services such as marshalling or stevedoring can be destroyed if ports use profits they earn on services where they don’t face competition to subsidise their services in markets where they might face competition. By charging below marginal cost for some services, a vertically integrated port can keep out rival marshalling or stevedoring providers. There may also be non-price methods of lessening competition in the provision of port services.
Competition issues arise when there is a link between the owner of the essential facility and an operator in the downstream market. In many cases, the owner of the essential facility is vertically integrated and is operating in both the upstream and downstream markets. In these cases, the owner of the essential facility can extend monopoly power from one market to another.
In ports there are several markets: the market for the provision of port infrastructure, and downstream markets for the provision of each of the port services, including

6
stevedoring and marshalling. The port is the owner of an essential facility. The key question from competition policy point of view is whether this ownership structure represents a form of vertical integration which gives ports the ability and the incentive to eliminate competitors from the downstream markets.
Aside from the Port Nelson situation in 1995, where the port was found to be anti-competitively cross-subsidising its pilotage and towage services, there have been other instances of ports limiting competition in downstream port services by using their dominance in the markets for essential port infrastructure. In 2006, the Commerce Commission investigated Northport Ltd after ISO complained that Northport had granted an exclusive licence to its own joint venture port services company and was making it uneconomic for other companies to marshal cargo at Marsden Point. The Commission’s finding resulted in the first Cease and Desist Order to be made under the Commerce Act, requiring Northport to allow other companies to provide marshalling services at the port.
Lost potential for enhancing intra-port and supply chain efficiency Recourse to Commerce Act is an expensive and uncertain means of gaining access to port infrastructure and serves as a barrier to improving the productivity of port services.
Contestable provision of services is an issue that has received extensive consideration in a number of overseas regimes—access to essential facilities. It arises in a number of infrastructure industries where there are facilities which exhibit natural monopoly characteristics, in the sense that they cannot be duplicated economically. They include: airports, seaports, wharves, railroads, telecommunication networks, gas and water pipelines, and electricity transmission grids. In these cases, there are two interrelated markets—an upstream market containing the essential facility and a downstream market.
The customers of port services, shipper and shipping companies, are likely to pay more attention to port efficiency when selecting each downstream port service explicitly, rather than accepting the bundle provided by a vertically integrated port operator. This is because global logistics chains consist of specialists that facilitate the efficient progress of cargo through a system of interacting organisations. Seen from the perspective of an exporter, how services are performed within a port boundary determine the efficiency of the supply chain.
This is particularly the case for non-containerised break-bulk cargo where specialist handling requirements can dictate labour expertise or specific equipment owned by private stevedoring and marshalling providers. Reliability is also a highly valued feature of break-bulk handling, and shippers may have preferred suppliers that they consider more efficient for their own firm-level business outputs. These efficiency targets are more supply chain based, and might be better measured with other indicators based on the amount of time spent in the port, rather than ports’ generic tonnes or twenty-foot-container equivalent unit (TEU) throughput per worker indicators.
Vertically integrated ports may also be limited in their willingness to integrate their service activities with the rest of the logistics chain, due to being focussed on activities within their land area, rather than how those activities are coordinated with the rest of an exporter’s supply chain. This can be the case for coastal shipping of smaller volumes within New Zealand, and for larger aggregation points for ocean shipping. Solutions to inefficient or anti-competitive vertical integration Many ports overseas have adopted the “landlord” model, where the port owner and operator are separate. An authority or corporation often has the responsibility for

7
planning and development of portside infrastructure, but port operations, such as cargo handling and transport off-site, are carried out by private companies. A complete structural separation would remove any interest that the landlord has in downstream markets.
Some countries utilise a regulated access regime for alternative port service providers to contest services where a port owner or operator is vertically integrated into the downstream port services. Australia’s Competition and Consumer Act provides the most obvious example of avoiding uneconomic duplication of infrastructure to promote competition, by enabling access to infrastructure on ‘reasonable’ terms—subject to negotiation and arbitration by a neutral competition authority.
Whilst this could improve efficiency in New Zealand by promoting efficient entry by innovative port service providers, it may only favour large, well-resourced providers, as the transaction costs of negotiating access could overwhelm the potential efficiencies.
Single events versus on-going competitive pressure
As much as possible, it would be desirable to create an environment where no party is forced into making particularly hard decisions through a single contract for total operations, around which opposition can be concentrated. It will be easier to secure that cooperation if they are not forced into making wholesale choices about different groups of workers.
Competition is a process. Over time, different stevedoring and marshalling companies may gain or lose market share at the margin, and in the process of competing for market share, they hold down prices and improve their service. When companies compete, they do not see themselves as fighting for survival on a daily basis. Employees know that their employer needs to stay competitive, but they do not feel that their jobs are under threat on a daily basis.
By contrast, the outcomes of tenders for total operations deliver the extreme result of competition: one firm and its employees are completely out, another firm and its employees are completely in. This means that attention is inevitably drawn to the outcome, rather than to the process of competition.
In this context, people who were extremely unhappy with the competitive outcome have little choice but to attack the process of competition itself—to prevent competition. By contrast, in situations where competition is at the margin, rather than for total operations, employers and employees are better off participating in the competitive process and staying efficient, rather than attacking the basis of competition.
It therefore seems important to try to avoid a single defining event around which opposition can be concentrated. The introduction of competition needs to consist of many little steps, to focus on introducing the means for competition to occur, without necessarily expecting or even wanting to see a pre-conceived notion of a “competitive” outcome occurring immediately. Which parties are involved in contracting services? While ports clearly have something to gain from competitive port services, the ultimate beneficiaries will be the shipping companies and the shippers. In many cases, however, the tendering process draws the focus entirely on the actions of the port.
Ports in New Zealand are able to decide which activities to open to competition and how competition should take place. In practice, they take various approaches to dealing with parties wanting to enter the markets for port services. Some ports elect to vertically

8
integrate and provide a range of port services, while others contract services out to competing third parties.
For example, on-board and crane and straddle operations are contracted out at Port Tauranga to two parties; C3 (its own JV company with Australian owned Asciano) and ISL, whereas these services are controlled by the Ports of Auckland. Tauranga also maintains more contestable markets for activities within the port, such as stevedoring and marshalling of break bulk cargoes. Table 3.1 shows how contestable some of the services at a sample of the major New Zealand ports.
Table 3.1: Contestability of Services at selected New Zealand Ports Stevedoring Marshaling Towage/Pilotage
Northland Port Corp
§ C3 Ltd § ISO § Northland Stevedoring
Services § Smart Cargo Logistics
§ Northport Ltd § C3 § ISO § Quality Marshalling
§ NorthTugs § Northland Port Corp
Port of Auckland
§ C3 § Wallace Ltd § Auckland Stevedoring
§ Port of Auckland
Port of Tauranga
§ C3 § ISO § Independent Stevedoring § NZ Marshalling &
Stevedoring § NZL Group § Endee Logistics
§ C3 § ISO § Independent Stevedoring § NZ Marshalling &
Stevedoring § NZL Group § Quality Marshalling
§ Port of Tauranga
Napier § C3 § ISO § Southern Cross
§ C3 § Quality Marshalling
§ Port of Napier
Lyttelton § Lyttelton Port Company § C3 § Lyttelton Stevedoring Services
§ Lyttelton Port Company
In commercial terms, there are two broad models for contestable provision of wharf-side services at a port. The traditional model, described in Figure 3.2 in relation to stevedoring and marshalling services, is how many overseas ports operate currently, particularly for container handling—the port procures port services and then on-sells them to shipping lines. The shipping line may still nominate which stevedore or marshaller they would like to use from a group, but the port would have more flexibility in deciding how to price the services of each of the contract holders. For example, it may add a constant margin to the prices offered by the stevedores and marshallers, or it may decide to vary the margin to capture some of the benefits of differential pricing by firms.

9
Figure 3.2: Retail Stevedoring and Marshalling Model
Under this option, the port operates as a retailer of stevedoring services. Stevedoring firms compete for the favour of the shipping lines, but also have an incentive to offer better “wholesale” price and better service to the port.
An alternative model, set out in Figure 3.3, grounds the relationship between the port and each stevedoring company in the traditional form of concession. The stevedoring company might (but not necessarily) pay the port for the privilege of gaining access, and the stevedoring company then charges each shipping company or shipper directly. The stevedoring charge can be negotiated between the shipper or shipping line and the stevedoring company.
Figure 3.3: Concession Stevedoring and Marshalling Model
This concession model is based on open access, rather than on competition between stevedoring and marshalling service providers for the privilege of getting a concession contract that then protects them from competition. A firm should therefore be able to gain a concession contract if it meets the minimum non-discriminatory quality requirements set out in the contract.
Each Stevedore and Marshaller operates under a detailed concession contract. The Port procures services on the basis of Shipper and Shipping Company nominations
Port
Stevedore/Marshaller Shipper
Shippers and Shipping companies nominate among Stevedores and Marshallers holding a concession and pay fees to the Port
Port offers Shippers and Shipping Companies a list of approved Stevedores and Marshallers from which they can nominate
Each Stevedore and Marshaller operates under a limited concession contract with the Port
Port
Stevedore/Marshaller
Shipper
Each Stevedore and Marshaller charges the Shipper or the Shipping Company directly.
Shippers and Shipping companies nominate among Stevedores and Marshallers holding concession and pay fees to the provider of their choice

10
There may be a standard concession fee, set at the same level for all participants, including any services provided by the port or any affiliate, in order to prevent the port owner from subsidising any of its other services. This may not, however, be necessary—the stevedore operators do not pay a concession fee at the Port of Tauranga, with the Port using competitive stevedoring to attract business and recover costs through land and storage charges, and wharfage and berthing fees.
The advantage of the concession model is that it can remove the port from the relationship between the shipping line and the stevedore or marshaller (there may still be a shipping agreement between the shipping line and the port, particularly for booked slots in container services). This would reduce the potential for industrial relations conflict, into which the port may be drawn. It also allows more freedom for shippers to choose who handles its goods, creating an opportunity for efficiency in service provision—particularly in bulk cargo which may have specialist handling or equipment requirements.
It is important that neither an incumbent stevedoring or marshalling operator, nor its employees, see themselves as being pushed out by particular ports. Rather, they should see themselves as competing for the favour of shipping lines and shippers. Any decision to choose one firm over another should as much as possible be in the hands of the shipper, particularly in bulk and break-bulk handling. This is less important for container shipping where cargo handling is a more homogenous service.
This results in the focus for purchasing wharf-side services shifting from ports to the ultimate beneficiaries of those services. In this context, the port could become an honest broker of the competitive process, while the shipping lines would take the responsibility for choosing a stevedoring and marshalling provider.
4 Trends in port investment and performance Ports form a vital link in the overall trading chain and, consequently, port efficiency can be an important factor for a nation to achieve a competitive advantage in an international market. Many in the freight industry, including ISO, believe that private sector participation in the ownership and operation of port infrastructure and services can help improve port efficiency.
The concentration and bargaining power of international shipping lines to play off competing ports against one another in terms of price and the facilities they provide, means that many efficiencies that are inherent to regions (based on their geographic location and previous investments) may be captured by overseas shipping companies and not be passed on to shippers, particularly exporters. Therefore, we consider it crucial that the Productivity Commission attempt to identify the relationship between ports’ ownership structure and efficiency relative to other ports, as well as the link between efficiency and the levels of contestability of different port services.
Productivity is the most informative measure of the efficiency of port or terminal operations, accounting for the amount of resource required to perform a given task in a given time. As a measure of the level of efficiency, productivity might represent how quickly containers or tonnes of bulk cargo are handled and how quickly vessels are turned around at ports. Alternatively, labour productivity may explain the efficiency of particular services within the port, such as stevedoring or marshalling, by dividing the output by a factor of gang-hours or full-time equivalent units. Efficiency of the port infrastructure may explain whether investment by the port owner is productive, for instance by tracking port throughput divided by crane hours or some other measurement

11
of capital intensity and comparing the CAPEX of particular ports with key efficiency indicators.
Charges may not be substantial, but the costs in terms of delay and reliability can be significant, due to the interconnectedness of different activities. This means that even when efficiency indicators are positive from a port perspective, port users’ complaints may still arise. Insofar as these complaints or constraints of exporter’s efficiency are not reflected in port efficiency indicators, supply chain management may be a better indicator of efficiency of activities within the port. For instance, the benefits provided by a clearer access regime would also impact on other parts of the transport network, particularly rail. Financial performance The profit performance of the top six ports by weight of throughput are shown in Figure 4.1, showing Auckland and Tauranga significantly outperforming the smaller ports.
Table 4.1: Port Financial Performance
Port Profit after tax in 2010 (000’s) Profit per tonne Auckland $37,200 $5.91 Lyttelton $9,289 $2.04 Napier $7,047 $2.50
New Plymouth $1,266 $0.32 Tauranga $49,403 $4.37
Whangarei $3,134 $0.43
Source: Port Company Annual Reports
Port of Tauranga paid out over $36 million in dividends ($3.20 per tonne), whereas Ports of Auckland paid $22 million ($3.49 per tonne). The retained earnings per tonne in Auckland ($2.41) were consequently more than twice those of Tauranga ($1.17). This disparity between retained earnings ratios could be due to the increased competition levels and associated efficiencies gained in the contestable services in Tauranga.
Waterside performance There are a number of widely accepted indicators that measure productivity levels at the waterline. These are frequently used overseas and provide good indications on the efficiency of the service providers and port operations, including:
§ Container TEUs
§ Berth occupancy rate
§ Number of ship calls
§ Average ship turnaround time
§ Number of ship movements or tonnes handled per hour in port, showing ship productivity, and
§ Average waiting time to berth.
There are a number of indicators of labour productivity at the port waterline. Many of these are based on container throughput, including the number of containers handled per working man hour. However, there are other measurements of labour productivity:

12
§ Injury rates (that result in lost working hours), and
§ Tonnes handled per working man hour.
Capital productivity can give an indication of the reasonableness of ports’ investment in infrastructure, as well as how committed a port owner is to fully utilising equipment by allowing competing service providers access. The net crane rate is most commonly applied by ports themselves, and shows the total number of loads handled, divided by the time the crane is in operation.
Investment levels are important indications of the quality and capacity of the infrastructure available at ports, and the capacity for growth. Investment can be valuable to service providers in achieving high efficiency levels, while under-investment can be detrimental. Indicators can be broad, so need to reflect where they are directed and whether they will facilitate the interests of exporters, or simply expand container capacity. Looking at revenue per tonne of actual total throughput can inform these questions.
One important indicator is berth occupancy. If berth occupancy is high and tonnes handled (per man-hour) low, additional CAPEX to increase berth space would not be required. Rather, efficiency improvements through more effective labour systems or technology improvements should be more effective. This is evidenced by the fact that there have been no additional berths built since 1990 after the port reforms, yet tonnage has continued to increase significantly. New Zealand port performance Studies by NZIER2 and Rockpoint3 have found that the Port of Tauranga has kept pace with international ports in terms of efficiency and productivity gains. In contrast, Ports of Auckland and Port Lyttelton have performed poorly in a key efficiency indicator of container handling. Figure 4.1 shows container handling performance, comparing Rockpoint’s findings and Australian data produced by the Federal Government.
2 NZIER (2010) Port Performance and Ownership, Report to the Local Government Forum, 9 August 2010 3 Rockpoint Corporate Finance Ltd (2010) New Zealand Port Sector Report
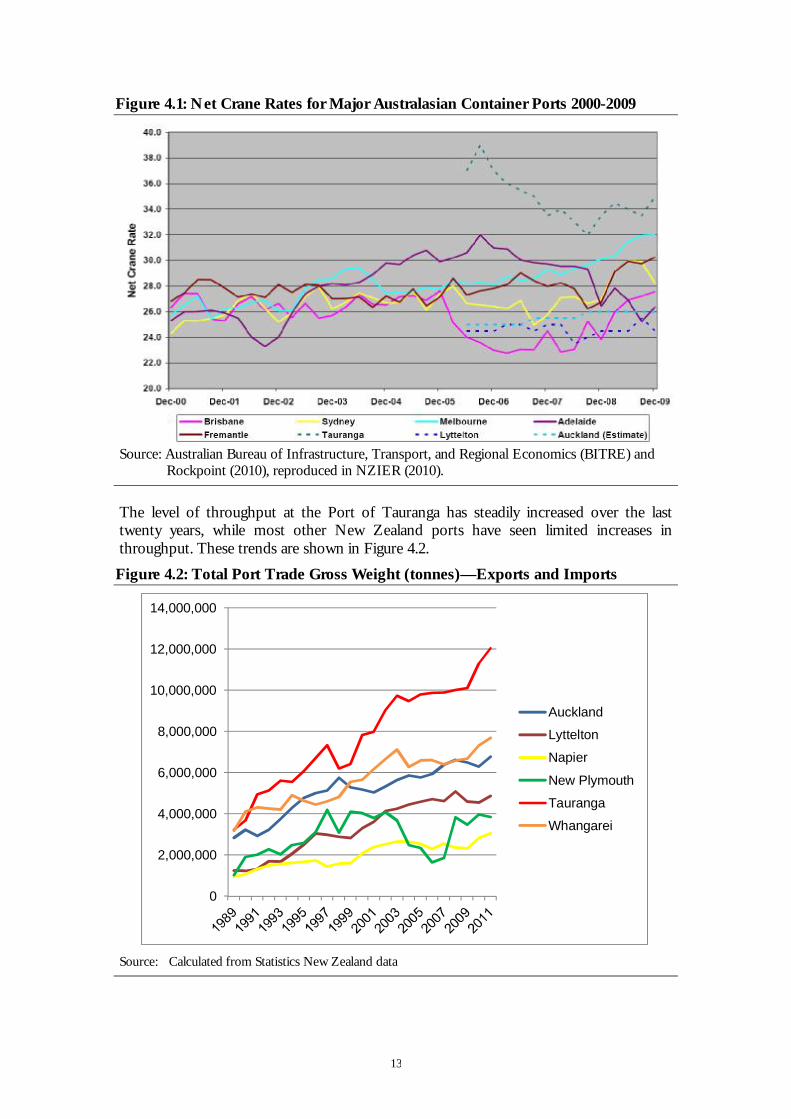
13
Figure 4.1: Net Crane Rates for Major Australasian Container Ports 2000-2009
Source: Australian Bureau of Infrastructure, Transport, and Regional Economics (BITRE) and
Rockpoint (2010), reproduced in NZIER (2010).
The level of throughput at the Port of Tauranga has steadily increased over the last twenty years, while most other New Zealand ports have seen limited increases in throughput. These trends are shown in Figure 4.2.
Figure 4.2: Total Port Trade Gross Weight (tonnes)—Exports and Imports
Source: Calculated from Statistics New Zealand data
0
2,000,000
4,000,000
6,000,000
8,000,000
10,000,000
12,000,000
14,000,000
Auckland
Lyttelton
Napier
New Plymouth
Tauranga
Whangarei

14
Much of the export volume growth has been in New Zealand’s traditional export cargo—high-volume, low-value, non-containerised shipments. While the proportion of non-containerised exports has reduced relative to higher-value containerised shipping, bulk and break-bulk shipping is still the backbone of New Zealand’s export sea-freight, and is likely to remain so for the foreseeable future. The massive growth in forestry exports from Tauranga is a significant potential source of the sort of port efficiency that is not currently well measured or understood in New Zealand. More research should therefore be undertaken in the bulk handling sector, due to the lack of publicly available information for a comprehensive efficiency comparison across ports, and the high volume and importance of bulk cargo to New Zealand’s export economy.
There are many factors that can be attributed to this contrast in growth over the last ten years, such as ownership differences, the development of inland port terminals, and inland congestion constraints. However, it is very likely that the contestability in services provided and the high level of private ownership at the Port of Tauranga has contributed greatly to its performance, relative to other ports. Most of the smaller ports that have limited or no competition for services provided at the port have had low productivity and limited growth in the volume of cargo. Comparative efficiency measures at ports in Ireland Ireland provides a useful comparison for New Zealand ports, and suggests that competition is best fostered between companies within the port rather than between ports. New Zealand and Ireland have a similar throughput and size of ports, in nations of a comparable size. Ireland’s total throughput is similar to New Zealand’s throughput in the year to June 2011 of approximately 50 million tonnes cargo. Dublin Port Company processes approximately 50 percent of Ireland’s trade, and two thirds of the containerised trade. Importantly, Dublin also operates a competitive business model within the Port itself, where eight terminals compete for business in the unitised sector. Unitised trade is comprised of lift-on-lift-off (Lo-Lo) and roll-on-roll-off (Ro-Ro), and accounts for over 80 percent of Dublin Port's trade.
Dublin Port Company’s experience shows that organisational structure within the port is of crucial significance to its efficient and successful operation, since a move from a service port to a landlord port structure resulted in increased operational efficiency and record profit generation. This has occurred in a landlord structure that is not “pure”, since it has retained and increased its commercial activities in activities which are not core, or even traditional port functions—including towage, refuelling, logistics training, and property development.
Dublin Port also shows that a state-owned organisation can operate as effectively as a privately owned corporation, if the incentives for efficient operation and mechanisms for contestable services are set for the benefit of the country’s economy (and principally the import and export economy), rather than short-term local or regional interests. Comparative efficiency measures at ports in Australia Australian ports are predominantly landlord ports with competition among private operators for access to services in the ports. Competition amongst marshallers and stevedores occurs between terminals and often through contracts within a terminal. The productivity levels of these Australian ports have increased steadily over the last 15 years. Stevedore and marshalling productivity levels are predominantly measured by the crane rate, vessel working rate and ship rate.

15
Figure 4.3: Stevedore Productivity for the Top Five Australian Ports 1996—2010
Source: BITRE, Waterline (July 2011)
Specific bulk handling productivity measures Other ports may also provide useful lessons, despite differences in volume and make-up of the cargo throughput. Unlike container handling, however, it is difficult to find standard measures of bulk cargo performance to be able to compare ports’ performance.
Many Australian ports have dedicated terminals for bulk handling. These bulk facilities, for example, Dalrymple Bay Coal Terminal in Queensland, are declared as ‘essential facilities’ and therefore must provide open access for third party service providers. In other states, competition for port bulk handling facilities is sufficient that third party access regimes are not in place.
While the scale of these terminals may never be seen in New Zealand, they provide useful lessons for New Zealand ports. Some of the efficiency resulting from specialised bulk handling facilities could be achieved in New Zealand, particularly if previous attempts at port rationalisation are revived.
Performance in Supply Chain Integration
Even when efficiency indicators are positive from a port perspective, port users’ complaints may still arise. Insofar as these complaints or constraints of exporter’s efficiency are not reflected in port efficiency indicators, supply chain management may be a better indicator of efficiency of activities within the port.
BITRE’s Waterline publication provides indicators of port and stevedoring productivity bi-annually, but as with many overseas benchmarking exercises, covers container trade more than bulk. Indicators include the number of time slots available in the vehicle booking system (VBS), and the usage rates of the VBS, providing an indication of the volume of cargo and the resources available to process the cargo from ships to inland transport, and vice versa. Other indicators that measure the performance of the supply chain are truck turnaround time at port and the average number of containers (or size of bulk load) per turnaround time for road and rail cargo.

16
5 Effect of labour laws on waterfront efficiency Inflexible labour practices and union activities remain an obstacle to future productivity improvements in New Zealand port services.
The Employment Contracts Act (ECA) was introduced in 1991 and spelled the end of national (multi-employer) collective bargaining in New Zealand’s ports and the introduction of individual contracts, allowing employers to choose who they contracted to supply labour for port services. This enabled flexible terms to be set for the provision of these services, particularly through a mix of permanent, part-time and casual work and a move to more flexible hours of operation—the traditional working day of 7am to 5pm was replaced by different shift configurations, with most ports now working 24 hours a day. ISO, for instance, utilises a 2 x 12 hour shift.
The liberalisation also enabled stevedores and marshallers to directly employ workers that were forward-looking and prepared to embrace new methods and technologies. Increasingly sophisticated information technology solutions to monitor logistics have driven down costs, improved services to cargo interests by increasing reliability, and reduced loading and trans-shipment time—reducing the length of the supply chain for New Zealand exporters.
In the break bulk market many of the potential reforms have been implemented, whereas in container terminals many of the labour efficiencies have not been realised despite a desire to introduce. The Employment Relations Act (ERA), introduced in 2000, rolled-back much of the potential for these reforms, and has led to some perverse consequences and general uncertainty about contracting in container terminals.
For instance, in 2007, Port of Napier offered a tender opportunity to its incumbent and external contractors. ISO, utilising labour organised by a rival union to the traditional CTU-aligned unions, offered contracting arrangements with the terminal operations, which the Port considered met all safety, productivity and pricing measures and offered better quality services to cargo interests. This led to aggressive CTU and ITF affiliated union opposition and picketing protests that prevented the agreement, derailing opportunities for improving efficiency in the Port of Napier. This had a chilling effect on other New Zealand ports trying to improve the productivity of their facilities, and led to the Port of Napier adopting a concession model of providing shippers with access to stevedoring services, rather than an exclusive procurement arrangement based on the retail model.
In January 2009, a situation arose for the Port of Tauranga at its Sulphur Point container terminal, following a breakdown in commercial negotiations between NZL Group Limited (“NZL”) and Port of Tauranga. The Port of Tauranga cancelled a lash/unlash terminal stevedoring contract it held with NZL. ISL, a stevedore already operating in the Sulphur Point terminal, was appointed to do the work by the Port of Tauranga. MUNZ who represented the NZL workers threatened the Port of Tauranga with work stoppage, which resulted in Port of Tauranga giving 50% of the work to C3, whose personnel are represented by MUNZ & the RMTU. Coupled to this dispute was the threat of industrial action in Tauranga and overseas to the shipping lines should they allow non-ITF affiliated labour to do the work. Indeed on one occasion a vessel did stop loading in Tauranga temporarily. This action appears to have been settled, with ISL and C3 working alongside in Sulphur Point.
Union action has also been directed at exporters themselves. When ISO competitively bid and won the Zespri Kiwifruit stevedoring and marshalling contract from the incumbent NZL Group (who employed CTU-affiliated union members) in 2010, the

17
Maritime Union of New Zealand (MUNZ) and the Rail and Maritime Transport Union (RMTU) agreed to develop a campaign to hinder seasonal kiwifruit contracts by all lawful means, rather than targeting the port. Both RMTU and the MUNZ stated that New Zealand port employers will be targeted nationally and internationally to ensure that marshalling and stevedoring work in New Zealand is done by workers who belong to a bona fide ITF-affiliated union.4
The impact of union power over how the ports and shippers are able to pursue future efficiencies and innovations in logistics has led to a lack of contestability in stevedoring and marshalling—particularly container cargo. Performance improvements could be reinvigorated through clearer transparency in how contracts are awarded, and by promoting the ability of exporters and shippers (primarily) and ports (secondarily) to access the full range of logistics providers without regard to union representation. The focus of bidding for stevedoring, marshalling, and other port activities that sustain employment opportunities in particular regions should be on the preferences of the shipper for innovation and productivity performance, rather than the preservation of a favoured union and short-term local politics. Especially where it can be shown that labour terms and conditions are not compromised with more efficient and effective stevedoring and marshalling companies.
6 Potential efficiency benefits of hub-and-spoke shipping configurations
Various options exist for long-term logistics infrastructure planning, including more strategic nodal and regional investment and market segmentation. The drive toward “hub ports” comes from increased size of vessels, meaning fewer calls and more trans-shipment. This will also impose dredging costs on the ports wanting to be hubs.
New Zealand is largely at mercy of what international shipping lines decide with port calls, but there may be an opportunity for a New Zealand port to become a hub. Globally, shipping lines are integrating into port operations, and such integration can be used to run ports in the interest of the dominant shipping line, to the detriment of importers and exporters. The emergence of dominant lines may require corresponding port consolidation to ensure that countervailing market power allows New Zealand ports to avoid over-investment in facilities and counter the threat of wholesale switch of port calls.
The key risk is trans-shipment delays for New Zealand cargoes. If short-term competition between domestic ports prevents the emergence of a New Zealand hub, there is a risk that New Zealand supply chain will lengthen as imports and exports will transit through an Australian hub. Aside from additional risks from transhipment, this would expose New Zealand’s logistics chain to port operating environment with far less flexible labour arrangements and risks of industrial disruption.
From a freight operator’s perspective, a change to a hub and spoke configuration could lead to a substantial realignment of investment requirements among NZ ports. For example, if Brisbane becomes regional hub, there may be a more equal distribution of spokes going to New Zealand regional ports, and less to Auckland and Tauranga. To make either Auckland or Tauranga a regional hub would require additional investment.
4 Comments by International Transport Workers Federation (ITF) President Paddy Crumlin, at the November 2010
ITF meeting in London

18
Apart from trans-shipment delay risk, this is not necessarily bad—efficient flow of cargo by shipping between ports would minimise road traffic (and CO2 emissions) and reduce the cost of inland freight by rail. However, since it risks stranding capital already invested in Auckland and Tauranga, it would require shorter payback periods for investment projects. Higher hurdle rates of return could inhibit less future investment in port infrastructure, and a lower capital intensity of port activities.
An opportunity may exist if hub and spoke configurations are applied on a supply chain basis, rather than to total cargo lines. A New Zealand hub for specialist break-bulk cargo, such as the Port of Tauranga, could be fed by coastal shipping from regional feeder ports, and could be separate from a container hub—given the different composition of New Zealand’s inward and outbound cargo.
This would require ensuring suitable sizes and weather capabilities of coastal vessels, barges and other similar vessels, along with an increase in port infrastructure for cost efficient loading and unloading. This could achieve efficiencies by removing large portions of road and rail transport to reduce congestion, and allow a certain amount of concentration of infrastructure investment and stevedoring and marshalling operations at a large New Zealand bulk cargo hub, catering to exporting demands of particular shippers.

Appendix A The table below shows the questions posed by the Productivity Commission in its Issues Paper. This note aims to respond to the questions shaded grey.
Table: Questions asked by the Commission’s Issues Paper
Question 1 Are there important issues that may be overlooked as a result of adopting an economic efficiency perspective for this inquiry?
Context Question 2 Is the framework described in Section 3.2 appropriate for this inquiry? Are there any important issues that might be missed? Question 3 Which components and component interfaces warrant greater attention? What is the evidence that they are inefficient? What contribution could changes make to an improvement in the overall efficiency of the freight system? Question 4 What environmental considerations should fall within the scope of this inquiry? What issues are of particular importance?
Efficiency of individual components Question 5 To what extent is there effective competition for customers between New Zealand ports? Has this led to lower prices and incentives for productivity improvements? Question 6 What are the most appropriate and reliable data available to measure port performance and productivity in container handling?
Question 7 What are the most appropriate and reliable data available to measure port efficiency and productivity in handling bulk cargo?
Question 8 Which overseas ports are appropriate comparators for New Zealand port performance? On what basis should this selection be made?
Question 9 Did port productivity improve during the 1990s? What were the drivers of those improvements?
Question 10 Did the rate of productivity improvements flatten during the 2000s? Why? What might reinvigorate performance improvement?
Question 11 What is the most appropriate way to measure port profitability? What is an appropriate rate of return on assets and equity?
Question 12 Is there evidence of a systemic problem of low port profitability? Or conversely, excessive profitability?
Question 13 What levels of investment have ports undertaken in recent years? Are they consistent with accessible and efficient services to exporters and importers? Is there an over- or under-investment problem in ports?
Question 14 Does New Zealand have too many ports for a small country? If so, what barriers are inhibiting rationalisation?
Question 15 Has local-authority ownership of majority stakes in New Zealand’s commercial ports inhibited, enhanced or been neutral for the

20
development of a more efficient and productive port sector?
Question 16 What changes in governance, regulations or ownership would offer the best means to improve port performance for exporters and importers?
Question 17 How much variation in the efficiency and productivity performance of ports is explained by the way that within-port activities are organised? Do ‘contracting out’ and ‘landlord’ models offer a way to increase competition for the benefit of exporters and importers?
Question 18 To what extent do inflexible labour practices and difficulties in employer union relationships remain an obstacle to lifting efficiency and productivity at New Zealand ports?
Question 19 From the perspective of New Zealand importers and exporters, to what extent is the international shipping industry competitive? Question 20 To what extent have collaboration agreements between international sea carriers been helpful or harmful to the interests of New Zealand importers and exporters? Question 21 What is the basis for the different regulatory treatment of imports and exports under the Commerce Act and Shipping Act? Is this differential treatment justified? Question 22 Have any actions (foreshadowed or actual) been undertaken under the Shipping Act 1987? Does the Act deter unfair practices?
Question 23 Would the Commerce Commission be better placed than the Minister of Transport to oversee the regulation of international shipping services?
Question 24 To what extent do the current regulatory and competition regimes that affect international sea freight transport services work well or not for New Zealand exporters and importers? Question 25 How do international shipping conferences permitted under the Shipping Act 1987 affect the accessibility and efficiency of sea freight services available to New Zealand exporters and importers? How strong or weak is the case for the exemption of conferences from the competition provisions of the Commerce Act?
Question 26 What lessons can New Zealand learn from the different ways that competition law and regulators in other jurisdictions deal with international sea freight services? Question 27 Are Auckland, Christchurch and Wellington airports subject to competitive pressure for the air-freight related services they provide? Do they exert market power to the detriment of New Zealand exporters and importers?
Question 28 Do current ownership and governance arrangements of New Zealand’s international freight airports have any significant positive or negative effects on their long-term efficient configuration and operation, with

21
respect to the supply of freight services?
Question 29 The objective of a port company under the Port Companies Act is to ‘operate as a successful business’. Should airport companies owned by local authorities have the same single objective rather than the multiple objectives specified in the Local Government Act? Question 30 What levels of investment have Auckland and Christchurch airports undertaken in international freight, and are they consistent with accessible and efficient services for New Zealand exporters and importers?
Question 31 Should the future size and shape of New Zealand air freight services be left to market forces and individual airport owners, or do lumpiness and interdependence (including with investments in connecting parts of the overall supply chain) call for a more deliberately coordinated approach? Question 32 What are the most appropriate measures of airport performance in international air freight? Can you assist the Commission by providing data that compares New Zealand airports against others? Question 33 Are there opportunities to introduce or increase competition in the provision of air freight-related services at airports? Would such competition lead to better outcomes? Question 34 Is the existing and planned Commerce Commission regulation of airports sufficient to restrain monopoly pricing and induce an efficient level of investment? If not, what should change? Question 35 To what extent is the international air freight industry competitive?
Question 36 Are there specific air freight routes to or from New Zealand with low levels of competition? Is there evidence of overpricing or poor service levels on these routes? Question 37 How do bilateral air services agreements affect the accessibility and efficiency of air freight services available to New Zealand exporters and importers?
Question 38 What explanations exist for the different treatment of international air freight in the Civil Aviation Act compared with the normal competition requirements of the Commerce Act? Do the objectives of the current regulatory treatment continue to be justified? Question 39 Should the regulatory functions in Part 9 of the Civil Aviation Act be the responsibility of the Commerce Commission rather than the Minister of Transport?
Question 40 Does the Cargo Agents’ Commission Regime perform an active and useful function in international air freight services? Who does it benefit? Is the exemption from the Commerce Act required to achieve that function? Question 41 Has S.90 of the Civil Aviation Act been used in practice? What are the arguments for retention of the ability of the Minister to issue a tariff?

22
Question 42 To what extent are the current regulatory arrangements adequate to deal with the investigation and prosecution of collusive behaviour in international air freight services?
Question 43 Do the current regulatory and competition regimes that affect international air freight transport services work well, or not, for New Zealand exporters and importers?
Question 44 Is there a case for the different regulatory treatment of air freight services vs. sea freight services?
Question 45 What lessons can New Zealand learn from the different ways that competition law and regulators in other countries deal with international air freight services?
Question 46 What are the typical customs and biosecurity costs faced by exporters and importers? How are those costs broken down? Is there scope to reduce them?
Question 47 Do New Zealand’s customs and biosecurity systems deliver the required outcomes efficiently? What initiatives might improve efficiency and effectiveness?
Question 48 Does the World Bank’s analysis fit with the experience of importers and exporters? What opportunities are there to eliminate and/or streamline documents? Would this make a material difference in the total cost or speed of the logistics chain?
Question 49 Are there any measures that New Zealand could undertake to reduce the security-related costs imposed on exporters and importers?
Question 50 What transaction costs are associated with import tariffs? Are there administrative or other changes that could improve the efficiency of tariff collection?
Question 51 What changes in domestic transport institutions, policies and regulations might lead to the greatest improvements in the economic efficiency of the international logistics chain?
Question 52 How competitive is the freight forwarding industry that serves New Zealand exporters and importers? Do the recent Commerce Commission investigations of a number of firms indicate that there are systemic problems, or that the regulatory and competition regime is working well?
Efficiency of interfaces between components Question 53 What are the costs of transit time to importers and exporters? Question 54 What sources of delay contribute to transit time? How might those delays be efficiently reduced?
Question 55 Are there potential efficiency gains from vertical integration in New Zealand’s international sea freight services? What are the disadvantages? What might need to change in order to allow or encourage greater vertical integration?
Question 56 Are there potential efficiency gains from the vertical

23
unbundling of specific components or activities in New Zealand’s international sea freight services? What are the disadvantages?
Question 55 Are there potential efficiency gains from vertical integration in New Zealand’s international sea freight services? What are the disadvantages? What might need to change in order to allow or encourage greater vertical integration? Question 56 Are there potential efficiency gains from the vertical unbundling of specific components or activities in New Zealand’s international sea freight services? What are the disadvantages? Question 57 Should decisions on investments in ports and in the associated infrastructure links to ports be left to the judgements of the individual suppliers of the separate components? Or would some sort of overall strategic plan provide useful guidance and some assurance that complementary investments will happen?
Question 58 What is the scope for greater consolidation of ports, greater vertical integration of ports with domestic transport operators, or more use of long-term agreements between shippers and port companies, as possible means to overcome coordination problems and achieve more efficient international supply chains? Question 59 Are there barriers to the negotiation of efficient agreements between ports and shipping lines?
Question 60 Is there an asymmetry of bargaining power between ports and shipping lines? If so, what is the impact of this asymmetry? Are there any regulatory measures that might reduce the asymmetry?
Question 61 Are the time costs associated with international air freight incorporated into current road infrastructure planning? To what extent should they be?
Question 62 Do domestic air links work as an effective feeder for international air freight services? What could be improved?
Efficiency of the logistics chain Question 63 Where in the logistics chain are time delays occurring, and how might they be addressed? Question 64 Does the imbalance of container use create significant costs? What practical measures might efficiently reduce these costs?
Question 65 What are the potential benefits and risks for New Zealand from a move to hub-and-spoke configurations for international shipping? Are there actions New Zealand can take to increase the likelihood of benefits or to manage the risks?
Question 66 To what extent do formal and informal alliances between airlines improve or detract from the efficiency of international air freight services? Are there opportunities to improve outcomes? Question 67 What measures might improve the overall system efficiency

24
of the logistics chain for international air freight?
Question 68 Are import and export opportunities excluded or constrained by the lack of access to international freight transport services? Are there changes in institutions, policies or regulations that could lead to better outcomes?
Question 69 Is there scope for increased sharing of operational data between transport firms to achieve improved coordination and efficiency? How might this be achieved?
Question 70 Do the restrictive trade practices provisions of the Commerce Act deter the efficient sharing of operational data?
Question 71 Is there a role for government to require the disclosure of performance measures in specific components, and to collate and publish that data?
Question 72 Given likely future trends in trading patterns and transport technology, will the reliability, speed and efficiency of international logistics services be adequate for New Zealand’s interests? If not, what can be done to leverage opportunities and mitigate risks?
Question 73 What is the best way to achieve efficient decisions and coordination for the large, lumpy and interdependent investments that typically occur along international freight supply chains?
Question 74 What factors would favour the choice of decentralised vs. centralised strategic planning?
Question 75 What costs exist in the various components of the international freight transport supply chain and how have they been changing over time? How do these figures compare with those for other relevant comparator countries?
Question 76 What productivity levels exist in the various components of the international freight transport supply chain and how have they been changing over time? How do these figures compare with those for other relevant comparator countries?
Question 77 Are you able to contribute data that would assist the Commission?
Next steps Question 78 Has this issues paper covered the key issues? What other questions need to be asked?
Question 79 What are the most important issues for the Commission to focus on to achieve the greatest improvements in the efficiency and productivity of New Zealand’s international freight transport services?
Source: Productivity Commission (2011) Issues Paper: International Freight Transport Services