iso review of report: “comparative economic and
TRANSCRIPT
1
ISO review of report: “Comparative Economic and Reliability Study Final Report, AV Clearview Transmission Project and Coolwater-Lugo (South of Kramer
Upgrade) LGIA Project Reliability and Economic Assessment,” dated February 5, 2013 and submitted by Critical Path Transmission, LLC.
Introduction Critical Path Transmission, LLC. submitted the above titled report to the ISO on February 12, 2013 together with its preliminary comments on the ISO’s February 11 stakeholder presentation and draft 2012/2013 transmission plan which had been distributed on February 1. This review accompanies the ISO’s response to those stakeholder comments. The ISO’s review of the report submitted by Critical Path Transmission (the “report”) is summarized in three phases:
- First, the specific assumptions and methodologies that the ISO considers problematic are identified, and the benefits estimates that these assumptions affect are set out,
- Second, the specific excerpts from the report highlighting the problematic areas are
tabulated, and an ISO comment provided,
- Third, the benefits identified in the report are tabulated, and ISO comments on the impact of those benefits are provided.
Section 1 Problematic assumptions The ISO has reviewed the assumptions underpinning the report’s analysis, and identified the following issues and impacts:
1. Treatment of Special Protection Systems to interconnect generation
The report sets out the assumption that additional special protection systems are not acceptable beyond the report’s estimation of existing levels to enable additional Kramer area generation. For the sake of what is perceived to be a fair comparison, the same existing amount of special protection generation shedding is assumed in assessing the amount of generation the AV Clearview project and the Coolwater-Lugo project can enable. This assumption has the effect of holding the report’s estimation of the amount of renewable generation in the Kramer area to approximately 435 MW when studying the Coolwater-Lugo project, below the amounts set out in the CPUC’s base portfolio.(Page 68, Table D.1)) To the contrary, special protection systems can be used and are used to enable interconnection of generation, and are used within all relevant planning criteria and standards. The ISO’s planning standards set out the parameters under which special protection systems may be used, and limit their use to tripping 1150 MW for a single contingency, and 1400 MW for a double contingency.

2
The report’s assumption is a critical flaw, as it affects the bulk of the difference in benefits identified in the report attributed to the AV Clearview project in achieving 33 percent RPS by 2020:
- The production simulation economic benefits attributed to the AV Clearview project’s impact on Path 26 also reflect in part the incorrectly attributed benefits of providing access to additional generation (Page 14, Table 8, notes 6 through 9)
- It also leads to the incorrect criticism that the Coolwater-Lugo project does not meet the needs of the CPUC base portfolios. (page 13, Table 7, note 5)
- It leads to the erroneous conclusion that the AV Clearview project can interconnect 3 times more generation than the Coolwater-Lugo project. (page 11, item 5)
- It leads to the erroneous conclusion that the Kramer-Lugo transmission would need to be reinforced if Coolwater-Lugo is built instead of the AV Clearview project. (page 21, section 4.4.1)
- It leads to erroneous assumption that additional transmission is required to achieve the CPUC portfolios. (page 22, section 4.5)
- It leads to an erroneous comparison of Resource Adequacy values (page 24, Table 10, first line – 2020 RPS RA Benefit) which would be double-counted in any event if the benefit of avoiding transmission to reach other generation has already been identified as a benefit of the AV Clearview project.
2. Different study years chosen for production simulation analysis
The report sets out two different study years for studying each project, and compares each project against a base case without that project. Besides the concern with the assumptions about renewable generation accessible through each project, this introduces a host of other differences in generation availability, load levels, and other system configurations. 2017 was chosen to study the AV Clearview project, and 2019 to study the Coolwater-Lugo project. (page 36, section C.3.1) In contrast, the ISO’s analysis was based on a straightforward comparison; studying the same case with one project at the CPUC portfolio levels, and then replacing it with the other project, holding all other study assumptions constant. Potential benefits associated with additional generation beyond portfolio amounts being deliverable were discussed separately. By shifting a large number of parameters simultaneously between the two cases, and at a time when the generation fleet is subject to rapid change due to compliance with once-through cooling generation requirements, no meaningful comparison can be drawn. Attributing all of the benefits to assumed impacts on Path 26 is unwarranted. As noted in the figure below, the point of interconnection into the Windhub substation proposed for the AV Clearview project is actually already south of Path 26, so any impact on Path 26 could consist only of possibly assisting in some incidental balancing of flows on the network.

3
Further, ISO analysis in the 2012/2013 planning cycle and previous planning cycles indicated that reduced congestion provided little economic relief to ISO customers overall even when studying mitigations that completely eliminated congestion on Path 26. The economic benefit to customers south of Path 26 due to slightly reduced prices was largely offset by the resulting price increases to customers north of Path 26. The report provides no ability to separate out the impacts of one set of changes from another, so there is no basis to assume that the differences in economics is due to the AV Clearview project being superior in mitigating Path 26 congestion.
3. The need to reinforce Path 26
The report assumes that Path 26 congestion would be addressed at some point in the future, regardless of the cost effectiveness of this reinforcement and attributes benefits to AV Clearview of avoiding the cost of an alternative means to achieve those benefits. (These also appear layered upon the benefits of reduced congestion.) (Page 14, Table 8, lines (1) and (3), and notes 10 and 11) The ISO’s analysis, upon which this assumption is based, identified an option to reinforce Path 26 of $180 million for study purposes in the 2012/2013 transmission planning cycle. As the economic benefits were determined to be near zero, the project has not been recommended for approval. It is not reasonable to attribute to AV Clearview the benefits of avoiding a capital project which would not be pursued in any event.
Vincent
Midway
Windhub
Los Banos
Gates
Antelope
Path 26
Tehachapi Renewable
Transmission Project
(TRTP)
Whirlwind
Diablo Canyon
500 kV
Nuclear generation
Legend:
Gas-fired generation
Congested element
4
Further, it is not clear from the levelized method of comparing costs, if the production simulation benefits calculated in the report were only attributed to the AV Clearview project until the Path 26 reinforcement project is assumed to be in service, and then replaced with the lower annual costs of the reinforcement, or if the AV Clearview project is being attributed both benefits simultaneously. As the ISO does not agree that either set of benefits is appropriate, we have not investigated the potential double-counting further.
4. The need for reactive support in the Inyokern, Coso, Downs and Randsburg 115 kV
Substations
The report assumes that the reactive support will be required, and in proximity such that the HVDC convertor can provide the necessary support. The ISO has noted that the requirement for this support is very location specific, and will depend on the ultimate exact location of the generation that does move forward in the area; to the extent it is required in the future, the ISO expects to address this need through the generator interconnection process.
5. Post 2020 needs will be met by Kramer area generation
The report assumes that future generation requirements to maintain 33 percent will be met largely from the Kramer area – half of a 1.5% load growth – resulting in the additional generation being fully utilized by 2023. (page 24, section 5.2) It is unlikely that half of this growth will be met from a single area. Also, section 5.1 already attributes to the project an avoided cost of building into another area to obtain this generation; it would be double-counting to attribute both benefits to AV Clearview. (page 23, section 5.1) Further, both evaluations are based on assuming the Coolwater-Lugo project can only accommodate an additional 435 MW of renewable generation, instead of the full 765 MW CPUC portfolio amount for the Kramer area.
6. The South of Kramer project and the Coolwater-Lugo project are synonymous (which
they are not)
The report purports to compare the AV Clearview project to the project identified as South of Kramer estimated at a cost of $480 million. The comparison in fact needs to be made to the Coolwater-Lugo project, which is estimated at $435 million. The South of Kramer project inlcuded a Jasper substation as well as the Coolwater-Lugo 230 kV transmission line and at one time included a Lugo 500/230 kV transformer. The $480 million estimate correctly reflects the removal of the Lugo 500/230 kV transformer. However, the Jasper substation is required whether AV Clearview or Coolwater-Lugo proceeds, and as a result should either be added to the AV Clearview costs or removed from $480 million estimate. Removing the Jasper substation reduces the estimate to $435 million.

5
In reviewing the overall impact of the assumptions, the ISO believes the stated benefits are higher than are reasonably likely to occur. The ISO continues to recognize, however, that the AV Clearview project can provide access to additional capacity, beyond the 2020 CPUC portfolio amounts, and that while it is difficult to quantify, the operational flexibility may provide further benefits in the future.
6
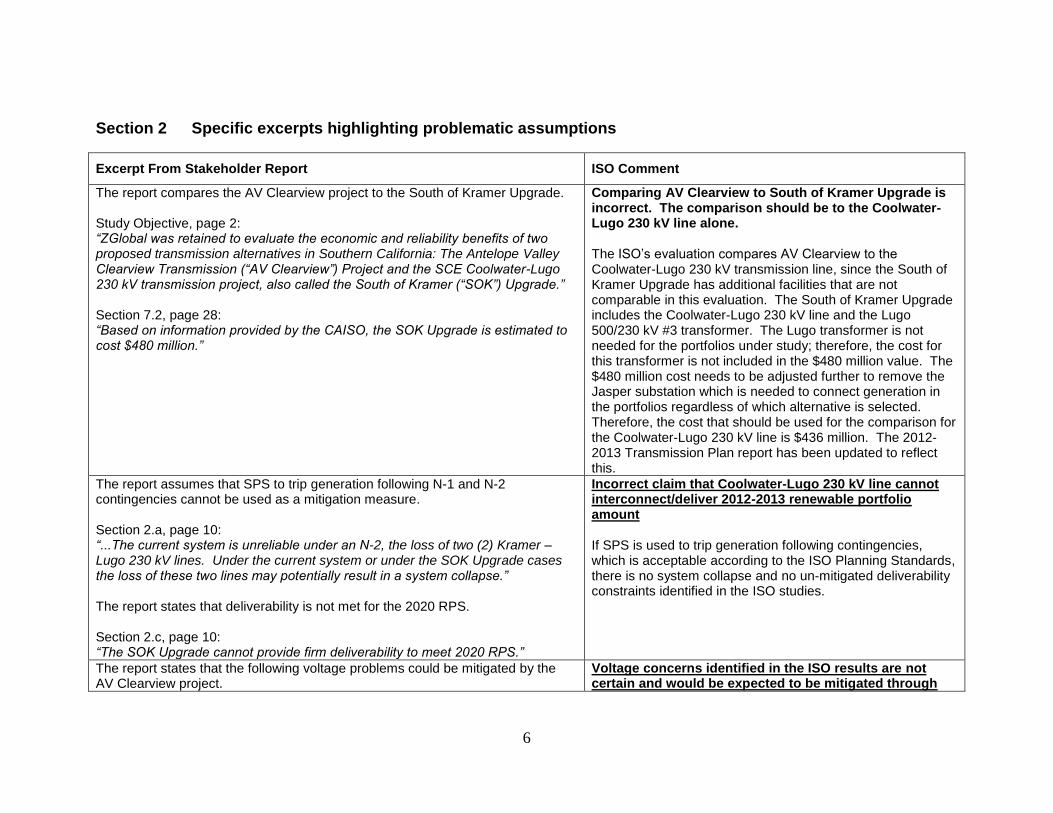
Section 2 Specific excerpts highlighting problematic assumptions
Excerpt From Stakeholder Report ISO Comment
The report compares the AV Clearview project to the South of Kramer Upgrade.
Study Objective, page 2: “ZGlobal was retained to evaluate the economic and reliability benefits of two proposed transmission alternatives in Southern California: The Antelope Valley Clearview Transmission (“AV Clearview”) Project and the SCE Coolwater-Lugo 230 kV transmission project, also called the South of Kramer (“SOK”) Upgrade.”
Section 7.2, page 28: “Based on information provided by the CAISO, the SOK Upgrade is estimated to cost $480 million.”
Comparing AV Clearview to South of Kramer Upgrade is incorrect. The comparison should be to the Coolwater-Lugo 230 kV line alone. The ISO’s evaluation compares AV Clearview to the Coolwater-Lugo 230 kV transmission line, since the South of Kramer Upgrade has additional facilities that are not comparable in this evaluation. The South of Kramer Upgrade includes the Coolwater-Lugo 230 kV line and the Lugo 500/230 kV #3 transformer. The Lugo transformer is not needed for the portfolios under study; therefore, the cost for this transformer is not included in the $480 million value. The $480 million cost needs to be adjusted further to remove the Jasper substation which is needed to connect generation in the portfolios regardless of which alternative is selected. Therefore, the cost that should be used for the comparison for the Coolwater-Lugo 230 kV line is $436 million. The 2012-2013 Transmission Plan report has been updated to reflect this.
The report assumes that SPS to trip generation following N-1 and N-2 contingencies cannot be used as a mitigation measure. Section 2.a, page 10: “...The current system is unreliable under an N-2, the loss of two (2) Kramer – Lugo 230 kV lines. Under the current system or under the SOK Upgrade cases the loss of these two lines may potentially result in a system collapse.” The report states that deliverability is not met for the 2020 RPS.
Section 2.c, page 10: “The SOK Upgrade cannot provide firm deliverability to meet 2020 RPS.”
Incorrect claim that Coolwater-Lugo 230 kV line cannot interconnect/deliver 2012-2013 renewable portfolio amount If SPS is used to trip generation following contingencies, which is acceptable according to the ISO Planning Standards, there is no system collapse and no un-mitigated deliverability constraints identified in the ISO studies.
The report states that the following voltage problems could be mitigated by the AV Clearview project.
Voltage concerns identified in the ISO results are not certain and would be expected to be mitigated through
7
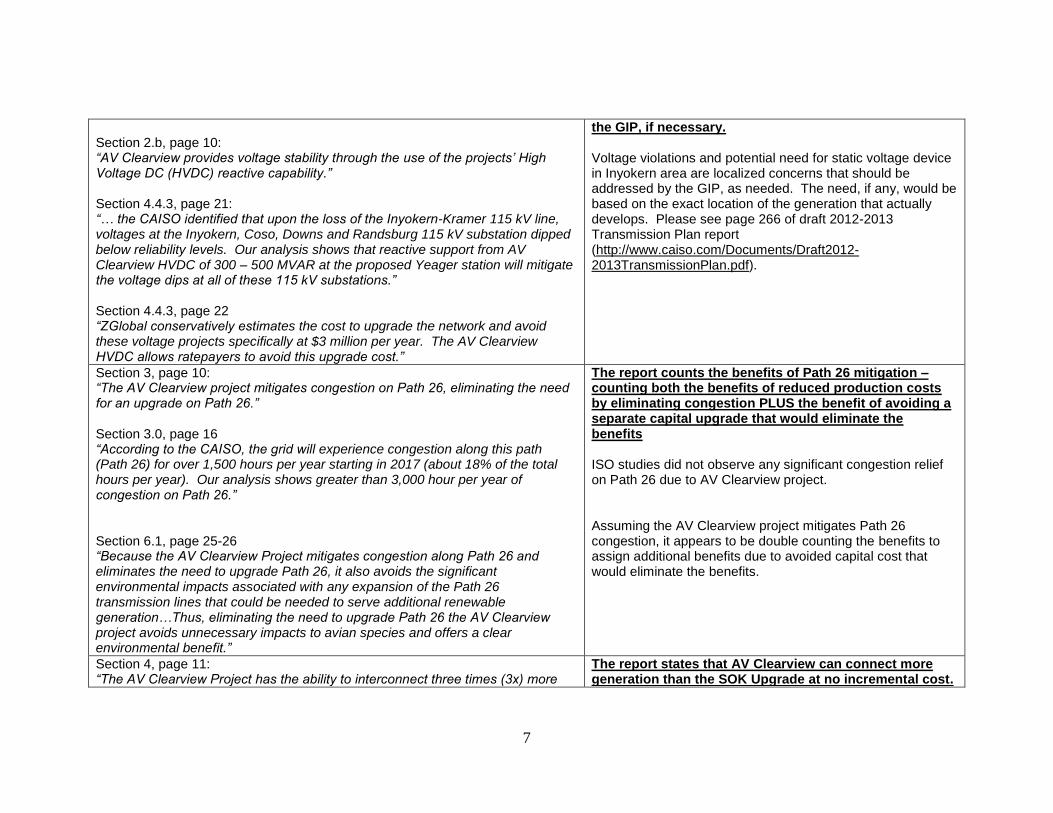
Section 2.b, page 10: “AV Clearview provides voltage stability through the use of the projects’ High Voltage DC (HVDC) reactive capability.”
Section 4.4.3, page 21: “… the CAISO identified that upon the loss of the Inyokern-Kramer 115 kV line, voltages at the Inyokern, Coso, Downs and Randsburg 115 kV substation dipped below reliability levels. Our analysis shows that reactive support from AV Clearview HVDC of 300 – 500 MVAR at the proposed Yeager station will mitigate the voltage dips at all of these 115 kV substations.”
Section 4.4.3, page 22 “ZGlobal conservatively estimates the cost to upgrade the network and avoid these voltage projects specifically at $3 million per year. The AV Clearview HVDC allows ratepayers to avoid this upgrade cost.”
the GIP, if necessary. Voltage violations and potential need for static voltage device in Inyokern area are localized concerns that should be addressed by the GIP, as needed. The need, if any, would be based on the exact location of the generation that actually develops. Please see page 266 of draft 2012-2013 Transmission Plan report (http://www.caiso.com/Documents/Draft2012-2013TransmissionPlan.pdf).
Section 3, page 10: “The AV Clearview project mitigates congestion on Path 26, eliminating the need for an upgrade on Path 26.”
Section 3.0, page 16 “According to the CAISO, the grid will experience congestion along this path (Path 26) for over 1,500 hours per year starting in 2017 (about 18% of the total hours per year). Our analysis shows greater than 3,000 hour per year of congestion on Path 26.” Section 6.1, page 25-26 “Because the AV Clearview Project mitigates congestion along Path 26 and eliminates the need to upgrade Path 26, it also avoids the significant environmental impacts associated with any expansion of the Path 26 transmission lines that could be needed to serve additional renewable generation…Thus, eliminating the need to upgrade Path 26 the AV Clearview project avoids unnecessary impacts to avian species and offers a clear environmental benefit.”
The report counts the benefits of Path 26 mitigation – counting both the benefits of reduced production costs by eliminating congestion PLUS the benefit of avoiding a separate capital upgrade that would eliminate the benefits ISO studies did not observe any significant congestion relief on Path 26 due to AV Clearview project. Assuming the AV Clearview project mitigates Path 26 congestion, it appears to be double counting the benefits to assign additional benefits due to avoided capital cost that would eliminate the benefits.
Section 4, page 11: “The AV Clearview Project has the ability to interconnect three times (3x) more
The report states that AV Clearview can connect more generation than the SOK Upgrade at no incremental cost.
8
generation than the SOK Upgrade at no increment cost, which is an important and prudent planning criterion.”
Section A.1, page 30: “The estimated AV Clearview Project construction cost for the 1000 MW HVDC line… is estimated at approximately $670 million.”
Section A.2, page 32: “Project cost for the 2,000 MW HVDC line… is under review.”
Since the cost for AV Clearview baseline case is higher than the cost for Coolwater-Lugo 230 kV alternative (comparing to AV Clearview to SOK Upgrade is not comparable as discussed above), it is incorrect to say that AV Clearview can connect more generation at no incremental cost.
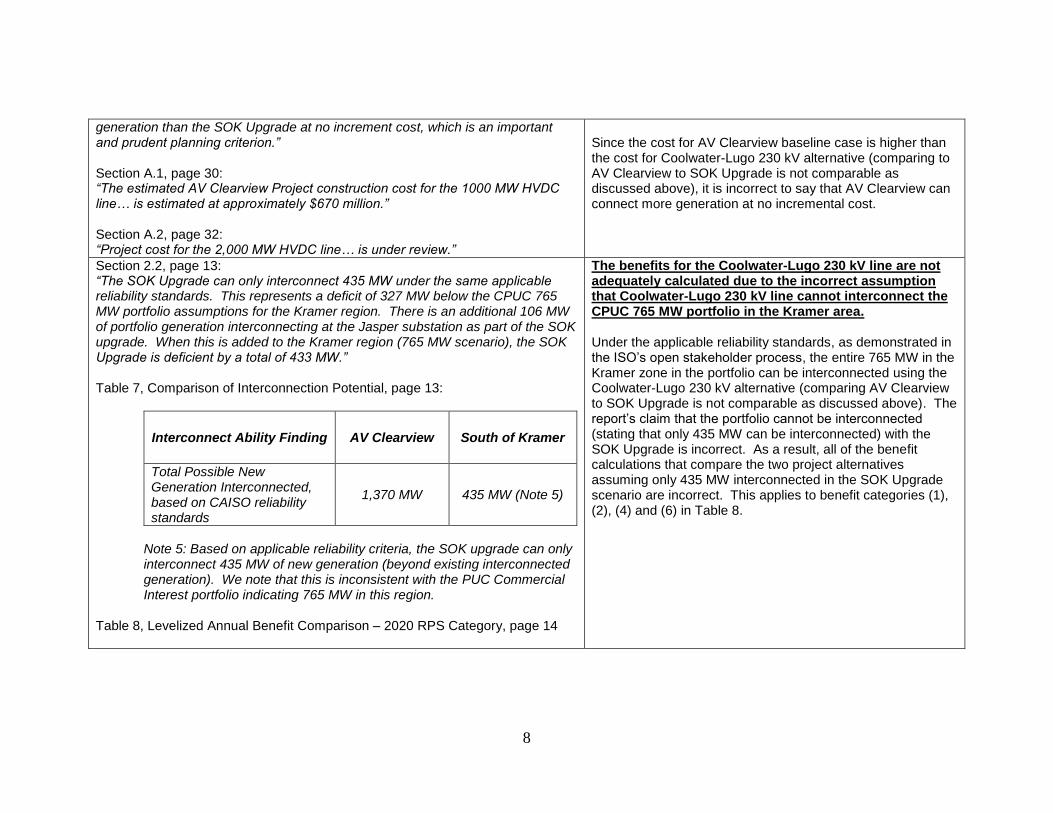
Section 2.2, page 13: “The SOK Upgrade can only interconnect 435 MW under the same applicable reliability standards. This represents a deficit of 327 MW below the CPUC 765 MW portfolio assumptions for the Kramer region. There is an additional 106 MW of portfolio generation interconnecting at the Jasper substation as part of the SOK upgrade. When this is added to the Kramer region (765 MW scenario), the SOK Upgrade is deficient by a total of 433 MW.”
Table 7, Comparison of Interconnection Potential, page 13:
Interconnect Ability Finding AV Clearview South of Kramer
Total Possible New Generation Interconnected, based on CAISO reliability standards
1,370 MW 435 MW (Note 5)
Note 5: Based on applicable reliability criteria, the SOK upgrade can only interconnect 435 MW of new generation (beyond existing interconnected generation). We note that this is inconsistent with the PUC Commercial Interest portfolio indicating 765 MW in this region.
Table 8, Levelized Annual Benefit Comparison – 2020 RPS Category, page 14
The benefits for the Coolwater-Lugo 230 kV line are not adequately calculated due to the incorrect assumption that Coolwater-Lugo 230 kV line cannot interconnect the CPUC 765 MW portfolio in the Kramer area. Under the applicable reliability standards, as demonstrated in the ISO’s open stakeholder process, the entire 765 MW in the Kramer zone in the portfolio can be interconnected using the Coolwater-Lugo 230 kV alternative (comparing AV Clearview to SOK Upgrade is not comparable as discussed above). The report’s claim that the portfolio cannot be interconnected (stating that only 435 MW can be interconnected) with the SOK Upgrade is incorrect. As a result, all of the benefit calculations that compare the two project alternatives assuming only 435 MW interconnected in the SOK Upgrade scenario are incorrect. This applies to benefit categories (1), (2), (4) and (6) in Table 8.
9
Benefit Categories
Benefit
AV Clearview
Project ($2017
million/year)
SOK Upgrade with RAS
($2017 million/year)
Section
(1) Energy Production Cost Savings
$140 - $150 Note 6
$78 - $85 Note 7
4.1
(2)
Decrease in the Cost of Capacity – Resource Adequacy
$11 Note 8
$6 Note 9
4.2
(3) Avoid Upgrade to Path 26
$27 Note 10
0 Note 11
4.3
(4) Avoid Other Needed Upgrades
$14 - $39 0 4.4
(5)
Enhance System Operational Flexibility
Many flexibilities
Limited flexibilities
4.4
(6)
Avoid Incremental Transmission Developments to meet the PUC Portfolio in Kramer Area
N/A -$37
Note 12 4.5
Total Quantifiab
le Year 2020
Benefits
$192 - $227 $44 - $54
Note 6: Based on 765 MW of new renewable at the Kramer zone connecting to the AV Clearview Project

10
Note 7: Based on a maximum amount of Renewable that the SOK Upgrade is able to interconnect which is 4325 MW. We also discounted SOK by two years to ensure that both projects were evaluated in term of $2017. Note 8: Based on 765 MW of new generation connecting to the AV Clearview project Note 9: Based on 435 MW of new generation connecting to the SOK project Note 10: AV Clearview reduces the flow on the congested Path 26 and is able to save ratepayers the cost of upgrading the path. CAISO lowest cost estimate for upgrading Path 26 is $180 million Note 11: SOK does not help mitigate any Path 26 flow. If SOK Upgrade is selected, path 26 upgrade is still needed. Note 12: CPUC Baseline scenario is 765 MW. SOK is only able to interconnect 435 MW. The transmission cost of additional 327 MW is $37 million/yr.
Section 4.1, page 18 “The consumers’ levelized annual benefit attributed to the decrease in energy production costs facilitated by the AV Clearview Project, under a specific set of assumptions, was calculated to be $147.6 million/year (in 2017 dollars). In contrast the SOK Upgrade levelized annual consumer benefit associated with reducing energy cost to ratepayers was estimated to be $80 million/year (in 2017 dollars).
The energy production cost savings calculation is incorrect due to assumption that Coolwater-Lugo can only interconnect 435 MW. These calculations are based on the assumption that the SOK Upgrade can only interconnect 435 MW. Since this assumption is not correct (the same amount of generation can be interconnected as in the AV Clearview assumption), these calculations are not correct.
Section 4.2, page 18 “The levelized value of the capacity associated with connecting 765 MW of solar to the AV Clearview Project is estimated to be approximately $11.2 million/year. The same calculation is applied to the 435 MW of generation that can interconnect to the SOK Upgrade returns a value of approximately $6.2
The cost of capacity – resource adequacy calculation is incorrect due to assumption that Coolwater-Lugo can only interconnect 435 MW. This calculation is incorrect for the SOK Upgrade, since all of
11
million/year.”
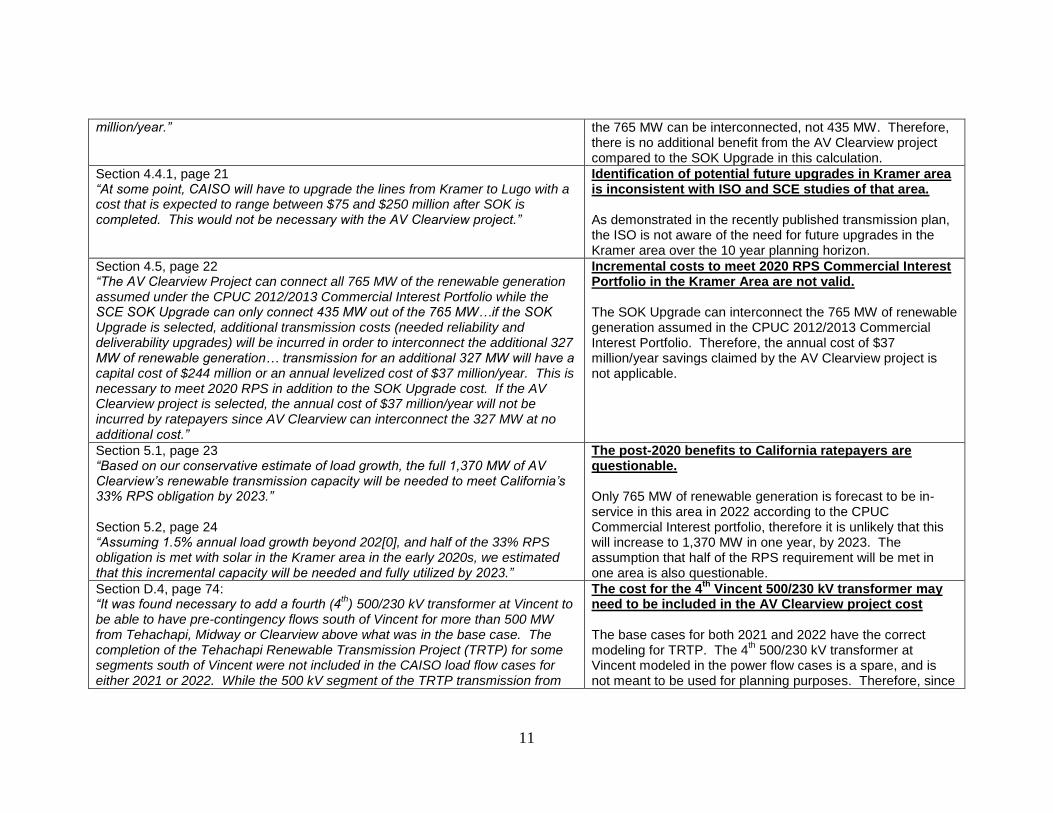
the 765 MW can be interconnected, not 435 MW. Therefore, there is no additional benefit from the AV Clearview project compared to the SOK Upgrade in this calculation.
Section 4.4.1, page 21 “At some point, CAISO will have to upgrade the lines from Kramer to Lugo with a cost that is expected to range between $75 and $250 million after SOK is completed. This would not be necessary with the AV Clearview project.”
Identification of potential future upgrades in Kramer area is inconsistent with ISO and SCE studies of that area. As demonstrated in the recently published transmission plan, the ISO is not aware of the need for future upgrades in the Kramer area over the 10 year planning horizon.
Section 4.5, page 22 “The AV Clearview Project can connect all 765 MW of the renewable generation assumed under the CPUC 2012/2013 Commercial Interest Portfolio while the SCE SOK Upgrade can only connect 435 MW out of the 765 MW…if the SOK Upgrade is selected, additional transmission costs (needed reliability and deliverability upgrades) will be incurred in order to interconnect the additional 327 MW of renewable generation… transmission for an additional 327 MW will have a capital cost of $244 million or an annual levelized cost of $37 million/year. This is necessary to meet 2020 RPS in addition to the SOK Upgrade cost. If the AV Clearview project is selected, the annual cost of $37 million/year will not be incurred by ratepayers since AV Clearview can interconnect the 327 MW at no additional cost.”
Incremental costs to meet 2020 RPS Commercial Interest Portfolio in the Kramer Area are not valid. The SOK Upgrade can interconnect the 765 MW of renewable generation assumed in the CPUC 2012/2013 Commercial Interest Portfolio. Therefore, the annual cost of $37 million/year savings claimed by the AV Clearview project is not applicable.
Section 5.1, page 23 “Based on our conservative estimate of load growth, the full 1,370 MW of AV Clearview’s renewable transmission capacity will be needed to meet California’s 33% RPS obligation by 2023.”
Section 5.2, page 24 “Assuming 1.5% annual load growth beyond 202[0], and half of the 33% RPS obligation is met with solar in the Kramer area in the early 2020s, we estimated that this incremental capacity will be needed and fully utilized by 2023.”
The post-2020 benefits to California ratepayers are questionable. Only 765 MW of renewable generation is forecast to be in-service in this area in 2022 according to the CPUC Commercial Interest portfolio, therefore it is unlikely that this will increase to 1,370 MW in one year, by 2023. The assumption that half of the RPS requirement will be met in one area is also questionable.
Section D.4, page 74: “It was found necessary to add a fourth (4
th) 500/230 kV transformer at Vincent to
be able to have pre-contingency flows south of Vincent for more than 500 MW from Tehachapi, Midway or Clearview above what was in the base case. The completion of the Tehachapi Renewable Transmission Project (TRTP) for some segments south of Vincent were not included in the CAISO load flow cases for either 2021 or 2022. While the 500 kV segment of the TRTP transmission from
The cost for the 4th
Vincent 500/230 kV transformer may need to be included in the AV Clearview project cost The base cases for both 2021 and 2022 have the correct modeling for TRTP. The 4
th 500/230 kV transformer at
Vincent modeled in the power flow cases is a spare, and is not meant to be used for planning purposes. Therefore, since

12
Vincent to Mira Loma was present, the 500 kV segment from Vincent to Rio Hondo and its associated 500/230 kV step-down transformer was not present. There the inclusion of the fourth (4
th) 500/230 kV transformer at Vincent, which
was in the load flow case but not in service, was used as a substitute or work-around for completion of the Tehachapi transmission.”
the 4th transformer at Vincent 500/230 kV is needed in the
reliability assessment for AV Clearview project, the cost for this transformer may need to be added to the cost of the AV Clearview project.
Section C.3.5, page 46: “To rationalize and support the estimated renewable energy level injected into the ZGlobal Model, ZGlobal reviewed the CAISO interconnection queue and the CPUC’s RPS contracts data. The premise for this was to compare the various 33% RPS generation portfolios.”
The use of ISO and WDAT queues instead of 2012-2013 CPUC portfolios ISO studies are based on the CPUC portfolios; therefore, ZGlobal’s study that is based on the generation queue (both ISO and WDAT) is not consistent with the ISO unified planning assumptions developed in the open stakeholder process.
13
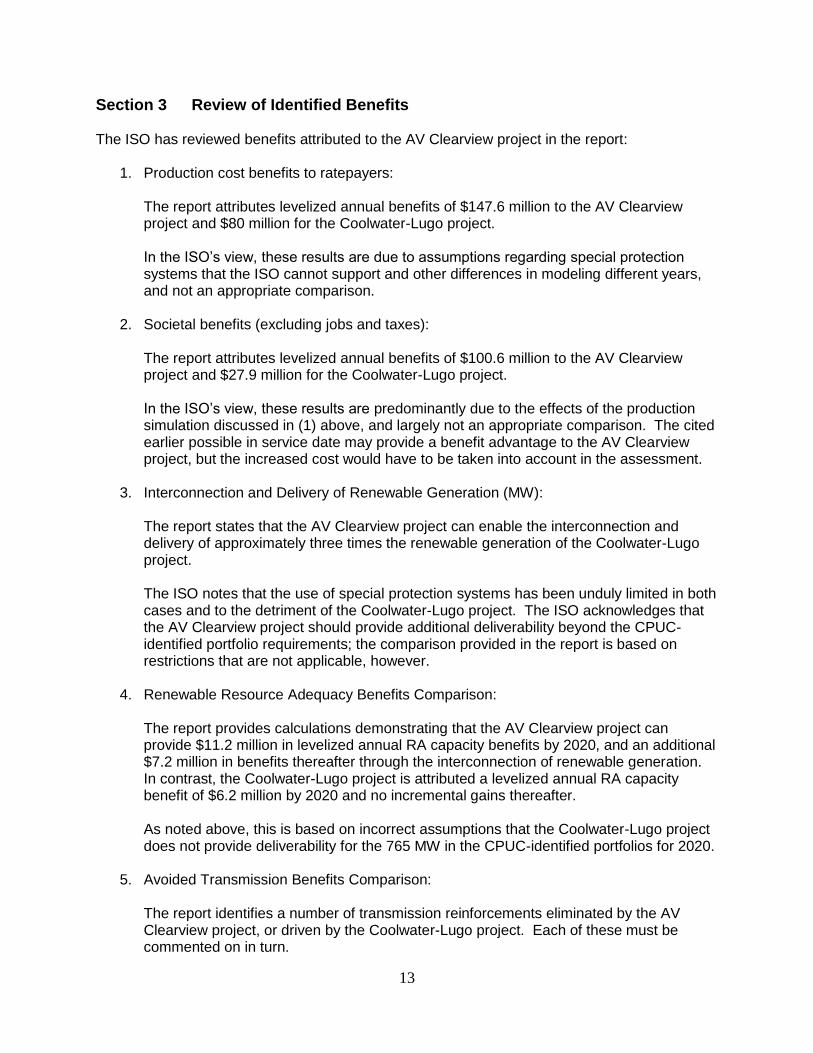
Section 3 Review of Identified Benefits The ISO has reviewed benefits attributed to the AV Clearview project in the report:
1. Production cost benefits to ratepayers:
The report attributes levelized annual benefits of $147.6 million to the AV Clearview project and $80 million for the Coolwater-Lugo project. In the ISO’s view, these results are due to assumptions regarding special protection systems that the ISO cannot support and other differences in modeling different years, and not an appropriate comparison.
2. Societal benefits (excluding jobs and taxes):
The report attributes levelized annual benefits of $100.6 million to the AV Clearview project and $27.9 million for the Coolwater-Lugo project. In the ISO’s view, these results are predominantly due to the effects of the production simulation discussed in (1) above, and largely not an appropriate comparison. The cited earlier possible in service date may provide a benefit advantage to the AV Clearview project, but the increased cost would have to be taken into account in the assessment.
3. Interconnection and Delivery of Renewable Generation (MW):
The report states that the AV Clearview project can enable the interconnection and delivery of approximately three times the renewable generation of the Coolwater-Lugo project. The ISO notes that the use of special protection systems has been unduly limited in both cases and to the detriment of the Coolwater-Lugo project. The ISO acknowledges that the AV Clearview project should provide additional deliverability beyond the CPUC-identified portfolio requirements; the comparison provided in the report is based on restrictions that are not applicable, however.
4. Renewable Resource Adequacy Benefits Comparison:
The report provides calculations demonstrating that the AV Clearview project can provide $11.2 million in levelized annual RA capacity benefits by 2020, and an additional $7.2 million in benefits thereafter through the interconnection of renewable generation. In contrast, the Coolwater-Lugo project is attributed a levelized annual RA capacity benefit of $6.2 million by 2020 and no incremental gains thereafter. As noted above, this is based on incorrect assumptions that the Coolwater-Lugo project does not provide deliverability for the 765 MW in the CPUC-identified portfolios for 2020.
5. Avoided Transmission Benefits Comparison:
The report identifies a number of transmission reinforcements eliminated by the AV Clearview project, or driven by the Coolwater-Lugo project. Each of these must be commented on in turn.
14
o Path 26 Upgrade – benefit of $27 million/year to AV Clearview:
This is based on a cost estimate of a potential mitigation developed by the ISO for study purposes, but determined not to be economic and not recommended for approval.
o Other Upgrades (Kramer-Lugo, et al) – benefit of $14 to 39 million/year to AV Clearview: The stated need for reinforcing the Kramer-Lugo path was based on the report’s assumptions regarding limiting the use of special protection systems, which the ISO cannot support.
o Additional needs to meet 2020 RPS – detriment of $37 million/year attributed to the Coolwater-Lugo project: This is based on the incorrect assumption that the Coolwater-Lugo project does not provide deliverability to the 765 MW in the Kramer area, due to unnecessary restrictions on special protection systems.
o Avoided costs of transmission for additional 605 MW RA (post 2020) – benefit of $68 million/year to AV Clearview: The ISO agrees that there is benefit in additional capacity beyond the CPUC-identified amounts. However, the ISO notes that the AV Clearview project appears to be credited with both the benefit of the additional generation and the transmission cost of accessing alternative generation. Further, the incremental cost of the AV Clearview project has not been considered in this comparison.