ism 270 service engineering and management lecture 8: service supply chains
Post on 19-Dec-2015
215 views
TRANSCRIPT

ISM 270ISM 270
Service Engineering and Service Engineering and ManagementManagement
Lecture 8: Service Supply ChainsLecture 8: Service Supply Chains

AnnouncementsAnnouncements
Homework 5 due next weekHomework 5 due next week Should help for Littlefield!Should help for Littlefield!
Littlefield Lab Next weekLittlefield Lab Next week Projects due following weekProjects due following week

Project PresentationProject Presentation
20 minutes – 15 min presentation, 5 min 20 minutes – 15 min presentation, 5 min questionsquestions
Clear presentation of service ideaClear presentation of service idea Prototype demonstration/screenshot/outlinePrototype demonstration/screenshot/outline Differentiate from competitionDifferentiate from competition Give market estimationGive market estimation
• How many potential customers?How many potential customers?• How will you make money?How will you make money?• What are the risks?What are the risks?
Argue why this will lead to successful service Argue why this will lead to successful service businessbusiness

Some key concepts for capacity Some key concepts for capacity managementmanagement
Economic Order QuantityEconomic Order Quantity Queueing DynamicsQueueing Dynamics

Supply Chain for Physical Supply Chain for Physical GoodsGoods
Material transfer Information transfer
Suppliers
Process and Product Design
Manufacturing Distribution Retailing Customer Customer Service
Recycling/Remanufacturing

Customer-Supplier Duality in Customer-Supplier Duality in Service Supply Relationships Service Supply Relationships
(Hubs)(Hubs)
Material transfer Information transfer
Supplier
Service Design
Service Provider Customer

Single-Level Bidirectional Single-Level Bidirectional Service Supply RelationshipService Supply Relationship
ServiceService
CategoryCategory
CustomerCustomer
-Supplier-Supplier
>>InputInput
Output>Output>
ServiceService
ProviderProvider
MindsMinds StudentStudent >>MindMind
Knowledge>Knowledge>
ProfessorProfessor
BodiesBodies PatientPatient >>ToothTooth
Filling>Filling>
DentistDentist
BelongingsBelongings InvestorInvestor >>MoneyMoney
Interest>Interest>
BankBank
InformationInformation ClientClient >>DocumentsDocuments
1040>1040>
Tax PreparerTax Preparer

Two-Level Bidirectional Service Two-Level Bidirectional Service Supply RelationshipSupply Relationship
ServiceService
CategoryCategory
CustomerCustomer
-Supplier-Supplier
>>InputInput
Output>Output>
ServiceService
ProviderProvider
>>InputInput
Output>Output>
Provider’sProvider’s
SupplierSupplier
MindsMinds PatientPatient >>DisturbedDisturbed
Treated>Treated>
TherapistTherapist >>PrescriptionPrescription
Drugs>Drugs>
PharmacyPharmacy
BodiesBodies PatientPatient >>BloodBlood
Diagnosis>Diagnosis>
PhysicianPhysician >>SampleSample
Test Result>Test Result>
LabLab
BelongingsBelongings DriverDriver >>CarCar
Repaired>Repaired>
GarageGarage >>EngineEngine
Rebuilt>Rebuilt>
MachineMachine
ShopShop
InformationInformation HomeHome
BuyerBuyer
>>PropertyProperty
Loan>Loan>
MortgageMortgage
CompanyCompany
>>LocationLocation
Clear Title>Clear Title>
TitleTitle
SearchSearch

Sources of Value in Service Sources of Value in Service Supply RelationshipsSupply Relationships
Bi-directional OptimizationBi-directional Optimization Managing Productive CapacityManaging Productive Capacity
- - TransferTransfer: make knowledge available (e.g. web : make knowledge available (e.g. web based FAQ database)based FAQ database)- - ReplacementReplacement: substitute technology for server : substitute technology for server (e.g. digital blood pressure device)(e.g. digital blood pressure device)- - EmbellishmentEmbellishment: enable self-service by teaching : enable self-service by teaching (e.g. change surgical dressing)(e.g. change surgical dressing)
Management of PerishabilityManagement of Perishability

Impact of Service Supply RelationshipsImpact of Service Supply Relationships
Element or Link Before After Channel Structure Functional silos Process orientation Service Recipient Passive Active as a co-producer Channel Integration Vertical (own the channel to
integrate) Virtual (IT and other mechanism permit integration without ownership)
Flow of Service Available waiting for demand Activated upon demand Flow of Information (upstream)
Pull: manual reporting of demand data results in delayed management response.
Push: high level of connectivity and transparency with fast or instantaneous access to most recent demand data.
Flow of Information (downstream)
Little or no knowledge of resource deployment
Real-time tracking and dispatching
Business Processes
Predominantly in-house; locally optimized for efficiency
In-house for key processes, others out-sourced for flexibility; integrated and synchronized to match supply with demand
Demand Management Limited to use of appointments and reservations.
Proactive involving customer in scheduling to achieve bi-directional optimization

Impact of Service Supply RelationshipsImpact of Service Supply Relationships
Element or Link Before AfterCapacity Management Limited to use of part-time
employeesCreative use of cross-trainedemployees, outsourcing, andcustomer self-service.
Facilitating Goods High; in anticipation ofdemand
Lower; owing to processtransparency
Service Delivery Inflexible; standardized andimpersonal
Flexible; personable withcustomization possible.
Routing and scheduling Static; fixed daily schedules Dynamic; based on systemconnectivity and processvisibility
New Service Design Marketing initiatives based onfirm's perception of customerneeds
Virtual value chain design withcustomer data base informationdriving new services
Pricing Fixed Variable; yield managementpromotes off-peak demand andavoid idle capacity
InternationalOperations
Focus on domestic market Global reach with Internet

Outsourcing ServicesOutsourcing Services BenefitsBenefits
- - allows the firm to focus on its core competenceallows the firm to focus on its core competence- service is cheaper to outsource than perform in-house- service is cheaper to outsource than perform in-house- provides access to latest technology- provides access to latest technology- leverage benefits of supplier economy of scale- leverage benefits of supplier economy of scale
RisksRisks - loss of direct control of quality - loss of direct control of quality - jeopardizes employee loyalty - jeopardizes employee loyalty - exposure to data security and customer privacy - exposure to data security and customer privacy - dependence on one supplier compromises future - dependence on one supplier compromises future negotiation leveragenegotiation leverage - additional coordination expense and delays - additional coordination expense and delays - atrophy of in-house capability to perform service - atrophy of in-house capability to perform service

Outsourcing ProcessOutsourcing Process
Need Identification
Problem Definition"Do-versus-Buy" AnalysisInvolve Interested PartiesSpecification Development
Information Search
ReferencesPersonal ContactRecommendationsTrade Directory
Vendor Selection
ExperienceReputationReferences
CostLocationSize
Performance Evaluation
Identify EvaluatorQuality of WorkCommunication
Meet DeadlinesFlexibilityDependability

Taxonomy for Outsourcing Taxonomy for Outsourcing Business ServicesBusiness Services
Importance of Service Low High
Property
Focus
Facility Support: -Laundry -Janitorial -Waste disposal
Equipment Support: -Repairs -Maintenance -Product testing
of PeopleEmployee Support: -Food service -Plant security -Temporary personnel
Employee Development: -Training -Education -Medical care
Service Process
Facilitator: -Bookkeeping -Travel booking -Packaged software
Professional: -Advertising -Public relations -Legal

Outsourcing ConsiderationsOutsourcing ConsiderationsFocus on Property
Facility Support Service • Low cost • Identify responsible party to evaluate performance • Precise specifications can be written
Equipment Support Service • Experience and reputation of vendor• Availability of vendor for emergency response• Designate person to make service call and to check that service is satisfactory

Outsourcing ConsiderationsOutsourcing Considerations
Focus on People
Employee Support Service • Contact vendor clients for references• Specifications prepared with end user input• Evaluate performance on a periodic basis
Employee Development Service• Experience with particular industry important• Involve high levels of management in vendor identification and selection• Contact vendor clients for references• Use employees to evaluate vendor performance

Outsourcing ConsiderationsOutsourcing ConsiderationsFocus on Process
Facilitator Service • Knowledge of alternate vendors important• Involve end user in vendor identification• References or third party evaluations useful• Have user write detailed specifications
Professional Service • Involve high level management in vendor identification and selection• Reputation and experience very important• Performance evaluation by top management

The bull-whip effectThe bull-whip effect
Variations in demand are amplified as one Variations in demand are amplified as one moves upstream in the supply chain moves upstream in the supply chain (further from the customer)(further from the customer)
Small uncertainty at one end can lead to Small uncertainty at one end can lead to large uncertainty at the other end of a large uncertainty at the other end of a supply chainsupply chain
Good method to nullify is based on Good method to nullify is based on demand-driven forecasting where all demand-driven forecasting where all information is shared through supply chaininformation is shared through supply chain

Managing Facilitating Managing Facilitating GoodsGoods
Factory Wholesaler Distributor Retailer Customer
Replenishment order
Replenishment order
Replenishment order
Customer order
Production Delay
WholesalerInventory
Shipping Delay
Shipping Delay
DistributorInventory
RetailerInventory
Item Withdrawn

Role of Inventory in ServicesRole of Inventory in Services
Decoupling inventoriesDecoupling inventories Seasonal inventoriesSeasonal inventories Speculative inventoriesSpeculative inventories Cyclical inventoriesCyclical inventories In-transit inventoriesIn-transit inventories Safety stocksSafety stocks

Considerations in Inventory SystemsConsiderations in Inventory Systems
Type of customer demandType of customer demand
Planning time horizon Planning time horizon
Replenishment lead timeReplenishment lead time
Constraints and relevant costsConstraints and relevant costs

Relevant Inventory CostsRelevant Inventory Costs
Ordering costsOrdering costs
Receiving and inspections costsReceiving and inspections costs
Holding or carrying costsHolding or carrying costs
Shortage costsShortage costs

Inventory Management Inventory Management QuestionsQuestions
What should be the What should be the order quantity (Q)order quantity (Q)?? When should an order be placed, called a When should an order be placed, called a
reorder point (ROPreorder point (ROP)?)? How much How much safety stock (SS) safety stock (SS) should be should be
maintained?maintained?

Inventory ModelsInventory Models
Economic Order Quantity (EOQ)Economic Order Quantity (EOQ) Special Inventory Models Special Inventory Models
With Quantity DiscountsWith Quantity DiscountsPlanned ShortagesPlanned Shortages
Demand Uncertainty - Safety StocksDemand Uncertainty - Safety Stocks Inventory Control SystemsInventory Control Systems
Continuous-Review (Q,r)Continuous-Review (Q,r)Periodic-Review (order-up-to)Periodic-Review (order-up-to)
Single Period Inventory Model Single Period Inventory Model

Economic Order QuantityEconomic Order Quantity
Consider a process that uses raw materialConsider a process that uses raw material Fixed known demand rate D (per minute/day/year)Fixed known demand rate D (per minute/day/year) Orders are in batches, costing:Orders are in batches, costing:
• Fixed cost S for each batchFixed cost S for each batch• Unit cost per item c in batchUnit cost per item c in batch• Unit storage/holding cost H to have extra supplyUnit storage/holding cost H to have extra supply• Cost (penalty) p for missing order due to stock-outCost (penalty) p for missing order due to stock-out
1.1. When do you place an order?When do you place an order?
2.2. How big should the batch be?How big should the batch be?

Inventory Levels For EOQ Inventory Levels For EOQ ModelModel
0
Un
its o
n H
an
d
Q
Q
D
Time

Annual Costs For EOQ ModelAnnual Costs For EOQ Model
0100200300400500600700800900
Order Quantity, Q
An
nu
al C
ost
, $
Holding CostOrdering CostTotal Cost

EOQ FormulaEOQ Formula
NotationNotationD = demand in units per yearD = demand in units per yearH = holding cost in dollars/unit/yearH = holding cost in dollars/unit/yearS = cost of placing an order in dollarsS = cost of placing an order in dollarsQ = order quantity in unitsQ = order quantity in units
Total Annual Cost for Purchase LotsTotal Annual Cost for Purchase Lots
EOQEOQ TCp S D Q H Q ( / ) ( / )2
EOQDS
H
2

Economic Order QuantityEconomic Order Quantity
Variations:Variations: Lead-time from order to arrival of batchLead-time from order to arrival of batch Uncertain/varying demandUncertain/varying demand Option to back-orderOption to back-order

Annual Costs for Quantity Annual Costs for Quantity Discount ModelDiscount Model
0 100 200 300 400 500 600 700
22,000
21000
20000
2000
1000
C = $20.00 C = $19.50 C = $18.75
Order quantity, Q
An
nua
l Co
st, $

Inventory Levels For Planned Inventory Levels For Planned Shortages ModelShortages Model
Q
Q-K
0
-KT1 T2
TIME
T

Formulas for Special ModelsFormulas for Special Models Quantity Discount Total Cost ModelQuantity Discount Total Cost Model
Model with Planned ShortagesModel with Planned Shortages
TC CD S D Q I CQqd ( / ) ( / )2
TC SD
QH
Q K
QB
K
Qb
( )2 2
2 2
QDS
H
H B
B*
2
K QH
H B* *

Values for Q* and K* as AValues for Q* and K* as AFunction of Backorder CostFunction of Backorder Cost
B Q* K* Inventory Levels
B
0 B
B 0
2DS
H
2DS
H
H B
B
undefined
QH
H B*
Q*
00
0
0
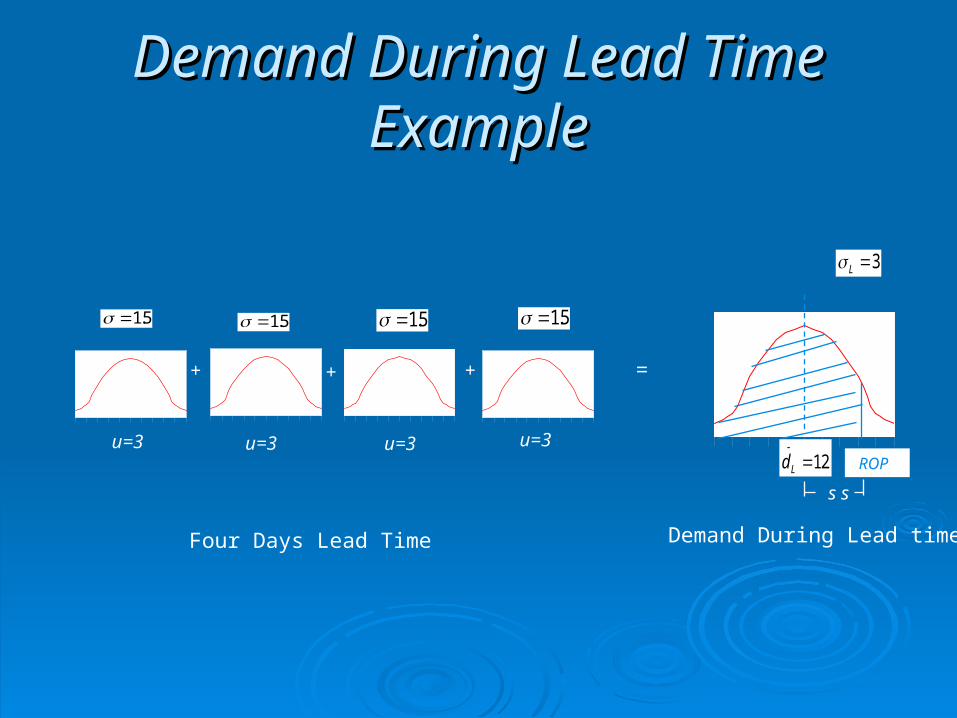
Demand During Lead Time Demand During Lead Time ExampleExample
++ + =
u=3
15.
u=3 u=3 u=3
15. 15.
L 3
dL
12 ROP
s s
Four Days Lead Time Demand During Lead time
15.

Safety Stock (SS)Safety Stock (SS)
Demand During Lead Time (LT) has Normal Demand During Lead Time (LT) has Normal Distribution with Distribution with
SS with r% service levelSS with r% service level
Reorder PointReorder Point
Mean d LTL( ) ( )Std Dev LTL. .( )
SS z LTr
ROP SS dL

Continuous Review System Continuous Review System (Q,r)(Q,r)
Average lead time usage, dL
Reorder point, ROP
Safety stock, SS
Inventory on hand
Ord
er q
uant
ity, E
OQ
EOQ
EOQ
d1 d2
d3
Amount used during first lead time
First leadtime, LT1
Order 1 placed
LT2 LT3
Order 2 placed Order 3 placed
Shipment 1 received Shipment 2 received Shipment 3 received
Time

Periodic Review SystemPeriodic Review System(order-up-to)(order-up-to)
RP RP RP
Review period
First order quantity, Q1
d1
Q2Q3
d2
d3
Target inventory level, TIL
Amount used duringfirst lead time
Safety stock, SS First lead time, LT1 LT2 LT3
Order 1 placed Order 2 placed Order 3 placed
Shipment 1 received Shipment 2 received Shipment 3 received
Time
Inventory on Hand

Inventory Control SystemsInventory Control Systems
Continuous Review SystemContinuous Review System
Periodic Review SystemPeriodic Review System
EOQDS
HROP SS LT
SS z LTr
2
RP EOQ
TIL SS RP LT
SS z RP LTr
/
( )

0102030405060708090
100110
Percentage of inventory item s (SKUs)
Perc
enta
ge o
f dol
lar
volu
me
ABC Classification of Inventory ABC Classification of Inventory ItemsItems
A B C

Inventory Items Listed in Inventory Items Listed in Descending Order of Dollar VolumeDescending Order of Dollar Volume
Monthly Percent of Unit cost Sales Dollar Dollar Percent of Inventory Item ($) (units) Volume ($) Volume SKUs Class
Computers 3000 50 150,000 74 20 AEntertainment center 2500 30 75,000
Television sets 400 60 24,000Refrigerators 1000 15 15,000 16 30 BMonitors 200 50 10,000
Stereos 150 60 9,000Cameras 200 40 8,000Software 50 100 5,000 10 50 CComputer disks 5 1000 5,000CDs 20 200 4,000
Totals 305,000 100 100

Single Period Inventory ModelSingle Period Inventory ModelNewsvendor Problem ExampleNewsvendor Problem Example
D = newspapers demandedD = newspapers demanded
p(D) = probability of demandp(D) = probability of demand
Q = newspapers stockedQ = newspapers stocked
P = selling price of newspaper, $10P = selling price of newspaper, $10
C = cost of newspaper, $4C = cost of newspaper, $4
S = salvage value of newspaper, $2S = salvage value of newspaper, $2
CCuu = unit contribution: P-C = $6 = unit contribution: P-C = $6
CCoo = unit loss: C-S = $2 = unit loss: C-S = $2

Single Period Inventory Model Single Period Inventory Model Expected Value AnalysisExpected Value Analysis
Stock Qp(D) D 6 7 8 9 10
.028 2 4 2 0 -2 -4
.055 3 12 10 8 6 4
.083 4 20 18 16 14 12
.111 5 28 26 24 22 20
.139 6 36 34 32 30 28
.167 7 36 42 40 38 36
.139 8 36 42 48 46 44
.111 9 36 42 48 54 52
.083 10 36 42 48 54 60
.055 11 36 42 48 54 60
.028 12 36 42 48 54 60
Expected Profit $31.54 $34.43 $35.77 $35.99 $35.33
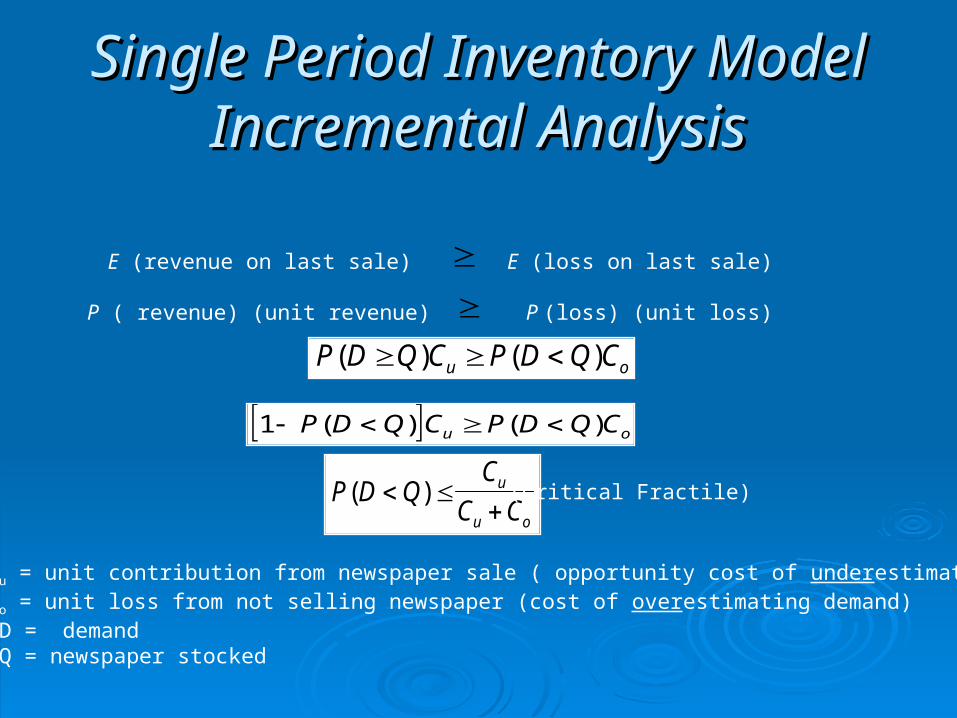
Single Period Inventory Model Single Period Inventory Model Incremental AnalysisIncremental Analysis
E (revenue on last sale) E (loss on last sale)
P ( revenue) (unit revenue) P (loss) (unit loss)
P D Q C P D Q Cu o( ) ( )
1 P D Q C P D Q Cu o( ) ( )
P D QC
C Cu
u o
( )
(Critical Fractile)
where: Cu = unit contribution from newspaper sale ( opportunity cost of underestimating demand) Co = unit loss from not selling newspaper (cost of overestimating demand) D = demand Q = newspaper stocked

Critical fractile for the Critical fractile for the newsvendor problemnewsvendor problem
0 2 4 6 8 10 12 14
New spaper dem and, Q
Prob
abili
tyP(D<Q)(Co applies)
P(D>Q)(Cu applies)
0.722

Retail Discounting ModelRetail Discounting Model
S = current selling priceS = current selling price D = discount priceD = discount price P = profit margin on cost (% markup as decimal)P = profit margin on cost (% markup as decimal) Y = average number of years to sell entire stock of “dogs” at Y = average number of years to sell entire stock of “dogs” at
current price (total years to clear stock divided by 2)current price (total years to clear stock divided by 2) N = inventory turns (number of times stock turns in one year)N = inventory turns (number of times stock turns in one year)
Loss per item = Gain from revenueS – D = D(PNY)
)1( PNY
SD

Growth and Global Growth and Global ExpansionExpansion

Expansion StrategiesExpansion Strategies
Single Service Multiservice
Focused service: Clustered service:Single * Dental practice * Stanford UniversityLocation * Retail Store * Mayo Clinic * Family restaurant * USAA Insurance
Focused network: Diversified network:Multisite * Federal Express * Nations Bank * McDonald’s * American Express * Red Roof Inns * Accenture

FranchisingFranchising Benefits to the Franchisee
Management TrainingBrand NameNational AdvertisingAcquisition of Proven BusinessEconomics of Scale
Issues for the FranchisorFranchisee AutonomyFranchise ContractConflict Resolution

Generic International StrategiesGeneric International Strategies
TransnationalStrategy
GlobalStrategy
Multi-domesticStrategy
NoInternational
Strategy
Low High
Force Towards Local Responsiveness
Force Towards GlobalIntegration
High
Low

Multinational DevelopmentMultinational Development The Nature of the Borderless World (Triad)
Customers - information has empowered Competitors - nothing stays proprietaryCompany - fixed costs require large marketsCurrency - become currency neutralCountry - deprive competitor of home market
Planning Transnational OperationsCultural TransferabilityWorker NormsHost Government Policy

International Strategic Service International Strategic Service VisionVision
Service DeliverySystem
Operating Strategy Service Concept Target Market Segments
Available technology?Infrastructure?Utility service? Labor market norms and customs? Space availability? Interaction with suppliers? Educating customers?
Appropriate managerial practice?Participative?Autocratic? Labor market institutions?Government regulations?Unions? Host government policies? Language?Front office?Back office?
What are customer expectations?Perception of value?Service ethic? Service encounter?Language?Acceptance of self-serve? What are the usage patterns? Cultural transferability?
What are the market segments?Domestic?Multinational?Tourist? What are important cultural differences?Language?Life style?Disposable income? What are the workforce demographics?Skills?Age distribution?Attitudes?Work ethic?

Considerations in Selecting a Global Service Strategy
Globalization Global Service Strategies Factors Multicountry Importing Follow Your Service Beating the Expansion Customers Customers Offshoring Clock Customer Train local Develop foreign Develop Specialize in Provide Contact workers language & foreign back- office extended cultural sensitivity customers office service hours of skills components service Customization Usually a Strategic Re-prototype Quality and More need for standard opportunity locally coordination reliability & service coordination Complexity Usually Strategic Modify Opportunity for Time routine opportunity operations focus compression Information Satellite On site advantage Move Training Exploit Intensity network experienced investments opportunity managers Cultural Modify Accommodate Could be Cultural Common Adaptation service foreign guests necessary to understanding language achieve scale necessary Labor Intensity Reduced Increased labor Hire local Reduced labor Reduced labor labor costs costs personnel costs costs Other Government Logistics Inadequate Home office Capital restrictions management infrastructure employee investments morale

Goodwill Industries International
1. Who are Goodwill’s customers and how have their demographics changed over time?
2. How should the introduction of for-profit thrifts affect Goodwill’s decisions about the role of customer service?
3. How can Goodwill differentiate itself from the competition?

Goodwill Industries International Goodwill Industries International Sources of RevenueSources of Revenue
65%
15%
6%
5%4%5%
Donated Goods
TemporaryServices
SubcontractServices
Public Support
Grants
Miscellaneous

LittlefieldLittlefield
360 days total (currently paused on 30)360 days total (currently paused on 30) 1 real minute = 3 days (total time 110 mins 1 real minute = 3 days (total time 110 mins
remaining)remaining) ManageManage
Contract termsContract terms MachinesMachines Queueing ruleQueueing rule Order quantities for suppliesOrder quantities for supplies

Littlefield LabLittlefield Lab
Maximum one page per team:Maximum one page per team: Review your strategy for the service gameReview your strategy for the service game What did you watch closely? Did it work?What did you watch closely? Did it work? Suggest what you would do different next timeSuggest what you would do different next time
Due in class next weekDue in class next week