islamic republic of pakistancpakgulf.org/documents/pakistan.pdf · • al-olyan descon engineering...
TRANSCRIPT
Fact file/Pakistan
FACT FILE
ISLAMIC REPUBLIC OF PAKISTAN
Fact file/Pakistan
History
Prior to independence the people of the sub-continent (now India and Pakistan) were a colony of
the British Empire (East India Company).The British employed the political strategy of “divide
and rule” which kept them in power from 1612-1947.However it was not very long when both
the nations (India and Pakistan) started a strong and well devised movement for freedom from
the colonial rule.
The significant part was played by All India Muslim League whose freedom struggle led to the
creation of separate homeland for the Muslims. All India Muslim League was founded on 30th
December 1906.The constitution of the league were contained in the green book written by
Maulana Muhammad Ali. The league’s goals aimed at protecting the rights of Muslims. The
league gradually became therespresentating body of the Indian Muslims. Mohammad Ali Jinnah
the founder of Pakistan joined the league in 1906.By 1930 Mohammad Ali Jinnah was anguish
about the Indian politics and Indian Congress were sensitive to minority priorities. Not only
Jinnah, many prominent scholars gathered together to fuel the freedom struggle. Allama
Mohammad Iqbal, a philopsher, poet and writer in his adres to convention of the Muslim League
expressed the need for a separate homeland for the Muslims of the sub-continent.The name
Pakistan was suggested by Chaudry Rehmat Ali which encapsulates the concept of Pak-pure and
stan –land which means “The Land of Pure”.
The ideas and the dreams were converted into reality on 14th
August 1947.It was then the 27th
of
The Holy month of Ramadan.
Geography:
Total 881,888 Sq.Km
Punjab 205,344 Sq.Km
Sindh 140,914 Sq.Km
Khyber Pakhtoonkhwa 74,521 Sq Km
Balochistan 347,190 Sq Km
FATA 27,220 Sq.Km
Islamabad(capital) 906 Sq.Km
Gilgit -Baltistan 72,496 Sq.Km
Azaad Jammu & Kashmir 13,297 Sq.Km
Fact file/Pakistan
Provinces
Pakistan is divided into four provinces , Khyber Pukhtoonkhwa, Punjab, Sindh and Balochistan.
The tribal belt adjoining Khyber Pukhtoonkhwa is managed by the Federal Government and is
named FATA i.e., Federally Administered Tribal Areas. Azad Jammu & Kashmir and Gilgit-
Baltistan have their own respective political and administrative machinery, yet certain of their
subjects are taken care of by the Federal Government. Islamabad is the capital city of Pakistan.
Government:
Pakistan is a democratic state. Pakistan has a federal parliamentary system, comprising of two
houses: the Senate (upper house) and the National Assembly (lower house). For a bill to become
law, it must be passed by both houses and signed off by the Prime Minister and the President.
The National Assembly’s members are elected to 5 year terms (the length of the parliamentary
term) unless the Assembly is dissolved early (which is at the instigation of the Prime Minister).
The National Assembly elects the Prime Minister, who is the head of government and must be a
member of the National Assembly. On 22 June 2012, the National Assembly elected Raja Pervez
Ashraf as Prime Minister, he replaced Yousaf Raza Gilani. The Pakistan People’s Party (PPP)
holds the most seats, but no overall majority and so currently leads a coalition government.
104 of the Senate’s members are elected by each of the four provincial assemblies, which are
represented in equal number. The Federal Cabinet is drawn from both the National Assembly
and the Senate.
The President is the head of state. They are elected to five-year terms by an electoral college
consisting of members of the Senate, National Assembly, and provincial assemblies. The
President can serve a maximum of two consecutive terms. The current President is Asif Ali
Zardari, who was elected on 6 September 2008.
The 18th Amendment, passed in April 2010, has granted provinces authority over much of what
was previously federal policy including areas such as education and health.

Fact file/Pakistan
Economy:
GDP Growth
2009 2010 2011 2012
1.7 3.8 2.4 2.5
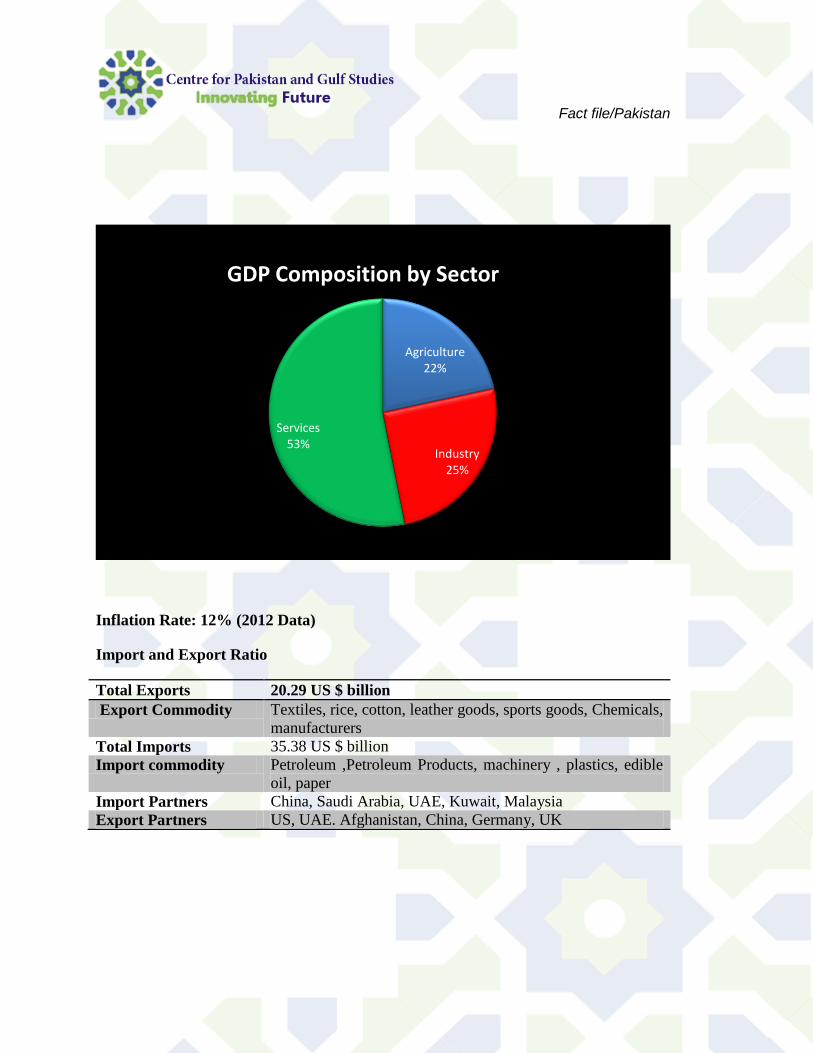
GDP composition by sector:
0
0.5
1
1.5
2
2.5
3
3.5
4
2009 2010 2011 2102
Fact file/Pakistan
Inflation Rate: 12% (2012 Data)
Import and Export Ratio
Total Exports 20.29 US $ billion
Export Commodity Textiles, rice, cotton, leather goods, sports goods, Chemicals,
manufacturers
Total Imports 35.38 US $ billion
Import commodity Petroleum ,Petroleum Products, machinery , plastics, edible
oil, paper
Import Partners China, Saudi Arabia, UAE, Kuwait, Malaysia
Export Partners US, UAE. Afghanistan, China, Germany, UK
Agriculture 22%
Industry 25%
Services 53%
GDP Composition by Sector

Fact file/Pakistan
Pakistan-GCC Relations
Saudi Arabia
Pakistan’s exports to Saudi Arabia
2006 2007 2008 2009 2010 2011 2012(June-
Jul)
313.03 284.14 394.16 404.60 418.23 431.00 243.42
0
50
100
150
200
250
300
350
400
450
500
2006 2007 2008 2009 2010 2011 2012

Fact file/Pakistan
List of Export Commodities
Commodity
Description
2009 2010 2011
Cereals 126.23 137.87 95.97
Textile Articles 82.63 50.67 64.22
Meat and edible
meat offal
23.62 38.73 42.82
Articles of Apparel
accessories
20.20 18.00 19.63
Man-made staple
fibers
13.22 14.00 18.96
Saudi Arabia’s exports to Pakistan
2006 2007 2008 2009 2010 2011 2012 June-
July)
3252.72 3088.82 4207.01 3086.45 3717.83 5184.35 2244.53
0
1000
2000
3000
4000
5000
6000
2006 2007 2008 2009 2010 2011 2012

Fact file/Pakistan
List of Export Commodities
Commodity
Description
2009 2010 2011
Mineral Fuels, oils
etc
2,883.17 2,953.34 3,686.42
Plastics and articles
thereof
257.25 412.92 452.41
Organic Chemicals 152.06 230.59 314.57
Fertilizers 84.96 123.89 82.10
Iron and Steel 17.85 7.04 26.20
Pak- Saudi Joint Ventures:
• HUBCO
• Pak Electron
• Attock Cement
• National Tiles and Ceramics
• Saudi-Pak Industrial and Agricultural Investment Company
• Prime Commercial Bank
• Falcon Cement
• Attock Oil Refinery
• Pak-Arab Refinery
• Faisal Islamic Bank
• Sanaullah Woolen Mills
• Al-Dahlawi Sana Co. for manufacturing Surgical Strings

Fact file/Pakistan
• National Fabric Products Factory
• United Spinning & Textile Factories Co.
• Al-Olyan Descon Engineering Co.
Bahrain
Pakistan’s export to Bahrain
00-01 01-02 02-03 03-04 04-05 05-06 06-07 07-08 08-09 09-10 10-11
43.818 43.121 42.063 38.031 42.425 45.385 53.687 76.776 76.292 64.933 85.392
Commodity Description 2009 2010 2011
Cereals 36.41 37.10 31.25
Cotton 16.68 21.98 26.26
Meat and edible meat offal 2.57 11.86 13.41
Edible fruit, nuts, melons 1.36 1.39 3.33
Edible vegetables 0.94 1.59 2.04
0
10
20
30
40
50
60
70
80
90
2001 24-Jun 2003 2004 2005 2006 2007 2008 2009 2010 2011
Fact file/Pakistan
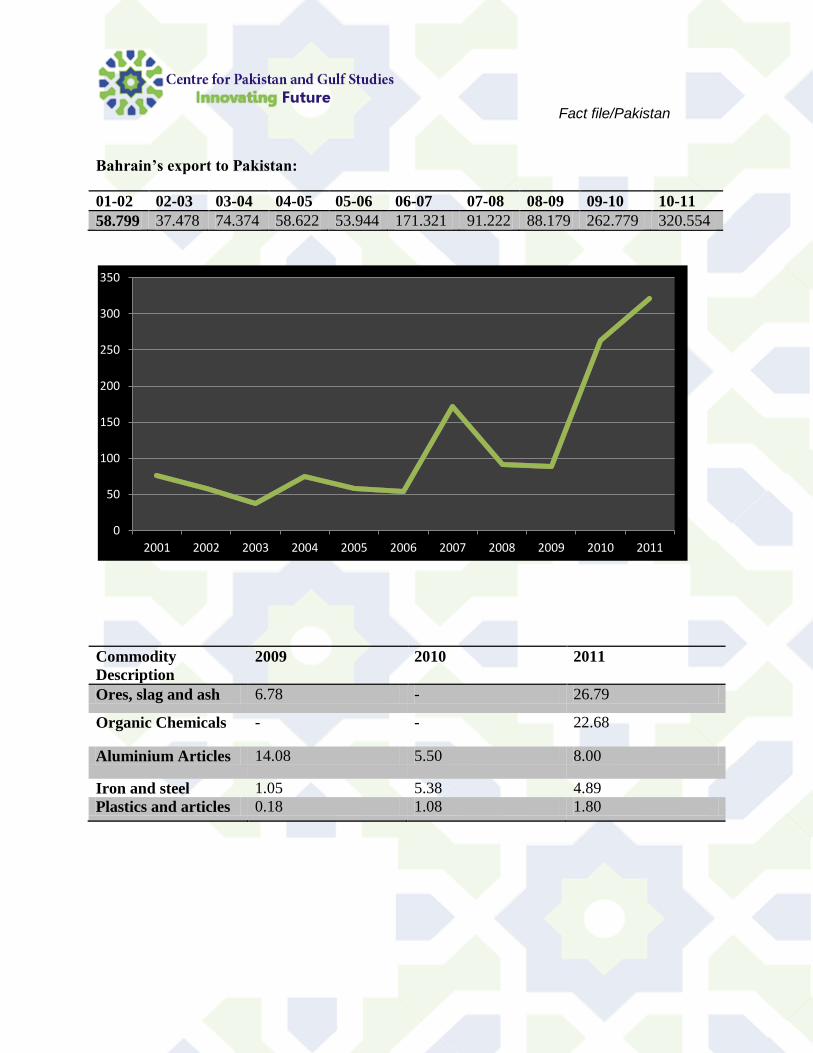
Bahrain’s export to Pakistan:
01-02 02-03 03-04 04-05 05-06 06-07 07-08 08-09 09-10 10-11
58.799 37.478 74.374 58.622 53.944 171.321 91.222 88.179 262.779 320.554
Commodity
Description
2009 2010 2011
Ores, slag and ash 6.78 - 26.79
Organic Chemicals - - 22.68
Aluminium Articles 14.08 5.50 8.00
Iron and steel 1.05 5.38 4.89
Plastics and articles 0.18 1.08 1.80
0
50
100
150
200
250
300
350
2001 2002 2003 2004 2005 2006 2007 2008 2009 2010 2011
Fact file/Pakistan
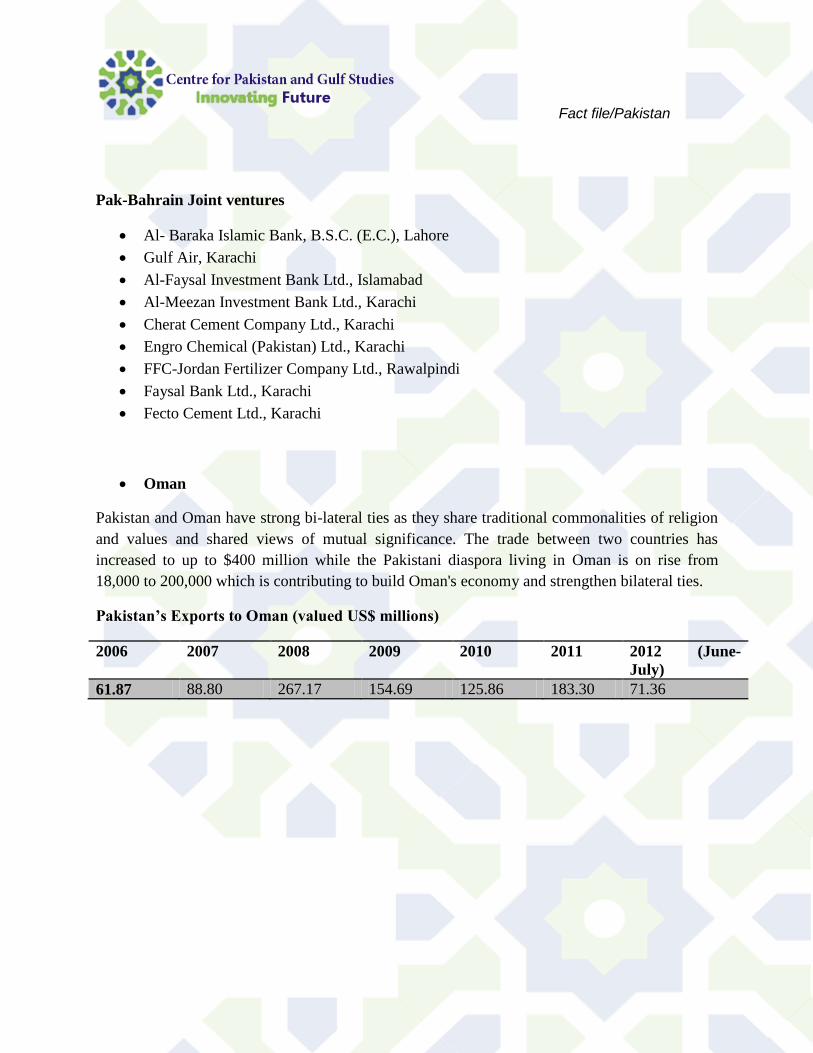
Pak-Bahrain Joint ventures
Al- Baraka Islamic Bank, B.S.C. (E.C.), Lahore
Gulf Air, Karachi
Al-Faysal Investment Bank Ltd., Islamabad
Al-Meezan Investment Bank Ltd., Karachi
Cherat Cement Company Ltd., Karachi
Engro Chemical (Pakistan) Ltd., Karachi
FFC-Jordan Fertilizer Company Ltd., Rawalpindi
Faysal Bank Ltd., Karachi
Fecto Cement Ltd., Karachi
Oman
Pakistan and Oman have strong bi-lateral ties as they share traditional commonalities of religion
and values and shared views of mutual significance. The trade between two countries has
increased to up to $400 million while the Pakistani diaspora living in Oman is on rise from
18,000 to 200,000 which is contributing to build Oman's economy and strengthen bilateral ties.
Pakistan’s Exports to Oman (valued US$ millions)
2006 2007 2008 2009 2010 2011 2012 (June-
July)
61.87 88.80 267.17 154.69 125.86 183.30 71.36

Fact file/Pakistan
Commodity Description 2009 2010 2011
Cereals 59.68 100.25 113.51
Organic Chemicals 4.20 2.16 13.47
Mineral fuels, oils 8.53 - 13.40
Machinery, Nuclear
reactors
1.29 4.39 10.43
Meat and edible meat offal 7.26 7.66 9.63
0
50
100
150
200
250
300
2006 2007 2008 2009 2010 2011 2012(july)
Fact file/Pakistan
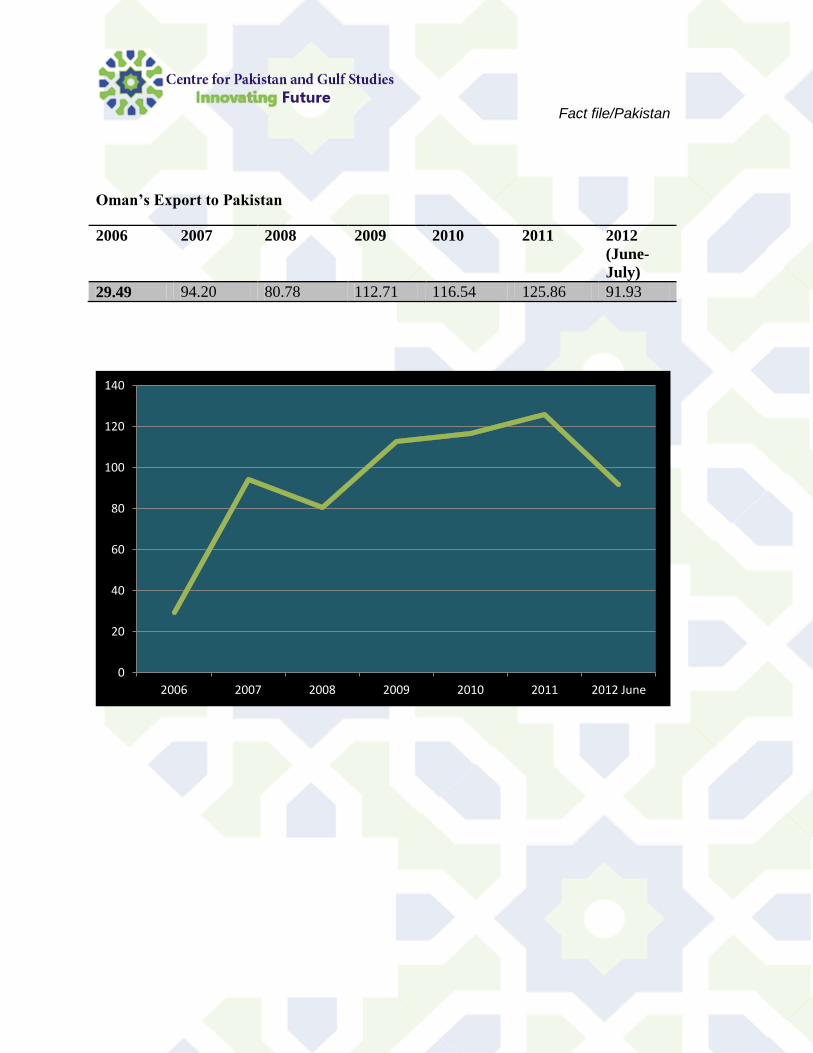
Oman’s Export to Pakistan
2006 2007 2008 2009 2010 2011 2012
(June-
July)
29.49 94.20 80.78 112.71 116.54 125.86 91.93
0
20
40
60
80
100
120
140
2006 2007 2008 2009 2010 2011 2012 June

Fact file/Pakistan
Oman’s Export to Pakistan
Commodity Description 2009 2010 2011
Mineral fuels, oils 152.96 67.43 141.89
Plastics and articles 25.27 25.10 39.84
Organic Chemicals 1.67 12.84 16.03
Fertilizers 51.99 11.85 14.97
Iron and Steel 11.48 11.15 13.97
Joint venture between Oman-Pakistan
Pak-Oman Investment Company Limited
In July 2001 the Governments of Pakistan and Sultanate of Oman have established Pak Oman
Investment Company Limited a specialized Financial Institution formed as a joint venture. Pak
Oman facilitates investments to promote various sectors and acts as a financial link between the
Sultanate of Oman and Pakistan. The company has successfully diversified its areas of growth by
the launch of Pak Oman Asset Management Company and Pak Oman Microfinance Company.
World Call Telecom Limited
World Call Telecom Limited (WTL), an Oman Telecommunications Company (Omantel), is the
most reliable and unique telecom and multimedia service provider in Pakistan. World call
launched its business in 1996 and offers an array of services under three major categories data,
Entertainment, Voice.
World Call Telecom Limited became an associate company of Omantel after acquisition of
major share holding by Omantel in 2008. Today, World Call Telecom has become synonymous
with innovation, dedication, and reliability in Pakistan.
MOU between Pakistan-Oman
Agreement on Promotion & Protection of Investment
Avoidance of Double Taxation Agreement
MOU regulating the Air Services between Sultanate of Oman and Pakistan
Fact file/Pakistan
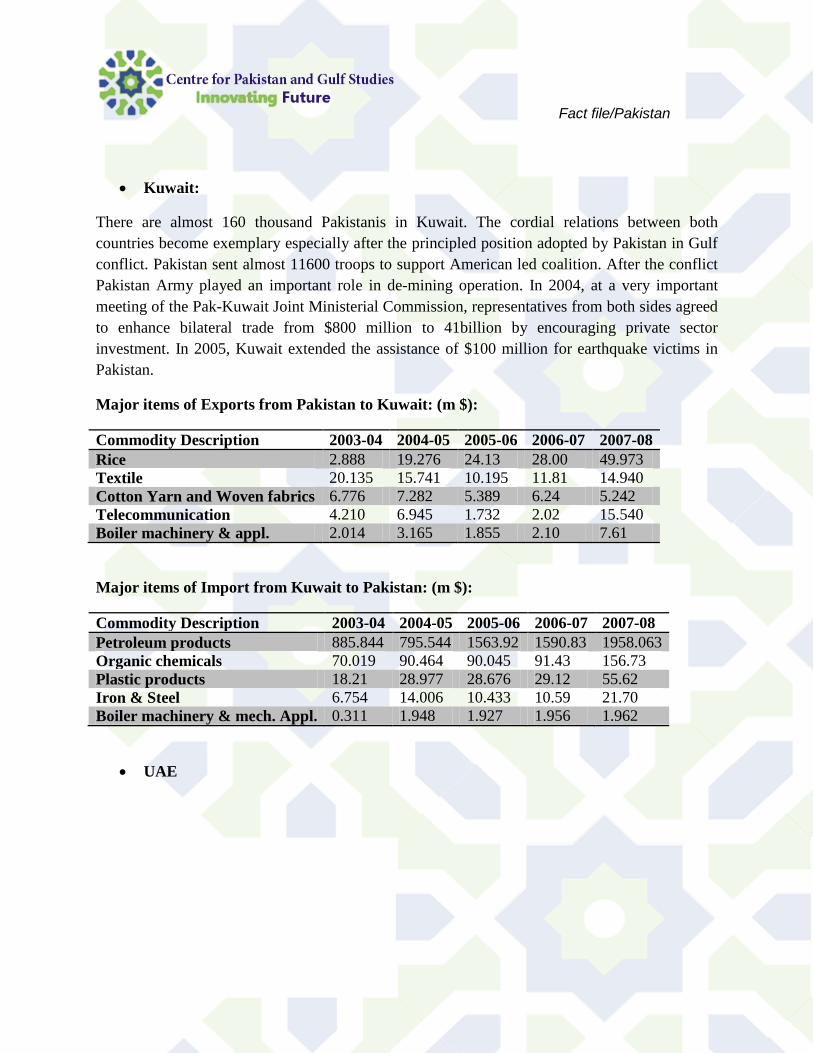
Kuwait:
There are almost 160 thousand Pakistanis in Kuwait. The cordial relations between both
countries become exemplary especially after the principled position adopted by Pakistan in Gulf
conflict. Pakistan sent almost 11600 troops to support American led coalition. After the conflict
Pakistan Army played an important role in de-mining operation. In 2004, at a very important
meeting of the Pak-Kuwait Joint Ministerial Commission, representatives from both sides agreed
to enhance bilateral trade from $800 million to 41billion by encouraging private sector
investment. In 2005, Kuwait extended the assistance of $100 million for earthquake victims in
Pakistan.
Major items of Exports from Pakistan to Kuwait: (m $):
Commodity Description 2003-04 2004-05 2005-06 2006-07 2007-08
Rice 2.888 19.276 24.13 28.00 49.973
Textile 20.135 15.741 10.195 11.81 14.940
Cotton Yarn and Woven fabrics 6.776 7.282 5.389 6.24 5.242
Telecommunication 4.210 6.945 1.732 2.02 15.540
Boiler machinery & appl. 2.014 3.165 1.855 2.10 7.61
Major items of Import from Kuwait to Pakistan: (m $):
Commodity Description 2003-04 2004-05 2005-06 2006-07 2007-08
Petroleum products 885.844 795.544 1563.92 1590.83 1958.063
Organic chemicals 70.019 90.464 90.045 91.43 156.73
Plastic products 18.21 28.977 28.676 29.12 55.62
Iron & Steel 6.754 14.006 10.433 10.59 21.70
Boiler machinery & mech. Appl. 0.311 1.948 1.927 1.956 1.962
UAE

Fact file/Pakistan
Trade between UAE and Pakistan: (m $):
Year Exports Import Balance
of Trade
Total
Export of
Pakistan
%share in
Total
Export
Total
Import of
Pakistan
Share in
Total
Imports
2006 927.37 1933.89 -1006.51 17049.67 5.44 26697.00 7.24
2007 986.49 1949.97 -963.48 18188.16 5.42 28776.06 6.78
2008 1165.64 3165.82 -2000.18 21214.54 5.49 38216.19 8.28
2009 1002.11 2013.42 -1011.31 18345.56 5.46 28616.06 7.04
2010 1310.56 2971.43 -1660.87 21463.02 6.11 32878.85 9.04
2011 1928.07 6120.94 -4192.87 26367.91 7.31 38688.74 15.82
2013
(Jan-
June)
1030.11 3289.59 -2259.48 12801.06 8.05 20286.66 16.22
Source: Pakistan Chamber of Commerce December 2012.
Exports from Pakistan by Commodity Type
commodity Description 2009 2010 2011
Pearls, precious stones, metal, coin etc. 448.25 561.24 439.57
Mineral fuel, oil, distillation products etc. 198.06 337.52 405.30
Cereals 241.72 314.86 344.37
Milling product, malt, starches, inulin, wheat
gluten
0.26 0.73 106.75
Made textiles 128.47 85.65 83.76
Imports in Pakistan: (m $)
Commodity Description 2009 2010 2011
Mineral Fuels, Oils, Distillation
products
2589.26 4297.63 5809.26
265.21 106.25 151.85 265.21
Plastic and articles thereof 59.22 67.21 152.19
Iron and Steel 116.18 102.16 87.94
Fertilizers 8.82 0.10 87.57
Fact file/Pakistan
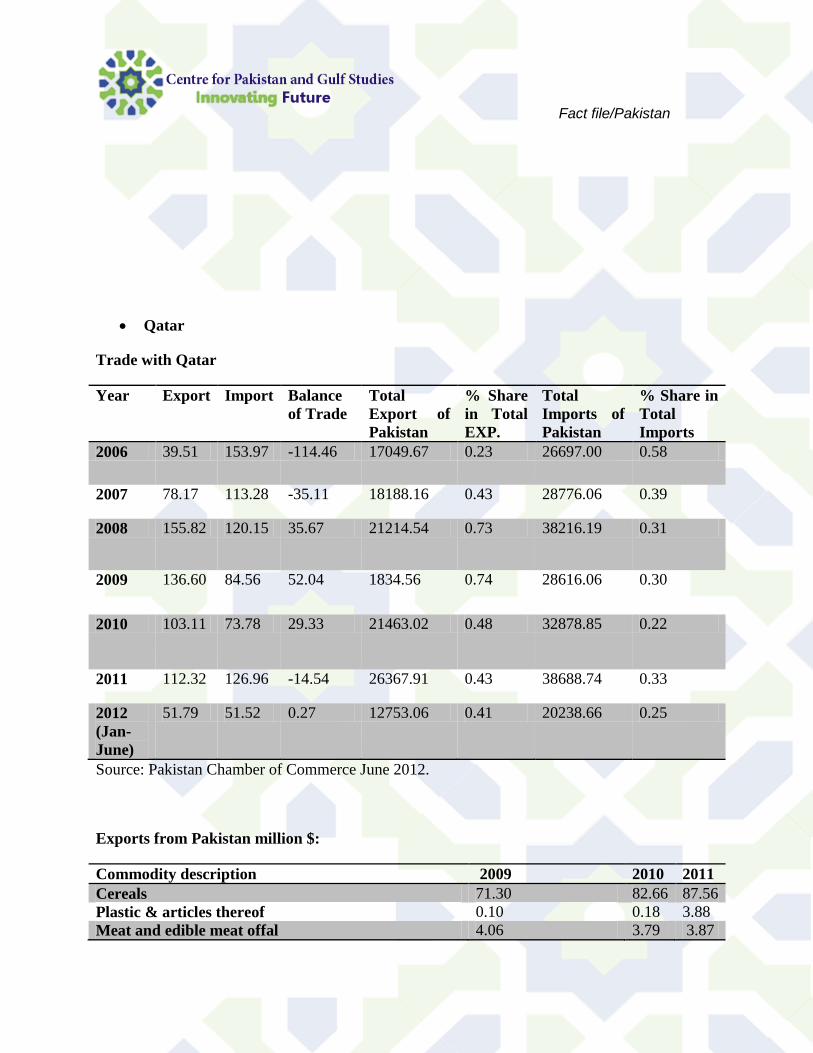
Qatar
Trade with Qatar
Year Export Import Balance
of Trade
Total
Export of
Pakistan
% Share
in Total
EXP.
Total
Imports of
Pakistan
% Share in
Total
Imports
2006 39.51 153.97 -114.46 17049.67 0.23 26697.00 0.58
2007 78.17 113.28 -35.11 18188.16 0.43 28776.06 0.39
2008 155.82 120.15 35.67 21214.54 0.73 38216.19 0.31
2009 136.60 84.56 52.04 1834.56 0.74 28616.06 0.30
2010 103.11 73.78 29.33 21463.02 0.48 32878.85 0.22
2011 112.32 126.96 -14.54 26367.91 0.43 38688.74 0.33
2012
(Jan-
June)
51.79 51.52 0.27 12753.06 0.41 20238.66 0.25
Source: Pakistan Chamber of Commerce June 2012.
Exports from Pakistan million $:
Commodity description 2009 2010 2011
Cereals 71.30 82.66 87.56
Plastic & articles thereof 0.10 0.18 3.88
Meat and edible meat offal 4.06 3.79 3.87
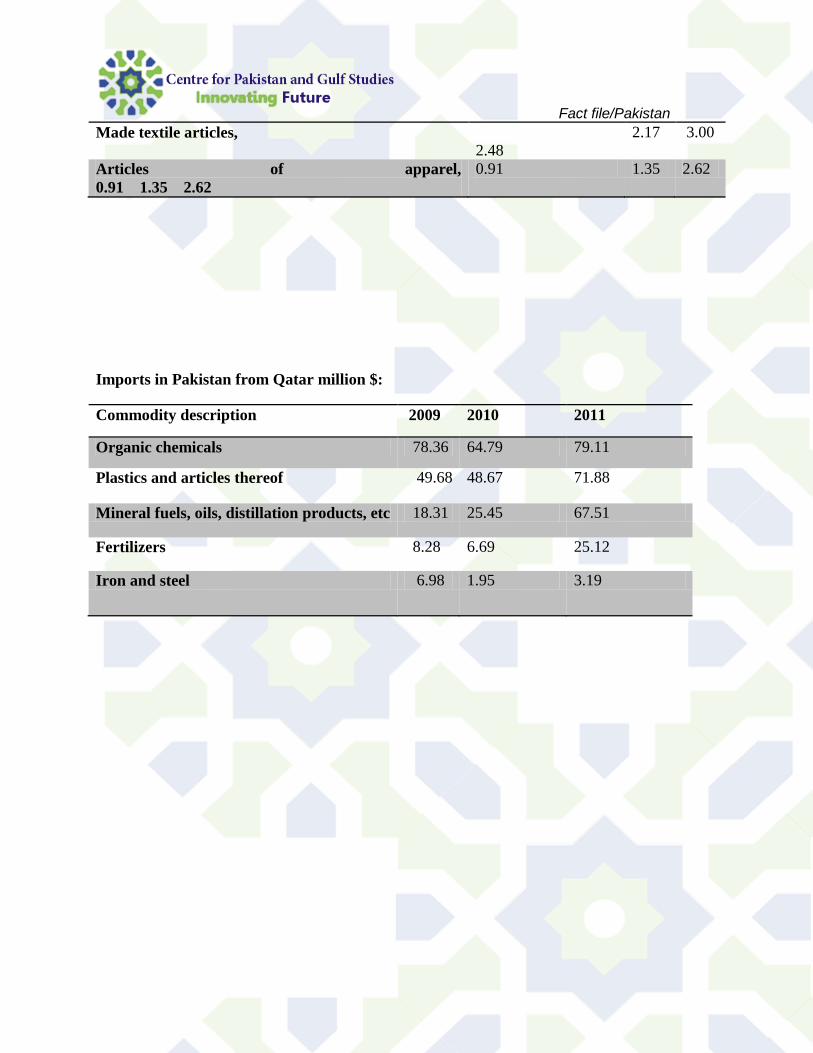
Fact file/Pakistan
Made textile articles,
2.48
2.17 3.00
Articles of apparel,
0.91 1.35 2.62
0.91 1.35 2.62
Imports in Pakistan from Qatar million $:
Commodity description 2009 2010 2011
Organic chemicals 78.36 64.79 79.11
Plastics and articles thereof 49.68 48.67 71.88
Mineral fuels, oils, distillation products, etc 18.31 25.45 67.51
Fertilizers 8.28 6.69 25.12
Iron and steel 6.98 1.95 3.19