isi investor slides feb 18, 2013 final wo...
TRANSCRIPT

OSK Investor Slides March 2013
Oshkosh Corporation ISI Industrial Conference
March 2013

OSK Investor Slides March 2013
Forward-Looking Statements
2
This presentation includes statements that the Company believes to be “forward-looking statements” within the meaning of the Private Securities Litigation Reform Act of 1995. All statements other than statements of historical fact, including, withoutlimitation, statements regarding the Company’s future financial position, business strategy, targets, projected sales, costs,earnings, capital expenditures, debt levels and cash flows, and plans and objectives of management for future operations, areforward-looking statements. When used in this presentation, words such as “may,” “will,” “expect,” “intend,” “estimate,” “anticipate,” “believe,” “should,” “project” or “plan” or the negative thereof or variations thereon or similar terminology are generally intended to identify forward-looking statements. These forward-looking statements are not guarantees of future performance and are subject to risks, uncertainties, assumptions and other factors, some of which are beyond the Company’s control, which could cause actual results to differ materially from those expressed or implied by such forward-looking statements. These factors include the cyclical nature of the Company’s access equipment, commercial and fire & emergency markets, especially in the current environment where there are conflicting signs regarding the global economic outlook and the ability of the U.S. government to resolve budgetary and debt issues; the expected level and timing of the U.S. DoD procurement of products and services and funding thereof including the impact of sequestration; risks related to reductions in government expenditures in light of U.S. defense budget pressures and an uncertain DoD tactical wheeled vehicle strategy; the ability to comply with laws and regulations applicable to U.S. government contractors; the ability to increase prices to raise margins or offset higher input costs; increasing commodity and other raw material costs, particularly in a sustained economicrecovery; risks related to the Company’s exit from its ambulance business, including the amounts of related costs and charges; risks related to facilities consolidation and alignment, including the amounts of related costs and charges and that anticipatedcost savings may not be achieved; the duration of the ongoing global economic weakness, which could lead to additional impairment charges related to many of the Company’s intangible assets and/or a slower recovery in the Company’s cyclical businesses than Company or equity market expectations; the potential for the U.S. government to competitively bid the Company’s Army and Marine Corps contracts; risks related to the collectability of receivables, particularly for those businesseswith exposure to construction markets; the cost of any warranty campaigns related to the Company’s products; risks related toproduction or shipment delays arising from quality or production issues; risks associated with international operations and sales, including foreign currency fluctuations and compliance with the Foreign Corrupt Practices Act; risks related to actions of activist shareholders; and risks related to the Company’s ability to successfully execute on its strategic road map and meet its long-term financial goals. Additional information concerning these and other factors is contained in the Company’s filings with the Securities and Exchange Commission, including the Form 8-K filed January 25, 2013. All forward-looking statements speak only as of January 25, 2013. The Company assumes no obligation, and disclaims any obligation, to update information contained in this presentation. Investors should be aware that the Company may not update such information until the Company’s next quarterly earnings conference call, if at all.

OSK Investor Slides March 2013
Framing the Opportunity

OSK Investor Slides March 2013
Oshkosh Corporation
• Incorporated in 1917
• Listed on NYSE (Ticker: OSK)
• Employees: 13,200
• FY12 Revenue: $8.18 billion
• FY12 Adjusted EPS (1): $2.27
• Market Capitalization (2): $3.4 billion
• 12/31/2012 Net Debt (3): $499 million
(1) Non-GAAP results. See Appendix for reconciliation to GAAP results.(2) As of February 27, 2013.(3) Net debt is total debt less cash. Source Oshkosh Form 10-Q: January 25, 2013
4

OSK Investor Slides March 2013
Moving the World at Work
• Our vehicles move people and materials at work– Most protect people or property– Many lift people or property– All do so safely and efficiently
• Often share common customers/ distribution channels– JLG, Jerr-Dan, IMT, McNeilus and Pierce sell
into rental channel– Every segment sells to the U.S.
federal government• Share common components/suppliers,
technologies and manufacturing processes• Scale is important to be competitive
5

OSK Investor Slides March 2013
Poised to Deliver Results
• MOVE strategy expected to deliver higher margins throughout cycle• Market recovery from deep cycle has commenced
– Expected to overcome defense downturn • Oshkosh processes and team support execution of MOVE
FY12 FY15E
Industry Leading Brands (1)
Access Equipment #1 Global
Fire Apparatus #1 Global
Airport Products #1 Global
Defense TWV (2) #1 Global
Concrete Mixers #1 Americas
Refuse Collection #1 Americas
6
* Non-GAAP results. See Appendix for reconciliation to GAAP results.
(1) Based on Company estimates.(2) Oshkosh Defense is the leading supplier of heavy and medium tactical
wheeled vehicles for the U.S. Armed Services.

OSK Investor Slides March 2013
MOVE – The Right Strategy
• Focuses on drivers that create highest shareholder value• Recognizes constraints of markets, balance sheet and
business valuations• Expected to drive higher incremental margins across non-Defense
businesses over cycle
7

OSK Investor Slides March 2013
Leveraging a Common Structure: Oshkosh Operating System
• Customer-centric application of lean principles– Sets guiding principles for
relationships with customers
• Improves processes needed todeliver key elements of MOVE
• Supports drive to improve cash flow
• Implementation gaining momentum
• Company-wide foundation for building shareholder value
8

OSK Investor Slides March 2013
MOVE Delivered in FY12
9
Oshkosh Corporation
Full Year
Revenue $8.18BAdjusted Operating Income* $402M
Adjusted Operating Income Margin* 4.9%Adjusted EPS* $2.27Total Debt $955MNet Debt(Total debt less cash) $414M
• Achieved Adjusted EPS* of $2.27– September 14, 2012 Analyst Day
estimate range: $2.05 - $2.15– Raised expectations several times
throughout the year
• Generated $215 million offree cash flow*
• International sales increased to 22% in FY12 from 17% in FY11
• Significant wins for Defense– 750 M-ATVs for U.A.E.– JLTV engineering and manufacturing
development contract award
* Non-GAAP results. See Appendix for reconciliation to GAAP results.

OSK Investor Slides March 2013
Building Momentum:Q1 FY13 Results
• Adjusted EPS* of $0.60– Results exceeded
expectations• Margins expanded in all non-
defense segments– Exceeded expectations in
defense• Generated $39 million in free
cash flow*• Repurchased 4.25 million
shares• Increased FY13 Adjusted
EPS* estimates to a range of $2.80 to $3.05
Net
Sal
es(m
illio
ns)
Adjusted EPS*
OSK Fiscal Q1 Performance
$1,761 $1,876
$0.60
$0.39
$0.00
$0.25
$0.50
$0.75
$1.00
$0
$500
$1,000
$1,500
$2,000
$2,500
FY13 FY12Net Sales EPS
* Non-GAAP results. See Appendix for reconciliation to GAAP results.
10

OSK Investor Slides March 2013
MOVE Highlights

OSK Investor Slides March 2013
Market Recovery and Growth
12
~$220M(2)
Opportunity(FY12-FY15)
FY11 FY15EFY12
~10% CAGR(FY12-FY15)
FY11 FY15EFY12
Non-Defense Operating Income (1) ($ in Millions)
(1) Reflects estimated benefits of market recovery captured in financial estimates. Does not include benefits of other MOVE initiatives. Market recovery operating income growth opportunity from FY11 to prior peak sales levels for non-Defense segments estimated at ~$500 million.
(2) Based on September 14, 2012 Analyst Day estimate for FY12 non-Defense segments operating income, which excluded costs to exit ambulance and European mobile medical businesses.

OSK Investor Slides March 2013
Optimize Cost and Capital Structure
0
50
100
150
200
250
FY12 FY13E FY14E FY15E
8 bps
~75 bps
~130 bps
~250 bps
Targeted Operating Income Margin Impact(Basis Points Operating Income/Sales)
• Targeted margin improvements driven by reductions in product, process and overhead costs
13

OSK Investor Slides March 2013
Value InnovationDriving ~$350 million incremental annual revenue by FY15
(1)
• Disciplined, resourced execution of multi-generational product and technology plans in all segments
• Integrated project teams charged with improving product launch processes and adherence to project KPIs
• Customer First focus driving all innovation
14
(Mill
ions
of D
olla
rs)
(1) Compared with FY12

OSK Investor Slides March 2013
Emerging Market ExpansionTargeting > 25% of revenues by FY15 (30% by FY16)
• Expanding sales, service and manufacturing operations • Forward deploying business development professionals for Defense• Developing products for global markets• Leveraging international facilities across segments
15
17%
~20%>25%
Sales Outside the U.S.
~10%-15% CAGR (FY12-FY15)
FY11 FY15EFY12(1)
(Per
cent
of R
even
ue)
(1) Based on September 14, 2012 Analyst Day estimate.

OSK Investor Slides March 2013
Business Outlook

OSK Investor Slides March 2013
The Access Equipment Advantage
17
JLG is positioned for sustained industry leading performance
Global Leader in Access Equipment
Industry Leading
Innovation
Superior Product Range
Full Spectrum Parts, Service, and Support
Flexible Manufacturing
and Supply Chain
Global Market Presence

OSK Investor Slides March 2013
North American Rental Companies are Refreshing Their Fleets, Increasing Market Penetration
18
Total Construction Spending(Y-O-Y % Change)
NA Rental Equipment Access - Fleet Age(AWP and TMH)
NA Rental Equipment Company Fleet Utilization
‐20
‐10
0
10
20
2006 2007 2008 2009 2010 2011 2012E 2013E 2014E 2015EUnited States Canada
NA Rental Equipment Company CapEx (Y-O-Y % Change)
Source: IHS Global data/projections
Based on International Rental News/Dan Kaplan sample of medium to large NA rental equipment companies (United Rental, RSC, H&E, HERC).
‐90
‐60
‐30
0
30
60
90
120
150
2004 2005 2006 2007 2008 2009 2010 2011
CapEx
Based on International Rental News/Dan Kaplan sample of medium to large NA rental equipment companies (United Rental, RSC, H&E, HERC).
(% C
hang
e)(%
Tim
e U
tiliz
atio
n)
(% C
hang
e)
50
55
60
65
70
75
1Q'10 2Q'10 3Q'10 4Q'10 1Q'11 2Q'11 3Q'11 4Q'11 1Q'12 2Q'12 3Q'12
Ind. Avg.
40
45
50
55
60
2009 2010 2011 2012
(AgeinMonths)
Age(months)
Source: Rouse Rental Report. Calendar year-end data for 2009-11 and January 2013.

OSK Investor Slides March 2013
Positive North America Leading Indicators
19
Source: Rouse Asset Services, February 2013.
AWP – Articulating Boom 52.1
Average Age(in months)
Used Equipment Value Trends(OLV)
U.S. Housing Starts
Seasonally Adjusted Rate 2013 2012 Change
January 890,000 720,000 +23.6%Source: U.S. Census Bureau, February 2013.
AWP – Scissor Lifts 57.2
AWP – Telescopic Boom 55.6
39.7% 39.4%
35.0
40.0
45.0
Jul Aug Sep Oct Nov Dec Jan
OLV
(% o
f Cos
t
38.4%39.5%
35
37
39
Jul Aug Sep Oct Nov Dec JanOLV
(% o
f Cos
t
30.9% 30.4%30
32.5
35
Jul Aug Sep Oct Nov Dec JanOLV
(% o
f Cos
t

OSK Investor Slides March 2013
Mixed International Markets
20
• Europe– Agriculture providing growth– Strength in eastern and Nordic
markets– Continued softness in western and
southern Europe• Emerging areas of opportunity
– Rental concept advancing in Brazil& Russia; lagging in China
– Latin American infrastructure driving near term demand
– Energy, mining and agriculture attractive for long-term
• Australia Robust market Delayed projects impacting
2013 demand

OSK Investor Slides March 2013
The Oshkosh Defense Advantage
21
Defense Engineering & Product
Development
Scalable Manufacturing & Operations
Vertical Integration of Specialized
Components
Defense Program
Management
Vehicle Fleet Modernization
Service, Lifecycle
Sustainment
Defense industry expertise that leverages thefull capabilities of Oshkosh Corporation

OSK Investor Slides March 2013
Adapting to the Domestic Defense Spending Downturn
22
Current Operations Profile
New Vehicle Production Aftermarket &
Modernization
Tech & Product Development
Future Operations Profile
New Vehicle Production
Aftermarket & Modernization
Tech & Product Development
HEAVY, MEDIUM & MRAP VEHICLES MEDIUM, MRAP & LIGHT VEHICLES
– Compete to win in Light vehicle segment– Optimize our cost structure
OSK Investor Slides March 2013
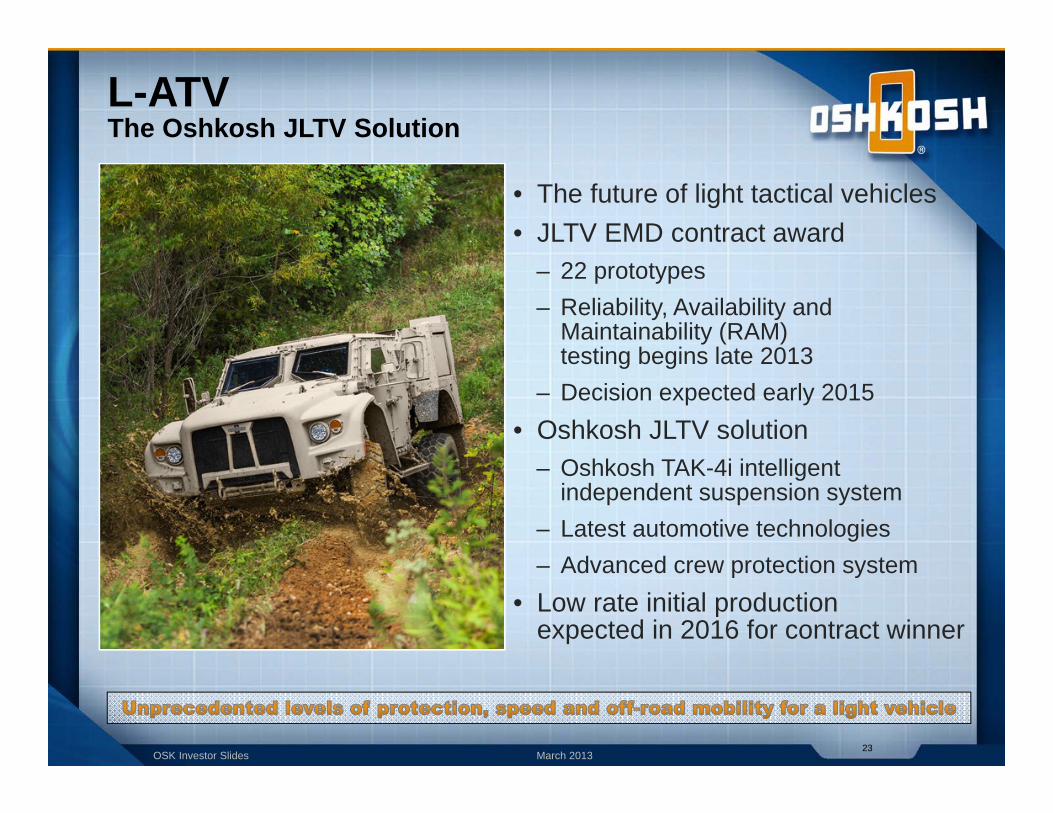
L-ATVThe Oshkosh JLTV Solution
• The future of light tactical vehicles• JLTV EMD contract award
– 22 prototypes– Reliability, Availability and
Maintainability (RAM)testing begins late 2013
– Decision expected early 2015• Oshkosh JLTV solution
– Oshkosh TAK-4i intelligent independent suspension system
– Latest automotive technologies– Advanced crew protection system
• Low rate initial production expected in 2016 for contract winner
23

OSK Investor Slides March 2013
The Fire & Emergency Advantage
24
InnovationLeader
PremierDistribution and Service
Unrivaled Product
Performance
#1 Brands
Leading global provider of specialty vehicles that serve, protect and save lives

OSK Investor Slides March 2013
Domestic Fire Market Drivers Stabilizing
25
• Housing prices and property taxes appear to have bottomedRecent Headlines
Housing starts climb to highest rate since June 2008- Reuters, January 17, 2013
Housing starts projected to rise significantly over next 3 years- Moody’s
Firefighters feel the squeeze of shrinking budgets- Governing magazine
Municipal-debt defaults will remain infrequent and isolated events…- Moody’s
HOUSING PRICES & LOCAL PROPERTY TAXES
• Municipal market has bottomed, expect modest recovery in FY14• Federal funding likely to remain weak through FY14

OSK Investor Slides March 2013
International Market Growth Opportunities• Expect continued growth in
developing countries– Investing in safety and security– Expanding infrastructure
• World air traffic projected to continue growing– Middle East and Asia Pacific
expected to increase 8%-10% per year through 2014
– Driving increased demand for Oshkosh Airport Products
• International customers seeking technologically superior products
26
Pierce Industrial Pumper, Liaoning Province, China
(1)
(1) Source: Air Traffic Growth (regional growth in passenger kilometers) per International Civil Aviation Organization.

OSK Investor Slides March 2013
The CommercialAdvantage
27
Broadest Product Line
Direct Distribution,
Customer Intimacy
Scalable, Flexible
Manufacturing & Operations
Access to Technology, Alternative
Fuels Leadership
Innovation and New Product Development
Best in Class Aftermarket Service and
Support
Integrated factory
Refuse collection vehicle product line
Alternative fuel technology
Street Smart, Street Tough

OSK Investor Slides March 2013
U.S. Mixer Market Unit Growth Analysis
• U.S. housing starts assumptions: 0.8 million in FY13; 1.2 million in FY14; and 1.4 million in FY15
• Concrete mixer parts demand was up 20% in FY12 vs. FY11 and up >100% from the recessionary low
• January 2013 housing starts* at 890,000
28
< 50% of FY06
Volume
0.00.20.40.60.81.01.21.41.61.82.0
2011 2012E 2013E 2014E 2015E
Hou
sing
Sta
rts
In M
illio
ns
U.S. Housing Starts Forecast
Moodys Portland Cement AssociationGlobal Insight Average Analyst Estimate
Assumed one year delay in
mixer demand vs. starts correlation!
* U.S. Census Bureau
Source: 2012 OSK Analyst Day; Rear Discharge Market
OSK Investor Slides March 2013
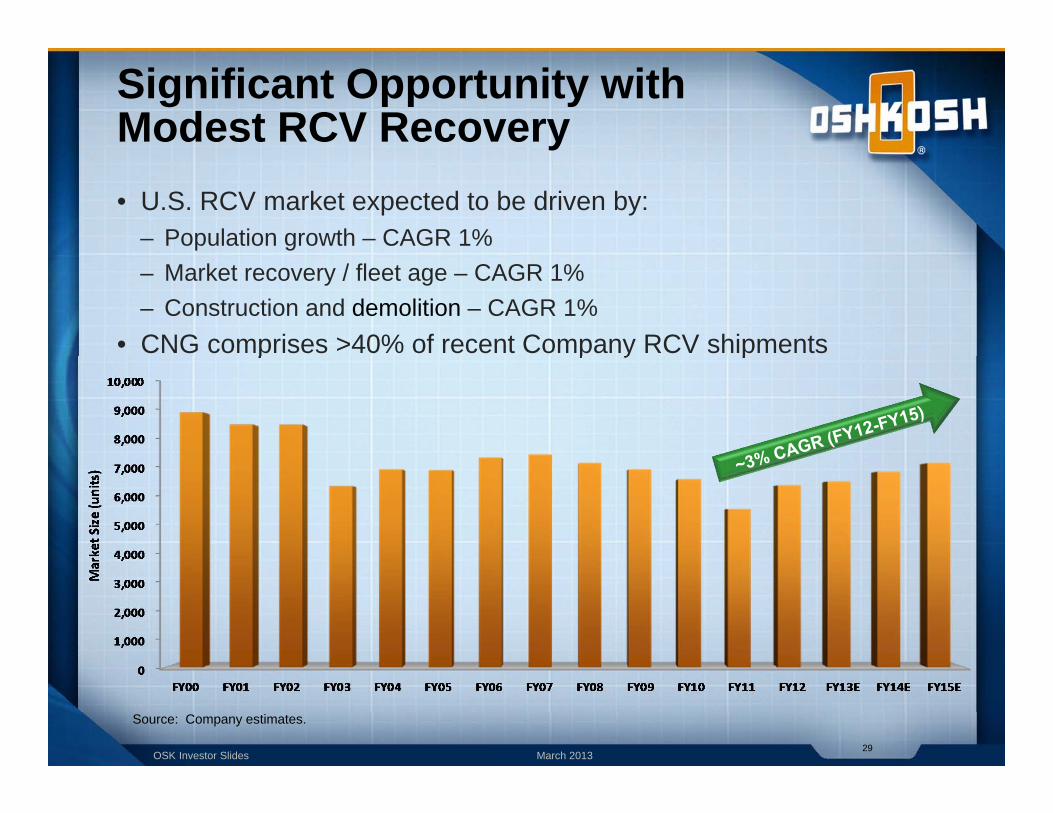
Significant Opportunity with Modest RCV Recovery• U.S. RCV market expected to be driven by:
– Population growth – CAGR 1%– Market recovery / fleet age – CAGR 1%– Construction and demolition – CAGR 1%
• CNG comprises >40% of recent Company RCV shipments
29
Source: Company estimates.

OSK Investor Slides March 2013
Expectations for FY13*
30
Additional expectations• Adjusted corporate expenses ~$130 - $135 million
(share-based compensation and higher IT investment)
• Tax rate of ~32%; including R&D credit reinstatement benefit
• CapEx of ~$60 million• Free cash flow $100 - $125 million• Share count** of ~89 million
Segment information
Measure Access Equipment Defense Fire &
Emergency Commercial
Sales(billions) $2.8-$3.0 $3.2-$3.3 $0.72-$0.75 $0.72-$0.75
Operating Income Margin ~10.5% ~6.5% 2.0%-2.5% 4.5%-5.0%
• Revenues of $7.4 billion to $7.7 billion• Adjusted operating income of $420 million to $455 million• Adjusted EPS from continuing operations of $2.80 to $3.05
Comments on Second Quarter• Expect to benefit from seasonally
driven construction demand andU.A.E. M-ATV sales
* FY13 expectations exclude certain non-GAAP adjustments (see Appendix) and are current as of January 25, 2013
** Excludes impact of any repurchases after December 31, 2012

OSK Investor Slides March 2013
Our Commitment to Shareholders
• Aggressively drive to achieve MOVE targets
• Attack product, process and overhead costs to raise margins
• Apply disciplined capital allocation strategy
• Sustain active shareholder outreach
• Periodically assess strategic options
• Attract highly talented directors and managers
• Deploy Oshkosh Operating System globally to sustain lean culture
31

OSK Investor Slides March 2013
Poised to Deliver Results
• MOVE strategy expected to deliver higher margins throughout cycle• Market recovery, from deep cycle, has commenced
– Is expected to overcome defense downturn • Oshkosh processes and team support execution of MOVE
32
FY12 FY15E
Industry Leading Brands (1)
Access Equipment #1 Global
Fire Apparatus #1 Global
Airport Products #1 Global
Defense TWV (2) #1 Global
Concrete Mixers #1 Americas
Refuse Collection #1 Americas
* Non-GAAP results. See Appendix for reconciliation to GAAP results.
(1) Based on Company estimates.(2) Oshkosh Defense is the leading supplier of heavy, medium and tactical
wheeled vehicles for the U.S. Armed Services.

OSK Investor Slides March 2013
For more information contact:
Patrick N. DavidsonVice President, Investor Relations(920) [email protected]

OSK Investor Slides March 2013
Appendix

OSK Investor Slides March 2013
North America – Strong Rental and Market Conditions, Sustained Growth Cycle• Favorable construction spending outlook• Rental industry robust
– Fleet age 55+ months (near peak)– Utilization near 70% (trending up)– Strong CapEx plans
• Rental penetration continues upward trajectory• Energy projects, industrial retooling driving demand
35
FY15E still well short of
prior peak unit volume
Source: Company estimates

OSK Investor Slides March 2013
EAME – Some Bright Spots Despite Economic Uncertainty• Nordics, Benelux and Germany• Russia (infrastructure), South Africa (mining)
and Middle East (energy and infrastructure)• Relative stability in agriculture• Economic uncertainty in Southern Europe
36
FY15E AWP volume ~50% of peak;
Telehandler volume higher as 60% of demand comes
from Ag
JLG primarily serves the AWP market in EAME
Source: Company estimates

OSK Investor Slides March 2013
Latin America – Brazil Remains Attractive, Construction Strengthening Throughout
• Major projects with over $500 billion in investment expected in Brazil
• Rental concept strengthening• Product adoption increasing in Mexico, Chile and
Panama• Inconsistent supply of capital
37
Demand driven by Olympics,
FIFA World Cup and mining
Source: Company estimates

OSK Investor Slides March 2013
Asia Pacific – Australia Steady, China in Early Phase of Adoption• Australia energy, mining and supporting infrastructure• Rental concept emerging in China• Vietnam, Indonesia and Malaysia showing potential• Singapore adoption growing• Slow recovery in Japan and South Korea
38
Product adoption drives growth
faster than GDPincrease
JLG – Led Formation of
China Work Safety Committee (WSC)
Source: Company estimates

OSK Investor Slides March 2013
Baseline Defense Revenue
39
JLTV EMDGMV 1.1
HMMWV UpgradesInt’l M-ATV
MSVSP-19R, and More
Family of Heavy Tactical Vehicles (FHTV)
M-ATV
Family of Medium Tactical Vehicles (FMTV)
Medium Tactical Vehicle Replacement (MTVR)
Logistics Vehicle System Replacement (LVSR)
Vehicle Support, Aftermarket and Lifecycle Sustainment Services
SandCat
Int’l M-ATV and Other
(1) Baseline assumed in Oshkosh’s EPS outlook
(1)
$1.5-$2.0$0.8-$1.5

OSK Investor Slides March 2013
Non-GAAP to GAAP Reconciliation The table below presents a reconciliation of the Company’s presented Non-GAAP measures to the most directly comparable GAAP measures (in millions, except per share amounts):
40
Fiscal Year Ended Three Months EndedSeptember 30, December 31,
2012 2012 2011Non-GAAP earnings per share attributable to Oshkosh Corporation from continuing operations-diluted 2.27$ 0.60$ 0.39$ Restructuring-related charges, net of tax (0.13) - (0.01) Performance share valuation adjustment, net of tax (0.05) - - Curtailment expense, net of tax (0.02) - - Tender offer and proxy contest costs, net of tax (0.05) (0.11) (0.02) Discrete tax benefits 0.49 0.02 0.07 GAAP earnings per share attributable to Oshkosh Corporation from continuing operations-diluted 2.51$ 0.51$ 0.43$
Net cash flows provided by operating activities 268.3$ 45.1$ Additions to property, plant and equipment (55.9) (8.3) Additions to equipment held for rental (8.4) (1.1) Proceeds from sale of property, plant and equipment 7.6 - Proceeds from sale of equipment held for rental 3.7 3.5 Free cash flow 215.3$ 39.2$
Non-GAAP operating income margin 4.9%Non-GAAP operating income 401.6$ Restructuring-related charges (18.6) Performance share valuation adjustment (7.0) Curtailment expense (3.4) Tender offer and proxy contest costs (6.6) GAAP operating income 366.0$ GAAP operating income margin 4.5%

OSK Investor Slides March 2013
Non-GAAP to GAAP Reconciliation
41
• The table below presents a reconciliation of the Company’s presented non-GAAP measures to the most directly comparable GAAP measures (in millions, except per share amounts):
Low HighCorporateNon-GAAP operating expenses (130.0)$ (135.0)$ Tender offer and proxy contest costs (16.3) (16.3) GAAP operating expenses (146.3)$ (151.3)$
ConsolidatedNon-GAAP operating income 420.0$ 455.0$ Restructuring-related benefits 0.3 0.3 Curtailment expense (0.9) (0.9) Tender offer and proxy contest costs (16.3) (16.3) GAAP operating income 403.1$ 438.1$
Non-GAAP earnings per share attributable to Oshkosh Corporation from continuing operations-diluted 2.80$ 3.05$ Restructuring-related benefits, net of tax - - Curtailment expense, net of tax - - Tender offer and proxy contest costs, net of tax (0.11) (0.11) Discrete tax benefits 0.02 0.02 GAAP earnings per share attributable to Oshkosh Corporation from continuing operations-diluted 2.71$ 2.96$
Net cash flows provided by operating activities 175.5$ 200.5$ Additions to property, plant and equipment (60.0) (60.0) Additions to equipment held for rental (19.0) (19.0) Proceeds from sale of equipment held for rental 3.5 3.5 Free cash flow 100.0$ 125.0$
Fiscal 2013 Expectations

OSK Investor Slides March 2013
Commonly Used Acronyms
42
ARFF Aircraft Rescue and Firefighting M-ATV MRAP All-Terrain Vehicle
AWP Aerial Work Platform MECV Modernized Expanded Capability Vehicle
CNG Compressed Natural Gas MRAP Mine Resistant Ambush Protected
DoD Department of Defense MSVS Medium Support Vehicle System (Canada)
EAME Europe, Africa & Middle East MTT Medium Tactical Truck
EMD Engineering & Manufacturing Development NPD New Product Development
FHTV Family of Heavy Tactical Vehicles OI Operating Income
FMS Foreign Military Sales PLS Palletized Load System
FMTV Family of Medium Tactical Vehicles PUC Pierce Ultimate Configuration
HEMTT Heavy Expanded Mobility Tactical Truck RCV Refuse Collection Vehicle
HET Heavy Equipment Transporter RFP Request for Proposal
HEWATT HEMTT-Based Water Tender ROW Rest of World
HMMWV High Mobility Multi-Purpose Wheeled Vehicle SMP Standard Military Pattern (Canadian MSVS)
JLTV Joint Light Tactical Vehicle TACOM Tank-automotive and Armaments Command
JPO Joint Program Office TDP Technical Data Package
JROC Joint Requirements Oversight Council TFFT Tactical Fire Fighting Truck
JUONS Joint Urgent Operational Needs Statement TPV Tactical Protector Vehicle
KPIs Key Performance Indicators TWV Tactical Wheeled Vehicle
L-ATV Light Combat Tactical All-Terrain Vehicle UCA Undefinitized Contract Action
LVSR Logistic Vehicle System Replacement UIK Underbody Improvement Kit (for M-ATV)