isel- k/1 illinois snapshots of early literacy - pdaisel.com · illinois snapshots of early...
TRANSCRIPT

1
ISEL- K/1Illinois Snapshots of Early Literacy
Kindergarten/Grade 1
TECHNICAL MANUAL
Rebecca BarrCamille L.Z. Blachowicz
Roberta BuhleJeanne Chaney
Carol A. IvyAndrea Uchtman
National College of EducationNational-Louis University
Therese PigottLoyola University Chicago
Guadalupe Suarez-SilvaChicago Public Schools
An ISBE Sponsored Project
2004

2
Table of Contents
Overview of ISEL-K/1 and its Administration 3Description of ISEL-K/1 Materials 7ISEL-K/1 Development 8Individual Snapshot Development-Version 1 9 Snapshot 1: Alphabet Recognition–Upper and Lower Case 9 Snapshot 2: Story Listening-Comprehension and Vocabulary 14 Snapshot 3: Phonemic Awareness 21 Snapshot 4: One-to-One Matching 27 Snapshot 5: Letter Sound Associations 31 Snapshot 6: Developmental Spelling 36 Snapshot 7: Word Recognition 42 Snapshot 8: Passage Reading 48Individual Snapshot Development-Version 2 52 Snapshot 3: Phonemic Awareness - Version 2, Form B 52 Snapshot 6: Developmental Spelling – Version 2, Form B 53 Snapshot 7: Word Recognition – Version 2, Form B 54 Snapshot 8: Vocabulary – Version 2, Forms A and B 55 Snapshot 9: Passage Reading – Version 2, Forms A and B 61 Snapshot 10: Fluency – Version 2, Forms A and B 62Standardization Sample 65Difficulty of the ISEL-K/1 Snapshots 68Reliability of the ISEL-K/1 Snapshots 71Validity of the ISEL-K/1 Snapshots 75Setting Standards for Target and Watch Scores 77References 85Appendix A: Version 1 – 50th Percentile (Target) and 20th
Percentile (Watch) Scores90
Appendix B: Version 2 – 50th Percentile (Target) and 20th
Percentile (Watch) Scores93
Appendix C: Illinois Snapshots of Early LiteracyResearchers, Advisors and Consultants
96
Appendix D: List of Tables 100

3
Illinois Snapshots of Early Literacy-K/1 (ISEL-K/1)
OVERVIEW OF THE ISEL-K/1 AND ITS ADMINISTRATION
What are the purposes of the ISEL-K/1?
The ISEL-K/1 is an individually administered, multifaceted classroom-based readingperformance screening and diagnostic inventory for students in kindergarten and first grade. Thepurposes of the ISEL-K/1 are threefold. They are: (1) to provide screening and diagnosticinventory information for classroom instructional planning (2) to identify students in need of anearly reading intervention program and (3) to provide pre- and post-assessment data to assessprogress.
The ISEL-K/1 has two versions. ISEL-K/1: Version 1 was commissioned by the State of Illinoisto provide a thoughtful, research-based, early literacy assessment that could be administered andinterpreted by classroom teachers as they plan and monitor instruction. This version consists ofsnapshots 1-8 (detailed below) to be used selectively in fall, with the same snapshots availablefor spring assessment. The goal was to provide a menu of assessments, which could be used inunder twenty minutes to get a good picture of student and class performance and progress.
Subsequently, the Illinois State Board of Education requested that the original ISEL-K/1 beenhanced with the addition of snapshots for Vocabulary and Fluency and with a second form forspring testing. ISEL-K/1: Version 2 consists of 10 snapshots (detailed below) with Form A forspring and Form B for fall administration. The added subtests and form are referred to asenhancements in the standardization sample charts.
What are the Illinois Snapshots of Early Literacy (ISEL-K/1)?
All ISEL assessments (ISEL-K/1, ISEL-S, ISEL-2) are based on scientific reading research andsound classroom practice. They reflect best practices in early literacy instruction and are linkedto the Illinois Learning Standards (1994). Along with the ISEL-K/1 described in this manual,there is also a Spanish version (ISEL-S) and an assessment for second grade, ISEL-2. ISEL-2has its own technical manual and teacher’s guide. Each ISEL provides both standardized scoresand qualitative information and has a high level of validity and reliability.
The ISEL-K/1 has three forms: Version 1, which provides the same snapshots with fall andspring norms for performance; Version 2-A for fall assessment and Version 2-B for springassessment. These ISEL-K/1 snapshots provide information useful to teachers as they plan anddevelop classroom-based reading instruction. Because of its link to Illinois Learning Standards(1994) the ISEL-K/1 can guide the development of curriculum as well as the design of effectivemodels for early intervention.
Administered to students individually within the classroom setting, the ISEL-K/1 is based onscientific reading research and sound classroom practice. Included in the ISEL-K/1 are snapshotslisted in the chart below:

4
Snapshot Version 1 Version 2-A and BAlphabet Recognition: upper and lower case √ √Story Listening: comprehension and vocabulary √ √Phonemic Awareness: initial consonant √ √One-to-One Matching √ √Letter Sounds √ √Developmental Spelling √ √Word Recognition √ √Passage Reading √ √Vocabulary √Fluency √
Which snapshots should be used for screening?
Each grade level of ISEL-K/1 has two snapshots which are recommended for fall screening Eachis highly reliable and valid and combined administration time is 10 minutes or less per child.Recommended for fall screening:
For Kindergarten: Alphabet recognition; Letter Sounds. Developmental spelling may besubstituted for letter sound in areas where pre-school writing is prevalent. The subtestsare equivalent in reliability.For First Grade: Word Recognition; Developmental spelling
When should the ISEL-K/1 be given and to which students?
Field-testing, advisory review and psychometric evaluation suggest that different snapshots aremore useful as inventories for different grades at different times of the year. Norms are provided(Target Scores which are the 50th percentile score) for the beginning and the end of kindergartenand first grade and can be used to help make instructional decisions. However, teachers maywish to assess the progress of their students at other points during the school year. To assessprogress teachers may wish to administer Version 1 with the same snapshots as a pre-and post-assessment measure or to use Version 2-Form A for fall and B for spring. If teachers wish toshorten the assessment time, guidelines for abbreviated administration shown in Table 1 may behelpful. A general rule of thumb is to skip any assessment for spring testing that showed mastery(0 or 1 error except for alphabet which may have 2 errors) in fall.

5
Table 1. Snapshots Recommended for Abbreviated ISEL-K/1 Administration
ISEL-K/1 Snapshots: # ofitems
Beginning ofkindergarten
End ofkindergarten
Beginningof firstgrade
End offirstgrade
Alphabet Recognition: Upper andLower Case
54 √-Screening
Story Listening: Comprehension& Vocabulary
21 √ √
Phonemic Awareness: InitialConsonant
10 √ √ √
One-to-One Matching 9 √ √ √Letter Sounds 26 √-Screening √ √ √Developmental Spelling 27 √ √-
Screening√
Word Recognition 22 √-Screening
√
Passage Reading- Version1/Version2 12/
20√ √
Vocabulary 14Fluency -Do not readminister any mastered in fall (0-2 errors on alphabet; 0-1 errors on all other snapshots) in the spring
Beginning of Kindergarten: The snapshots appropriate for most children at the beginning ofkindergarten are: Alphabet Recognition, Story Listening, Phonemic Awareness and One-to-One Matching. The remaining snapshots may be appropriate for some kindergarten children.If children perform well on Phonemic Awareness and One-to-One Matching, testing shouldproceed to the next snapshots
End of Kindergarten: The snapshots appropriate for most children at the end ofkindergarten are: Story Listening, Phonemic Awareness, One-to-One Matching, LetterSounds and Developmental Spelling. Word Recognition and Passage Reading may also beappropriate for some kindergarten children. At the end of the year, it will not be necessary toreadminister any snapshots on which a child received a perfect score, or missed one item (2items on Alphabet Recognition are acceptable). For example, if a child receives a score of 53on Alphabet Recognition in the beginning of the year, the teacher can enter that score at theend of kindergarten without readministering the snapshot.
Beginning of First Grade: The snapshots appropriate for most children at the beginning offirst grade are: Phonemic Awareness, One-to-One Matching, Letter Sounds, DevelopmentalSpelling, Word Recognition and Passage Reading. If children experience considerabledifficulty with these, Alphabet Recognition and Story Listening should also be administered.

6
End of First Grade: The snapshots appropriate for most children at the end of first grade are:Letter Sounds, Developmental Spelling, Word Recognition and Passage Reading. However,administering the Alphabet Recognition, Story Listening, Phonemic Awareness, One-to-OneMatching snapshots may be appropriate for some children who are less advanced readers. Atthe end of the year, it will not be necessary to readminister any snapshots on which a childreceived a perfect score, or missed one item. For example, if a child receives a score of 25 onLetter Sounds, the teacher can enter that score at the end of first grade withoutreadministering the snapshot.
Should the ISEL-K/1 be administered to every kindergarten and first grade student?
The ISEL-K/1 offers teachers information about each student that otherwise might requireseveral hours or weeks of classroom observation. Ideally, therefore, it is recommended that allstudents in the class be assessed with some snapshots at during the school year. To monitorprogress more accurately, beginning year pre-testing and end-of- year post-testing are suggested.Time and other considerations may limit the administration of ISEL-K/1 assessment to studentswhose expected progress is questionable or uncertain.
How long does it take to administer the ISEL-K/1?
The Screening items take require 10 minutes or less. Classroom teachers can administer theabbreviated ISEL-K/1 within a reasonable time period (20 minutes), and obtain informationabout what the student knows about reading and how he or she approaches reading and reading-related tasks. Most snapshots and each passage reading selection take less than five minuteseach to administer. Story Listening Vocabulary and Comprehension and the DevelopmentalSpelling snapshots typically take 5-8 minutes to administer.
How does the ISEL-K/1 differ from other early literacy assessments?
Most standardized reading tests fail to provide qualitative information pertinent for instructionalplanning. The ISEL-K/1 is designed to inventory the significant aspects of beginning reading.Although teachers develop, modify and/or adopt informal assessment instruments to provide aclearer understanding of their students’ needs, often these measures focus on a single element ofreading development such as Alphabet Recognition or Phonemic Awareness to the neglect ofother important dimensions. The variety of snapshots included in the ISEL-K/1 provides anoverview of the child’s competencies, hence the term “snapshot.” Educators have developedsimilar assessments to be used in classrooms; nonetheless, the time required to administer themeasures frequently exceeds the time available to the classroom teacher.
Who can administer the ISEL-K/1?
The classroom teacher, reading specialist and other support staff can administer the ISEL-K/1.Videos on the administration of the inventory are available from the Illinois State Board ofEducation in both tape and CD formats. Our field tester training suggested that it takes anexperienced reading teacher less than 4 hours, typically 2- 2 hour sessions, to learn how to

7
administer and score the ISEL-K/1 reliably. For inexperienced teachers or paraprofessionals alonger time period may be necessary.
DESCRIPTION OF ISEL-K/1 MATERIALS
What is the format of the ISEL-K/1 materials?
With the exception of paperback books used for Story Listening and Passage Reading, mastercopies of all materials are available for download on the Illinois State Board of Education (ISBE)website, www.ISBE.net.• The Administration Booklet should be printed in black ink on tagboard or other heavy white
paper and spiral bound or stapled. Student booklet pages contain large, clear print and/orpictures free of background clutter. Pages are numbered and labeled with the name of the“snapshot.”
• Scoresheets should be printed in black ink on plain copy paper.• Paperback books for passage reading must be purchased from appropriate vendors. FOR
THE ISEL-K/1, the passage reading books are:
THE CARROT SEED, byRuth KrausIllustrated by CrockettJohnson,Harper Collins (paperback)10 East 53rd StreetNew York, New York, 10022212-207-7000ISBN 0-06-443210-6
TOY MODELS, by MargieBurton, Cathy French, andTammy JonesBenchmark EducationCompany:629 fifth AvenuePelham, NY 108031-877-236-2465ISBN 1-892393-68-9-C
MY BIKE, by May NelsonPhotographed by Jeff RicheyThe Wright Group222 East Danieldale Rd.Desoto, TX 75115800-648-2970ISBN 1-57257-906-4
PAINT MY ROOM, by Roger CarrIllustrated by Peter Paul BajerSundance PublishingP.O. Box 1326, 234 Taylor StreetLittleton, MA 0146301-800-343-8204ISBN 0-7608-4197-X
WIND POWER, by Pat Quinn & BillGaynorIllustrated by Donna CrossLearning Media LimitedDistributed in the US by Pacific LearningP.O. Box 2723/15342 graham St.Huntington Beach, CA 92647-07321-800-279-0737ISBN 0-478-20494-9

8
ISEL-K/1 DEVELOPMENT
ISEL-K/1 Development
The ISEL-K/1 was designed to be easily administered by teachers to yield an early literacyassessment within a relatively brief time period (about twenty minutes) when grade appropriatesnapshots are given. Kindergarten and first grade children and their teachers from nineschools/districts in the northern part of Illinois served as field-study collaborators in 2000-2001.One goal for the first year’s field testing was to assess the pilot version of the ISEL-K/1 in termsof clarity of directions, ease of administration and scoring, and time for administration. Based onthe administration of the ISEL-K/1 in the fall of 2000, directions for administration and scoringwere refined and clarified, and snapshot items were eliminated, refined and sequenced in termsof difficulty. The development of each snapshot and the refinements that were made during thefield test year are described in detail in the third section of this manual. The additional subtestsand form for Version 2 were designed and field-tested in 2002-2003.
ISEL-K/1: Version 1 consists of the 8 original snapshots. The same version of the ISEL-K/1 wasused to collect norming data in the fall and spring of kindergarten and first grade to see howstudents improve over time on instructionally relevant tasks. Because only selected tasks areadministered at different times of the year and in different grades, students repeat few snapshots.In 2002-2003, Version 2, with two forms, was developed and field-tested. This version addssnapshots for Vocabulary and Fluency to comprise Form A as well as adding Form B. Thescoring on the Passage Reading was also changed to include the comprehension questions whichchanged the number of items from 12 to 20. Norming data for Version 2 were collected in 2003-2004. This is referred to as the enhancement field testing and norming in the standardizationtables.

9
INDIVIDUAL SNAPSHOT DEVELOPMENTVersion 1
ISEL-K/1 SNAPSHOT 1: ALPHABET RECOGNITION - UPPER AND LOWER CASE
Background and Purpose
Letter Recognition is one of the preliminary precursors of literacy. Children who learn toidentify features of letters and to distinguish letters from one another with control are preparedfor learning “systematic associations like the alphabetical names and sound equivalents” (Clay,1993). An inventory of known letters shows the extent to which children are familiar with thevisual details of print and their names. It is essential that children grasp the concept that lettershave unique features and specific names (Adams, 1990).
Ordering of Letters
Table 2. Proportion of kindergarten and first grade children at the beginning of the schoolyear who correctly identify the upper and lower case letters
UppercaseLetters
KindergartenPercent CorrectN= 232
First GradePercent CorrectN=220
LowercaseLetters
KindergartenPercent CorrectN= 232
First GradePercent CorrectN=220
OBAXCZSEPLTMFWKRDIYQHGNJUV
8987848382818074737272727171707069696867676766666559
9999999699969897979897969897969897979496959797939495
ocxsziewpmkrytavjfuanhbgdlqg
84837878757171676666666463626159595954535047434134342524
99999898979698959597979795969795919795979593819381777875

10
In Snapshot 1, students are expected to differentiate letter features and identify 26 upper case and28 lower case letters by name, including the special typeset "a" and "g" as these forms are foundin books and writings. In this snapshot, the upper- and lower-case letters are listed horizontallyfrom easiest to most difficult. The order of the letters was determined through field tests in thefall of 2000 with more than 450 kindergarten and first grade children. Table 2 shows theproportion of kindergarten and first grade children correctly identifying each of the upper caseletters.
Most of the first grade children (97%) identify all the uppercase letters quickly and accurately.Many of the kindergarten children (80%) identify the easiest uppercase letters correctly, whereasonly about sixty percent identify the most difficult letters. We have ordered the letters on thebasis of the performance of the kindergarten children since they are still in the process oflearning the letter names, whereas they are known by most of the first graders.
Table 2 also shows the proportion of kindergarten and first grade children correctly identifyingeach of the lower case letters at the beginning of the school year. As can be seen, the easiestletters for both groups are "o", "c", "s", "x" and "z". The most difficult are the regular type setforms of "g", "q", "l", "b" and "d". These are four of the letters that are most easily confused asreversals.
Suggestions for Task Administration
In administering Snapshot 1, Alphabet Recognition, if a child is unable to identify the first rowof upper-case letters, the teacher may wish to have the child simply scan the remaining letters tosee if any are known. This decision was based on a cross-tab analysis of the kindergarten sample(n = 232). Of the eleven children who missed the first six easiest upper case letters, none wasable to identify any of the remaining letters. In contrast, of the eight children who identified oneletter of the first six, several children recognized one or more letters after the first six. Often theyrecognized the first letter of their name. Similarly, of the 21 children who missed the first sixeasiest lower case letters, none was able to identify any of the remaining letters. In contrast, ofthe nine children who identified one letter of the first six, several children recognized one ormore letters after the first six. Thus, if a child knows no letters the first row of letters, it isappropriate to have the child scan the remainder to see if he or she knows any other letters, and ifnot, to discontinue the assessment.
Difficulty of Task
The Alphabet Recognition Snapshot was administered to children in the fall and spring ofkindergarten and first grade. Table 3 shows the results from these administrations in terms ofmean raw scores, standard deviations, and percent correct. As can be seen, most growth occurson this Snapshot during the kindergarten year. By the end of kindergarten, children havemastered an average of 93-95 percent of the upper and lower case letters. Only minor gains areseen during the first grade year, perhaps by the small number of children who have not attendedkindergarten.

11
Table 3. Means, standard deviations, and percent correct on the Alphabet RecognitionSnapshot for children in the fall and spring of kindergarten and first grade
Alphabet Recognition(Total=54)
Mean RawScore
StandardDeviation
PercentCorrect
Fall Spring Fall Spring Fall Spring
Kindergarten2000-01 (n= 217)2001-02 (n=527)
First Grade2000-01 (n= 217)2001-02 (n=523)
35.733.7
51.551.8
50.451.4
53.553.7
17.217.0
10.5 4.0
6.45.1
1.7 .7
6662
9596
9395
9999
Predictive Validity
Concurrent validity is reported in the section on validity. The face and content validity of theAlphabet Recognition task is self-evident. That is, if a teacher wishes to know whether a childcan identify the letters of the alphabet, this snapshot provides this information. Since all upperand lower case letters are tested, no sampling is involved. The snapshot is a performancemeasure of letter naming.
But does good performance on this snapshot predict successful reading development? Torecognize a letter, the child must not only be able to identify the visual form but also to connectthat to its name. Because the name often includes the sound of the letter, Alphabet Recognitionwould appear to facilitate the learning of Letter Sounds. This in turn might facilitate WordRecognition and Passage Reading. Table 4 shows the extent to which good performance onAlphabet Recognition at the beginning of the year is associated with good performance on otherearly literacy measures taken at the end of the year for kindergarten and first grade children fortwo successive years.

12
Table 4. Predictive Validity- Correlation coefficients showing the relation betweenAlphabet Recognition measured in the fall to other areas of early literacy measured in thespring for kindergarten and first grade
Fall AlphabetRecognition
SpringAlphabetRec.
SpringStoryListen’g
SpringPhonemeAware.
Spring1-to-1Match
SpringLetterSounds
SpringDevelopSpelling
SpringWordRecog.
SpringPassageRead’g
Kindergarten2000-01 (n=217)2001-02 (n=527)
First Grade2000-01 (n=207)2001-02 (n=523)
.59
.44
.34
.16
.36
.36
.18
.17
.50
.41
.34
.24
.62
.47
-.06.20
.62
.45
.45
.14
.59
.47
.37
.26
.64
.56
.36
.35
.55
.59
.36
.35
The coefficients for the kindergarten samples are substantial and statistically significant. Asmight be expected, Alphabet Recognition shows a strong relation with knowledge of LetterSounds, Developmental Spelling, and Word Recognition. It is also highly correlated withchildren’s ability to derive a one-to-one match between spoken and printed words and withPassage Reading. The low coefficients for the first grade sample are an artifact of the narrowvariation in alphabet knowledge in the fall of first grade since almost all first graders knew allthe letter names (see Table 3).
Regional Reliability
Overall reliability is reported in the later section on Reliability. Table 5 shows the reliabilitycoefficients by region which are high, particularly in the fall for both grades. Spring coefficientsdecline for both kindergarten and first grade. We suspect that this is because children are taughtthis information if they do not know it, thus increasing the degree of mastery within groups andthereby decreasing the magnitude of the reliability coefficients (see Table 3), somewhat forkindergarten, but markedly for first grade.

13
Table 5. Fall and spring reliability coefficients (Cronbach alpha) for kindergarten and firstgrade samples on Alphabet Recognition
FALL SPRINGKindergarten n Cronbach alpha n Cronbach alphaRegion 1 (2000-2001) 217 .9805 217 .8652Region 1 (2001-2002) 277 .9793 247 .9370Region 2 (2001-2002) 34 .9776 35 .8022Region 3 (2001-2002) 67 .9706 67 .8897Region 4 (2001-2002) 46 .9717 44 .9262Region 5 (2001-2002) 103 .9796 92 .7787Region 6 (2001-2002) 49 .9785 45 .8947 Average Coefficient 0.9768 0.8705
First GradeRegion 1 (2000-2001) 207 .9597 207 .8788Region 1 (2001-2002) 283 .9204 199 .2670Region 2 (2001-2002) 78 .9044 71 .3839Region 3 (2001-2002) 61 .7973 58 .5851Region 4 (2001-2002) 67 .8868 64 .6218Region 5 (2001-2002) 59 .8420 51 .5395Region 6 (2001-2002) 48 .9453 46 .1676 Average Coefficient 0.8937 0.4441

14
ISEL-K/1 SNAPSHOT 2: STORY LISTENING - COMPREHENSION ANDVOCABULARY
Background and Purpose
Listening is the foundation for the language arts and is the first acquired language mode. Despiteits fundamental nature (or because of it), listening is often a neglected language art (Tompkins,2001). Listening to stories is especially important because students develop a “sense of story” aswell as increase their vocabulary knowledge (Eller, Pappas, & Brown, 1988; Dickinson & Smith,1994). Listening to stories fosters an interest in books and reading. Furthermore, story listeningprovides a springboard to meaningful discussion, thus helping students acquire an essentialliteracy and school learning skill (Dyson & Genishi, 1994; Snow, Burns & Griffin, 1998)).
In Snapshot 2, students are expected to listen, “carry away information” (Rosenblatt, 1935,1979), and respond to story-based questions. Nine questions assess the children’s ability torespond to queries concerning information:
• contained in the text and in the structure of the story (questions 1, 2, 3, 4, and 5)• inferred from the text (question 6)• related to conceptual and vocabulary knowledge (questions 7 and 8)• demonstrated by personal response (question 9)
Additional points are given for some items when children use specific vocabulary containedwithin the story.
Story Listening Comprehension
Literacy instruction generally includes listening to or reading stories and then discussing themwith the teacher or with others. A student's ability to retell or answer questions about a storyheard or read is also a traditional model of literacy assessment (Johns, 1999). Studentperformance on such tasks allows the teacher to observe general comprehension, vocabulary use,and abilities to note the literal information in a story as well as to make inferences andconnections. Because talk is such a powerful tool for observing the understanding of youngchildren, because the language used by children is connected to school success and becauseperformance assessment holds such promise for understanding reading comprehension(Marzano, Pickering & McTighe, 1992), we designed a story listening comprehension task forthe ISEL-K/1.
It is important to emphasize at the outset that this snapshot is not a measure of listeningcomprehension as it has been commonly understood in classrooms in tasks that involvefollowing directions. Rather, we have attempted to structure a quick sample of how a studenttalks about something that has been read by the teacher, with questions and answers that follow(Cazden, 1992; Durkin, 1978-79). This procedure is common in many classrooms (the teacherInitiates with a question, a student Responds, and the teacher Evaluates its appropriateness). The

15
IRE format was decided upon rather than a retelling because it is easier for inexperiencedteachers and paraprofessionals to administer questions and score responses. In practice, the firstquestion sometimes elicits a retelling which answers many questions and the ISEL-K/1 Teacher'sGuide provides an option for using retelling. For the purposes of standard field-testingprocedures, however, we used the questions. The goal of giving the Story Listening snapshot isto enable the teacher to note those students who differ dramatically from the general responsemodes of the class or from her/his expectations so that instruction or further investigation can beplanned.
Book Selection
The Carrot Seed (Kraus, 1945; 2000) was chosen because it is an award-winning book for youngchildren that was recommended by a panel of kindergarten advisors, has simple illustrations,simple but natural language, and vocabulary appropriate to kindergarteners and first graders.One of the central concepts, that of plants and planting, is placed at an early primary level by TheLiving Word Vocabulary (Dale & O'Rourke, 1976), by current work on children's understandingof these concepts (Biemiller & Slonim, 2001) and by examinations of concepts and vocabularycommon to school instructional materials (Harris & Jacobson, 1982). The Carrot Seed has beena perennial teacher's choice since its publication and was deemed appropriate by our advisorypanel of experienced teachers. It also allows for some discussion and questions -- no mean featin a short book where constructing more than two questions can be a real stretch. It is alsoavailable in English and in Spanish.
Development of the Task
The task involves the teacher reading aloud to a child with questions following. The goal is totap the child's understanding of the general story structure and events and key vocabulary, aswell as to leave room for some inferential thinking and personal connections. We went throughmany iterations of the question list as well as differing organizations of the question chain,field-testing them with a number of children and teachers, before we arrived at the pilot version.Changes involved dimensions that reflect the literature on the complexity of design ofcomprehension measures involving issues of:
Question Placement. We needed to decide whether or not to have questions on vocabularyincluded in the flow of the story or to ask them after the story line was established. Teacherspreferred not to interrupt the talk about the story to talk about vocabulary as separate items. Thatapproach was viewed as disjointed, interrupting the flow of thought for the students andconfusing them. So vocabulary questions were placed at the end except when needed toestablish the story line.
Question Wording. Students not used to "doing school," are often unfamiliar with the academiclanguage of the classroom (Baker & Kame’enui, 1995; Snow, 1991). We found we neededprobes for academic language such as, "How did the story begin?" or "How did the story start?"Children who weren't sure what we were asking here could very well answer the question, "Whatwas the first thing the little boy did." So we clarified language involving words such as "begin,""start," "end" which are difficult for some of the children to interpret. Pronoun referents were

16
also a problem. One story-chain question asked, "What did his family say to him?" (Answer: "Itwon't come up."). When the next question asked, "What did he do after that?" students haddifficulty answering. When it was phrased, "What did he do after they said, ‘It won't come up?’"they could answer.
Lastly, the final question, attempting to see if the child would make any personal connections orevaluative comment, became a string of probes when no single question or probe was clear.While this may seem a gratuitous question given that any answer other than silence or "I don'tknow" is scored, we were struck that some children could not be nudged into giving any answer,raising a red flag for teachers that they might need special nurturing for class participation.
Vocabulary Choice. There are a number of age appropriate words in The Carrot Seed, whichare potentially useful to probe vocabulary knowledge. We started with "ground, " "plant," and"seed" and then examined pupil responses to "carrot," "weed," " dig," "grow," "hole," andothers. We used the responses of students and the estimates of comprehensibility from theLiving Word Vocabulary (Dale & O’Rourke, 1976), using Biemiller and Slonim's (2001) workon this corpus, along with Basic Reading Vocabularies (Harris & Jacobson, 1982), to choose thefinal sets of words shown in Table 6.
Table 6. Ranked difficulty ratings of words using The Living Word Vocabulary (LWV)and Harris-Jacobson Basic Elementary Reading Vocabularies (HJ).
Word Living WordVocabulary
Percent known*
Harris-Jacobson Basic ElementaryReading Vocabularies
Grade estimate
plant 96 early firstseed 92 early firstground 97 1dig 85 2hole 81 1carrots 81 2weed 76 2
* Rating for familiarity at 4th grade (higher percentages indicate easier word)
Based on pupil response, these words represented a range of difficulty, albeit a short one, andallowed for some superordinate categorization. "Weed" is definitely the most difficult word, byour estimates and prior research. The illustration in the book shows small sticks rising out of theground. For students who have little prior knowledge of planting, the answer, "those little sticks"is commonly given and is counted as correct for a comprehension answer, through not forvocabulary as we note below.
Scoring
We started with a set of ten basic questions. Based on an analysis of data from four classrooms,we identified the most common responses. We noticed that teachers were loathe not to credit

17
students with any indication of comprehension to make sure they didn't short change theirestimations of their students. Yet they clearly thought that some students comprehended more,or more fully or richly, than others, or had more sophisticated funds of prior knowledge andvocabulary to bring to bear on discussing the book. For example, for the question, "How didthe story begin? (What was the first thing the little boy did?)" a student might answer : "He putsomething in the ground." Another might answer, "He planted a seed." Teachers wanted to giveboth students credit but wanted to give more for the second response.
Similarly, when students were probed about vocabulary, such as "What is a carrot?", teacherswanted to give credit to students who said," Something that bunnies eat," but more credit to thechildren who said, "It's a vegetable you eat." Some children provided a superordinate along witha functional definition revealing more advanced levels of development than those giving onlyfunctional definitions (Feifel & Lorge, 1950). For the question on "weeds" the response "littlesticks" indicates that students had comprehended what was in the book but were unable toconnect it to prior knowledge or vocabulary.
To investigate the definitional ability of children more systematically, we used a Q-Sort Process(McKeown & Thomas, 1988) on the data from the four classrooms. We had teachers andassessors sort their students into those with excellent comprehension and those with belowaverage comprehension with a default middle group. We then transcribed and analyzed theresponses and had the assessors classify answers in categories. Within the category of correct,we had 2-3 levels of "correctness." Examining the factors that accounted for these difference, wefound that specificity in vocabulary use was a factor characterizing those classified as excellent;lack of vocabulary specification was associated with low comprehension. Research on children'sstory listening indicates, however, that definitional specificity can be learned; students adopt thevocabulary of the author as they become more familiar with a book (Elley, 1988; Eller, Pappasand Brown, 1988; Dickinson & Smith, 1994).
In sum, the scoring of Snapshot 2 is designed to acknowledge richer, more sophisticatedlanguage use. Students receive 1 point for an answer that is “reasonable” or logically follows thestory line. A maximum of 2 additional bonus points are awarded for the use of specific languageor that reflective of particular conceptual knowledge. Examples of “reasonable” and “bonus”responses are included on the score sheet to assist in scoring the snapshot.
Difficulty of Task
The Story Listening Snapshot was administered to children in the fall and spring of kindergartenand first grade. Table 7 shows the results from these administrations in terms of mean rawscores, standard deviations, and percent correct. Because of differences in the number of itemsfrom fall to spring it is difficult to interpret the results from the field test year. The results for thepercent correct suggest that there are relatively low gains during the school year and more duringthe summer between kindergarten and first. Alternatively, it may be that adding the vocabularyitems to the snapshot increased the difficulty of the snapshot so that what appear to be limitedgains are in fact greater than they appear. In contrast, the results from the standardization yearshow gains occurring during the kindergarten and first grade years, as well as during thesummer. Nevertheless, growth in vocabulary and comprehension, as measured by this task,

18
appears to occur at a relatively slow pace in comparison to the growth on measures of children’sknowledge about print, such as alphabet recognition and letter-sound knowledge.
Table 7. Means, standard deviations, and percent correct on the Story Listening Snapshotfor children in the fall and spring of kindergarten and first grade
Story Listening * Mean RawScore
StandardDeviation
PercentCorrect
Fall Spring Fall Spring Fall Spring
Kindergarten2000-01 (n= 217)2001-02 (n=527)
First Grade2000-01 (n= 207)2001-02 (n=523)
7.14*13.41
8.21*16.47
15.0416.16
17.4417.65
2.134.49
1.423.16
3.773.56
2.592.94
7164
8278
7277
8384
* As previously described, there were 10 items on the fall version of the snapshot during the field testyear and 22 during the spring.
Predictive Validity
Overall validity is reported in the later section on Validity. On the face of it, the validity of theStory Listening task would seem to be obvious: a child listens to a story read aloud and thenresponds to questions asked by a teacher. Since the task is individually administered, it is likelythat the children's performance will be similar to what the teacher observes when she reads astory aloud to the class. Whereas teachers in classrooms are often unsure about whether aparticular child has understood a story, Snapshot #2 provides the basis for more individualizedand complete assessment.
There are, however, two areas of concern. First, a single story has been sampled from a verylarge set of stories that might have been selected. Would we get the same results if we had useda different story? Our best source of evidence is that teachers who have used the assessmentclaim that what they see on the ISEL-K/1 relates to what they see in the classroom. Moreover,they claim that the nature of the questions and the scoring approach has enabled them to observechildren's language in more complex ways.
Second, what exactly is measured? Is it simply children’s comprehension of a story? Or does italso reflect children’s ability to attend to a story and to monitor its content? Or does it tap thechild’s ability to verbalize what is understood? We believe that monitoring content is involved,and that this is what comprehension is. But may not the comprehension of some very shychildren be underestimated in the first weeks of kindergarten? We believe that this is apossibility and that teachers should trust their observations about the comfort of a child. It maybe that the validity of the task with a particular child is influenced by feelings of confidence;accordingly, the teacher should be aware that the listening comprehension of some childrenmight be underestimated. Similarly, children may not have had the opportunity to become

19
familiar with “school language.” They may not have yet learned the meaning of certainquestions and their implicit expectations for certain forms of responses. These considerationsmay affect the validity of the Story Listening task – yet these are also considerations that mayaffect children’s participation in school tasks more generally. To this extent, the Story Listeningtask provides teachers with important insights into how children understand stories early in theschool year.
A somewhat different question pertains to whether good performance on this snapshot predictssuccessful reading development. Table 8 shows the extent to which performance on storylistening comprehension at the beginning of the year is associated with performance on otherearly literacy measures for kindergarten and first grade children taken at the end of the year.
Table 8. Predictive validity- Correlation coefficients showing the relation between StoryListening measured in the fall to other areas of early literacy measured in the spring forkindergarten and first grade
Fall StoryListening
SpringStoryListen’g
SpringPhonemeAware.
Spring1-to-1Match
SpringLetterSounds
SpringDevelopSpelling
SpringWordRecog.
SpringPassageRead’g
Kindergarten2000-01 (n=217)2001-02 (n=527)
First Grade2000-01 (n=207)2001-02 (n=522)
.41
.62
.36
.46
.43
.43
.25
.33
.42
.36
.23
.14
.24
.31
.21
.13
.36
.37
.22
.30
.29
.28
.17
.27
.32
.32
.18
.32
As is true for most listening comprehension measures, those that tap knowledge of print relate tostory listening at a moderate, although statistically significant level. Story Listening in the fall ismost closely related to Story Listening in the spring. Other snapshots with higher correlationcoefficients in kindergarten also depend on listening ability (One-to-One Match and PhonemicAwareness). Yet, longitudinal studies show that early listening measures are strong predictors ofreading achievement after children have developed fluency and automaticity with print(Cunningham & Stanovich, 1997; Juel, 1988). Early attention to comprehension and vocabularymay minimize what is known as the “fourth grade slump” when children with strong facility withprint fail to achieve at a similar level in their reading comprehension (Biemiller, 2001). Hence,we believe that the inclusion of the story listening snapshot and the instruction it promotes isimportant in realizing the balanced conceptual development of children.
Our interview data shows this snapshot to be particularly interesting to teachers. Many hadnever attempted to observe story listening and the discussion behaviors of their students in astructured fashion. They reported that this task provided new insights into the thinking and oralexpression of their students. We think that this snapshot is a promising vehicle to promote staffdevelopment, as well as provide assessment insights about children.

20
Regional Reliability
Overall reliability is reported in the later section on Reliability. Table 9 shows the reliabilitycoefficients by region which are in the moderate range. What is most interesting is the extent towhich the coefficients increase from fall to spring when we refined the system of scoring toreflect vocabulary as well as comprehension. These results suggest that the measure issufficiently reliable for use with kindergarten children and first graders in the fall, but should beused with some caution in the spring of first grade.
Table 9. Fall and spring reliability coefficients (Cronbach alpha) for kindergarten sampleson Story Listening
FALL SPRINGKindergarten n Cronbach alpha n Cronbach alphaRegion 1 (2000-2001) 217 .7072* 217 .7892Region 1 (2001-2002) 279 .8357 248 .8442Region 2 (2001-2002) 34 .8884 21 .8146Region 3 (2001-2002) 67 .6679 67 .6102Region 4 (2001-2002) 46 .8568 44 .6583Region 5 (2001-2002) 104 .8352 92 .6994Region 6 (2001-2002) 49 .8915 45 .8479 Average Coefficient 0.8118 0.7520
First GradeRegion 1 (2000-2001) 207 .4337* 207 .6550Region 1 (2001-2002) 283 .7384 200 .7222Region 2 (2001-2002) 78 .6997 71 .7338Region 3 (2001-2002) 61 .7593 58 .7460Region 4 (2001-2002) 67 .7711 64 .8671Region 5 (2001-2002) 60 .8099 51 .6035Region 6 (2001-2002) 48 .8407 46 .5988 Average Coefficient 0.7699 0.7038* During the fall of 2000 a set of ten comprehension questions was used; because of the low reliabilitythis was expanded to a set of 21. The first coefficient is not included in the average.

21
ISEL-K/1 SNAPSHOT 3: PHONEMIC AWARENESS
Background and Purpose
Phonemic awareness is the understanding that words are composed of sounds, which can beheard, manipulated, and thought about apart from their meaning (Snow, Burns & Griffin, 1998).Phonemic awareness is a gradually developing process that begins during the preschool yearsand continues during the early years of schooling. Children with emerging phonemic awarenessare able to discern, for example, that box and best begin with the same sound and that sat andfront end with the same sound. A substantial body of research demonstrates that phonemicawareness leads to reading success among kindergarten students and reading performance amongfirst and second grade students (Bradley & Bryant, 1983; Lundberg, Frost & Petersen, 1988).Because of their awareness of the sounds of words, children become more able to discern thealphabetic nature of English (Ehri, 1998).
Many different aspects of phonemic awareness can be assessed. These include selecting a matchfor an initial consonant (onset), producing an initial consonant, selecting a match for a rhyme(word endings), producing a rhyme, segmenting phonemes in words, and blending phonemes.We decided to include two tasks in the ISEL to assess phonemic awareness: an aurally presentedtask focused on either initial consonants or rhymes and a spelling task assessing phonemesegmentation and blending. As described next, we compared two versions of tasks involvinginitial consonants and two involving rhymes. Based on our research, we selected the task inwhich children identify the picture that begins with the same beginning sound as the target word.
Development of the Task
Our goal was to develop a task that could be easily and quickly administered by teachers whowished to assess the phonemic awareness of their students. From our review of the availabletests, we decided to explore four different formats. Two of these involved the child’s hearingbeginning consonants and two, hearing rhymes (word endings).
We developed the first of these tasks as a multiple choice in which a child listened to a word readaloud and then selected one of three pictures that “starts with the same sound.” Pictures for eachitem in this snapshot were carefully chosen to represent distinctive beginning sounds. Ninedifferent initial consonant sounds (/s/, /m/, /j/, /f/, /l/, /r/, /k/, /b/, /p/) and one digraph (/sh/)constituted the targeted onsets. Most kindergarten and first grade students who are consciouslyaware of the beginning sound in words should have minimal difficulty identifying the targetedpictures. The set of stimulus words included: side, mail, shine, junk, feet, lamp, road, cake, back,pick. We refer to this task as Initial Consonant - Selection. The second initial consonant taskasked children to produce the first sound. They were asked to “make the first sound in _____.”The words filling the blank were the same as those on the multiple-choice version of the onsettask. We refer to this task as Initial Consonant – Production.

22
The two rhyme tasks included a similar contrast. In the first rhyme task, children select one fromthree pictures with which a spoken word rhymes. The set of stimulus words included: pail, note,try, see, mouse, toy, cat, socks, run, dig. Again the pictures were selected to be easilyidentifiable. We refer to this task as Rhyme- Selection. The second rhyme task included thesame set of stimulus words. For this task the child was asked “What rhymes with _____.” Werefer to this task as Rhyme - Production. All four tasks included two practice items prior to thetest items to make sure that the directions were understood.
We pursued three research questions: (1) Which task format do children prefer? (2) How dothese tasks compare in terms of difficulty and reliability? (3) Which is most effective inpredicting progress in learning to read by the end of the school year? To explore these questions,all children were given each of the four snapshots. The four snapshot variations were counter-balanced in order of presentation to control for practice effect. Concerning the first question,informal interviews revealed that children were almost unanimous in preferring the two tasksthat included pictures. Selecting from three alternatives seemed to be easier for most of theyoung children than generating a response.
Selecting the Task for Assessment of Phonemic AwarenessConcerning task difficulty and reliability, Table 10 presents means and standard deviations fromthe field test year for each of the four tasks, as well as reliability coefficients. As can be seen,the two initial consonant tasks are similar in difficulty, with the response generation versionslightly easier as indicated by more correct responses on average. In contrast, generating rhymeresponses appears to be more difficult than selecting rhymes from among three picturedresponses. The reliability coefficients for the tasks in which children produce responses arehigher than those involving selection. This difference is probably due to the multiple-choiceformat in which some students may get a third of the items correct by guessing.
Table 10. Means, standard deviations, and reliability coefficients (split half) on fourPhonemic Awareness snapshots for kindergarten and first grade children combined in thefall of 2000
PHONEMIC AWARENESS TASKSN = 426
Mean RawScores
StandardDeviations
Split HalfReliability
Coefficients
Initial Consonant - SelectionInitial Consonant - ProductionRhyme - Picture SelectionRhyme - Production
7.157.537.806.24
2.833.612.644.15
.7557
.9345
.7539
.9334
Our third consideration pertains to the predictive effectiveness of the four tasks. Table 11 showsthe correlation coefficients representing the relations between the four phonemic awareness tasksadministered in the fall and four reading measures administered in the spring: Letter-Soundknowledge, Developmental Spelling, Word Recognition, and Passage Reading. Concerning

23
predictive validity, Kame’enui (2002) quotes a member the assessment committee of the IDEAInstitute as arguing:“The most fundamental criterion for a good screening instrument is to have good predictivevalidity. Of course, the instrument must have reasonable reliability in order to achieve goodpredictive validity.” (Kame’enui, p. 70).
Table 11. Correlation coefficients between four Phonemic Awareness Snapshotsadministered in the fall of kindergarten and first grade with four reading measuresassessed (spring 2000)
PHONEMIC AWARENESSTASKS N = 426
LetterSounds
DevelopmentalSpelling
WordRecognition
PassageReading
Initial Consonant - SelectionInitial Consonant - ProductionRhyme – SelectionRhyme – Production
.5755
.5684
.5017
.4617
.6983
.6103
.5880
.6006
.7618
.6108
.5356
.5475
.7568
.5890
.5617
.5623
As can be seen neither of the rhyming tasks is as effective in predicting later achievement as arethe tasks involving the initial sounds of words. Somewhat surprisingly, in spite of lowerreliability, the Initial Consonant - Selection task proved to be the most effective predictor thelater reading tasks of word recognition and passage reading. Based on this analysis, themultiple-choice initial consonant task was selected as the measure of phonemic awareness to beused in the ISEL-K/1 in conjunction with the spelling measure.
Difficulty of Task
The discussion from this point forth focuses on the snapshot that we selected because of itspredictive validity -- the Initial Consonant – Selection task which we will now refer to as thePhonemic Awareness snapshot. It was administered to children in the fall and spring ofkindergarten and first grade. Table 12 shows the results from this administration in terms ofmean raw scores, standard deviations, and percent correct. As can be seen, most growth occurson this snapshot during the kindergarten year. By the end of kindergarten, children havemastered an average of 81-88 percent of the beginning consonant Phonemic Awareness items.Although progress occurs, the gains are relatively modest during the first grade year.

24
Table 12. Means, standard deviations, and Percent correct on the Phonemic AwarenessSnapshot for children in the fall and spring of kindergarten and first grade
Phonemic Awareness(Total=10)
Mean RawScore
StandardDeviation
PercentCorrect
Fall Spring Fall Spring Fall Spring
Kindergarten2000-01 (n= 217)2001-02 (n=527)
First Grade2000-01 (n= 207)2001-02 (n=524)
5.555.76
8.848.71
8.158.63
9.629.56
2.722.69
1.771.95
2.411.95
1.011.10
5558
8887
8186
9696
Predictive Validity
Overall validity is reported in the later section on Validity. The Phonemic Awareness Snapshotis a performance measure tapping whether children can focus on the initial sound of a word andidentify another word that begins with the same phoneme. If a teacher wishes to know whether achild can consciously focus on initial phonemes, this snapshot provides that information. It is,however, a multiple-choice task which does allow credit for guessing. That is, a child who couldnot focus on initial sounds might still get a score of three on this task by chance.
Does good performance on this snapshot predict later successful reading development? Toperform well on this task, a child must not only be able to hear the initial sound, but also to holdthis sound in mind to find a match. Theoretically, it is argued that knowing how to do this willmake it easier for the child to spell, learn to pair sounds with letters, and identify words. Table 13shows the extent to which good performance on Phonemic Awareness at the beginning of theyear is associated with good performance on other early literacy measures for kindergarten andfirst grade children at the end of the school year.

25
Table 13. Predictive Validity - Correlation coefficients showing the relation betweenPhonemic Awareness measured in the fall to other areas of early literacy measured in thespring for kindergarten and first grade
Fall PhonemicAwareness
SpringPhonemeAware.
Spring1-to-1Match
SpringLetterSounds
SpringDevelopSpelling
SpringWordRecog.
SpringPassageRead’g
Kindergarten2000-01 (n=217)2001-02 (n=527)
First Grade2000-01 (n=207)2001-02 (n=522)
.47
.42
.42
.41
.50
.35
.10
.12
.40
.35
.38
.19
.52
.45
.53
.39
.61
.46
.60
.49
.61
.51
.58
.50
For both samples, the coefficients are most substantial for the complex literacy measures ofspelling, word recognition, and passage reading. Phonemic Awareness in the fall is alsosignificantly but more modestly related to Phonemic Awareness measured in the spring. Thehigher coefficients for One-to-One Matching for kindergarten children as compared to firstgraders are surprising. It may be that the careful listening required for phoneme identification isalso tapped on the other two measures. There may also be some commonality inherent in thematching processes. In any case, these results show that a Phonemic Awareness measureentailing beginning consonant selection is a good predictor of later reading and writing.
Regional Reliability
Overall reliability is reported in the later section on Reliability. Table 14 shows the reliabilitycoefficients for kindergarten (Table 14a) and for first grade (Table 14b) by region.
Table 14a. Fall and spring reliability coefficients (Cronbach alpha) for kindergartensamples on Phonemic Awareness
FALL SPRINGn Cronbach alpha n Cronbach alpha
Region 1 (2000-2001) 217 .7579 217 .7825Region 1 (2001-2002) 279 .7255 248 .7776Region 2 (2001-2002) 34 .8023 35 nr*Region 3 (2001-2002) 67 .7197 67 .6897Region 4 (2001-2002) 46 .6889 44 .8214Region 5 (2001-2002) 103 .7145 91 .7458Region 6 (2001-2002) 49 .7904 45 .6297 Average Coefficient 0.7427 0.7411• Not reliable – insufficient data

26
Most coefficients are in the acceptable range. Spring coefficients decrease for the first gradeover what was obtained in the fall. We suspect that the latter reflects a ceiling effect sincealmost all of the items on the snapshot were correctly identified by most first graders at the endof the year (96%, see Table 23).
Table 14b. Fall and spring reliability coefficients (Cronbach alpha) for first grade sampleson Phonemic Awareness
FALL SPRINGn Cronbach alpha n Cronbach alpha
Region 1 (2000-2001) 207 .7441 207 .6780Region 1 (2001-2002) 283 .8087 200 .5779Region 2 (2001-2002) 78 .7454 71 .8380Region 3 (2001-2002) 60 .7110 58 .8856Region 4 (2001-2002) 69 .7887 64 .5056Region 5 (2001-2002) 60 .7276 50 .5445Region 6 (2001-2002) 48 .7908 46 .3354 Average Coefficient 0.7595 0.6385

27
ISEL SNAPSHOT 4: ONE-TO-ONE MATCHING
Background and Purpose
One-to-one matching or “concept of word” refers to a child’s ability to map spoken words toprinted words on a page. The child should also be able to identify specified target words in text(Morris, 1998). A concept of word often is considered a prerequisite for developing an initialsight vocabulary and facilitates attention to letter-sound relationships (Ehri, 1980, 1998; Morris,1998). The concept of word develops over time and takes into account that (1) a stream ofspeech is broken up into words, (2) a word is a unit of print bounded by space(s) and (3) spokenwords map to written words in text. As a child develops a stable concept of word, he or she willbe able to break words into parts, to note letters in words and to acquire an awareness of letter-sound relationships.
Several useful approaches exist to tap whether children are aware of the one-to-one matchbetween spoken and printed words. Because of its demonstrated usefulness by teachers, wedecided to use the version of the task first created by Darrell Morris (1998). We modified hisstory only by changing the name of the character.
The One-to-One Matching Snapshot provides an opportunity for teachers to observe a childattempting to read a short story. In the “Kim” story, the child is expected to read and point toeach word in a sentence after listening to the teacher/tester read and demonstrate the pointingprocess. Then after reading each sentence while pointing, the student is expected to name twospecific words in the sentence, totaling six words in the entire passage. Teachers gain insightsabout the child’s understanding of this process by noting the following behaviors:
• begins pointing at the left of a line of print• maps spoken word to printed word• repeats the sentence accurately• identifies isolated words in a sentence by pointing to words in a line of known text
prior to reaching a specific word or by letter-sound cues or sight recognition
Children entering kindergarten may display varying degrees of awareness that a word is a unit ofletters bounded by space. A few children will have no idea about where to begin to point to thewords of the “Kim” story. Others will proceed to point to the first few words accurately, but error ignore word boundaries as they progress across the sentences. Still others will be able to pointaccurately to each word in the sentence and will have a strategy for correctly identifying specificwords in sentences. By the end of the year, most children in kindergarten and all in first gradeshould reach the ceiling level of the assessment, provided they have opportunities to practicefinger-point reading throughout the school year and participate in writing activities.
Difficulty of Task
The One-to-One Matching snapshot was administered to children in the fall and spring ofkindergarten and first grade. Table 15 shows the results from this administration in terms of

28
mean raw scores, standard deviations, and percent correct. Most growth occurs on this snapshotduring the kindergarten year. By the end of kindergarten, children had an average performance of82 –87 percent correct in tracking words and word identification. Although some gains are seenduring the first grade, they are minor in comparison with those during kindergarten. In addition,as would be expected, the variation among children diminished during the first grade as well.
Table 15. Means, standard deviations, and percent correct on the One-to-One MatchingSnapshot for children in the fall and spring of kindergarten and first grade
One-to-One Matching(Total=9)
Mean RawScore
StandardDeviation
PercentCorrect
Fall Spring Fall Spring Fall Spring
Kindergarten2000-01 (n= 217)2001-02 (n=527)
First Grade2000-01 (n= 207)2001-02 (n=523)
3.904.09
7.907.99
7.357.79
8.848.90
2.772.87
1.661.72
2.241.88
.53
.44
4346
8889
8287
9899
Predictive Validity
The One-to-One Matching snapshot is a performance measure tapping whether children can“finger point read” – whether they can point to each word in print as they say it aloud. This taskis useful to teachers in revealing the strategies that children use in identifying words that occur insentences. It is possible to see when they softly repeat the sentence as an aid to wordidentification, or if they use letter-sound cues, or if they recognized words as ones they learnedpreviously. On this basis, we defend the face and content validity of the word matching task. If ateacher wishes to know whether a child is “tracking” print while reading, this snapshot providesthis information. It provides a window into how children process text and identify words. Oncechildren can do this sort of tracking, they are better able to learn words.
However, does good performance on this snapshot predict later successful reading development?To perform well on this task, the child must not only be able to match spoken and printed words,but to use this and other knowledge to name the words to which the teacher points. Theoretically,we argue that this knowledge is an important precursor to learning sight words and readingcontextual material. Table 16 shows the extent to which good performance on One-to-OneMatching at the beginning of the year is associated with the good performance of kindergartenand first grade children on other early literacy measures at the end of the school year. As mightbe expected for kindergarten children, one-to-one matching shows a strong relation withknowledge of word recognition and passage reading. It is also substantially correlated withchildren’s knowledge of letter-sounds and spelling. The low coefficients for the first grade

29
sample seems to be related to the narrow variation in one-to-one matching in the fall of firstgrade since almost all first graders were able to track print at that time.
Table 16. Correlation coefficients showing the relation between One-to-One Matchingmeasured in the fall to other areas of early literacy measured in the spring forkindergarten and first grade
Fall1-to-1 Match
Spring1-to-1Match
SpringLetterSounds
SpringDevelopSpelling
SpringWordRecog.
SpringPassageReading
Kindergarten2000-01 (n=217)2001-02 (n=527)
First Grade2000-01 (n=207)2001-02 (n=522)
.54
.40
.17
.13
.47
.42
.24
.18
.48
.47
.36
.34
.64
.59
.37
.52
.62
.56
.34
.49
Regional Reliability
Does the snapshot provide a stable and consistent measure of children’s ability to track printedwords? To address this question, we examined the evidence from the field test schools and thesix regions. As can be seen in Table 28, the reliability coefficients are sufficiently high to meritconfidence in the kindergarten year. In contrast, the reliability of the task in the fall of first gradeis also acceptable, but that for the spring administration is unacceptable. The low coefficientreflects the narrow variation among students and a ceiling effect on the task (see Table 26).
Table 17. Fall and spring reliability coefficients (Cronbach alpha) for kindergarten andfirst grade samples on One-to-One Matching
FALL SPRING
Kindergarten n Cronbach alpha n Cronbach alphaRegion 1 (2000-2001) 217 .8197 217 .8130Region 1 (2001-2002) 279 .8016 248 .7823Region 2 (2001-2002) 34 .8983 35 .7577Region 3 (2001-2002) 67 .7715 67 .5740Region 4 (2001-2002) 46 .8436 44 .8845Region 5 (2001-2002) 104 .8483 92 .7349Region 6 (2001-2002) 49 .8471 45 .8703 Average Coefficient 0.8329 0.7738

30
First GradeRegion 1 (2000-2001) 207 .7435 .207 .4065Region 1 (2001-2002) 283 .7662 200 .5943Region 2 (2001-2002) 78 .7672 71 .5515Region 3 (2001-2002) 60 .7431 58 nv*Region 4 (2001-2002) 69 .6092 64 .3388Region 5 (2001-2002) 59 .5650 51 -.0685Region 6 (2001-2002) 48 .9063 46 nv* Average Coefficient 0.7286 .3645* No variation

31
ISEL-K/1 SNAPSHOT 5: LETTER SOUND ASSOCIATIONS
Background and Purpose
Letter sound knowledge undergirds the alphabetic system in English reading and writing.Children who can recognize the letters of the alphabet and are able to produce their sounds aredeveloping knowledge of letter-sound relationships. Research indicates that students in controlof letter-sound relationships can use this knowledge to assist them in (1) mapping letters or lettergroups to sounds, (2) identifying individual sounds in words, (3) recognizing familiar andunfamiliar words while reading and (4) writing known and unknown words (Adams, 1990). InSnapshot 5, children are expected to provide letter sounds for 18 consonants, 5 short vowels, and3 digraphs.
Selection of Letters
Most teachers we interviewed wanted all frequently occurring consonant letter-sounds tested(“q” and “x” are not assessed). Since the sound of the long vowel corresponds with its name, itwas not necessary to test children on this information again. For children, particularly those infirst grade, it is important that they learn the short sounds of vowels, as well as a subset ofconsonant digraphs (two letters that represent a single phoneme such as “sh” and “ch”). Becauseof this selection process that includes all frequently occurring consonants and vowels, the faceand content validity of this task is self-evident. The Letter-Sound Snapshot is a performancemeasure assessing the entire item domain.
Ordering of Letters
In Snapshot 5, the student is expected to produce the sounds corresponding to the mostfrequently occurring consonants. Also the letter-sound for “m” which was used in the directionswas not assessed. The short sounds of the five vowels, a, e, i, o, u, are included on the snapshot.Finally, to assess whether some learning of consonant digraphs was occurring, three of theseitems (sh, th, ch) were included. The order of the letter-sounds was determined through fieldtests in the fall of 2000, with more than 450 kindergarten and first grade children.
Table 18 shows the proportion of kindergarten and first grade children correctly identifying eachof the letter-sound associations. We have used the results for the kindergarten children as thebasis for ordering the letter-sound association on Snapshot 5.

32
Table 18. Proportion of kindergarten and first grade children at the beginning of theschool year who correctly identify the letter-sound associations
Letter-Sounds
KindergartenPercent CorrectN= 232
First GradePercent CorrectN=220
Letter-Sounds
KindergartenPercent CorrectN= 232
First GradePercent CorrectN=220
BSPTKZDFCVJGL
66585150454544424141383229
98989797959594948989898288
NRHWYaoeiushthch
29282721121512887433
86878577535446344129323026
A comparison between the kindergarten results and those for first grade show that there is littledifference in order for the first half of the list. We arbitrarily ordered “Y” with the consonantsalthough it is less well known than some of the vowels. The order is also similar for vowels anddigraphs, although first graders, on average, found the vowel “i” and some of the digraphs easierthan did the kindergarteners.
Suggestions for Task Administration
In the administration of Snapshot 5, Letter Sounds, if a child is unable to identify the first row ofletter-sounds, the teacher may wish to have the child scan the remaining letters to see if anysounds are known. This suggestion is based on a cross-tab analysis of the kindergarten and firstgrade samples (n=453) in which we found that if a child was unable to produce the sound for thefirst six items, it was extremely unlikely that other sounds were known. Thus, if a child knowsnone of the first row of letter-sounds, it is appropriate to ask the child to scan the remainingletters to see if he or she knows any of the sounds. Yet, we would encourage teachers who, onthe basis of their experience think that a child can do better, to continue the assessment letter byletter to ascertain the child’s knowledge.
Difficulty of Task
The Letter Sound snapshot was administered to children in the fall and spring of kindergartenand first grade. Table 19 shows the results from this administration in terms of mean raw scores,standard deviations, and percent correct.

33
Table 19. Means, standard deviations, and percent correct on the Letter Sound snapshotfor children in the fall and spring of kindergarten and first grade
Letter-Sound Association(Total=26)
Mean RawScore
StandardDeviation
PercentCorrect
Fall Spring Fall Spring Fall Spring
Kindergarten2000-01 (n= 217)2001-02 (n=527)
First Grade2000-01 (n= 207)2001-02 (n=523)
7.618.53
19.5419.62
17.9020.65
23.3124.28
7.187.38
5.125.13
5.525.20
3.342.28
2933
7575
6979
9093
As can be seen, growth occurs on this snapshot both during the kindergarten and the first grade.But the items that are learned differ. Kindergarten children make progress not only in learningconsonants (a 46% gain), but also in learning vowels and digraphs (37% gain). In contrast, sincemost children have mastered consonant letter-sound associations when they enter first grade,there are relatively little gains to be made (8% gain) but they show major growth in learningvowel and digraph sounds (47% gain).
Predictive Validity
Overall validity is reported on the later section on Validity. The face and content validity of theLetter Sound task is self-evident. That is, if a teacher wishes to know whether a child canidentify sounds corresponding to letters of the alphabet, this snapshot provides the information.Since almost all consonant and vowel letters are tested, limited sampling is involved. Samplingis involved in the case of digraphs. The snapshot is a performance measure of letter-soundlearning.
But does good performance on this snapshot predict successful reading development? Torecognize letter-sounds, the child must not only be able to identify the visual form of a letter andits name, but also the sound that goes with it. Typically this learning facilitates spellingperformance, as well as word recognition and passage reading. Table 20 shows the extent towhich good performance on letter sounds at the beginning of the year is associated with goodperformance on other early literacy measures for kindergarten and first grade children at the endof the year.

34
Table 20. Predictive Validity- Correlation coefficients showing the relation between LetterSounds measured in the fall to other areas of early literacy measured in the spring forkindergarten and first grade
Fall LetterSounds
SpringLetterSounds
SpringDevelopmental
Spelling
SpringWord
Recognition
SpringPassageReading
Kindergarten2000-01 (n=217)2001-02 (n=527)
First Grade2000-01 (n=207)2001-02 (n=522)
.47
.52
.60
.21
.52
.55
.59
.36
.61
.58
.56
.42
.58
.58
.60
.44
As expected for both kindergarten and first grade children, Letter Sound knowledge shows astrong relation with Developmental Spelling, Word Recognition, and Passage Reading. It is alsosubstantially correlated with children’s knowledge of letter-sounds and spelling. The lowercoefficients for the first grade regional samples (2001-2002) are unexpected and difficult toexplain. Predictive coefficients are somewhat higher when regions are analyzed separately.
First Grade predictive and concurrent validity with other tests were also assessed. Table 21shows these coefficients with the Gates MacGinitie Reading Test (G-M) (MacGinitie &MacGinitie, 1989). The results show that knowledge of letter-sound association as measured bythe ISEL-K/1 is a reliable predictor of Word Decoding as measured by the Gates MacGinitieReading Test at the end of first grade. The concurrent coefficient is relatively low, probablybecause of the narrow variation on the ISEL-K/1 snapshot at the end of first grade (see Table30).

35
Table 21. First grade predictive and concurrent validity coefficients between ISEL-K/1Letter Sounds and the Gates MacGinitie Reading Test (G-M)
ISELFirst Grade
G-MWord Decoding
N = 17Predictive ValidityFall Letter Sounds
Concurrent ValiditySpring Letter Sounds
0.76
0.27
Regional Reliability
Overall reliability is reported in the later section on Reliability. Does the snapshot provide astable and consistent measure of letter-sound knowledge? To address this question, weexamined the evidence from the field test schools and the six regions. As can be seen in Table22, the reliability coefficients are high, particularly in the fall of kindergarten. In the spring,coefficients are only slightly lower for kindergarten. The same trend holds for first gradealthough coefficients are slightly lower. We suspect that this is because of the decreasedvariation in Letter Sound knowledge as most first graders master phonics.
Table 22. Fall and spring reliability coefficients (Cronbach alpha) for kindergartensamples on Letter Sounds
FALL SPRINGKindergarten n Cronbach alpha n Cronbach alphaRegion 1 (2000-2001) 217 .9493 217 .9143Region 1 (2001-2002) 279 .9508 248 .9148Region 2 (2001-2002) 34 .9378 35 .7611Region 3 (2001-2002) 67 .9444 67 .8466Region 4 (2001-2002) 46 .9192 44 .9036Region 5 (2001-2002) 104 .9191 91 .8375Region 6 (2001-2002) 49 .9350 45 .8925 Average Coefficient 0.9365 0.8672First GradeRegion 1 (2000-2001) 207 .8708 207 .8515Region 1 (2001-2002) 283 .9011 200 .7741Region 2 (2001-2002) 78 .8969 71 .6847Region 3 (2001-2002) 60 .8442 58 .8589Region 4 (2001-2002) 69 .9039 64 .7958Region 5 (2001-2002) 58 .8659 50 nr*Region 6 (2001-2002) 48 .8836 46 .5909 Average Coefficient 0.8809 0.7593* Not reliable – insufficient data

36
ISEL-K/1 SNAPSHOT 6: DEVELOPMENTAL SPELLING
Background and Purpose
Developmental spelling is a useful measure because it reflects a child’s ability to integrate andapply knowledge in three areas: (1) phonemic awareness, (2) knowledge of letter-soundrelations, and (3) knowledge of printed letters and their formation. Regarding phonemeawareness, spelling taps both sound segmentation and blending. Each of these areas plays acentral role in reading and writing development. Teachers often use spelling to gain insight intochildren’s thinking about words, noting whether or not a child can hear the sound components ofa word as well as represent them. Developmental spelling is a strong predictor of subsequentreading development (Henderson, 1985; Morris & Perney, 1984). Thus, it provides an importantsource of information for selecting children who may need the support of early intervention.
Test Development
A developmental spelling approach entails identifying and listing how each phoneme in a wordmay be spelled (Henderson, 1985). Acceptable spellings reward children for being able to hearphonemes and to select an appropriate spelling. For example, the phoneme “b” in the word“back” could be spelled as “b” or “p” and either response would receive one point credit.Similarly, the final “ck” could be spelled as “ck,” “c,” “k,” or “g”. Research has shown thatliterate persons have learned which of these letters is the correct one, but this is a matter ofconvention and cannot be known by the child who has not yet learned the rules of spelling. Inother words, this manner of scoring spellings rewards children for hearing the phoneme andrepresenting it in a plausible fashion. Similarly, the scoring procedure accepts a number ofdifferent ways for representing vowels. For example the “ai” in “mail” might be written as “ai,”“a,” or “ay” and the child would receive credit. In addition, a “bonus” point is given for eachword spelled in a conventional and standard way.
In keeping with our approach of not “reinventing wheels,” our first step in developing a spellingmeasure was to examine existing measures designed for kindergarten and first grade children.We were attracted to the task developed by Darrell Morris (1998) since it included items thatincreased in difficulty and represented different articulatory features. We modified the Morrisspelling test in two ways: we refined the scoring and shortened the test. The original set oftwelve words from the Morris test included: feet, mail, back, step, junk, peeked, side, lamp, road,dress, chin, picking. After a series of informal field tests to refine the directions foradministration and the test format, we administered the snapshot to 228 kindergarteners and 221first graders. Because of the length of time taken by the spelling task, we sought to develop ashortened version of the snapshot that would be reliable and provide us with information similarto that of the twelve items. We explored the characteristics of the snapshot in terms of thepercentage of phonemes that were correct for each word and the total number of correctphonemes. The percentage of correct phonemes was calculated by dividing the total number ofphonemes correctly represented by the total number of phonemes in the word. The total numberof correct phonemes is simply the total number of phonemes correctly represented for each word.

37
Although some of the longer words appear to be more difficult, once phonemes per word aretaken into consideration, they appear to be less so. For example, “chin” seems to be the mostdifficult spelling word when the total number of correct phonemes is considered. However, thepercent correct for “chin” is similar to many of the words composed on four phonemes.
Table 23 shows the percent of correct phonemes represented for each spelling word and the totalnumber of correct phonemes represented. It also includes the correlation coefficients estimatingthe relation between total word scores and the total spelling score. Our goal was to shorten thesnapshot to six words. In order to derive comparable forms, we compared words in terms ofphoneme and word difficulty and in terms of articulatory features represented. We were alsomindful of the need to create a sample that would have sufficient ceiling to validly represent thelearning of children at the end of the year. The six underlined words in Table 23 are those weselected for the final version of the spelling task in Version 1 and in Version 2 Form A. Asdiscussed subsequently under “Reliability,” the shortening of the snapshot did result in a slightdrop in the reliability coefficients.
Table 23. The percent of correct phonemes represented for each spelling word bykindergarten and first grade students in the fall of 2000 (n=449), the total number ofcorrect phonemes represented, and correlations between total word scores and the totalspelling score
Spelling Word Percent of CorrectPhonemes
Total Number ofCorrect Phonemes
Correlation withTotal Spelling Score
feetbacksidemailroadsteppickingpeekedlampchindressjunk
.58
.56
.54
.53
.51
.45
.44
.44,43.43.43.36
1.741.691.611.601.521.791.771.771.751.281.711.43
0.930.930.940.920.920.920.940.940.940.870.930.89
Scoring
Another issue we pursued pertained to scoring procedures. We refined the Morris scoring formatby adapting the approach developed by Marcia Invernizzi and her colleagues at the University ofVirginia (Invernizzi, Robey, & Moon, 2000); this format provides acceptable alternativephonemes within the scoring grid. We then addressed the question of whether we should scorethe spelling results using the “simple” scoring method on the PALS Early Screening Inventoryspelling task (Invernizzi et al, 2000) or an approach that rewards children who segmentphonemes of words in sequence left to right and matched letters to them. We refer to the latter asthe “sequential” scoring method. The simple method can be defended because it is simple and

38
easy to use and taps whether children hear phonemes in a word, although not necessarily in aleft-to-right order. In contrast, the sequential method is more complex to score but has thepotential to capture the growing awareness of directionality in reading.
This is an issue that can be addressed empirically. To this end, we analyzed a set of 85 tests (43kindergarten and 42 first grade) using both the simple and the sequential methods. Then weexamined how the scores behaved in relation to other reading measures such as PhonemicAwareness, Word Recognition, and Passage Reading. Table 24 shows the results. Generally, inonly one comparison does the simple method seem to be better, and this is in the kindergartencorrelation with Phonemic Awareness. It may be that the simple method more sensitivelyrepresents what kindergarten children know in the beginning stages of phonemic awareness.The other comparisons at the kindergarten level with Word Recognition and Passage Readingfavor the sequential scoring method. All correlations at the first grade level favor the sequentialmethod. Because of this analysis, we adopted the sequential method of scoring the spellingwords.
Table 24. Correlation coefficients between Developmental Spelling and PhonemicAwareness, Word Recognition, and Passage Reading for kindergarten and first grade usingsimple and sequential scoring methods
Grade Level ScoringMethod
PhonemicAwareness
WordRecognition
PassageReading
Kindergarten(n=43)
First Grade(n=42)
SimpleSequential
SimpleSequential
0.71490.7050
0.57810.6683
0.54490.5675
0.70710.7214
0.58340.6085
0.62110.6639
The final version of the Developmental Spelling snapshot includes six items – back, mail, step,junk, peeked, chin – that are scored sequentially. In sum, the ISEL-K/1 scoring system values thesequence that children hear and their ability to represent the sounds. If the initial consonant isnot represented, credit will not be given for other letters written. In addition, to make thesnapshot more sensitive in distinguishing children who had learned standard forms of spellingfrom those who were still spelling inventively, we award a “bonus” point for each word spelledconventionally.
Difficulty of the Task
The Developmental Spelling Snapshot was administered to children in the fall and spring ofkindergarten and first grade. Table 25 shows the results from this administration in terms ofmean raw scores, standard deviations, and percent correct. For the fall administration, only theitems used in the final version are included. As can be seen, growth occurs on this snapshot bothduring kindergarten and first grade.

39
Table 25. Means, standard deviations, and percent correct on the Developmental SpellingSnapshot for children in the fall and spring of kindergarten and first grade
Developmental Spelling(Total=27)
Mean RawScore
StandardDeviation
PercentCorrect
Fall Spring Fall Spring Fall Spring
Kindergarten2000-01 (n= 217)2001-02 (n=527)
First Grade2000-01 (n= 207)2001-02 (n=523)
4.005.00
15.1215.02
13.0315.17
21.7921.99
5.085.48
4.475.29
5.875.60
4.493.67
1519
5656
4856
8181
A score of 4 at the beginning of kindergarten shows that many children are able to representsome beginning consonants, but the variation within the sample shows that some children areable to represent none and others can represent most consonants and some vowels. By the end ofkindergarten, children on average are able to represent initial and ending consonants; some arerepresenting vowel sounds. The same holds for children at the beginning of first grade. By theend of first grade, children on average have mastered 81 percent of the phonemes – most knowconsonants, many represent vowels, and some are spelling conventionally.
Predictive Validity
Overall validity is reported in the later section on Validity. The Developmental SpellingSnapshot is a performance measure tapping whether children can segment words into phonemes,match the phoneme with an acceptable letter, and produce the letter. Because these operationsare essential to spelling, we argue for the face and content validity of the spelling task. That is, ifa teacher wishes to know whether a child can spell developmentally, this snapshot provides thisinformation. Yet since sampling is involved, it would be possible for a teacher to mar the contentvalidity by teaching to the test.
But much of the knowledge used for spelling, such as phonemic awareness and letter-soundknowledge, are also theoretically and practically implicated in learning to read. Thus, we ask thequestion: Does good performance on this snapshot predict later successful reading development?Theoretically, we posit a reciprocal relationship between reading and writing. The knowledgeunderlying one aspect of literacy is tapped in the reciprocal process.
Table 26 shows the extent to which good performance in Developmental Spelling at thebeginning of the year is associated with good performance on other early literacy measures forkindergarten and first grade children at the end of the school year. For both samples, thecoefficients are substantial for the more complex literacy measures: spelling, word recognition,and passage reading. In any case, these results show that this Developmental Spelling measure isa good predictor of later reading and writing.

40
Table 26. Predictive Validity- Correlation coefficients showing the relation betweenDevelopmental Spelling measured in the fall and other areas of literacy measured in thespring for kindergarten and first grade
Fall DevelopmentalSpelling
SpringDevelopmental
Spelling
SpringWord
Recognition
SpringPassageReading
Kindergarten2000-01 (n=217)2001-02 (n=527)
First Grade2000-01 (n=207)2001-02 (n=522)
.55
.52
.65
.52
.60
.54
.60
.50
.61
.61
.64
.52
Regional Reliability
Overall reliability is reported in the later section on Reliability. Does the snapshot provide astable and consistent measure of Developmental Spelling? To address this question, weexamined the evidence from the field test schools and the six regions shown in Table 27.
Table 27. Fall and spring reliability coefficients (Cronbach alpha) for kindergartensamples on Developmental Spelling (6 item snapshot)-Version 1
FALL SPRINGKindergarten n Cronbach alpha n Cronbach alphaRegion 1 (2000-2001) 217 .9540 217 .9354Region 1 (2001-2002) 278 .9421 248 .9154Region 2 (2001-2002) 34 .9106 35 .8451Region 3 (2001-2002) 67 .9488 67 .8683Region 4 (2001-2002) 46 .8988 44 .8316Region 5 (2001-2002) 104 .9172 91 .8696Region 6 (2001-2002) 49 .9305 45 .9081 Average Coefficient 0.9289 0.8819
First GradeRegion 1 (2000-2001) 207 .8687 207 .9618Region 1 (2001-2002) 283 .8806 200 .6037Region 2 (2001-2002) 78 .8824 71 .6674Region 3 (2001-2002) 60 .8982 58 .8038Region 4 (2001-2002) 69 .8794 64 .6731Region 5 (2001-2002) 59 .7993 51 .7972Region 6 (2001-2002) 48 .8744 46 .6421 Average Coefficient 0.8690 0.7356

41
As can be seen in Table 27, the reliability coefficients are high. These results show that thecoefficients for the six-item snapshot are sufficiently high so that teachers can have confidence inthe stability of the results. In a separate analysis to explore the effect of shortening the snapshotfrom 12 to 6 items in the fall of the field test year (2000), we found a slight drop in the odd-evenreliability coefficients for kindergarteners (from .9540 to .9354) and a more sizable drop for firstgraders (from .9354 to an average of .8687), but the reliability of the snapshot remains in anacceptable range.

42
ISEL-K/1 SNAPSHOT 7: WORD RECOGNITION
Background and Purpose
Teachers and diagnosticians commonly use word recognition in isolation as one measure of totalreading performance because it is highly correlated with general reading proficiency (Johns,1999; Clay, 1993; Juel & Minden-Cupp, 1999). Quick and automatic word recognition ability isassociated with reading fluency. When young readers develop a repertoire of words they canidentify quickly and effortlessly, this set of words helps to “anchor” their reading and topromote self-monitoring. As the number of sight words increases, less attention needs to bedevoted to word recognition problem solving. Fluency is enhanced and reading is supported by agrowing number of known words. A parallel process occurs in writing.
In Snapshot 7, the child is expected to read a list of 22 words that increase in difficulty. Becausethe list spans early emergent to second grade, it is not a list of the 22 most frequent words but asampling of frequent words at each level, kindergarten through grade 2. The list not onlycontains words that are frequent in text but also words that are commonly recognized by youngreaders. The word “can” is a typical example. In contrast, the word “the” occurs frequently intext, but it is not included in the ISEL-K/1 list because it is a difficult word for some youngreaders to learn and identify.
Design of TaskSelecting a Corpus of Words for the Field Test
A data base corpus of 350 words was constructed by entering in words from the pre-primer,primer, first, and second grade lists of the following word lists:
Basic Reading Inventory Word Lists (which embeds the revisedDolch list) (Johns, 1999)
Reading Recovery Word Lists (Clay, 1993)Howard Street Tutoring List and ERSI List (Morris, 1999)Basic Reading Vocabularies (Harris & Jacobson, 1982)PALS Early Reading Screening List (Invernizzi et al, 2000)McCrel Frequent Word List (Bodrova, Leong and Semenov, 1998)CIERA list of 100 most frequent words. (www.CIERA.org)
A first cut was made by selecting words that appeared on three or more lists. The list was thenfilled in with those words appearing on at least two lists. These were then checked against TheLiving Word Vocabulary (Dale & O'Rourke, 1976) to remove any words that were unfamiliar inthe oral vocabularies of young children.
The resulting list was then organized into emergent words (pre-primer), early first grade words(primer), first grade words, and second grade words (the hard words from the above list thatwere also cross listed with the CIERA and McCrel lists). To eliminate inappropriate words, the

43
lists were then rated by a team of 5 expert teachers with primary grade experience. The teacherswere asked to indicate words that they felt were not appropriate K/1 words and to scale them indifficulty. The 40 words deemed most appropriate were selected for the first cut. This list wasadministered to 20 kindergarteners and 20 first grade students on a trial basis to see if anyunanticipated problems emerged with the words or format.
Field Test Refinement
The resulting list of 40 words was administered to 220 kindergarten students and 221 first gradestudents at schools selected to reflect the demographic makeup of Illinois school children.Student responses were used to identify those words from each subset. Table 28 shows the list of27 words representing levels that seemed to emerge clearly from the first set of 40 words and thepercent of kindergarten and first grade children who recognized each of the words correctly.
Generally, the emergent words were easiest for both kindergarten and first grade children torecognize. As might be expected, the early first grade words were known by a third to two-thirdsof the first graders, but few of the kindergarteners. A quarter of the beginning first gradechildren recognized some of the first grade list, but very few from kindergarten did. Abouttwenty percent of the first graders recognized some of the late first/second grade words, andalmost none of the kindergarteners did.
Our goal was to include in the final list a sufficient number of emergent words -- about eight --so that emergent readers at the beginning of kindergarten could be identified, and so thatbeginning first graders would have a high rate of mastery. All of the emergent words wereincluded on the final set except “dog” which was frequently confused with “big.”
Along with frequency, concreteness and syntactical form have been determined to be powerfulfactors in word recognition (Schwanenfluegel & Akin, 1994). Thus, the concreteness andsyntactical form of the words, as well as recognition frequency, were considered in comprising abalanced list and in ordering the final list. The panel of five educators with primary teachingexperience reexamined the list to check for inappropriate words or placement. The word "big"was problematic in that it was an easier word for kindergarteners who perhaps recognized it as anicon but more difficult for first graders who, focusing more on print, reversed the letters andfrequently said "dog." It was decided to use the first grade level of placement for this word.After careful study of the assessment evidence and the evaluations of teachers, a representativesubset composed of 22 words was selected for inclusion on the final version of the WordRecognition Snapshot. These words are marked with an “*” in Table 28.

44
Table 28. The percentage of words correctly recognized by kindergarten (n=230) and firstgrade children (n=221) in the fall. Correlations of each word with total score ranged from.6026-.8379
Level Words Kindergarten% recognized
First Grade% recognized
Emergent cat 27 89go 21 90dog 23 86is 15 82red 12 72you 13 77me 11 70can 9 71and 9 71
Early First Grade big 10 54look 8 47play 7 45said 5 46this 5 37treehere
54
3031
First Grade men 4 22never 3 24road 4 19live 3 25into 4 26
High First/Second change 2 11Grade there 2 15
because 1 13could 2 13ready 2 29friend 2 18made 2 18
Difficulty of Task
The Word Recognition Snapshot was administered to children in the fall and spring ofkindergarten and first grade during the field test year. Table 29 shows the results from thisadministration in terms of mean raw scores, standard deviations, and percent correct.

45
Table 29. Means, standard deviations, and percent correct on the Word RecognitionSnapshot for children in the fall and spring of kindergarten and first grade
Word Recognition(Total=22)
Mean RawScore
StandardDeviation
PercentCorrect
Fall Spring Fall Spring Fall Spring
Kindergarten2000-01 (n= 217)2001-02 (n=527)
First Grade2000-01 (n= 207)2001-02 (n=523)
1.591.52
10.2610.90
8.069.31
19.7020.00
3.633.49
6.196.20
6.116.09
13.383.05
77
4750
3742
9091
Growth on this snapshot occurs both during the kindergarten and first grade. By the end ofkindergarten, many children, on average, have mastered words that come mainly from theemergent list. By the end of first grade children have mastered an average of 90 percent of thesight words. Many are able to identify some of the most difficult items on the snapshot, but thevariation among children is large.
Predictive Validity
Overall validity is reported in the later section on Validity. The face and content validity of theWord Recognition Snapshot is enhanced by the way the list was put together with eight wordsthat are considered emergent and about 12 words spanning the first grade level in difficulty. If ateacher wishes to know whether a child can identify words and roughly at what level, thissnapshot provides this information. Yet since sampling is involved, it would be possible for ateacher to mar the content validity by teaching to the test.
Does good performance on this snapshot predict successful reading development? To recognizea word, the child must either know the word on the basis of sight, or have the letter-soundknowledge and blending skill to identify the word. Because fluent word recognition is a centralcomponent leading to fluent passage reading (Cunningham & Stanovich, 1998) we wouldanticipate that children who do well on the word recognition snapshot would also do well onpassage comprehension. Table 30 shows the extent to which good performance on the WordRecognition Snapshot at the beginning of the year is associated with performance on WordRecognition and Passage Reading measures for kindergarten and first grade children taken at theend of the year. For both groups of children, the coefficients were statistically significant andsubstantial.

46
Table 30. Predictive Validity- Correlation coefficients showing the relation between WordRecognition measured in the fall to other areas of early literacy measured in the spring forkindergarten and first grade
Fall Word Recognition
SpringISEL-K/1 Word
Recognition
SpringISEL-K/1 Passage
ReadingKindergarten2000-01 (n=217)2001-02 (n=527)
First Grade2000-01 (n=207)2001-02 (n=522)
.60
.54
.57
.46
.67
.59
.65
.56
First grade predictive and concurrent validity with other tests was also assessed. Table 31 showsthese coefficients with the Iowa Test of Basic Skills (ITBS)(Hoover, Dunbar& Frisbie, 2001)and the Gates MacGinitie Reading Test (G-M). As can be seen ISEL Word Recognitionmeasured in the fall of first grade is a strong predictor of Comprehension as measured by theITBS and of Comprehension and Word Decoding as measured by the G-M. The concurrentvalidity coefficients are not as strong but are still is the acceptable range.
Table 31. Predictive and concurrent validity coefficients between ISEL Word Recognitionand the Iowa Test of Basic Skills (ITBS) and the Gates MacGinitie Reading Test (G-M) forfirst grade
ISEL Spring ITBS
N = 26
Spring ITBS
N = 19
G-MWord
DecodingN = 17
G-MComprehension
N = 26
Predictive ValidityFall Word Recognition
Concurrent ValiditySpring Word Recognition
0.73
0.51
0.64
0.51
0.84
0.64
0.84
0.63
Regional Reliability
Overall reliability is reported in the later section on Reliability. Does the snapshot provide astable and consistent measure of word recognition? To address this question, we examinedevidence from the field test schools and the six regions. As can be seen in Table 32, the

47
reliability coefficients are high for both kindergarteners and first graders. Spring coefficients aresomewhat lower for first graders.
Table 32. Fall and spring reliability coefficients (Cronbach alpha) for kindergarten andfirst grade samples on Word Recognition-Version 1
FALL SPRINGKindergarten n Cronbach alpha n Cronbach alphaRegion 1 (2000-2001) 217 .9478 217 .9286Region 1 (2001-2002) 279 .9519 248 .9379Region 2 (2001-2002) 34 .9313 35 .9103Region 3 (2001-2002) 67 .9328 67 .9310Region 4 (2001-2002) 46 .8156 44 .9006Region 5 (2001-2002) 104 .8548 91 .9382Region 6 (2001-2002) 49 .9165 45 .9168 Average Coefficient 0.9072 0.9233
First GradeRegion 1 (2000-2001) 207 .9404 207 .8683Region 1 (2001-2002) 283 .9434 200 .8862Region 2 (2001-2002) 78 .9370 71 .8256Region 3 (2001-2002) 60 .9429 58 .8575Region 4 (2001-2002) 69 .9398 64 .8521Region 5 (2001-2002) 60 .8935 51 .8290Region 6 (2001-2002) 48 .8764 46 .7006 Average Coefficient 0.9248 0.8313

48
ISEL-K/1 SNAPSHOT 8: PASSAGE READING
Background and Purpose:
Passage reading performance represents a complex integrative/interactive process involving thechild’s knowledge of meaning, language structure and letter-sound correspondence tocomprehend text. Moreover, children who exhibit early reading behaviors are developing anawareness of book language in contrast to everyday speech (Clay, 1993; Snow, 1991).
The measure is a "snapshot" and is thus not intended to provide a comprehensive assessment orprecise instructional levels as is possible with an informal reading inventory. Instead, the intentwas to give insight into how well children respond to the organization and language of books, aswell as an indication of their proficiency in reading (oral reading accuracy, comprehension, andfluency). The criteria involved in book selection included the following:(1) The story and pictures are attractive to children, (2) No unusually difficult vocabulary isinvolved, (3) The book is short in length, (4) The book topic is familiar to most children and (5)The book is not in common use in schools. More than a hundred books were considered andinformally field-tested with children; four were selected.
The selected paperback books are used to measure the child’s oral reading accuracy and theability to respond to text-based questions. The use of “little books” allows the children todemonstrate their efficiency with the text reading process authentically and naturally. The booksare graded or leveled (from simple to more complex) according to criteria such as: concepts andvocabulary, story line or topic, length, page layout and print size, supporting illustrations andsentence structure (Fountas & Pinnell, 1999). Levels for each book follow:
Toy Models Kindergarten/First Grade - Early Fall Level BMy Bike First Grade - Late Fall Level DPaint My Room First Grade - Early Spring Level HWind Power Second Grade- Early Fall Level J
Version one of the ISEL-K/1 has a score for Passage Reading that was determined solely onaccuracy with a total of 12 possible points (3 for each reading passage). In the 2003-2004enhancement, a comprehension component was added. The Passage Reading score nowcombines the reading accuracy score for each passage (assessed on a three point scale) andcomprehension questions for each passage for a total of a possible 20 points.
We encourage teachers to attend to fluency by noting whether the "student's oral readingsounded: smooth, word-by-word, or labored." Our analysis of a sample of 100 first gradersrevealed that these ratings are highly correlated with the number of oral reading errors made bythe student. Thus, at this stage of reading development, the two measures may be redundant.Since children are still mastering word recognition, quick recognition of sight words appears tobe a main component of fluency. We are also including a measure of fluency to be used with

49
children who read the third passage (Paint My Room) at the end of first grade with 85% accuracyor better. This will be described in the section on Snapshot 10.
Difficulty of Task
The Passage Reading Snapshot was administered to children in the fall and spring ofkindergarten and first grade during the field test year. Table 33 shows the results of thisadministration which indicates difficulty of the passages.
Table 33. Means, standard deviations, and percent correct on the Passage ReadingSnapshot for children in the fall and spring of kindergarten and first grade
Passage Reading(Total=12)
Mean RawScore
StandardDeviation
PercentCorrect
Fall Spring Fall Spring Fall Spring
Kindergarten2000-01 (n= 217)2001-02 (n=527)
First Grade2000-01 (n= 207)2001-02 (n=523)
.60 .49
4.504.18
2.943.46
9.149.46
1.801.56
3.603.58
3.093.21
2.692.60
54
3835
2429
7679
As can be seen, most growth occurs on this snapshot during the first grade year. Seventy-fivepercent is what we would expect for children mastering the third book (spring of first grade).Some children develop passage proficiency in kindergarten, but for most it is at the emergentlevel (first book).
Predictive Validity
Overall validity is reported in the later section on Validity. The face and content validity of thepassage reading task are self-evident. That is, if a teacher wishes to know whether a child canread simple storybooks, the snapshot provides this information. In addition, story readingprovides the opportunity for the teacher to observe children's familiarity with book reading andtheir fluency with text. Yet since sampling is involved, it would be possible for a teacher to marthe content validity by teaching to the test.
Does good performance on this snapshot relate to passage comprehension on this and other tests?Reading a passage or story book is a culminating activity, what the teaching of literacycomponents hopes to enable. Table 34 shows the extent to which good performance on passagereading at the fall of the year is associated with good performance on other early literacymeasures for kindergarten and first grade children taken at the end of the year. The coefficientsfor the kindergarten sample are substantial and statistically significant. That is, those childrenwho can read passages in the fall of kindergarten do well on passage reading at the end ofkindergarten. The trend is similar for first graders.

50
Table 34. Predictive Validity- Correlation coefficients showing the relation betweenPassage Reading measured in the fall and Passage Reading measured in the spring forkindergarten and first grade
Fall Passage ReadingSpring
Passage ReadingKindergarten2000-01 (n=217)2001-02 (n=527)
First Grade2000-01 (n=207)2001-02 (n=522)
.53
.54
.64
.53
First grade predictive and concurrent validity with other tests was also assessed. Table 35 showsthese coefficients with the Iowa Test of Basic Skills (ITBS) and the Gates MacGinitie ReadingTest (G-M). Larger sample concurrent validity is reported in the section on Validity.
As can be seen Passage Reading measured in the fall of first grade is a strong predictor ofComprehension as measured by the ITBS and of Comprehension and Word Decoding asmeasured by the G-M. The concurrent validity coefficients are also substantial indicating thatthe four graded passages measure in a brief period of time what is gained by a much longerstandardized measure administered to groups of children.
Table 35. First grade predictive and concurrent validity coefficients between ISEL-K/1Passage Reading and the Iowa Test of Basic Skills and the Gates MacGinitie Reading Test
ISEL Spring ITBS
N = 26
Spring ITBS
N = 19
G-MWord
DecodingN = 17
G-MComprehension
N = 26
Predictive ValidityFall Comprehension
Concurrent ValiditySpring Comprehension
0.76
0.79
0.62
0.62
0.87
0.74
0.86
0.73
Regional Reliability
Overall reliability is reported in the later section on Reliability. Does the snapshot provide astable and consistent measure of graded passage reading? To address this question, we examinedevidence from the field test schools and the six regions. Table 36 shows that the regionalreliability coefficients are high, particularly for the spring measures. In the fall, the passagereading is scored as acceptable (above 90%) or unacceptable, whereas in the spring, three points

51
for accuracy are possible. The higher coefficients for the spring sample probably reflect thisincrease in the scoring sensitivity. There are only four items (passages) composing this task andthey are, by design, from different levels of difficulty. Consequently, Cronbach alpha may be aless sensitive index of test reliability than other possibilities such as test-retest administration.
Table 36. Fall and spring regional reliability coefficients (Cronbach alpha) forkindergarten and first grade samples on Passage Reading
Version 1 FALL SPRINGKindergarten n Cronbach Alpha n Cronbach AlphaRegion 1 (2000-2001) 217 .6891 217 .6742Region 1 (2001-2002) 275 .7371 181 .7664Region 2 (2001-2002) 34 .7439 35 .7453Region 3 (2001-2002) 67 .6683 67 .7331Region 4 (2001-2002) 46 nv* 44 .5713Region 5 (2001-2002) 104 nv* 91 .7814Region 6 (2001-2002) 49 .6660 45 .7605 Average Coefficient 0.666 0.7189
First GradeRegion 1 (2000-2001) 207 .7283 207 .7995Region 1 (2001-2002) 283 .9045 194 .7445Region 2 (2001-2002) 78 .8056 71 .6525Region 3 (2001-2002) 60 .8397 58 .7565Region 4 (2001-2002) 69 .8352 64 .7354Region 5 (2001-2002) 60 .4125 50 .6706Region 6 (2001-2002) 48 .7450 46 .5734 Average Coefficient 0.7530 0.7046* No variation

52
INDIVIDUAL SNAPSHOT DEVELOPMENTVersion 2
Version 2 was developed so that there could be separate forms for Fall and Spring Assessment.It also enhanced the forms by adding two new snapshots.It includes second forms of snapshots for:
Phonemic Awareness- Form B-SpringDevelopmental Spelling - Form B-SpringWord Recognition- Form B-Spring
It includes new snapshots for:Vocabulary –Form A-Fall and Form B-SpringFluency–Form A-Fall and Form B-Spring
Alphabet and letter sounds, which test the whole domain, remains the same in both forms ofVersion 2. Listening and one-to-one matching which typically reach ceiling are also the same inboth forms. The same selections were used for Graded Passage Reading as students do not rereadpassages that they read before. A new scoring calculation was determined for Graded PassageReading to result in a combined score for Accuracy and Comprehension of 20.
ISEL-K/1 SNAPSHOT 3: PHONEMIC AWARENESS - Version 2, Form B
A second snapshot was developed for Version 2-Form B in consultation with Rae Moses, Ph.D.,Professor of Linguistics at Northwestern University. This form contained the same phonemicelements as were assessed with Version 2-Form A. Alternate Form Reliability of the two formsis .8403.
Complete reliability and validity information is located in the following sections on Validity andReliability. Regional Fall reliability coefficients are the same as in Version 1. Regional Springreliability coefficients calculated on Region 1 (N=44) is .7988.

53
ISEL-K/1 SNAPSHOT 6: DEVELOPMENTAL SPELLING-Version 2, Form B
Overall reliability and validity information is reported in the later sections on Validity andReliability. For Version 2, Form B for spring, 6 words which had been in the original field testdata were selected by difficulty level to match the list in Form A and to match the correlationwith the total spelling score. Alternate form reliability was .9067 (n=449). Fall regionalreliabilities are the same as Version 1. Table 37 reports the spring Regional reliabilities.
Table 37. Regional Spring reliability coefficients (Cronbach alpha) for kindergartensamples on Developmental Spelling (6 item snapshot) Version 2
SPRINGKindergarten-2003-2004 n Cronbach alphaRegion 1 235 .9164Region 2 111 .9036Region 3 80 .7830Region 4 36 .8448Region 5 76 .9080Region 6 55 .9368 Average Coefficient .8821
First Grade nRegion 1 275 .8457Region 2 105 .7269Region 3 56 .6816Region 4 56 .7577Region 5 76 .6662Region 6 50 .8687 Average Coefficient .7581

54
ISEL-K/1 SNAPSHOT 7: WORD RECOGNITION-Version 2, Form B
For Version 2, Form B, 22 words which had been in the original field test data were selected bydifficulty level to match the list in Form A and to match the correlation with the total vocabularyscore. Alternate form reliability was .9279 (n=449). Fall is the same as Version 1. Table 38reports the reliabilities for spring.
Table 38. Spring reliability coefficients (Cronbach alpha) for kindergarten and first gradesamples on Word Recognition-Version 2
SPRINGKindergarten-2003-2004 n Cronbach alphaRegion 1 248 .9379Region 2 35 .9103Region 3 67 .9310Region 4 44 .9006Region 5 91 .9382Region 6 45 .9168 Average Coefficient 0.9233
First Grade-2003-2004Region 1 200 .8862Region 2 71 .8256Region 3 58 .8575Region 4 64 .8521Region 5 51 .8290Region 6 46 .7006 Average Coefficient 0.8313

55
ISEL-K/1 SNAPSHOT 8: VOCABULARY- Version 2, Forms A and B
Background and Purpose
Few standardized measures of word knowledge exist for classroom assessment. Best known isthe Peabody Picture Vocabulary Test (PPVT) (Dunn & Dunn, 1997). Other standardized testswith vocabulary assessments are generally group administered, silent measures. This is not anassessment that assigns a vocabulary age or grade level as does the more sensitive PPVT. Theintent of this vocabulary assessment is to give teachers an individual grade- appropriate tool toget a picture of the way in which young students in a particular class, school or district scale inrelation to others taking the test.
In Snapshot 8, the child is expected to respond with an indication of understanding to a list of 14words that increase in difficulty. Because the list spans early emergent to second grade, it is nota list of the 14 most known words but a sampling of frequent words at each level, kindergartenthrough grade 2.
Development of the TaskSelecting a Corpus of Words for the Field Test
Two hundred words were chosen from the work of Biemiller and Slonim (2001) which hasestablished that young children’s oral recognition vocabulary is approximately two yearadvanced over their reading vocabularies. In consultancy with Andrew Biemiller of the OntarioInstitute for the Study of Education, the corpus of words chosen for field-testing were:
Grade at Which Words are First Known by 80% or More ChildrenKindergarten Grade One Grade Two Grade Threespreadlooptipclownflashlight
nobodyonlyairgluestar
TVaboutplayown
fishvoiceshotlistennear
dropalphabetsplashalrighteyebrow
tigerpuppypianomice
throatfloodmatch (fire)cafémath
snatchvolume (sound)terrorsmearbrought
lakedumbworntack
swing (baseball)sockchoicebaitant
topfeedsniffthirdhamster
grillnicknameragadvice

56
terrible
eyemoondaysightfeet
stopwaterlive (be live)bear (animal)kiss
mean
wrinkleaimmysterychopscare
helmetbudsampleofficecrime
way
lawnhomeworkdamporganaboard
distancepillcranberryadmiremember
canteen
raccoonglarepackplowsincere
stateaidchipelsebashful
To eliminate inappropriate words, the lists were then rated by a team of 5 expert teachers withprimary grade experience. The teachers were asked to indicate words that they felt were notappropriate K/1 words and to scale them in difficulty. The 48 words deemed most appropriatewere selected for the first cut. This list was administered to 20 kindergarteners and 20 first gradestudents on a trial basis to see if any unanticipated problems emerged with the words or format.

57
The 48 word field-test list that resulted was:
ISEL-K/1 Field Test ListEasy K 1 kiss Hard 1 1 done
2 play 2 anchor3 flashlight 3 head4 terrible 4 buckle5 eye 5 sheet6 bear 6 aunt7 loop 7 horrid8 glue 8 curl
Harder K 1 listen Easy 2 1 throat2 drop 2 flood3 match 3 damp4 claws 4 pill5 tumble 5 admire6 near 6 member7 space 7 terror8 munch 8 organ
Easy 1 1 voice Hard 2 1 sliver2 shot 2 boulder3 eyebrow 3 cobra4 tiger 4 shimmer5 mean 5 root6 helmet 6 haul7 office 7 justice8 crime 8 secure
Field Test Refinement
The resulting list of 48 words was administered to 227 kindergarten students and 181 first gradestudents at schools selected to reflect the demographic makeup of Illinois school children.Student responses were used to identify those words from each subset. Table 39 shows the list of28 words representing levels that seemed to emerge clearly from the first set of 40 words and thepercent of kindergarten and first grade children who responded to each of the words correctly.
Generally, the emergent words were easiest for both kindergarten and first grade children torespond to with an indication of understanding which might be a definition, a synonym, a usage,a physical or other indication that the students knew some meaning of the word. Our goal was toinclude in the final list a sufficient number of emergent words -- about eight -- so that emergentreaders at the beginning of kindergarten could be identified, and so that beginning first graderswould have a high rate of mastery.
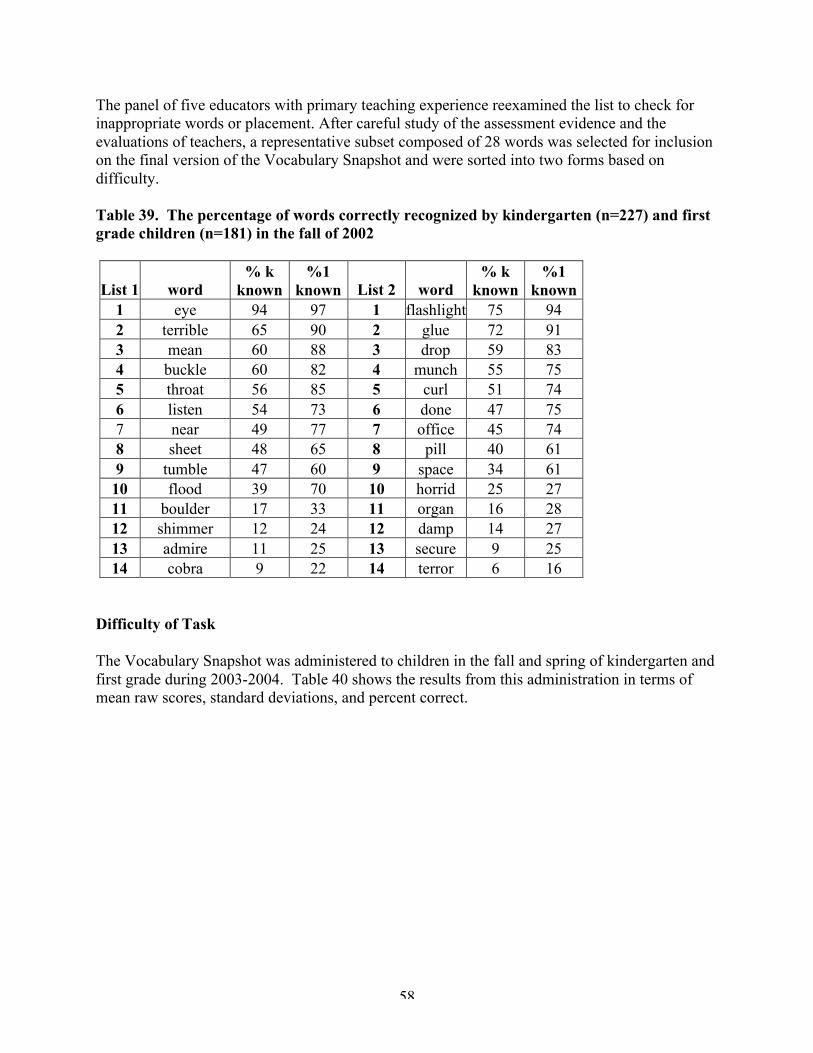
58
The panel of five educators with primary teaching experience reexamined the list to check forinappropriate words or placement. After careful study of the assessment evidence and theevaluations of teachers, a representative subset composed of 28 words was selected for inclusionon the final version of the Vocabulary Snapshot and were sorted into two forms based ondifficulty.
Table 39. The percentage of words correctly recognized by kindergarten (n=227) and firstgrade children (n=181) in the fall of 2002
List 1 word% k
known%1
known List 2 word% k
known%1
known1 eye 94 97 1 flashlight 75 942 terrible 65 90 2 glue 72 913 mean 60 88 3 drop 59 834 buckle 60 82 4 munch 55 755 throat 56 85 5 curl 51 746 listen 54 73 6 done 47 757 near 49 77 7 office 45 748 sheet 48 65 8 pill 40 619 tumble 47 60 9 space 34 61
10 flood 39 70 10 horrid 25 2711 boulder 17 33 11 organ 16 2812 shimmer 12 24 12 damp 14 2713 admire 11 25 13 secure 9 2514 cobra 9 22 14 terror 6 16
Difficulty of Task
The Vocabulary Snapshot was administered to children in the fall and spring of kindergarten andfirst grade during 2003-2004. Table 40 shows the results from this administration in terms ofmean raw scores, standard deviations, and percent correct.

59
Table 40. Means, standard deviations, and percent correct on the Vocabulary Snapshot forchildren in the fall and spring of kindergarten and first grade 2003-2004
Vocabulary(Total=14)
Mean RawScore
StandardDeviation
PercentCorrect
Fall Spring Fall Spring Fall Spring
Kindergarten2003-04
First Grade2003-04
6.1
8.4
8.7
9.8
3.4
3.4
2.6
2.5
4.4
6.0
62
70
It is important to note that Target scores are the 50th percentile score using weighted means.They indicate the average scores for students at a specific time of year. Watch scores are the 20th
percentile score. Scores on the vocabulary measure scale students with respect to others who takethe test, but they do not provide a grade level. Rather, they provide a way to look at a class orschool and estimate relative vocabulary knowledge of these terms (Biemiller, 2001).
Validity
Overall validity is reported in the later section on validity. The face and content validity of thevocabulary snapshot are enhanced by the way the list composed with a selection of words scaledby difficulty based on the Living Word Vocabulary (Dale &O’Rourke, 1976) and the assessmentwork of Biemiller and Slonim (2001). If a teacher wishes to know whether a child hasknowledge of specific words and roughly at what level, this snapshot provides this information.
Regional Reliability
Does the snapshot provide a stable and consistent measure of vocabulary? As can be seen fromTable 41, fall and spring reliability coefficients (Cronbach alpha) for kindergarten and first gradesamples on Vocabulary are high. The correlation of the two lists is .9423.

60
Table 41. Fall and spring reliability coefficients (Cronbach alpha) for kindergarten andfirst grade samples on Vocabulary
FALL SPRINGKindergarten n Cronbach alpha n Cronbach alpha
Region 1 (2003-2004) 221 .8372 235 .6587Region 2 (2003-2004) 154 .8574 111 .7541Region 3 (2003-2004) 83 .8237 80 .6091Region 4 (2003-2004) 19 nv 36 .6431Region 5 (2003-2004) 93 .8008 76 .7589Region 6 (2003-2004) 63 ,8660 55 .7302 Average Coefficient .8402 .6924
First GradeRegion 1 (2003-2004) 250 .8371 274 .7032Region 2 (2003-2004) 78 .7737 105 .7050Region 3 (2003-2004) 60 .8902 56 .6384Region 4 (2003-2004) 69 .6337 70 .5760Region 5 (2003-2004) 60 ,8608 75 .7264Region 6 (2003-2004) 48 .9206 50 .7922 Average Coefficient .8373 .6902
This snapshot was designed with two forms for Version 2. Alternate form reliability (A/B) is.9423.

61
ISEL-K/1 SNAPSHOT 9: PASSAGE READING-Version 2, Forms A and B
This snapshot is the same in Versions 1 and 2 but the scoring for Version 2 includes thecomprehension questions resulting in 20 items.
Table 42. Spring reliability coefficients (Cronbach alpha) for kindergarten and first gradesamples on Passage Reading with comprehension. Version 2
Version 2 SPRINGKindergarten n Cronbach alpha
Region 1 (2001-2002) 248 .9675Region 2 (2001-2002) 35 .9685.Region 3 (2001-2002) 67 .9535Region 4 (2001-2002) 44 .9446Region 5 (2001-2002) 92 ..9753Region 6 (2001-2002) 45 .9723 Average Coefficient .9636
First GradeRegion 1 (2001-2002) 200 .9174Region 2 (2001-2002) 71 .8828Region 3 (2001-2002) 58 .9192Region 4 (2001-2002) 64 .8727Region 5 (2001-2002) 51 .9370Region 6 (2001-2002) 46 .9202 Average Coefficient .9082nv= No variation

62
ISEL-K/1 SNAPSHOT 10: FLUENCY-Version 2, Forms A and B
Background and Purpose
The ability to read fluently (at a good rate, with good accuracy and proper intonation andphrasing) is highly correlated with many measures of reading competence (Kuhn & Stahl, 2003;Strecker, Roser & Martinez, 1998; Johns & Berglund, 2002). For the reader, fluency requiresgood decoding skills, the strategies to orchestrate these in reading real text, and thecomprehension to monitor what is being read to make sure it sounds like language.
For the teacher, listening to students read and charting their development in fluency is also a wayto measure the effect of instruction and to provide input for further instructional planning(Blachowicz, Moskal, Fisher, Massarelli, Obrochta, Fogelberg, (in press). Unlike moststandardized measures which only show large changes in behavior, fluency measurement issensitive to small increments of improvement (Shinn, 1989). Students who are fluent readers areable to devote less of their attention to word recognition and more of their attention tocomprehension. Thus, fluency generally results in increased reading comprehension (Samuels,1979; Shinn, 1989) and is identified as a critical component of skilled reading (National ReadingPanel, 2000).
In snapshot 10 of the ISEL-K/1, students are expected to read a narrative passage aloud to anexaminer. They are stopped at the end of one minute and the number of words read correctly isnoted.
Design of Task
Five passages were developed using common early elementary themes: friends, pets, raccoonsand a tree house. The passages had simple, but natural language, and vocabulary appropriate forfirst graders. It was decided to make all of the passages narratives since most young students arefamiliar with narrative text structure (Baker & Brown, 1984). The stories ranged in length from155-182 words.
The literature regarding specific grade-level appropriate oral reading rates suggests that preciserates are somewhat passage dependent (Bear & Barone, 1998; Rasinski & Padak, 1996). Studiesand estimates (Hasbrouck & Tindal, 1992; Barr, Blachowicz, Kaufman & Katz, 2001) suggestthat 50-80 wpm is a typical range for end of first grade readers. Therefore, it was determined thatpassages of 150 words would accommodate most fluent first-grade readers.
As fluency assessment is not appropriate for early emergent readers, it was determined that itwould be administered only to students who read at a middle-to-late first grade level For theISEL-K/1, this would mean students who were able to successfully complete Passage ReadingSnapshot 8-3, Paint My Room. which is appropriate for spring of first grade. Therefore, thepassages were written to reflect an end of first grade-beginning of second grade reading level.Readability of the passages, as measured by the Flesch-Kincaid readability formula, ranged from

63
1.5 – 2.2. The five stories were then taken to field tryouts with the goal of narrowing the storiesdown to two that were comparable in terms of difficulty.
Field Test Refinement
Initial tryouts of all five stories were conducted in an ethnically and economically diverse schoolwith a wide range of student achievement at each grade level. For the purpose of the tryouts,students were selected from all three first grade classrooms. Since students who would take thefluency subtest of the ISEL-K/1 would need to have successfully read Paint My Room, the bookfor early spring of first grade, students were selected by the teachers from among the mostcapable readers in first grade.
Eleven females and eight males participated in the story tryouts, which were conducted in themornings during the course of a week in early April, 2003. Students met individually with thetest administrator just outside their first-grade classrooms. The administration of the passageswas counterbalanced so that the passages were not read in the same order by all of the students.An electronic timer was used to ensure accuracy of the timing. Following the reading of eachstory, students were asked to reflect on their perceptions of the difficulty of the story and itsinterest to them. Field notes were made following each assessment and were analyzed. Basedon the tryouts, two stories were selected for more extensive field-testing, “Matt’s Dog” (183words, RL 1.8) and “Best Friends” (156 words, RL 2.2). The mean rate for “Matt’s Dog” was106 words correct per minute (wcpm). The mean rate for “Best Friends” was 105 wcpm.Students also reported that they were motivated to read both stories.
Difficulty of Task
The Fluency Snapshot was administered to 633 kindergarteners and 655 first graders during the2003-2004 academic year. Table 43 shows the number of students able to complete the fluencymeasure and their average correct words per minute.

64
Table 43. Difficulty of Fluency Snapshot
FALL SPRING
Total N
n
nable toread
FluencySnapshot
nable toread
FluencySnapshot
cwpm
M and SDFirst Grade nRegion 1 (2003-2004) 300 34 240 74.32 (36.43)Region 2 (2003-2004) 112 14 97 73.28 (40.14)Region 3 (2003-2004) 56 0 50 72.50 (30.30)Region 4 (2003-2004) 77 0 63 54.54 (36.15).Region 5 (2003-2004 93 0 41 57.83 (29.30)Region 6 (2003-2004) 55 0 36 82.08 (36.15)Average cwpm of total n -- 544 =
total N68.63 (38.19)
Average cwpm of readers 49 61.23cwpm
mode38 wpm
527 canread
70.84 (36.72)
Validity
Overall validity information is found in the later section on Validity. The face and contentvalidity of the fluency task are self-evident. That is, if a teacher wishes to know whether a childcan read simple narratives fluently, the snapshot provides this information. Since sampling isinvolved, it would be possible for a teacher to mar the content validity by teaching to the test.
Reliability
Overall reliability information is found in the later section on Reliability. The snapshot providesa stable and consistent measure of fluency. 322 students were assessed with both passages(alternate form reliability) and the correlation between performance on the two passages was.9560. Test-retest correlation on the Passage A was .8920 and on Passage B was .8788.

65
STANDARDIZATION SAMPLE
Standardization Sample Characteristics
The standardization sample was selected from across the state of Illinois so as to berepresentative of the state in terms of region, income, and ethnicity. The Illinois State Board ofEducation has divided the state into six regions. Proportional samples of children were obtainedfrom each of these regions to yield a sample that was diverse in terms of urban, suburban, andrural representation. The six educational regions include: (1) the Chicago and nearby suburbanarea, (2) north middle and northwestern Illinois, (3) west central Illinois, (4) east centralIllinois, (5) southwestern Illinois, and southern Illinois. The collaborative data collection teamfrom across the state included Louis Ferroli, Rockford College and Roberta Berglund, NorthernIllinois University (Region 2), Kathryn Ransom, University of Illinois, Springfield (Region 3),Thomas Crumpler and Susan Lenski, Illinois State University (Region 4), StephanieMcAndrews, Southern Illinois University (Region 5), and Marla Mallette and William Henk,Southern Illinois University (Region 6) who worked with us to obtain assessment results that arerepresentative of the state. (See the Appendix for a complete listing of districts participating inthe assessment and for a list of consultants).
As Tables 44A, B, and C show how the standardization sample closely approximates the state ofIllinois demographically in terms of race/ ethnicity and is distributed by gender and geographiclocation. These tables also show that the sample closely represents the racial and ethnicdistribution characteristics of the United States as a whole with one deviation: more AfricanAmericans reside in Illinois than in the United States as a whole. Although there would appearto be an under-representation of Hispanic children in the sample, this occurs because someSpanish-speaking children who spoke little English were tested with the Spanish version of theISEL (ISEL-S). The standardization sample may also under-represent the proportion of childrenreceiving free lunch in Illinois – but our analysis of the socioeconomic status of the districts wesampled suggests that in some locales there may be hesitancy to apply for free lunch. Forexample, in one district near Chicago where the per capita income is low, only 17 percent of thechildren in our sample applied for free lunch.

66
Table 44A. The standardization sample for the ISEL-K/1 in terms of Race/Ethnicity andFree Lunch Demographics (based on 2002 Illinois State Board of Education data)
Group White Black Hispanic Asian NativeAmerican
FreeLunch
ISELKindergarten 61.0 21.6 13.6 3.5 0.1 31.7ISEL FirstGrade 63.0 20.1 13.8 3.6 0.1 32.0ISELTotal 62.0 20.9 13.7 3.5 0.1 31.8
2001 StateTotals 60.1 20.9 15.4 3.4 0.2 36.92000 StateTotals 61.1 20.9 14.6 3.3 0.2 36.72000 U.S.Totals 62.6 12.3 12.5 3.6 0.9 ----
Table 44B. Distribution of sample by grade and gender
Year Date Grade Total Male FemaleField Test2000-2001 Fall K 232 118 1142000-2001 Fall 1 221 112 1092000-2001 Spring K 232 118 1142000-2001 Spring 1 223 113 110
Norming2001-2002 Fall K 579 268 3112001-2002 Fall 1 602 324 2782001-2002 Spring K 531 238 2932001-2002 Spring 1 532 284 248
EnhancementsField test2002-2003 Spring K 398 221 1772002-2003 Spring 1 479 238 241
Norming2003-2004 Fall K 633 334 2992003-2004 Fall 1 693 367 326
Spring K 597 323 272Spring 1 635 334 300

67
Table 44C. Distribution of sample by geographic area
2001-2002 Area 1 Area 2 Area 3 Area 4 Area 5 Area 6 Total bygrade
FALLK male 133 13 30 21 52 19 268K female 146 21 37 25 52 30 311K fall total 279 34 67 46 104 49 579
1 male 152 44 37 35 34 22 3241 female 134 34 24 34 26 26 2781 fall total 286 78 61 69 60 48 602TOTALFALL
565 112 128 115 164 97 1181
SPRINGK male 114 16 29 19 45 15 238K female 134 19 38 25 47 30 293K spring 248 35 67 44 92 45 531
1 male 129 38 33 33 30 21 2841 female 113 33 25 31 21 25 2481 spring 242 71 58 64 51 46 532TOTALSPRING
490 106 125 108 143 91 1063
2003-2004enhancements
Area 1 Area 2 Area 3 Area 4 Area 5 Area 6 Total bygrade
K male 125 63 44 13 59 30 334K female 136 51 39 6 34 33 299K fall 261 114 83 19 93 63 633
1 male 161 64 30 39 50 23 3671 female 139 48 26 38 43 32 3261 fall 300 112 56 77 93 55 693TOTALFALL
565 112 128 115 164 97 1326

68
DIFFICULTY OF THE ISEL-K/1 SNAPSHOTS
The ten snapshots form a continuum in skills and knowledge that is traversed by children as theylearn to read and write. Table 45 show the percent of items that children, on average, get correctwhen they enter and finish kindergarten and first grade
Most children come to school with some knowledge of the alphabet and ability to listen tostories. As shown in Table 45A, these are the two easiest snapshots. Kindergarteners, on theaverage, just entering school, are able to answer from 67 to 71 percent of the story questionscorrectly. Similarly, kindergarteners, on average, enter school knowing 65 to 66 percent of theupper and lower case alphabet letters. However, most kindergarteners entering school havedifficulty responding to items that measure Phonemic Awareness and One-to-One Matching, asthey finger- point read a simple story. And for most, the activities tapped by the remainingsnapshots, are not well known by children. By the end of the kindergarten year, children onaverage make dramatic gains in all areas assessed with the possible exception of Story Listening.By the end of kindergarten, many children show mastery of Alphabet Recognition and goodprogress in Phonemic Awareness and One-to-One Matching as they “read” a simple story. Theylearned Letter-Sounds, mainly the consonants but a few vowels, and progressed inDevelopmental Spelling.
Most first graders come to school having mastered most items on the first four snapshots. Theyhave also learned many letter-sound associations in kindergarten and some know how to spelldevelopmentally. Some have learned some sight words, and some are able to read simplestorybooks and messages. By the end of first grade, they have made the most gains inDevelopmental Spelling, Word Recognition, Vocabulary and Passage Reading and more limitedgains in other areas where they already show a high level of mastery. Fluency is only assessedwith respect to the students who are reading, thus a growth is seen from the beginning to the endof first grade. Table 45 B shows the difficulty for snapshots added for Version 2.

69
Table 45A. Average percent correct on the eight ISEL-K-1 assessments by kindergartenersand first graders in the fall and spring, Version 1
ISEL-K-1 Snapshots Sample KindergartenFall
KindergartenSpring
Grade 1Fall
Grade 1Spring
Alphabet Recognition(54 Items)
Story Listening(21 Items)
Phonemic Awareness(10 Items)
One-to-One Matching(9 Items)
Letter Sounds(26 Items)
Developmental Spelling(27 Items)
Word Recognition(22 Items)
Passage Reading(12 Items)
2000-20012001-2002
2000-20012001-2002
2000-20012001-2002
2000-20012001-2002
2000-20012001-2002
2000-20012001-2002
2000-20012001-2002
2000-20012001-2002
6663
71*64
5658
4446
3033
1519
87
64
9395
6877
8286
8287
6979
4856
3742
2529
9596
8278
8987
8889
7576
5656
4650
3735
9999
8384
9696
9899
9093
8181
9091
7679
* The fall version of the Story Listening snapshot consisted of 10 items in contrast to the finalversion with 21 items.

70
Table 45B. Average percent correct on the ten ISEL-K/1 assessments by kindergartenersand first graders in the spring, Version 2-alternate snapshot
ISEL-K/1 Snapshots KindergartenSpring
Grade 1Spring
Phonemic Awareness(10 Items)
Developmental Spelling(27 Items)
Word Recognition(22 Items)
Vocabulary(14 items)
Fluency (wcpm)
83
58
22
62
93
87
70
70
68 cwpm
We considered this evidence in deriving our recommendations concerning the snapshots thatshould be administered at the beginning and end of kindergarten and at the beginning and end offirst grade. However, the results also show that some kindergarteners have already madesubstantial progress and thus should be given more advanced snapshots. Likewise, some firstgraders have developed only limited knowledge of literacy; for them, the first several snapshotswill provide useful diagnostic information.

71
RELIABILITY OF THE ISEL-K/1 SNAPSHOTS
To establish the reliability of the ISEL-K/1 as a whole and for individual snapshots, weexamined the evidence from the nine Area 1 field test schools in which the ISEL-K/1 wasadministered during the fall of 2000 and the spring of 2001 and from the six educational regionsof Illinois in the fall of 2001 and the spring of 2002 and again in 2003-2004. The samples ofkindergarten children from the six regions ranged in size from 34 to 217. The samples of firstgraders ranged in size from 48 to 207. The 2003-2004 sample for vocabulary and fluencyclosely replicated the prior sample. The total sample for the three years totaled 1793kindergarteners and 1809 first graders.
Table 46A shows the average reliability coefficients for each of the ISEL snapshots. Thecoefficients reported represent the average coefficients obtained for the field test and thestandardization samples. As can be seen, the coefficients are acceptably high for most snapshots,particularly for those most appropriate for a specified grade level.
Table 46A. Average fall and spring reliability coefficients (Cronbach alpha except forFluency which is test-retest) for kindergarten and first grade samples on the ISEL-K/1snapshots
Snapshot (Number of Items) Kindergarten First Grade
1. Alphabet Recognition (54 )
2. Story Listening (21)
3. Phonemic Awareness (10)
4. One-to-One Matching (9)
5. Letter Sounds (26)
6. Develop. Spelling (27)
7. Word Recognition (22)
8. Vocabulary (14) (Version 2 0nly)
9. Passage Reading (20) (Snapshot 8, Version 1) (12)
10. Fluency
Fall
.9768
.8118
.7427
.8329
.9365
.9289
.9072
.8402
.9320
.6660*
Spring
.8705
.7520
.7411
.7738
.8672
.8819
.9233
.7180
.7189
*
Fall
.8937
.7699
.7595
.7286
.8809
.8690
.9248
.8373
.9493
.7530
.8920
Spring
.4441**
.7038
.6385**
.3645**
.7593
.7356
.8313
.6993
.7046
.8788

72
* Not recommended for use in kindergarten because of the low number of cases who can read** Not recommended for use at the end of first grade. A large number of subjects havemastered these skills by the end of first grade and thus reached ceiling levels which reduces therange of variance.
According to our prior recommendations (See Table 1), it is important that the first foursnapshots be reliable measures at the beginning of kindergarten, and that the first six be reliablemeasures at the end of kindergarten. The first four snapshots, Alphabet Recognition, StoryListening, Phonemic Awareness, and One-to-One Matching are all reliable for the beginning andend of kindergarten. Letter-Sounds and Developmental Spelling are reliable at the end ofkindergarten. The somewhat lower reliabilities for Phonemic Awareness (in a picture selectiontask format) reflect the multiple-choice nature of this snapshot. As discussed in previoussections of this manual, an alternative version of this snapshot has been developed in whichchildren generate the first sound of a spoken word (Phonemic Awareness - Production). Thepredictive validity of the Phonemic Awareness - Selection task (where children select an answerfrom a set of three) is higher than the more Phonemic Awareness -Production task, but theProduction task is more reliable (.9345).
It is also important that snapshots 3-9 are reliable at the beginning of first grade, and that the lastfour snapshots are reliable at the end of first grade. Table 46 B shows the alternate formreliability of the two forms and Table 46C details the test-retest reliability. Table 47 presents themeans and standard deviations. Generally, in all these tables, reliability coefficients areacceptable for the beginning of first grade. The reliability coefficients for the last five snapshotsare also acceptable at the end of first grade. Although reliabilities are marginal or unacceptablefor Snapshots 1-4 at the end of first grade (Story Listening, Alphabet Recognition, PhonemicAwareness, and One-to-One Matching), this occurs because most first graders have alreadymastered this content.

73
Table 46B. Alternate Form Reliability- ISEL-K/1 Version 2 Forms A and B - Grade 1N= 449
Snapshot (Number of Items)
1. Alphabet Recognition (54 )
2. Story Listening (21)
3. Phonemic Awareness (10)
4. One-to-One Matching (9)
5. Letter Sounds (26)
6. Develop. Spelling (27)
7. Word Recognition (22)
8. Vocabulary (14)
9. Passage Reading (20)
10. Fluency
NA .
NA
.8403
NA
NA
.9067
.9279
.9423
NA
.9560
NA= Snapshot which is the same in both forms

74
Table 46C. Test-Re-test Reliability - ISEL-K/1 Version 1 –Kindergarteners tested in Maywith 8 day retest intervalN= 64
Snapshot (Number of Items)
1. Alphabet Recognition (54 )
2. Story Listening (21)
3. Phonemic Awareness (10)
4. One-to-One Matching (9)
5. Letter Sounds (26)
6. Develop. Spelling (27)
7. Word Recognition (22)
8. Passage Reading (12)
.8516
.6893
. 8962
.7487
.8833
.8492
.8270
.8514
Table 47. Average fall and spring means and standard deviations (SD) for kindergartenand first grade samples- 2001-2002 except where noted by *
Snapshot (Number of Items) Kindergarten First Grade
1. Alphabet Recognition (54 )2. Story Listening (21)3. Phonemic Awareness (10)4. One-to-One Matching (9)5. Letter Sounds (26)6. Developmental Spelling (27)7. Word Recognition (22)8. Passage Reading (12) (SD only for Version 1)8. Vocabulary (14)* (Version 2 only)10. Fluency *
FallMean (SD) N=579
33.6 (16.9)13.4 (4.5)5.7 (2.7)4.1 (2.9)8.5 (7.3)4.9 (5.4)1.5 (3.5).5 (1.5)6.1(3.4)
-
SpringMean (SD) N=531
51.5 (5.1)16.2 (3.6)8.6 (1.9)7.8 (1.9)20.7 (5.2)15.2 (5.6)
9.3 (6.1) 3.5 (3.2)8.7 (2.57) -
FallMean (SD)
N=598
51.7 (4.3)16.3 (3.3)8.6 (2.0)8.0(1.7)
19.6 (5.1)14.8 (5.3)10.7 (6.2)4.1 (3.6)
8.4 (3.4) --
SpringMean (SD)
N=527
53.7 (0.7)17.7 (2.9)9.6 (1.1)8.9 (0.4)24.3 (2.3)22.0 (3.7)20.0 (3.1)9.5(2.6)
9.81 (2.45)68.63 cwpm

75
VALIDITY OF THE ISEL-K/1 SNAPSHOTS
Recent guidelines developed for educational and psychological measurement (see, for example,Standards for Educational and Psychological Testing, AERA, 1999) argue for a unitaryconception of validity, with purpose at its core. A test may be valid for some purposes, but notfor others. For example, the purpose of the Alphabet Recognition snapshot is to help teacherslearn which children are already familiar with the letters of the alphabet and can name then, andwhich children are still in the process of becoming familiar with them. Since all letters, upperand lower case, are assessed on a one-to one basis, the task, because of its content andprocedures, is highly valid. That is, for the purpose defined by teachers, the test measurescompletely what is desired. We selected the eight areas of the ISEL-K/1 on the basis of teacherinterviews – the eight snapshots yielded information teachers need to develop instruction. Wealso consulted the research literature on early reading development to insure that aspects ofreading shown to be important to reading development were included such as the report of theNational Reading Panel (2002), Preventing Reading Difficulties in Young Children (Snow,Burns and Griffin, 1998) and the Handbooks of Reading Research I, II, and III.
The construct validity of all tasks is high since the tasks were developed to tap the informationthat teachers desire as they plan instruction for children and on the basis of the researchliterature. They were also reviewed by teacher and reading specialist review boards and byconsultants who are both educators in the field, university researchers, editors of researchjournals, members of the NAEP panel and research award winners (see Appendix). Thesnapshots are performance measures, assessing items that teachers want children to learn and beable to do (Alphabet Recognition, Letter-Sounds, Word Recognition, Fluency) and processmeasures involving aspects of reading and writing (Story Listening, One-to-One Matchingduring text reading, Phonemic Awareness, word segmentation into sounds during DevelopmentalSpelling, Vocabulary, Passage Reading and Fluency). The snapshots engage children in tasksthat are common instructional activities in kindergarten and/or first grade. Some, such asDevelopmental Spelling, Passage Reading and Fluency, are complex in that they require theintegration of children’s knowledge. Teaching to the processes involved in each of thesesnapshots is what we hope will occur since these are areas children need to master. Yet, thosesnapshots that include only a subset of the possible target items from a domain (DevelopmentalSpelling, Word Recognition, Passage Reading) are vulnerable to practice effects if teachers teachthe items included in the snapshots. For example, teachers can invalidate the spelling snapshotby teaching the six spelling words or the word recognition snapshot by teaching the 22 wordrecognition items. Should this occur, the validity of the snapshot at the end of the year would bejeopardized. To avoid this, we have developed two different forms of the ISEL-K/1.
Concerning more traditional definitions of validity, whether a test is similar to what otherliteracy tests measure (concurrent validity) and/or whether it predicts subsequent reading(predictive validity) may be of interest. As to the latter measure, Kame’enui (2002), in the reportof the assessment committee of the IDEA Institute on their analysis of reading assessmentinstruments for K-3, argues for the importance of these forms of validity, particularly predictivevalidity.

76
Yet, we could also argue that high predictive validity is not always desirable. In schools witheffective intervention programs available for those children with few prior literacy experiences,we find that the correlations are lower than in schools without such support. That is, predictivecoefficients are lower in schools where lower achieving children are brought to the class average.
Table 48A details the correlation between the ISEL-K/1 and the Gates-MacGinitie Reading Test.Table 48 B details the correlation between the ISEL-K/1 and the Iowa Test of Basic Skills, FormB (Harcourt Educational Measurement, 1995).
Table 48A. Concurrent Validity- ISEL-K/1 and Gates MacGinitie Reading Test (G-M)(MacGinitie & MacGinitie,1989) for the Suggested Grade 1 Spring Subtests
N= 234
Gates-MacGinitieISEL-K/1 Comprehension Word
DecodingTotal Reading
Developmentalspelling
.5828 .6802 .6693
Wordrecognition
.7203 .7433 .7531
Gradedpassagereading
.7120 .7627 .7621
Fluency .7788 .8093 .8247
Vocabulary .8152 .9429 .9783
Table 48B. Concurrent Validity- ISEL-K/1 and Iowa Test of Basic Skills (ITBS) Harcourtfor the Suggested Grade 1 Spring Subtests N= 144
Iowa Test of Basic SkillsISEL-K/1 Comprehension Phonics/VocabularyDevelopmental spelling .6003 .6289
Word recognition .8416 .8392
Graded passage reading .7282 .7352
Predictive Validity
Predictive validity information is presented in the sections on each snapshot.

77
SETTING STANDARDS FOR TARGET AND WATCH SCORES
A mandate for the ISEL-K/1 was to determine a “watch” score to identify students who mayrequire early intervention. Further, target scores for average performance were also generated.The Watch and Target scores for the ISEL-K/1, Versions 1 and 2, are found in the appendices tothis manual. The section which follows provides the theoretical and empirical rationale fortheir determination for Version 1.
Selecting Achievement Goals for Target Levels
Establishing benchmarks or achievement goals for kindergarten and first grade children iscomplicated. We have chosen the term “Target Scores” to refer to the mean level ofperformance. These Target Scores can help in setting class, school, or district instructionalgoals. Some children will achieve higher than this level, but our goal is to have all children, eventhose who enter kindergarten with limited literacy, achieve at this level. We established these“targets” in two ways. Most basically, we asked about how well a child must be achieving at theend of each year to insure good continued progress. In other words, we asked what a childneeded to know by the end of kindergarten to insure that he or she would do well in first grade.Similarly, we asked what a child needed to know and how well he or she needed to read by theend of first grade to insure fluent reading in second and subsequent grades. This process wasfollowed with Version 1, normed in 2001-2002, so the snapshots and data for that version willbe discussed here. This process provided the basis for adding snapshots for Vocabulary andFluency for Version 2. Those data will be reported in the individual snapshot sections.
Kindergarten Targets
Reading Clinicians. Our first effort to address these questions was to approach a group ofreading clinicians about their expectation for the progress of the children with whom theyworked for performance on the first 8 snapshots. We asked, “How well must a child perform foryou to be confident that he or she will continue to progress, given quality classroom instruction?There was clear agreement in expectations: by the end of kindergarten, mastery was expected inalphabet Recognition, Phonemic Awareness, and one-to-one finger point reading. In addition,clinicians expected that consonant letter-sound associations will be learned and will be applied indevelopmental spelling, some simple sight words will be learned, and a simple patternedstorybook read with few miscues. The clinicians were confident that children who were able toperform at these levels would become proficient readers. These expectations translate intoTarget scores as follows for Version 1 (Full Target Scores for both versions in Appendices A andB.):
Alphabet Recognition: 52 of the 54 upper and lower case letters (allowing for reversals)Phonemic Awareness: 9 of the 10 itemsOne-to-One Matching: 8 of the 9 itemsLetter Sounds: 16 of the 18 consonant letter-sound associations

78
Developmental Spelling: 14 of the 15 consonants representedWord Recognition: 7 of 9 “emergent” kindergarten words (first 1/3 of list) recognizedPassage Reading 3 of 12 indicating mastery of the kindergarten/ early first passage
Less certainty was expressed about how well children should be achieving on the Story ListeningTask (Vocabulary and Comprehension) and the added Vocabulary measure. Although allclinicians indicated the importance of children knowing word meanings and comprehendingsimple stories and vocabulary, they were unable to confidently state a level of achievementnecessary for future proficient reading comprehension. Moreover, the research literature doesnot provide a basis for making this judgment. As to Fluency, there is a paucity of research on thefluency level needed for competent performance in first grade. One large-scale research study(Hasbrouck & Tindal, 1992) suggests that the mean second grade rate in fall is 53 wpm in fall ofsecond grade, but our clinical experience and experience in field-testing passages suggests highvariability depending on the type of first grade passages utilized.
Regional Norms. We also sought to define normal progress by administering the ISEL-K/1 tomany kindergarten children across the state. As previously discussed, the state of Illinois isdivided into six educational regions. Samples were collected from each of these regions during2001-2002. The results for each of the six regions and the weighted means are shown in Table49A for kindergarten and 49B for the different regions of Illinois. They show, for example, thatchildren in our state sample had mastered, on average, 51.62 of the alphabet letters and were ableto correctly identify 8.78 of pictures based on matching initial consonants on the PhonemicAwareness snapshot.
Table 49A. Spring 2002 Kindergarten Norms-2001-2001 version
Measure Weighted MeanAlphabet Recognition 51.62Story Listening 16.51Phonemic Awareness 8.78One-to-One Matching 7.81Letter Sounds 20.95Developmental Spelling 15.47Word Recognition 9.41Passage Reading 3.52

79
Table 49B. Spring 2002 Regional Kindergarten Norms-2001-2001 version
REGIONSMeasure 1 2 3 4 5 6Alphabet Recognition 50.48 (6.43) 52.09 (2.78) 53.36 (2.20) 51.57 (4.94) 52.57 (2.31) 51.53 (4.22)Story Listening 15.61 (4.06) 17.22 (3.49) 16.91 (2.42) 17.00 (2.47) 16.21 (2.85) 16.29 (4.03)Phoneme Awareness 8.21(2.21) 9.26 (1.01) 9.15 (1.43) 8.70 (2.09) 8.99 (1.69) 8.96 (1.48)One-to-One Match 7.44 (2.04) 7.80 (1.75) 8.73 (0.73) 7.82 (2.18) 7.91 (1.65) 8.00 (1.98)Letter Sounds 18.73 (5.81) 22.03 (2.66) 22.97 (3.49) 20.91 (5.01) 23.08 (3.29) 21.56 (4.56)Develop. Spelling 13.69 (5.99) 16.29 (4.36) 16.96 (4.61) 15.70 (4.86) 16.85 (4.93) 15.89 (5.61)Word Recognition 7.76 (6.02) 10.23 (5.12) 1300 (5.89) 8.05 (4.73) 10.66 (6.18) 10.42 (5.46)Passage Reading 2.95 (3.19) 3.97 (3.00) 5.61 (2.97) 2.66 (2.39) 3.41 (3.25) 3.60 (3.17)Number 248 35 67 44 92 45
One of the complexities of establishing Target scores is that we are aiming at a shifting target.As shown in Table 50, students from Region 1 who were administered the ISEL in the spring of2001 achieve somewhat higher on most measures in 2002.
Table 50. Means and standard deviations for similar samples of kindergarten studentsfrom Region 1 in 2000-2001 and 2001-2002
MeasureRegion 1Spring 2001Mean (SD)
Region 1Spring 2002Mean (SD)
Alphabet Recognition 50.37 (6.43) 50.48 (6.43)Story Listening 15.04 (3.77) 15.61 (4.06)Phonemic Awareness 8.15(2.41) 8.21(2.21)One-to-One Matching 7.35 (2.24) 7.44 (2.04)Letter Sounds 17.90 (5.52) 18.73 (5.81)Developmental Spelling 13.03 (5.87) 13.69 (5.99)Word Recognition 8.06 (6.13) 7.76 (6.02)Passage Reading 2.94 (3.08) 2.95 (3.19)
The changes in mean score are slight for most snapshots, but greater for Story Listening andLetter-Sounds. Over the years, we anticipate an increase in Phonemic Awareness and One-to-One Matching. We believe that the Target scores should continue to be based on thedevelopmental goals articulated by clinicians rather than increase over time, based on normativeevidence. Schools that begin with lower scores should be provided with an attainable target.
A comparison of clinician-established Target scores with the empirically-based norms shows ahigh degree of consistency for most snapshots (see Table 51). The main departure is representedby Letter Sounds where clinicians expected children to have learned most consonant letter-sounds (a score of 16); yet most kindergarteners have actually learned an average of 21 letter-sounds. Finally, the norms suggest a Target for Story Listening. Our analysis of results revealed

80
that a score of 16 meant that children had answered all or most of the comprehension questionsbut only half to two-thirds of the vocabulary questions.
Whereas clinicians and teachers worry when children come to kindergarten with very limitedknowledge, they do not appear to have expectations about where children should be achievingwhen they enter kindergarten. Thus, we based the fall kindergarten targets on the averageachievement of children from across the state. Based on these considerations and this evidence,we established the Target scores shown in Table 51 for kindergarten children. It can be seen thatthe clinician targets and norm-based target are similar. We resolved any discrepancies byfollowing the developmentally based wisdom of clinicians or by taking an average of the twovalues.
Table 51. Target/50th percentile scores for kindergarten students in the State of Illinois-2001-02
MeasureKindergartenFall Target
KindergartenSpring Target
ClinicianSpring Target
Norm-BasedSpring Target
Alphabet Recognition 35 52 52 52Story Listening 14 17 -- 17Phonemic Awareness 6 9 9 9One-to-One Matching 4 8 8 8Letter Sounds 3 19 16 21Developmental Spelling 6 14 14 15Word Recognition 2 7 7 9Passage Reading 0 3 3 4
First Grade Target /50th Percentile Score
Reading Clinician. Similar to kindergarten, we asked the group of reading clinicians, “How wellmust a child perform at the end of first grade for you to be confident that he or she will continueto progress, given quality classroom instruction?” There was agreement in expectations: by theend of first grade, mastery was expected on those snapshots to have been mastered at the end ofkindergarten: Alphabet Recognition, Phonemic Awareness, and One-to-one Matching. Inaddition, clinicians expected most consonant, vowel, and consonant digraph Letter-Soundswould be learned at the end of first grade. They expected that this letter-sound knowledge willbe applied in Developmental Spelling and that children will spell some words in a standardfashion by the end of first grade. They expected that all first grade level sight words and someend-of-first/beginning-of-second grade sight words would be learned. Finally, they expected thatthe third passage from the spring of first grade (Level H) would be read smoothly. The clinicianswere confident that children who are able to do these things would continue to make goodprogress in second and third grade. These expectations translate into Target scores as follows:
Alphabet Recognition: masteryPhonemic Awareness: masteryOne-to-One Matching: mastery

81
Letter Sounds: 24 of 26 consonant and vowel letter-sound associationsDevelopmental Spelling: 24 of the 27 phonemes represented; some standard spellingsWord Recognition: 20 of 22 first grade words recognizedPassage Reading 9 of 12 indicating mastery of the spring first grade passage
Again there was less certainty about how well children should be achieving on the StoryListening Task (Vocabulary and Comprehension). They reiterated the importance of knowingword meanings and being able to comprehend simple stories, but were unable to confidentlystate a level of achievement necessary for future proficient reading comprehension. The researchcommunity lacks research evidence on this issue.
Regional Norms. We also sought to define normal progress by administering the ISEL-K/1 tomany first grade children from the six regions across the state during 2001-2002. The results foreach of the six regions and the weighted means are shown in Tables 52A and B for first grade.
Table 52A. Spring 2002 First Grade Norms
Measure Weighted MeanAlphabet Recognition 53.70Story Listening 17.80Phonemic Awareness 9.57One-to-One Word Match 8.90Letter Sounds 24.29Developmental Spelling 21.92Word Recognition 19.98Passage Reading 9.43
Table 52B. Spring 2002 Regional First Grade Norms
REGIONMeasure 1 2 3 4 5 6AlphabetRecognition
53.66 (0.68) 53.75 (0.63) 53.69 (0.84) 53.64 (0.95) 53.71 (0.78) 53.83 (0.38)
Listening 16.83 (3.05) 17.68 (2.74) 18.97 (2.39) 19.25 (2.98) 17.41 (2.29) 18.24 (2.14)PhonemicAwareness
9.48 (1.18) 9.49 (1.40) 9.81 (0.96) 9.55 (0.89) 9.55 (0.90) 9.78 (0.55)
Word match 8.85 (0.55) 8.92 (0.41) 9.00 (0.00) 8.87 (0.42) 8.90 (0.30) 9.00 (0.00)Letter Sounds 24.06 (2.46) 24.83 (1.72) 24.45 (2.83) 24.56 (2.31) 23.67 (1.49) 24.61 (1.68)Develop. Spelling 21.94 (4.08) 23.38 (2.65) 22.76 (3.46) 22.27 (2.95) 19.39 (3.39) 21.61 (2.74)Word recognition 19.83 (3.45) 20.20 (2.61) 20.88 (2.32) 19.72 (3.06) 18.76 (3.16) 20.98 (1.63)Passage Reading 9.38 (2.73) 9.70 (2.36) 10.22 (2.40) 9.61 (2.65) 7.90 (2.54) 10.00 (1.81)Number 237 71 58 64 51 46
Children at the end of first grade have mastered, on average, 24.29 items on the Letter-Soundsnapshot. The score of 9.43 on Passage Reading shows that children, on average, can fluentlyread a passage from the spring of first grade.

82
As we discussed previously, Target scores provide a shifting target. As shown in Table 53,students from Region 1 who were administered the ISEL in the spring of 2002 achieve slightlyhigher on many measures than in 2001 – particularly those appropriate for first grade. Over theyears, we anticipate that scores will increase. But we believe that the Target scores shouldcontinue to be based on developmental goals articulated by clinicians, rather than on normativeevidence.
Table 53. Means and standard deviations for similar samples of first grade students fromRegion 1 in the spring of 2001 and 2002
MeasureRegion 1
Spring 2001Mean (SD)
Region 1Spring 2002Mean (SD)
Alphabet Recognition 53.55 (0.90) 53.66 (0.68)Story Listening 17.45 (2.59) 16.83 (3.05)Phonemic Awareness 9.63 (1.01) 9.48 (1.18)One-to-One Matching 8.84 (0.53) 8.85 (0.55)Letter Sounds 23.28 (3.45) 24.06 (2.46)Developmental Spelling 21.75 (4.55) 21.94 (4.08)Word Recognition 19.76 (2.95) 19.83 (3.45)Passage Reading 9.15 (2.71) 9.38 (2.73)
The kindergarten end-of-year target scores are useful in establishing goals for where childrenshould be achieving at the beginning of first grade. Both the clinician targets and the norm-based targets provide evidence. Based on the evidence shown in Table 11, we established thefollowing as Target Scores for first grade children. We resolved the single discrepancy forDevelopmental Spelling by taking an average value of the two. The consistency of the estimatesconfirmed the choice of the 50th percentile score as our target score.
Table 54. Target scores for first grade students in the state of Illinois compared to clinicianestimates and 50th percentile scores
MeasureFirst GradeFall Target
First GradeSpring Target
ClinicianSpring Target
50th PercentileSpring Target
Alphabet Recognition 53 54 54 54Story Listening 17 18 18 18Phonemic Awareness 10 10 10 10One-to-One Matching 9 9 9 9Letter Sounds 20 24 24 24Developmental Spelling 15 23 24 22Word Recognition 11 20 20 20Passage Reading 3 9 9 9

83
Establishing Watch Scores/20th Percentile Scores
Watch Scores are useful in identifying children who need special support or closer observation.If a child scores at or below the Watch Score on a snapshot in the fall, teachers should monitorhis or her initial progress closely. For some, low initial performance may be due to lack ofexposure to literacy activities in a pre-school or home setting. Close observation may show thechild making steady and appropriate progress. For other children, scoring below the WatchScore may indicate a need for more detailed assessment, more intensive classroom instruction,and/or participation in an intervention program.
We established Watch Scores by determining the ISEL-K/1 score below which 20% of thechildren in the Illinois regional samples achieved. These are children whose knowledge ofliteracy falls considerably below the Target Scores – so much lower, that their progress should bewatched. In some schools where many children achieve near the Target Scores when they enterkindergarten and first grade, there may be few children who perform at or below the WatchScore levels. In contrast, in some school where many children enter school with little exposureto literacy activities, there may be many children who will be identified by the Watch Scores.Watch scores are particularly useful in the fall of the year to alert teachers concerning thechildren they need to “keep their eye on.” They may also be useful at the end of the year as amethod for identifying children for summer programs. Table 55 shows the Watch Scores forchildren at the beginning and end of kindergarten and first grade. These scores refer to a point ator below which twenty percent of the children in the state scored.
Table 55. Watch Scores for kindergarten and first grade students in the state of Illinois
MeasureTotal
#Items
KindergartenFall WatchScore
KindergartenSpring WatchScore
First GradeFall WatchScore
First GradeSpring WatchScore
Alphabet Recognition 54 14 50 51 53Story Listening 21 10 14 14 15Phonemic Awareness 10 3 7 7 9One-to-One Matching 9 1 7 7 9Letter Sounds 26 - 16 16 23Develop. Spelling 27 - 11 11 19Word Recognition 22 - 3 5 18Passage Reading 12 - 0 0 7
Beginning Kindergarten Watch Scores
For children entering kindergarten, knowing only 14 letter names out of the 54 tested alerts theteacher that a child may have had little exposure to print. Similarly, being able to select only 3of the Phonemic Awareness items out of 10 indicates a chance level of performance. Finally, ifthe child is able to make only one finger-point match on a simple sentence, this may indicate thatthe child has had little exposure to book and being read to. Finally, responding correctly to only10 of the comprehension and vocabulary items, when a story had been read aloud, may indicate

84
problems with comprehension and vocabulary or in the child’s ability to verbalize about a story.Obviously, if a child earns scores that are at or below the Watch Scores on three or four of thesesnapshots, the need for careful monitoring is particularly urgent and special instructional supportmay be required.
Beginning First Grade and End of Kindergarten Watch Scores
For children in the spring of kindergarten and the fall of first grade, the most useful snapshots arethe first six. It is particularly serious when a child scores at or below the Watch Score onPhonemic Awareness, Letter Sounds, and Developmental Spelling. All these Watch Scoresindicate the child is having difficulty mastering the code. If a child scores at or below the WatchScore in Story Listening, this may indicate problems in the area of language development --comprehension, and vocabulary. Word Recognition that is at or below the Watch Score may beanother indication of failure to master letters and words. Similarly, obtaining a score of “0” onPassage Reading may suggest little experience with book reading.
For children at the end of first grade, the Watch Scores for three of the first four snapshots(Alphabet Recognition, Phonemic Awareness, and One-to-One Matching) are not useful sincethey represent mastery or near mastery on these snapshots. By contrast, children should havemade major progress on the last four snapshots: Letter-Sounds, Developmental Spelling, WordRecognition, and Passage Reading. If children achieve at or below the Watch Score level,particularly on the last three, it may indicate that special support is needed during the summerfollowing first grade. Again, if a child scores at or below the Watch Score in Story Listening,this may indicate problems in the area of language development -- comprehension, andvocabulary. Other diagnostic testing in these areas may be warranted.
ISEL-K/1 Enhancements for Version 2- 2003-2004
In 2003-2004, snapshots for Vocabulary and Fluency were added to the ISEL-K/1 and thePassage Reading snapshot was rescored to include 20 items. The norming sample for these twosnapshots was composed of 633 kindergarteners and 655 first graders distributed according tothe original sample profile. Means, standard deviations, watch and target scores for thesesnapshots are included in the earlier individual subtest descriptions and in Appendix A.

85
REFERENCES
Adams, M. J. (1990). Beginning to read: Thinking and learning about print. Cambridge,MA: MIT Press.
Baker, L. & Brown, A. L. (1984). Metacognitive Skills and Reading. Technical Report N.188. U.S., Illinois.
Baker, S. K.,, D. C., & Kame’enui, E. J. (1995). Vocabulary acquisition: Synthesis ofthe research. Technical Report No. 13 produced for the National Center to Improve the Tools ofEducators, University of Oregon.
Barr, R., Blachowicz, C.L.Z. & Katz, C. & Kaufman, B. .(2001). Reading diagnosis forteachers: An instructional approach. 4th Edition. New York: Longman.
Bear, D.R. & Barone, D.M. (1998). Developing Literacy: An Intergrated Approach toAssessment and Instruction. Boston: Houghton Mifflin Co.
Biemiller, A. (2001). Teaching Vocabulary: Early, Direct, and Sequential. AmericanEducator, 25(1), 24-28, 47.
Biemiller, A. & Slonim, N. (2001). Estimating root word vocabulary growth innormative and advantaged populations: Evidence for a common sequence of vocabularyacquisition. Journal of Educational Psychology, 93(3), 498-520.
Blachowicz, C.L.Z., Moskal, M.K., Fisher, P., Massarelli, J., Obrochta, C. & Fogelberg,E. (In press). Everybody Reads”: Fluency as a Focus for Staff Development. In FluencyDevelopment, Edited by T. Rasinski. Newark:DE: International Reading Association.
Bodrova, E., Leong, C. & Semenov, M. (1998). McCrel Frequent Word List.http://www.mcrel.org/products/literacy/100words.html. (Retrieved December 11, 2001).
Bradley, L., & Bryant, P. E. (1983). Categorizing sounds and learning to read: A causalconnection. Nature, 301, 419-421.
Cazden, Courtney B. (1992). Revealing and Telling: The Socialization of Attention inLearning to Read and Write. Educational Psychology: An International Journal of ExperimentalEducational Psychology, 12(3-4) 305-13.
Clay, M.M. (1993). An Observation Survey of Early Literacy Achievement. Portsmouth,NH: Heinemann.
Cunningham, A. E. and Stanovich, K. E. (1997). Early reading acquisition and its relationto reading experience and ability 10 years later. Developmental Psychology, 33, 934-945.

86
Dale, E. & O'Rourke, J. P. (1976). The living word vocabulary. Chicago: FieldEnterprises.
Dickinson, D. K.. & Smith, M. W. (1994). Long-Term Effects of Preschool Teachers'Book Readings on Low-Income Children's Vocabulary and Story Comprehension.Reading Research Quarterly, 29(2), 104-22.
Dunn, L.M. & Dunn, L.M. (1997). Peabody Picture Vocabulary Test- Revised.Circle Pines, MN: American Guidance Service.
Durkin, D.D. (1978-79). What classroom observations reveal about readingcomprehension instruction. Reading Research Quarterly, 14, 481-533.
Dyson, A.H. & Genishi. C. (1994). The need for story: Cultural diversity in classroomand community. Urbana, Il: NCTE.
Ehri, L. (1998). Grapheme-phoneme knowledge essential for learning to read words inEnglish. In J. Metsala & L. Ehri (Eds.). Word recognition in beginning literacy (pp. 3-40).Mahwah, NJ: Erlbaum.
Ehri, L.C. (1980). The development of orthographic images. In U. Frith (Ed.), Cognitiveprocesses in spelling. London: Academic Press.
Eller, .G., Pappas, C. C & Brown, E. (1988). The lexical development of kindergartners:Learning from written context. Journal of Reading Behavior, 20, 5-24.
Elley, W. B. (1988). Vocabulary acquisition from listening to stories. ReadingResearch Quarterly, 24 , 174-87.
Feifel, H. & Lorge, I. (1950). Qualitative differences in the vocabulary responses ofchildren. Journal of Educational Psychology, 41, 1-18.
Fountas, I. & Pinnell, G.S. (1999). Matching books to readers: using leveled books inguided reading, K-3. Portsmouth, NH: Heinemann.
Henderson, E.H. (1985). Teaching spelling. Boston: Houghton Mifflin.
Harris, A.J. & Jacobson, M.D. (1982). Basic reading vocabularies. New York:Macmillan.
Hasbrouck, J.E. & Tindal, G. (1992). Curriculum-based oral reading fluency norms forstudents in grades 2 through 5. Teaching Exceptional Children, 24, 41-44.

87
Hoover, H.D., Dunbar, S.J. & Frisbie, D.A., (2001). Iowa Test of Basic Skills. Itasca,IL.: Riverside Publishing.
Invernizzi,M.M, (2000). PALS Early Screening Inventory. Charlotte, Va.: University ofVirginia
Johns, J.J. (1999). Basic reading inventory (7th ed.). Dubuque, IA: Kendall/Hunt.Johns, J.J. (1999). Basic reading inventory (7th ed.). Dubuque, IA: Kendall/Hunt.
Johns, J.J. & Berglund, R. (2002). Fluency: Questions, Answers, Evidence-BasedStrategies. Dubuque, IA: Kendall/Hunt
Juel, C. (1988). Learning to read and write: A longitudinal study of 54 children from firstthrough fourth grades. Journal of Educational Psychology, 80, 437-447.
Juel, C. & Minden-Cupp, C. (1999). Learning to read words: Linguistic units andstrategies. Ann Arbor, MI: Center for the Improvement of Early Reading Achievement.
Kame’enui, E. (2002). An analysis of reading assessment instruments for K-3.University of Oregon: IDEA.
Kamil, M.L., Mosenthal, P.B., Pearson, P.D. & Barr, R. (Eds.), (2000). Handbook ofReading Research, Volume III. Mahwah, NJ: Lawrence Erlbaum Associates.
Kraus, R. (1945; 2000). The carrot seed. New York: Scholastic.
Kuhn, M. & Stahl, S. ( 2003). Fluency: A review of developmental andremedial practices. Journal of Educational Psychology, v95, n1, 3-21.
Lundberg, I., Frost, J., & Petersen. O. (1988). Effects of an extensive program forstimulating phonological awareness in preschool children. Reading Research Quarterly, 23, 263-284.
MacGinitie, W.H. & MacGinitie, R.K. (1989). Gates-MacGinitie Reading Tests, 3rdEdition. Chicago: The Riverside Publishing Co.
Marzano, R.J, Pickering, D. & McTighe, J. (1993). Assessing student outcomes :performance assessment using the dimensions of learning model. Alexandria, Va. : Associationfor Supervision and Curriculum Development.
McKeown, B. & Thomas, D. (1988): Q Methodology. Newbury Park: Sage Publication
Morris, D. (1998). Assessing printed word knowledge in beginning readers" The EarlyReading Screening Instrument (ERSI). Illinois Reading Council Journal, 26(2), 30-51.

88
Morris, D. (1999). The Howard Street tutoring manual: teaching at-risk readers in theprimary grade. New York: Guilford Press.
Morris, D. & Perney, J. (1984). Developmental spelling as a predictor of first-gradereading achievement. Elementary School Journal, 84, 441-457.
Muter, V., & Snowling, M. (1998). Concurrent and longitudinal predictors of reading:The role of metalinguistic and short-term memory skills. Reading Research Quarterly, 33, 320-337.
Muter, V., Hulme, C., Snowling, M., & Taylor, S. (1997). Segmentation, not rhyming,predicts early progress in learning to read. Journal of Experimental Child Psychology, 65, 370-396.
National Reading Panel (2000). Report of the National Reading Panel: Reports of thesubgroups. Washington, DC: National Institute of Child Health and Human DevelopmentClearinghouse.
Rasinski, T.V. & Padak, N.D. (1998). How Elementary Students Referred forCompensatory Reading Instruction Perform on School Based Measures of Word Recognition,Fluency, and Comprehension. Reading Psychology, 19, 185-216.
Rosenblatt , L. (1935; 1979) The Reader, the Text, The Poem. Carbondale, Il.: SIUPress.
Samuels, S. J. (1979). The method of repeated reading. The Reading Teacher,
Schwanenflugel, P. J. & Akin, C. (1994). Developmental Trends in Lexical Decisionsfor Abstract and Concrete Words. Reading Research Quarterly. 29(3), 250-64
Shinn, M.R. (1989). Curriculum-based measurement: Assessing special children. NewYork: Guilford Press.
Snow, C.E. (1991). Unfulfilled expectations : home and school influenceson literacy. Cambridge, MA: Harvard University Press.
Snow, C. E., Burns, M. S., & Griffin, P. (1998). Preventing reading difficulties in youngchildren. Washington, D.C.: National Academy Press.
Strecker, S. K., Roser, N. L., & Martinez, M. G. (1998). Toward
understanding oral reading fluency. In Forty-seventh yearbook of the National Reading
Conference, Chicago, IL.
Tompkins, G. (2001). Literacy for the 21st Century: A Balanced Approach.Columbus:Merrill-Prentice Hall.

89
ISEL References
Barr, R. , Blachowicz, C.L.Z., Pigott, T., Buhle, R., &Chaney, J,. Ivy, C. & Uchtman, A, .(2004). Illinois Snapshots of Early Literacy-K/1:Technical Manual. Springfield, IL:IllinoisState Board of Education. Retrieved from http://www.isbe.net/curriculum/isel/ISEL.html onJanuary 1, 2004.
Barr, R. , Chaney, J. , Buhle, R., Blachowicz, C.L.Z., Ivy, C. & Suarez-Silva, G. . (2004). IllinoisSnapshots of Early Literacy-K/1:Teacher’s Guide. Springfield, IL:Illinois State Board ofEducation. Retrieved from http://www.isbe.net/curriculum/isel/ISEL.html on January 1, 2004.
Barr, R. , Buhle, R., Blachowicz, C.L.Z , Chaney, J., Ivy, C. & Suarez-Silva, G. . (2004). IllinoisSnapshots of Early Literacy-K/1:Administration Booklet and Student Scoresheet. Springfield,IL:Illinois State Board of Education. Retrieved fromhttp://www.isbe.net/curriculum/isel/ISEL.html on January 1, 2004.
Barr, R. , Buhle, R., Blachowicz, C.L.Z , Chaney, J., Ivy, C. & Suarez-Silva, G. . (2004). IllinoisSnapshots of Early Literacy-S-:Administration Booklet and Student Scoresheet. Springfield,IL:Illinois State Board of Education. Retrieved fromhttp://www.isbe.net/curriculum/isel/ISEL.html on January 1, 2004.
Barr, R. , Sullivan, D., Blachowicz, C.L.Z., Pigott, T, Buhle, R., Dunn, M.,.. & Uchtman, A, .(2004). Illinois Snapshots of Early Literacy-2:Technical Manual. Springfield, IL:Illinois StateBoard of Education. Retrieved from http://www.isbe.net/curriculum/isel/ISEL.html on January1, 2004.
Barr, R. , Sullivan, D., Buhle, R., Blachowicz, C.L.Z., & Chaney, J. (2004). Illinois Snapshotsof Early Literacy-2:Teacher’s Guide. Springfield, IL:Illinois State Board of Education. Retrieved from http://www.isbe.net/curriculum/isel/ISEL.html on January 1, 2004.
Barr, R. , Sullivan, D., Buhle, R., & Blachowicz, C.L.Z. . (2004). Illinois Snapshots of EarlyLiteracy-2:Administration Booklet and Student Scoresheet. Springfield, IL:Illinois State Boardof Education. Retrieved from http://www.isbe.net/curriculum/isel/ISEL.html on January 1, 2004

90
Appendix A
Version 1- 50th Percentile (Target) and 20th Percentile (Watch) Scores

91
Version 1- 50th Percentile (Target) and 20th Percentile (Watch) Scores for Kindergarten
Snapshot (Number ofItems)
Kindergarten Kindergarten
1. Alphabet Recognition (54)
2. Story Listening (21)
3. Phonemic Awareness (10)
4. One-to-One Matching (9)
5. Letter Sounds (26)
6. Develop. Spelling (27)
7. Word Recognition (22)
8. Passage Reading (12)
Fall 50th
35
14
6
4
9
6
2
0
Fall 20th
15
11
3
1
-
-
-
-
Spring 50th
52
15
9
8
19
14
7
3
Spring 20th
50
13
8
6
14
10
2
0

92
Version 1- 50th Percentile (Target) and 20th Percentile (Watch) Scores for First GradeSnapshot (Number of Items) First Grade First Grade
1. Alphabet Recognition (54)
2. Story Listening (21)
3. Phonemic Awareness (10)
4. One-to-One Matching (9)
5. Letter Sounds (26)
6. Develop. Spelling (27)
7. Word Recognition (22)
8. Passage Reading (12)
Fall 50th
53
17
10
9
20
15
11
3
Fall 20th
51
14
9
7
16
11
5
0
Spring 50th
54
18
10
9
25
23
21
10
Spring 20th
53
15
9
8
21
19
18
7

93
Appendix B
Version 2- 50th Percentile (Target) and 20th Percentile (Watch) Scores

94
Version 2- 50th Percentile (Target) and 20th Percentile (Watch) Scores for Kindergarten
Snapshot (Number of Items) Kindergarten Kindergarten
1. Alphabet Recognition (54)
2. Story Listening (21)
3. Phonemic Awareness (10)
4. One-to-One Matching (9)
5. Letter Sounds (26)
6. Develop. Spelling (27)
7. Word Recognition (22)
8. Vocabulary (14)
9. Passage Reading (20)
10. Fluency
Fall 50th
35
14
6
4
9
6
2
5
0
-
Fall 20th
15
11
3
1
-
-
-
2
-
-
Spring 50th
52
15
9
8
19
14
7
9
5
-
Spring 20th
50
13
8
6
14
10
2
6
0
-

95
Version 2- 50th Percentile (Target) and 20th Percentile (Watch) Scores for First GradeSnapshot (Number of Items) First Grade First Grade
1. Alphabet Recognition (54)
2. Story Listening (21)
3. Phonemic Awareness (10)
4. One-to-One Matching (9)
5. Letter Sounds (26)
6. Develop. Spelling (27)
7. Word Recognition (22)
8. Vocabulary (14)
9. Passage Reading (20)
10. Fluency
Fall 50th
53
17
10
9
20
15
11
9
3
-
Fall 20th
51
14
9
7
16
11
5
5
0
-
Spring 50th
54
18
10
9
25
23
21
10
16
64 cwpm
Spring 20th
53
15
9
8
21
19
18
8
13
37 cwpm

96
Appendix C
Illinois Snapshots of Early Literacy
Researchers, Advisors and Consultants

97
ISEL Research and DevelopmentTeam/Project StaffRebecca Barr, Ph.D.Camille Blachowicz, Ph.D.Roberta Buhle, Ed.D.Jeanne Chaney, Ed.D.Rian Davis, MATMichael Dunn, Ph.D.Carol Ivy, Ed.DTherese Pigott, Ph.D.Guadalupe Suarez-Silva, M.Ed.Diane Sullivan, M.Ed.Andrea Uchtman, MAT
ISEL University AdvisorsRosalinda Barrerra, Ph.D.University of Illinois
Roberta Berglund, Ph.DNorthern Illinois University
Andrew Biemiller, Ph.D.Ontario Institute for Educational Studies
Thomas Crumpler, Ph.D.Susan Davis Lenski, Ph.D.Illinois State University
Louis Ferroli, Ph.D.Rockford College
Georgia Garcia, Ph.D.University of Illinois
William Henk, Ph.D.Marla Mallette, Ph.D.Stephanie McAndrews, Ph.D.Southern Illinois University
Darrell Morris, Ph.D.Appalachian State University
Rae Moses, Ph.D.Northwestern University
Michael Pressley, Ph.D.Michigan State University
Kathryn RansomUniversity of Illinois-Springfield
Dorothy Strickland Ph.D.Rutgers University
Karen Wixson, Ph.D.University of Michigan

98
ISEL School Advisory BoardCathy ByrneCentral Community School District 301-Burlington
Wendy De SentLiz GorrMarcia PittsRosy VargasGriselda WhippleChicago Public Schools - District 299
Nancy LanyCicero School District 99
Sandy BrunsDowners Grove
Julie LevineLisa SanchezLinda SchustermanEvanston/Skokie District 65
Linda ZakarianEducator in Residence, ISBE
Carmen AraujoDolores DrachmanBeth HoferitzaJudy RauschenbergAnn SwiesDiane WilkeyMannheim School District 83
Michael Heggerty, Ed.D.Woodridge School District 68
ISEL-S Advisory BoardRaj BaluWanda ColonKathy DavyJanice DiVincenzoMargo GottliebMary HausnerNancy LaneyMary PenichJanet RingGuy SchumacherGail SesslerNilda SotoLaura TapiaGriselda WhippleCheryl Wolfel
Pilot SchoolsCopernicus Elementary – ChicagoHawthorne Scholastic Academy – ChicagoKingsley Elementary – Downers GroveScott School – Melrose ParkSprague Elementary- LincolnshireWalker Elementary – EvanstonWashington Elem. – ChicagoWestdale – NorthlakeZapata Academy – Chicago

99
ISEL Field Researchers-EnglishAnn BatesDalia BenzJesse BlachowiczMeg BolandMarcia CaulkinsWilma ColemanJean EhlertKit HarperDeborah HaysBetty JohnsonSusan JonesBarbara KaufmanElsie McAvoyMarilee MercerIna MeyerLisa PozziDee RoubekasMaggie WalshLinda Zakarian
ISEL Field Researchers-SpanishEllen BruglieraGloria GuevaraCheryl HaackJanice MareshRosa PartildaNereida Valez
ISEL-S School ContactsKathy Davy - Des Plaines C.C. S.D. 62Liz Lara – North Shore S.D. 112Diane Wilkey – Mannheim S.D. 83Cheryl Wolfel – Palatine C.C. S.D. 15
Also thanks to the many other teachers, students and principals who welcomed us into
their schools and aided us in the construction, field testing, refining and norming of the
ISEL.

100
Appendix D
List of Tables

101
Table 1. Snapshots Recommended for Abbreviated ISEL-K/1 Administration
Table 2. Proportion of kindergarten and first grade children at the beginning of the school yearwho correctly identify the upper and lower case letters
Table 3. Means, standard deviations, and percent correct on the Alphabet Recognition Snapshotfor children in the fall and spring of kindergarten and first grade
Table 4. Predictive Validity- Correlation coefficients showing the relation between AlphabetRecognition measured in the fall to other areas of early literacy measured in the spring forkindergarten and first grade
Table 5. Fall and spring reliability coefficients (Cronbach alpha) for kindergarten and first gradesamples on Alphabet Recognition
Table 6. Ranked difficulty ratings of words using The Living Word Vocabulary (LWV) andHarris-Jacobson Basic Elementary Reading Vocabularies (HJ)
Table 7. Means, standard deviations, and percent correct on the Story Listening Snapshot forchildren in the fall and spring of kindergarten and first grade
Table 8. Predictive validity- Correlation coefficients showing the relation between StoryListening measured in the fall to other areas of early literacy measured in the spring forkindergarten and first grade
Table 9. Fall and spring reliability coefficients (Cronbach alpha) for kindergarten samples onStory Listening
Table 10. Means, standard deviations, and reliability coefficients (split half)on four PhonemicAwareness snapshots for kindergarten and first grade children combined in the fall of 2000.
Table 11. Correlation coefficients between four Phonemic Awareness Snapshots administered inthe fall of kindergarten and first grade with four reading measures assessed (spring 2000)
Table 12. Means, standard deviations, and Percent correct on the Phonemic AwarenessSnapshot for children in the fall and spring of kindergarten and first grade
Table 13. Predictive Validity- Correlation coefficients showing the relation between PhonemicAwareness measured in the fall to other areas of early literacy measured in the spring forkindergarten and first grade
Table 14a. Fall and spring reliability coefficients (Cronbach alpha) for kindergarten samples onPhonemic Awareness
Table 14b. Fall and spring reliability coefficients (Cronbach alpha) for first grade samples onPhonemic Awareness

102
Table 15. Means, standard deviations, and percent correct on the One-to-One MatchingSnapshot for children in the fall and spring of kindergarten and first grade
Table 16. Correlation coefficients showing the relation between One-to-One Matching measuredin the fall to other areas of early literacy measured in the spring for kindergarten and first grade
Table 17. Fall and spring reliability coefficients (Cronbach alpha) for kindergarten and firstgrade samples on One-to-One Matching
Table 18. Proportion of kindergarten and first grade children at the beginning of the school yearwho correctly identify the letter-sound associations
Table 19. Means, standard deviations, and percent correct on the Letter Sound snapshot forchildren in the fall and spring of kindergarten and first grade
Table 20. Predictive Validity- Correlation coefficients showing the relation between LetterSounds measured in the fall to other areas of early literacy measured in the spring forkindergarten and first grade
Table 21. First grade predictive and concurrent validity coefficients between ISEL-K/1 LetterSounds and the Gates MacGinitie Reading Test (G-M)
Table 22. Fall and spring reliability coefficients (Cronbach alpha) for kindergarten samples onLetter Sounds
Table 23. The percent of correct phonemes represented for each spelling word by kindergartenand first grade students in the fall of 2000 (n=449), the total number of correct phonemesrepresented, and correlations between total word scores and the total spelling score
Table 24. Correlation coefficients between Developmental Spelling and Phonemic Awareness,Word Recognition, and Passage Reading for kindergarten and first grade using simple andsequential scoring methods
Table 25. Means, standard deviations, and percent correct on the Developmental SpellingSnapshot for children in the fall and spring of kindergarten and first grade
Table 26. Predictive Validity- Correlation coefficients showing the relation betweenDevelopmental Spelling measured in the fall and other areas of literacy measured in the springfor kindergarten and first grade
Table 27. Fall and spring reliability coefficients (Cronbach alpha) for kindergarten samples onDevelopmental Spelling (6 item snapshot)-Version 1
Table 28. The percentage of words correctly recognized by kindergarten (n=230) and first gradechildren (n=221) in the fall. Correlations of each word with total score ranged from .6026-.8379

103
Table 29. Means, standard deviations, and percent correct on the Word Recognition Snapshotfor children in the fall and spring of kindergarten and first grade
Table 30. Predictive Validity- Correlation coefficients showing the relation between WordRecognition measured in the fall to other areas of early literacy measured in the spring forkindergarten and first grade
Table 31. Predictive and concurrent validity coefficients between ISEL Word Recognition andthe Iowa Test of Basic Skills (ITBS) and the Gates MacGinitie Reading Test (G-M) for firstgrade
Table 32. Fall and spring reliability coefficients (Cronbach alpha) for kindergarten and firstgrade samples on Word Recognition-Version 1
Table 33. Means, standard deviations, and percent correct on the Graded Passage ReadingSnapshot for children in the fall and spring of kindergarten and first grade
Table 34. Predictive Validity- Correlation coefficients showing the relation between PassageReading measured in the fall and Passage Reading measured in the spring for kindergarten andfirst grade
Table 35. First grade predictive and concurrent validity coefficients between ISEL-K/1 PassageReading and the Iowa Test of Basic Skills and the Gates MacGinitie Reading Test
Table 36. Fall and spring regional reliability coefficients (Cronbach alpha) for kindergarten andfirst grade samples on Passage Reading
Table 37. Regional Spring reliability coefficients (Cronbach alpha) for kindergarten samples onDevelopmental Spelling (6 item snapshot) Version 2
Table 38 Spring reliability coefficients (Cronbach alpha) for kindergarten and first gradesamples on Word Recognition-Version 2
Table 39. The percentage of words correctly recognized by kindergarten (n=227) and first gradechildren (n=181) in the fall of 2002
Table 40. Means, standard deviations, and percent correct on the Vocabulary Snapshot forchildren in the fall and spring of kindergarten and first grade 2003-2004
Table 41. Fall and spring reliability coefficients (Cronbach alpha) for kindergarten and firstgrade samples on Vocabulary
Table 42. Spring reliability coefficients (Cronbach alpha) for kindergarten and first gradesamples on Passage Reading with comprehension, Version 2
Table 43. Difficulty of Fluency Snapshot

104
Table 44A. The standardization sample for the ISEL-K/1 in terms of Race/Ethnicity and FreeLunch Demographics (based on 2002 Illinois State Board of Education data)
Table 44B. Distribution of sample by grade and gender
Table 44C. Distribution of sample by geographic area
Table 45A. Average percent correct on the eight ISEL-K-1 assessments by kindergarteners andfirst graders in the fall and spring, Version 1
Table 45B. Average percent correct on the ten ISEL-K/1 assessments by kindergarteners andfirst graders in the spring. Version 2-alternate snapshot
Table 46A. Average fall and spring reliability coefficients (Cronbach alpha except for Fluencywhich is test-retest) for kindergarten and first grade samples on the ISEL-K/1 snapshots
Table 46B. Alternate Form Reliability- ISEL-K/1 Version 2 Forms A and B - Grade 1N= 449
Table 46C. Test-Re-test Reliability - ISEL-K/1 Version 1 –Kindergarteners tested in May with8 day retest interval. N= 64
Table 47. Average fall and spring means and standard deviations (SD) for kindergarten andfirst grade samples- 2001-2002 except where noted by *
Table 48A. Concurrent Validity- ISEL-K/1 and Gates MacGinitie Reading Test (G-M)(MacGinitie & MacGinitie,1989) for the Suggested Grade 1 Spring Subtests N= 234
Table 48B. Concurrent Validity- ISEL-K/1 and Iowa Test of Basic Skills (ITBS) Harcourt forthe Suggested Grade 1 Spring Subtests N= 144
Table 49A. Spring 2002 Kindergarten Norms-2001-2001 version
Table 49B. Spring 2002 Regional Kindergarten Norms-2001-2001 version
Table 50. Means and standard deviations for similar samples of kindergarten students fromRegion 1 in 2000-2001 and 2001-2002
Table 51. Target/50th percentile scores for kindergarten students in the State of Illinois-2001-02
Table 52. Spring 2002 First Grade Norms
Table 53. Means and standard deviations for similar samples of first grade students from Region1 in the spring of 2001 and 2002

105
Table 54. Target scores for first grade students in the state of Illinois compared to clinicianestimates and 50th percentile scores
Table 55. Watch Scores for kindergarten and first grade students in the state of Illinois.