isd chapter 6
TRANSCRIPT

1
CHAPTER 6: PLANETARY BOUNDARIES
I. Planetary Boundaries
The previous chapters have covered the key questions of modern economic growth: how it began; how
it has diffused across time and place; how a “checklist” of factors can help to account for the differences
in economic growth across countries; and how countries still trapped in poverty can spring free of the
poverty trap. Economic growth is complicated, but sustainable development is even more complicated.
To achieve sustainable development, countries need to achieve three goals simultaneously: economic
growth, broad-based social inclusion, and environmental sustainability. While many countries have
“solved” the growth puzzles, few have succeeded in achieving all three aspects of sustainable
development.
Indeed, we can go further. Since many of the environmental challenges – such as climate change, ocean
acidification, and the extinction of species – are global-scale crises, and since all countries are feeling the
effects of these crises, we can say that no country is actually on a path of sustainable development.
Even when individual countries are making maximal efforts on their own part, they are still vulnerable to
a world economy that has failed to take adequate actions to head off environmental calamities.
The problems are getting harder, not easier. The main problem is one of scale. The world economy has
become very large relative to the finite planetary resources. Humanity is pushing against the limits of
the environment. In the words of world-leading ecologists, humanity is exceeding the “planetary
boundaries” in several critical areas.
Let’s review the global circumstances very briefly. Back in 1798, Thomas Robert Malthus wrote the
seminal work An Essay on the Principle of Population, warning humanity that population pressures
would tend to undermine improvements in living standards. If humanity were able to raise its living
standards, wrote Malthus, then the population would expand accordingly, until the rise of population
would put strains on the food supply and thereby reverse the gain in living standards. Malthus’s vision
was decidedly pessimistic about sustainable development!
We now know that Malthus was too quick to assume that population pressures would automatically
reverse the gains of economic development. Certainly Malthus could have had no idea about the
dynamism of science-based technological advances that would occur after his essay. Certainly he could
not foresee the Green Revolution in particular, which would dramatically expand the capacity to grow
more food to feed a larger global population. Nor could Malthus have foreseen the demographic
transition, by which richer households would choose to have fewer children, so much so that
populations are already stabilizing or even declining in some of the world’s richest places.
Yet Malthus had many things right. When he wrote, the world’s population was around 1 billion people.
It has since risen more than 7 times. Population has indeed increased sharply alongside the long-term
2
rise of productivity. And there is more to come: perhaps up to 10.9 billion people by 2100 (according to
the “medium” fertility variant of the UN Population Division).
To gauge the scope of human impact on the environment – the pressures that humanity is putting on
the earth’s ecosystems – we need to combine the sheer numbers of people with the increased resource
use per person. For that, we can look at rough estimates of the world output per person. In 1800, the
Gross World Product per capita was around $330 USD in 2013 prices. Now it is around $12,600 per
capita. That means that per capita income has increased by around 38 times.
Since total world output (GWP) is the product of Population and GWP/Population, we find that the total
world product has increased by around 275 times, roughly from $330 billion for the entire world in 1800
to around $91 trillion. Of course these are very rough estimates, but they do give us a sense of order of
magnitude of the increase of global production. Alas, that production has also translated into an
increase in the adverse human impact on the physical environment.
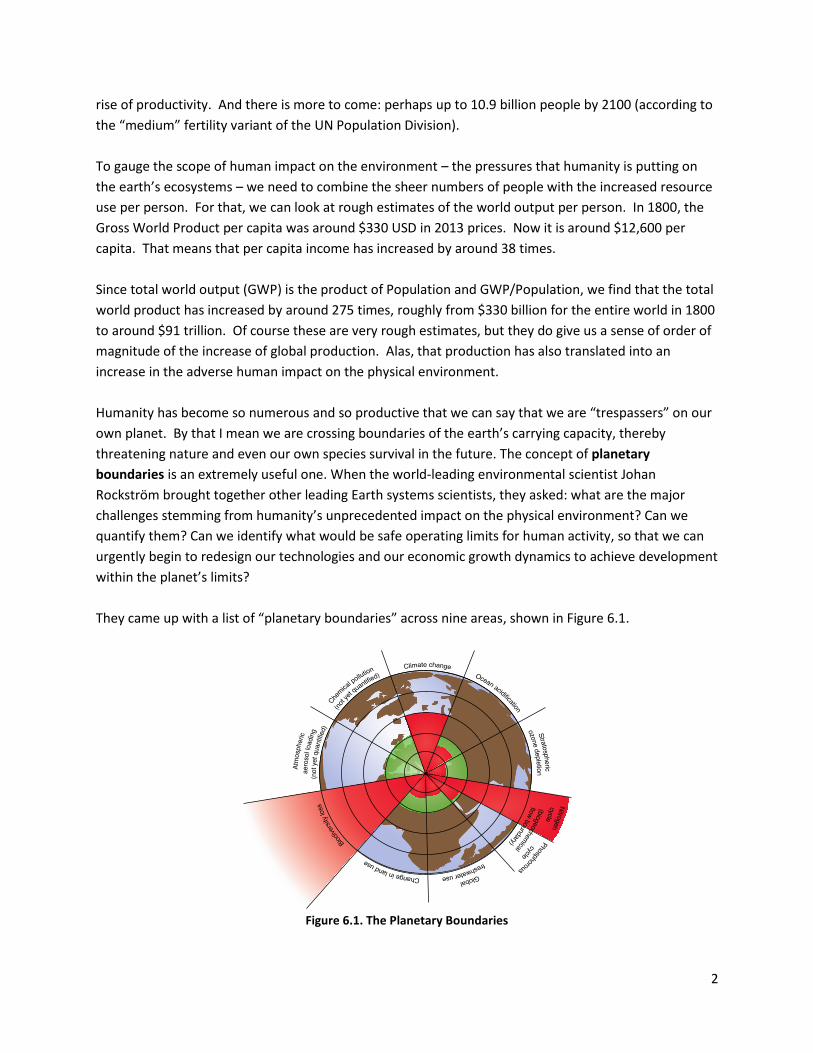
Humanity has become so numerous and so productive that we can say that we are “trespassers” on our
own planet. By that I mean we are crossing boundaries of the earth’s carrying capacity, thereby
threatening nature and even our own species survival in the future. The concept of planetary
boundaries is an extremely useful one. When the world-leading environmental scientist Johan
Rockström brought together other leading Earth systems scientists, they asked: what are the major
challenges stemming from humanity’s unprecedented impact on the physical environment? Can we
quantify them? Can we identify what would be safe operating limits for human activity, so that we can
urgently begin to redesign our technologies and our economic growth dynamics to achieve development
within the planet’s limits?
They came up with a list of “planetary boundaries” across nine areas, shown in Figure 6.1.
Figure 6.1. The Planetary Boundaries
3
The first and most important of the planetary boundaries relates to human-induced climate change. We
will study human-induced climate change in detail in a later lecture. For now we should note that
human-induced climate change is the result of the rising levels of greenhouse gases (GHGs) in the
atmosphere. The GHGs include carbon dioxide, methane, nitrous oxide, and a few other industrial
chemicals. These GHGs have a shared property: they warm the planet. The greater the concentration of
GHGs in the atmosphere, the warmer on average is the planet Earth. Because of industrial activity, the
GHG concentrations have risen dramatically in the past century, and the earth has already warmed by
around 0.9 degrees C (centigrade) compared with the temperatures before the Industrial Revolution.
On current trends, the Earth will warm by several degrees C by the end of the 21st century.
Greenhouse gases allow the incoming solar radiation, in the form of ultraviolet radiation, to pass
through the atmosphere to Earth, thereby warming the planet. The earth, in turn, re-radiates that heat
as infrared radiation. The earth warms to the point that the incoming (ultraviolet) radiation is exactly
balanced by the outgoing infrared radiation. The GHGs, however, trap some of that outgoing infrared
radiation, thereby making the earth warmer than it would be without an atmosphere. (With the GHGs
in the atmosphere, the earth would be like the moon, considerably colder.) So far, so good. The
problem is that with rising concentrations of the GHGs, the earth is becoming warmer than it was before
industrialization began. And those rising temperatures are pushing the planet to a new climate, one
that is different from the climate that has supported human life during the entire period of civilization.
This change of climate is deeply threatening (as we will note more later). It threatens the global food
supply; it threatens the survival of other species; it threatens to cause much more intense storms; and it
threatens a significant rise in the ocean level, which could disrupt life in many parts of the world.
The most important of the greenhouse gases is carbon dioxide. The main source of human-induced CO2
comes from burning coal, oil, and gas. (The other major source we will study is land-use change, such as
deforestation.) The release of energy in the fossil fuels results from the combustion of carbon in these
energy sources. The carbon atoms combine with oxygen to release energy plus CO2. In this way, CO2 is
the inevitable byproduct of burning fossil fuels. Fossil fuels have created the modern economy.
Without them, the world would be poor, as it was for the millennia until the Industrial Revolution. Yet
now the CO2 emissions from fossil fuels pose an unprecedented threat. We need to find news ways to
produce and use energy, so that we can enjoy the benefits of the modern economy without the dire
threats of human-induced climate change.
The second of the planetary boundaries, ocean acidification, is closely related to the first. The oceans
are becoming more acidic as the atmospheric concentrations of CO2 increase. The carbon dioxide in the
atmosphere dissolves in the ocean, producing carbonic acid (H2CO3). Carbonic acid dissociates to an H+
ion and a HCO3- ion (bicarbonate). The rise of H+ signifies the increased acidity of the oceans. This rising
acidity threatens various kinds of marine life, including corals, shellfish, lobsters and very small plankton,
by making it hard for these species to form their protective shells.
The pH of the ocean has already decreased by 0.1 unit on the pH scale, which runs from 0 (most acidic)
to 14 (least acidic). A change of 0.1 in the pH of the oceans might not seem like all that much, but the

4
scale is logarithmic, so a decline of .1 signifies an increase of protons in the ocean of 10 to the power
0.1, or about .26 (= 100.1), a 26% increase of acidity in the oceans, with a lot more acidification to come
as the atmospheric concentration of CO2 continues to rise. The map of the ocean in Figure 6.2 shows
that the changes in the pH scale are already being noticed in different parts of the world. The oceans are
not uniformly becoming more acidic; the local effects depend on ocean dynamics and on regional
economic activities. Yet the pH map in Figure 6.2 shows that we are already on a trajectory of
dangerously rising ocean acidity.
Figure 6.2. Ocean pH Changes
The third planetary boundary is ozone depletion. Brilliant atmospheric scientists in the late 1970s
discovered that particular industrial chemicals called chlorofluorocarbons (CFCs), which were used
mainly for refrigeration and aerosols at the time, tended to rise into the upper atmosphere and
dissociate (that is, split up into smaller molecules). The chlorine in the CFCs, when dissociated from the
rest of the molecule, attacked the ozone (O3) in the upper atmosphere (the stratosphere). By chance, a
new NASA satellite was in place to take pictures from space of the ozone layer, and shockingly, the
pictures (shown in Figure 6.3) in the mid-1980s demonstrated a huge ozone hole (site of ozone
depletion) over the South Pole.

5
Figure 6.3. NASA Satellite Image of Ozone Layer (1985)
This was a dramatic discovery. The ozone level in the upper atmosphere protects human beings from
receiving too much ultraviolet radiation from the sun. Ozone depletion was suddenly a newly
recognized, very dire threat to human survival. The real fear was that skin cancers and other disorders
would soar as the ozone level faced depletion.
Fortunately, because of great science and technology, humanity was spared the worst. The public was
informed in the nick of time that industrial chemicals that were thought to be harmless were in fact a
grave threat to public health. The CFCs needed to be eliminated before they caused a catastrophe. The
good news is that the world has acted on this one, introducing a new treaty to phase out CFCs from the
industrial systems, and to replace the CFCs with safer chemicals. This is now occurring step by step.
Without the scientific discoveries, technological insights, and global agreements, ozone depletion would
be a grave threat to humanity. Yet we are not yet fully past the threat: we still need to ensure the full
elimination of the CFCs and to ensure that the replacement chemicals are indeed fully safe.
The next planetary boundary shown in Figure 6.1 (moving clockwise around the circle) is pollution
caused by excessive flows of nitrogen and phosphorous, especially as the result of the heavy use of
chemical fertilizers by the world’s farmers. Here too, something of profound benefit for humanity –
chemical fertilizers – turns out to have a hidden and serious danger. Farmers must put nitrogen,
phosphorus, and other nutrients into the farm soils in order to ensure decent yields on their crops.
Without fertilizers, yields would still be around 500kg to 1 ton per hectare, rather than the 3-5 tons or
more that farmers can achieve on their grain production. Without chemical fertilizers, it would not be

6
possible to feed 7.2 billion people on the planet. It has been estimated that perhaps 4 billion people
today are fed as a result of chemical fertilizers.
The problem is that much of the nitrogen and phosphorous is not taken up by the crops. Much of it
actually returns to the air and is carried downwind to other locations. Much of it enters the
groundwater and rivers, with heavy concentrations of nitrogen and phosphorous reaching the estuaries
where rivers meet the oceans. In turn, the heavy influx of nitrogen and phosphorous leads to dangerous
ecological changes in the estuaries. The nutrients give rise to “algal blooms,” which are massive
increases in algae in the estuaries that grow as a result of the high availability of the nitrogen and
phosphorous nutrients. When these algae die, they are consumed by bacteria, which in turn deplete the
oxygen in the water, giving rise to hypoxic (low-oxygen) dead zones and killing the fish and other marine
life. This process of “eutrophication” (high nutrient concentrations leading to algal blooms and then
hypoxia) is already occurring in more than 100 estuaries around the world. Figure 6.4 shows a young
boy swimming in an algal bloom off the coast of Shandong, China.
Figure 6.4. Young Boy Swimming in Algal Bloom in Shandong, China
The fifth planetary boundary arises from the overuse of freshwater resources. Humans and other
species need freshwater every day to stay alive. Of the total amount of freshwater that humanity uses,
about 70% is used for agricultural production; about 20% is used by industry; and the remaining 10% is
for household use, meaning cooking, hygiene, and other household uses. Humanity is now using so
much water, especially for food production, that in many parts of the world societies are depleting their
most critical sources of freshwater. Farmers around the world are tapping into groundwater aquifers,
7
taking water out of the ground faster than it is being recharged by rainfall. The result is that these
aquifers are being depleted. When they are depleted, the farmers depending on this groundwater will
suffer massive losses of production, and food scarcity will result. Groundwater depletion is now a
worldwide phenomenon, including the US Midwest, northern China, and the Indo-Gangetic plains of
Northern India and Pakistan.
Freshwater scarcity will be exacerbated by countless other problems: growing populations, industrial
use of water (e.g. for mining and power plants), changing rainfall and soil moisture conditions due to
human-induced climate change, and the loss of meltwater from glaciers as glaciers retreat and
eventually are eliminated as a result of global warming. All in all, the planetary boundary of freshwater
will pose a major crisis for many regions of the world in the decades to come.
The sixth planetary boundary is land use. Humanity uses a massive amount of land to grow food; graze
animals; produce timber and other forest products (e.g. palm oil); and for our expanding cities.
Humanity has been converting natural lands such as forests to farmlands and pasturelands for
thousands of years. Many regions of the world that were once dense forests are now farm lands or
cities. The resulting deforestation not only adds CO2 to the atmosphere (as the carbon in the plants and
trees returns to the atmosphere), thus adding to human-made climate change, but it also destroys the
habitats of other species. Human land use change, whether for farms, pastures, or cities, is causing a
massive disruption to ecosystems and species survival in many parts of the world.
The seventh planetary boundary is biodiversity. The evolution of life on Earth has created a remarkable
diversity of life, somewhere between 10 million and 100 million distinct species, most of which have not
yet been catalogued. That biodiversity (biological diversity) not only defines life on the planet, but also
contributes in fundamental ways to the functions of ecosystems, the productivity of crops, and
ultimately to the health and survival of humanity. We depend on biodiversity for our food supply, our
safety from many natural hazards (e.g. coastal flooding), countless construction and industrial materials,
our freshwater, and our ability to resist pests and pathogens. When the biodiversity is disrupted,
ecosystem functions change markedly, usually in an adverse way (e.g. the productivity of crops
diminishes).
Humanity is massively disrupting biodiversity. We are doing so in countless ways, including through
pollution, land-use change such as deforestation, human-induced climate change, freshwater depletion,
ocean acidification, and nitrogen and phosphorus flux. Many species are in decline in numbers, genetic
diversity, and resilience. Figure 6.5 gives some broad sense of the decline of populations of major
groups of species. Indeed, countless species face the risk of complete extinction, and prevailing science
holds that humanity is now causing the earth’s Sixth Great Extinction wave. As summarized in Figure 6.6,
the other five extinctions in the earth’s history resulted from natural processes, such as volcanoes and
meteorite, as well as the internal dynamics of Earth itself. This sixth mega-extinction is not natural. It is
the result of one species – humans – damaging the planet so severely that we are putting millions or
even tens of millions of other species at risk. Since humanity depends on those other species, we are of
course gravely endangering humanity as well.

8
Figure 6.5. The Living Planet Index of Biodiversity
Figure 6.6. The First Five Great Extinctions

9
The eighth planetary boundary is called aerosol loading. When we burn coal, biomass, diesel fuels, and
other sources of pollution, small particles called aerosols are put into the air. A tremendous amount of
air pollution is created that is very damaging for the lungs; claims many lives per year; and has a
significant impact on changing climate dynamics. Very fine particles of diameter less than 2.5
micrometers (written as PM 2.5) can cause life-threatening lung disease. China’s major cities have been
experiencing catastrophic levels of aerosol pollution, leading to urban smog that is so thick that on some
days it is dangerous to venture outside. Figure 6.7 shows such a smoggy morning in Beijing in January
2014.
Figure 6.7. Smog in Beijing (2014)
The next (very broad) category is chemical pollution. Industries such as petrochemicals, steel, and
mining not only use a huge amount of land and water for their processing, but also add a tremendous
load of pollutants back into the environment, many of which accumulate. They can be very deadly for
humans as well as for other species. China, the world leader of economic growth over the past 30 years,
has also become the leader of polluted waterways of its major cities because of the extent of its heavy
industrial processing, a major environmental problem it will have to deal with.
When humanity trespasses on these planetary boundaries, meaning that human pressures on the
environment become greater than the ability of the earth’s natural systems to absorb those human
pressures, the result is a major change in the function of the earth’s ecosystems. Those changes, in
turn, threaten human wellbeing, and even human survival when the shocks occur in places where
populations are very poor and do not have the buffers of wealth and infrastructure to protect them.
When fisheries die, fishing communities die with them. When groundwater is depleted, farming

10
collapses. When the climate changes, regions can be thrown in turmoil and even war, as has
increasingly occurred in the dryland regions of Africa, the Middle East, and Western Asia.
Human-induced climate change is already having such dire impacts in many parts of the world. The
most direct manifestation of human-induced climate change has been the rise of temperatures, and the
rising frequency of extreme heat waves. World-leading climate scientist Professor James Hansen has
analyzed the extreme heat events on the planet from the 1950s till now, with the results shown in
Figure 6.8. The red spots on the world map indicate occurrences of extreme heat waves. Note the years
for the nine maps, starting in 1955 and ending in 2011. We see clearly that the numbers of red blotches
on the map – signifying extreme heat waves – have increased dramatically between 1955 and 2011.
Indeed, events that only occurred one or two times per 1,000 days in the 1950s are now occurring at a
frequency of 50-100 times per 1,000 days in our time.
Figure 6.8. Changes in Extreme Temperatures (1955-2011)
II. Growth Dynamics
It is a stunning reality that humanity is already pushing against the limits of the earth’s planetary
boundaries. Yet the pressures are likely to increase in the future, not decrease. That is because the
world population and GDP per capita both continue to grow. And indeed, we are interested in the
success of poor countries in raising their living standards. We are therefore faced with the most
important challenge of sustainable development: how to reconcile the continued growth of the world
economy and the sustainability of the earth’s ecosystems and biodiversity?
11
This challenge is profoundly significant and profoundly challenging. We want economic development,
and we need environmental sustainability. The two seem contradictory, though I will argue that they
are in fact compatible if we follow smart policies. Still, making growth and environmental sustainability
compatible will be no easy feat. To put in another way, we need to learn to achieve economic growth
that remains within planetary boundaries.
To get a quantitative sense of the extent of this challenge, let us first consider the amount of “pent-up
growth” that is now in the world economic system. By pent-up growth, I mean the amount of economic
growth that we might expect as the result of poorer countries catching up with richer countries even if
the richer countries do not grow rapidly in the future.
We are now a world of around $91 trillion dollars a year (the IMF’s estimate for 2014) when measured
in US dollars at international (PPP) prices. There are 7.2 billion people with an average output per
person of approximately $12,000. The average income in the high-income countries is roughly three
times the world average, meaning that high-income countries have an average per capita income of
around $36,000. The average income of the developing countries (low-income and middle-income
countries) is roughly $7,000. Suppose that the poor countries successfully catch up with the rich world.
That catching-up process would raise the income of the developing countries to $36,000, and would
raise the world average income to that level as well. Since the average income would rise three times,
total world output similarly would increase by three times, from around $91 trillion to around $275
trillion.
That is a stunning increase for a world economy that has already trespassed major planetary
boundaries. Yet is understates the potential impact, since the three time increase is what would happen
with today’s population. Now let us factor in future population growth. Today’s world population of 7.2
billion people is projected to rise to around 9.6 billion by mid-century, and 10.8 billion by the end of the
century. Just the rise to 2050 is an increase of 33% by mid-century. With full catching up, the world
economy would therefore grow to 9.6 billion people at $36,000 per person, or a total world income of
$346 trillion, nearly four times today’s Gross World Product.
It is true that convergence of income levels is not likely to occur by 2050. Today’s developing countries
are not likely to close entirely the per capita income gap with the high-income countries by mid-century.
Yet our calculations also assumed that the rich countries would stay in place at $36,000. But they are
likely to achieve continued economic growth. So our calculations must adjust for two factors:
incomplete catching up, and continued economic growth in the high-income countries. We need a
statistical model of future growth in order to make an educated assessment about possible outcomes.
Here is one simple rule of thumb. Compare the growth rates of the US and countries with lower per
capita incomes. Generally speaking, a country at half of the per capita income of the US (that is, at
$25,000 per person) will tend to grow roughly 1.4 percentage points per year faster than the US in per
capita GDP. If the US grows at 1 percent per year in per capita terms, the country at $25,000 per capita
would tend to grow at around 2.4 percent per year. A country at half the level of $25,000 (that is, at
12
$12,500 per capita) would tend to grow another 1.4 percent per year faster, or at a rate of 3.8 percent
per year (= 1% + 1.4% + 1.4%). Using this principle, we find the following typical growth rates:
Country Per capita Income (PPP) Growth Rate (tendency per year)
Least Developed 1,613 8.0
Low income 3,125 6.6
Lower middle-income 6,250 5.2
Upper middle-income 12,500 3.8
Lower high-income 25,000 2.4 (=1 + 1.4)
US 50,000 1
The poorer the starting point (assuming no poverty trap or other fundamental barriers to growth), the
greater the head room for rapid catching up. Over time, the poorer countries narrow the gap with the
richer countries by growing faster. As the income gap narrows, so too does the growth rate of the
poorer country. There is a gradual convergence of living standards gradually over several decades, as
well as a convergence of growth rates to the long-term growth rate of the technological “leader” (in our
example, to the 1 percent growth of the US). The poor country starts out growing very fast, and then as
it becomes richer and closer to the technological leader, its growth rate also slows down and eventually
gradually converges with that of the technological leader.
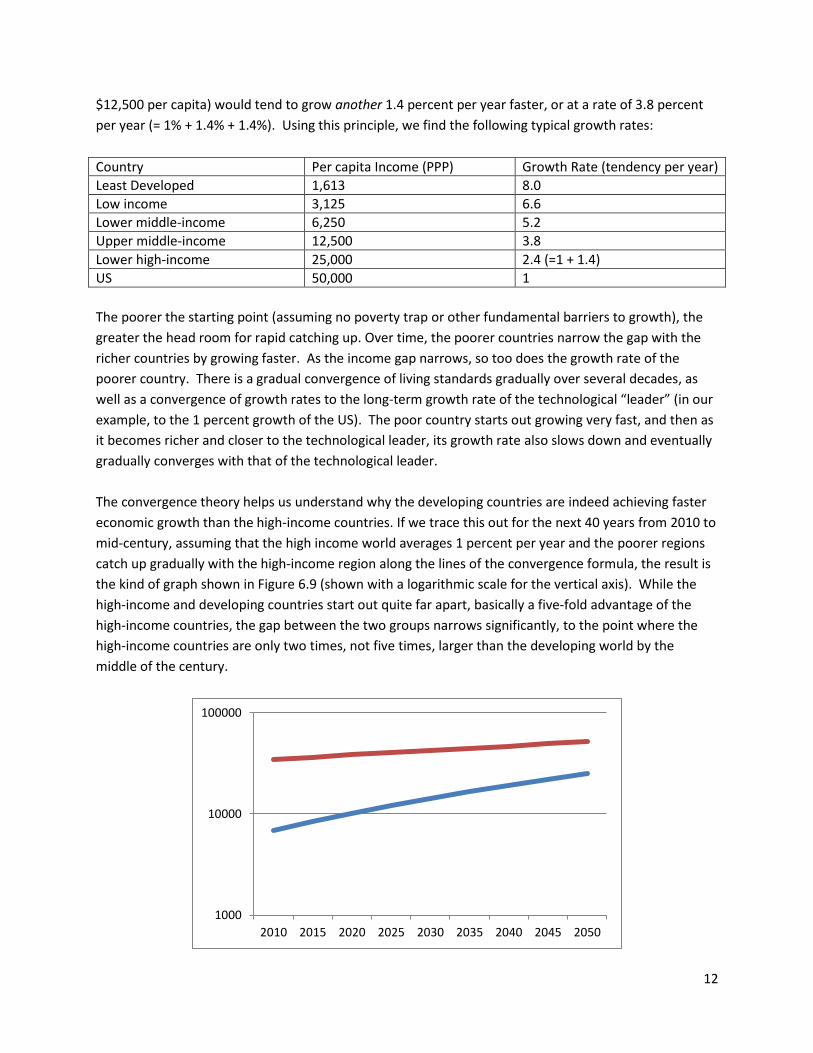
The convergence theory helps us understand why the developing countries are indeed achieving faster
economic growth than the high-income countries. If we trace this out for the next 40 years from 2010 to
mid-century, assuming that the high income world averages 1 percent per year and the poorer regions
catch up gradually with the high-income region along the lines of the convergence formula, the result is
the kind of graph shown in Figure 6.9 (shown with a logarithmic scale for the vertical axis). While the
high-income and developing countries start out quite far apart, basically a five-fold advantage of the
high-income countries, the gap between the two groups narrows significantly, to the point where the
high-income countries are only two times, not five times, larger than the developing world by the
middle of the century.
1000
10000
100000
2010 2015 2020 2025 2030 2035 2040 2045 2050
13
Figure 6.9. High Income vs. Developing Country Growth
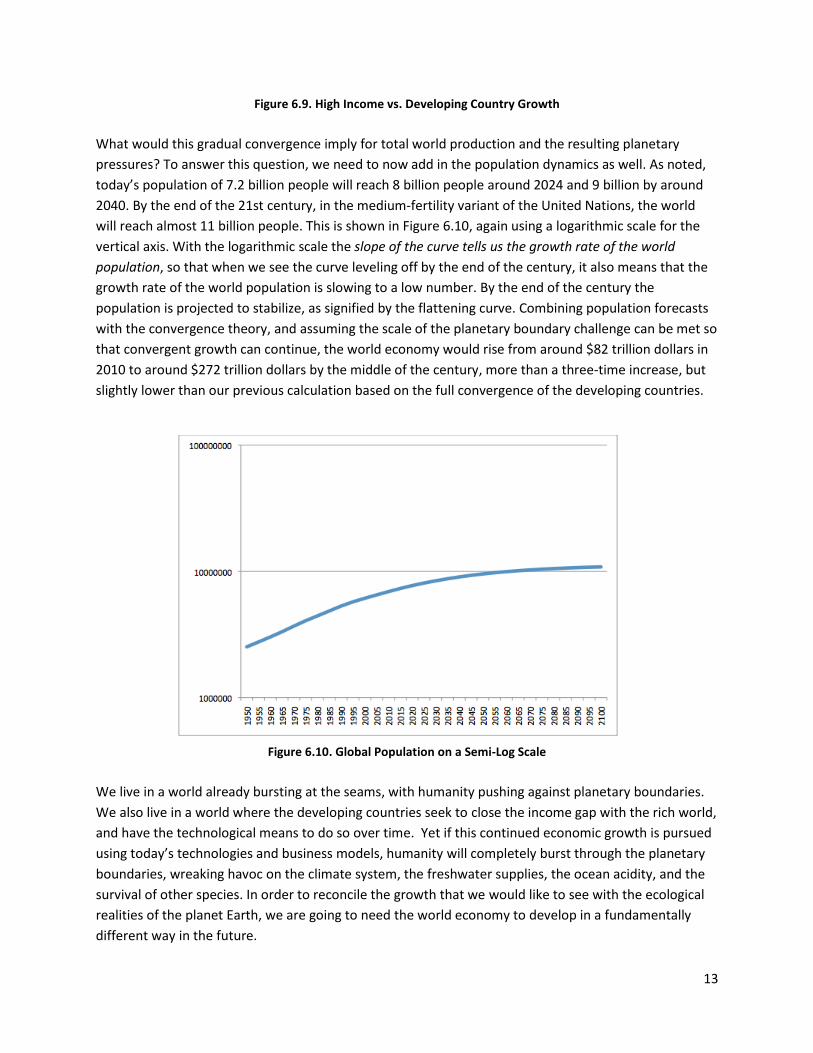
What would this gradual convergence imply for total world production and the resulting planetary
pressures? To answer this question, we need to now add in the population dynamics as well. As noted,
today’s population of 7.2 billion people will reach 8 billion people around 2024 and 9 billion by around
2040. By the end of the 21st century, in the medium-fertility variant of the United Nations, the world
will reach almost 11 billion people. This is shown in Figure 6.10, again using a logarithmic scale for the
vertical axis. With the logarithmic scale the slope of the curve tells us the growth rate of the world
population, so that when we see the curve leveling off by the end of the century, it also means that the
growth rate of the world population is slowing to a low number. By the end of the century the
population is projected to stabilize, as signified by the flattening curve. Combining population forecasts
with the convergence theory, and assuming the scale of the planetary boundary challenge can be met so
that convergent growth can continue, the world economy would rise from around $82 trillion dollars in
2010 to around $272 trillion dollars by the middle of the century, more than a three-time increase, but
slightly lower than our previous calculation based on the full convergence of the developing countries.
Figure 6.10. Global Population on a Semi-Log Scale
We live in a world already bursting at the seams, with humanity pushing against planetary boundaries.
We also live in a world where the developing countries seek to close the income gap with the rich world,
and have the technological means to do so over time. Yet if this continued economic growth is pursued
using today’s technologies and business models, humanity will completely burst through the planetary
boundaries, wreaking havoc on the climate system, the freshwater supplies, the ocean acidity, and the
survival of other species. In order to reconcile the growth that we would like to see with the ecological
realities of the planet Earth, we are going to need the world economy to develop in a fundamentally
different way in the future.

14
III. The Case of Energy
Of all of the problems of reconciling growth with planetary boundaries, probably none is more urgent
and yet more complicated than the challenge of the world’s energy system. The world economy has
developed (one could say “grown up”) on the basis of fossil fuels, starting with the 18th century steam
engine, and then the 19th century internal combustion engine, and then the 20th century gas turbine.
Indeed, until James Watt invented the improved steam engine in 1776, there was no realistic way to
achieve sustained economic progress. Fossil fuels allowed the breakthrough to the era of modern
economic growth, and that history reminds us of how deep the challenge is of moving away from fossil
fuels in the 21st century. The energy sources that have been central to global economic development
for more than two centuries are now a clear and present danger to the world, because of the CO2 that
they emit.
A simple solution might seem to be simply to use less energy. But this is not actually so simple, because
energy means the ability to do work. Any useful work in an economy depends on access to high-quality
energy. Yes, energy efficiency must clearly be part of any solution for sustainable development, as we
waste a lot of energy in the form of driving unnecessarily large cars, living and working in poorly
insulated buildings, and so forth. Yet the world needs energy resources, and the use of energy, even
with a substantial gain of efficiency, is likely to increase in total as the world economy grows. So we have
a basic problem. More energy will be needed in the future, but the traditional forms of fossil fuel
energy cannot do it for us because they would create a massive intensification of human-induced
climate change.
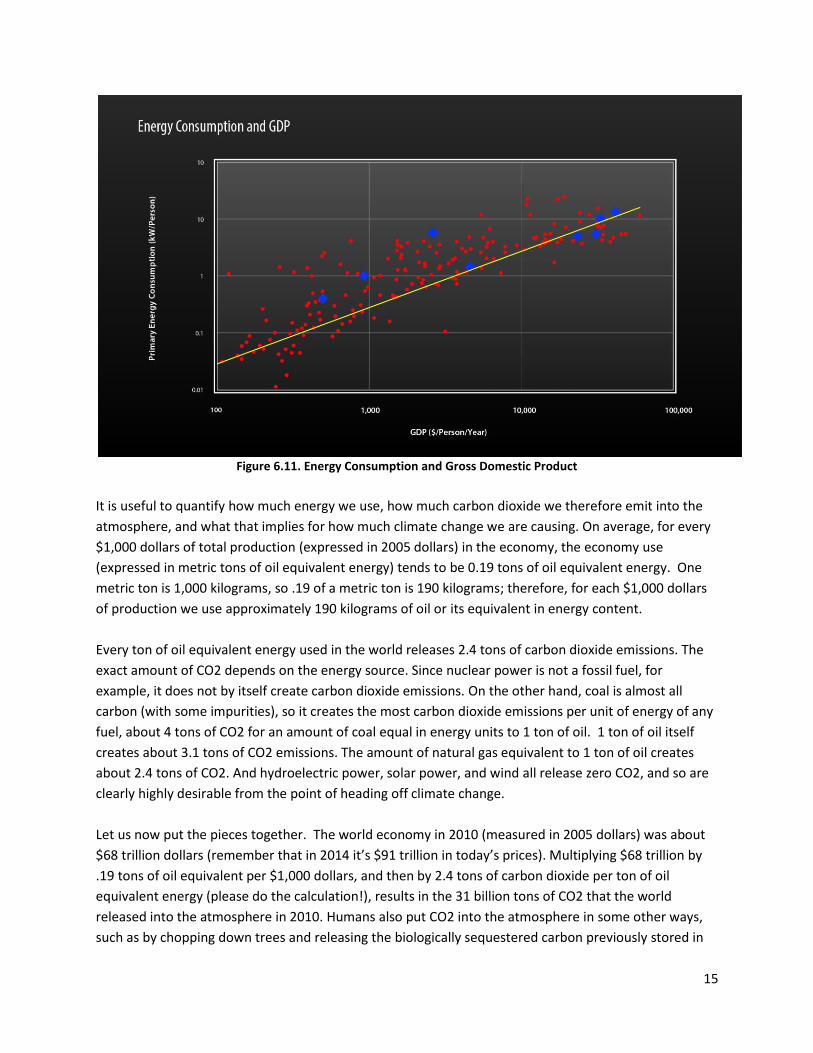
The graph in Figure 6.11 shows on a logarithmic scale the income of different countries and their
primary energy use. Total energy use combines fossil fuels, wood burning, hydroelectric power,
geothermal energy, wind and solar power, nuclear power, and biofuels (other than wood). This graph
shows the total output compared with the total primary energy use. The graph of the total output of an
economy versus its energy consumption is close to a straight line, signifying that a doubling of the size of
an economy tends to be associated with a doubling of primary energy use. As the economy grows, the
energy use tends to grow alongside it, though of course with energy-saving efficiency gains over time as
well.
15
Figure 6.11. Energy Consumption and Gross Domestic Product
It is useful to quantify how much energy we use, how much carbon dioxide we therefore emit into the
atmosphere, and what that implies for how much climate change we are causing. On average, for every
$1,000 dollars of total production (expressed in 2005 dollars) in the economy, the economy use
(expressed in metric tons of oil equivalent energy) tends to be 0.19 tons of oil equivalent energy. One
metric ton is 1,000 kilograms, so .19 of a metric ton is 190 kilograms; therefore, for each $1,000 dollars
of production we use approximately 190 kilograms of oil or its equivalent in energy content.
Every ton of oil equivalent energy used in the world releases 2.4 tons of carbon dioxide emissions. The
exact amount of CO2 depends on the energy source. Since nuclear power is not a fossil fuel, for
example, it does not by itself create carbon dioxide emissions. On the other hand, coal is almost all
carbon (with some impurities), so it creates the most carbon dioxide emissions per unit of energy of any
fuel, about 4 tons of CO2 for an amount of coal equal in energy units to 1 ton of oil. 1 ton of oil itself
creates about 3.1 tons of CO2 emissions. The amount of natural gas equivalent to 1 ton of oil creates
about 2.4 tons of CO2. And hydroelectric power, solar power, and wind all release zero CO2, and so are
clearly highly desirable from the point of heading off climate change.
Let us now put the pieces together. The world economy in 2010 (measured in 2005 dollars) was about
$68 trillion dollars (remember that in 2014 it’s $91 trillion in today’s prices). Multiplying $68 trillion by
.19 tons of oil equivalent per $1,000 dollars, and then by 2.4 tons of carbon dioxide per ton of oil
equivalent energy (please do the calculation!), results in the 31 billion tons of CO2 that the world
released into the atmosphere in 2010. Humans also put CO2 into the atmosphere in some other ways,
such as by chopping down trees and releasing the biologically sequestered carbon previously stored in
16
the trees. Approximately 46% of every ton of CO2 released stays in the air. The other 54% is typically
stored in what are called “natural sinks,” the oceans, land, plants, and trees. That means if we put 31
billion tons into the air in one year, a little over 14 billion of those tons stayed in the air.
Now comes the next question. How much is 14 billion tons of CO2 compared with the entire
atmosphere? To answer that we can look at the total volume of the atmosphere (how many molecules
are in the atmosphere) and how many molecules of CO2 are in those 14 billion tons. Doing the
calculations, we find that for every 7.8 billion tons of carbon dioxide released into the atmosphere, the
carbon dioxide in the atmosphere rises by one molecule per million molecules. This gives us a
translation factor: each 7.8 billion tons of CO2 in the atmosphere raises the CO2 concentration by 1
molecule per million. Scientists speak of “parts per million” instead of molecules per million, and use
the abbreviation ppm. In 2010, the 14 billion tons of CO2 in the atmosphere therefore raised the CO2
concentration by around 1.8 ppm (parts per million).
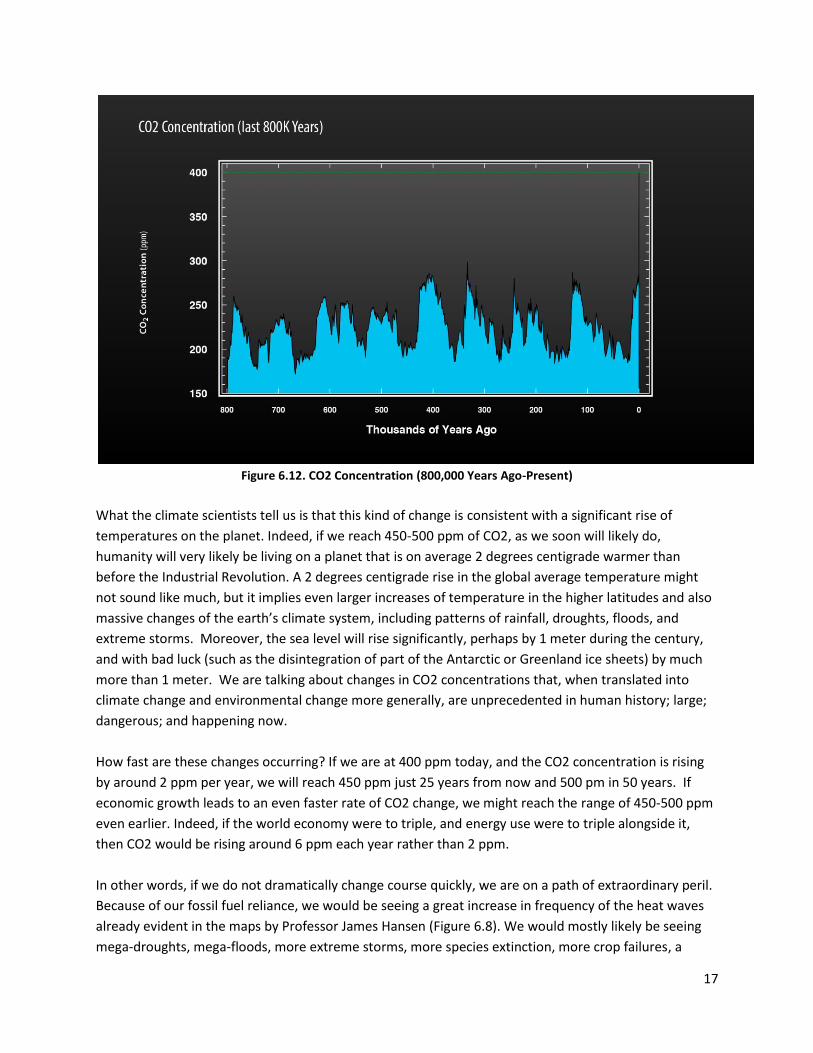
Is that a big increase for one year? Yes. Should we be frightened by it? Yes. Figure 6.12 shows a graph of
the concentration of CO2 in the atmosphere measured over hundreds of thousands of years. The
concentration of CO2 fluctuates over geological times (1,000s of years) as a result of normal Earth
processes such as changes in the earth’s orbital cycle. The graph shows the peaks and declines of CO2 in
the earth’s geological history over the past 800,000 years, driven mainly by natural changes of the
earth’s orbital cycle until the most recent 200 years.
Look at the graph all the way to the right, which is the present age. During the past 200 years, and
especially the past 100 years, the CO2 concentration has shot straight up, breaking out of the natural
range of the past 800,000 years. This is the result of humanity discovering how to use fossil fuels in
huge quantities. For 800,000 years, the concentration of CO2 fluctuated between roughly 150 and 280
parts per million. Then suddenly, in the blink of an eye in geological time, humanity has caused the CO2
to soar way above 280 parts per million. Within just 150 years, the CO2 concentration has soared from
280 ppm to 400 ppm. We have reached a level of CO2 in the atmosphere not seen for the past 3 million
years!
17
Figure 6.12. CO2 Concentration (800,000 Years Ago-Present)
What the climate scientists tell us is that this kind of change is consistent with a significant rise of
temperatures on the planet. Indeed, if we reach 450-500 ppm of CO2, as we soon will likely do,
humanity will very likely be living on a planet that is on average 2 degrees centigrade warmer than
before the Industrial Revolution. A 2 degrees centigrade rise in the global average temperature might
not sound like much, but it implies even larger increases of temperature in the higher latitudes and also
massive changes of the earth’s climate system, including patterns of rainfall, droughts, floods, and
extreme storms. Moreover, the sea level will rise significantly, perhaps by 1 meter during the century,
and with bad luck (such as the disintegration of part of the Antarctic or Greenland ice sheets) by much
more than 1 meter. We are talking about changes in CO2 concentrations that, when translated into
climate change and environmental change more generally, are unprecedented in human history; large;
dangerous; and happening now.
How fast are these changes occurring? If we are at 400 ppm today, and the CO2 concentration is rising
by around 2 ppm per year, we will reach 450 ppm just 25 years from now and 500 pm in 50 years. If
economic growth leads to an even faster rate of CO2 change, we might reach the range of 450-500 ppm
even earlier. Indeed, if the world economy were to triple, and energy use were to triple alongside it,
then CO2 would be rising around 6 ppm each year rather than 2 ppm.
In other words, if we do not dramatically change course quickly, we are on a path of extraordinary peril.
Because of our fossil fuel reliance, we would be seeing a great increase in frequency of the heat waves
already evident in the maps by Professor James Hansen (Figure 6.8). We would mostly likely be seeing
mega-droughts, mega-floods, more extreme storms, more species extinction, more crop failures, a
18
massive sea level rise over time, and a massive acidification of the oceans as that CO2 dissolves into the
ocean and produces carbonic acid. Some regions will be more vulnerable than others. Not every place
on the planet will experience each kind of disruption. But in a world that is 3 degrees warmer (or even
more) in temperature than now, the disruptions will be widespread. And we could well be on our way to
4 degrees warmer or even more by the end of the 21st century according to the best evidence.
The solutions, which we will study later on, involve a “deep decarbonization” of the energy system,
meaning a way to produce and use energy with far lower emissions of CO2 than now. There will be at
least three main “pillars” of deep decarbonization. The first is energy efficiency, using much less energy
per unit of GDP than now. The second is electrification, meaning that we shift from petroleum to
electricity to drive cars, and from fossil fuels to electricity to heat and cool buildings. The third is low-
carbon electricity, meaning that we produce power with wind, solar, nuclear, or carbon capture and
storage technologies, so that emissions of CO2 per megawatt of electricity are drastically reduced.
Every part of the world will need to join in this process.
We must indeed change course on energy and we must do it quickly – far more quickly than what the
politicians are telling us. But there is some good news. There are powerful low-carbon technologies
available at sharply declining prices, for solar power, wind power, energy efficiency, electric vehicles,
and more. These technologies will be crucial to a low-carbon future.
IV. The Case of Food
Intuitively, fossil fuel use (and the mining that goes along with it) would seem to be the dominant means
by which humanity impacts the physical planet. Energy use is everywhere, in transport systems, power
generation, industry, offices and homes. Yet there is actually an economic sector with comparable or
even greater environmental impact than the energy sector: agriculture.
Perhaps this is not entirely surprising. Agriculture is, of course, key to our very survival. We must eat.
And since the beginning of civilization, most of humanity has been engaged in farm life. Even now, in
the early 21st century, half of the world’s population resides in rural areas, with some fairly direct
connection with agriculture. Yet the extent of agriculture’s impact on the environment is even bigger
than it appears. Think of the planetary boundaries – almost every one of them is related to agriculture.
Consider each of the planetary boundaries in turn from the point of view of agriculture.
Climate change. When land is cleared for farmland and pastureland, the resulting CO2 emissions
contribute to climate change. So too does the energy use on farms and in the transport and preparation
of foods; the methane released in rice production and by livestock; and the nitrous oxide that results in
part from the volatilization of nitrogen-based fertilizers.
Ocean acidification. Agriculture contributes to the CO2 emissions that in turn are the main culprit in
ocean acidification.
19
Ozone depletion. CFCs used in food production and storage (e.g. refrigerants) are the drivers of ozone
depletion.
Nitrogen and Phosphorous Fluxes. The use of chemical fertilizers is the main source of anthropogenic
nitrogen and phosphorous fluxes.
Freshwater depletion. Agriculture, we have seen, is by far the greatest user – and therefore cause of
depletion – of freshwater resources.
Biodiversity. The grand tradition of agriculture, unfortunately, is to “simplify” the biodiversity of a given
landscape. A complex natural ecology is replaced by a human-managed ecology that often involves a
single genetic variant of a single crop such as rice, wheat, or maize. Monoculture farming can cause a
sharp decline in biodiversity that eventually reduces crop productivity as well as other ecosystem
functions. Agriculture can reduce biodiversity in other ways as well, for example through the application
of pesticides and herbicides that end up poisoning the local environment, or through the introduction of
non-native species that disrupt local ecosystems.
Aerosols. Agriculture can contribute to aerosols through many pathways: dust, burning of crop
residues, combustion of diesel and other fossil fuels, and so forth.
Chemical Pollution. Agriculture in high-income settings is often highly chemical intensive, involving
chemical fertilizers, pesticides, herbicides, and other soil treatments. Pollution may also arise from food
processing, waste management, use of antibiotics in animal feeds, and so on.
In addition to crossing these planetary boundaries, the global agriculture system has other important
adverse impacts. One issue is that the food system is also giving rise to new pathogens. For example,
the industrial breeding of poultry causes recombination of genes of bacteria and viruses. When livestock
and poultry mix with wild species, there are further viral re-combinations. The interaction of the food
industry with wild-type pathogens has probably given rise to several emerging infectious diseases, most
likely including the frightening outbreak of the SARS virus in 2003.
All of these huge, and unsustainable, environmental consequences of farming are deeply ironic. They
recall Malthus’s warning about the physical limitations of growing food on the planet. Malthus noted
that population tends to increase geometrically (at a given growth rate) while the ability to grow food,
he believed, increases only arithmetically (that is, by a given quantum, not a given growth rate, per
year). He noted that geometric growth would necessarily overtake arithmetic growth, so the growth of
the human population would necessarily overtake the ability to grow food. At some future point,
warned Malthus, there would be so many people that hunger would necessarily ensue, with devastating
feedbacks, such as war, famine, disease and other scourges that would push the population back down.
Malthus argued that in the long run, humanity would therefore not break free of the physical
constraints on the ability to grow food.
20
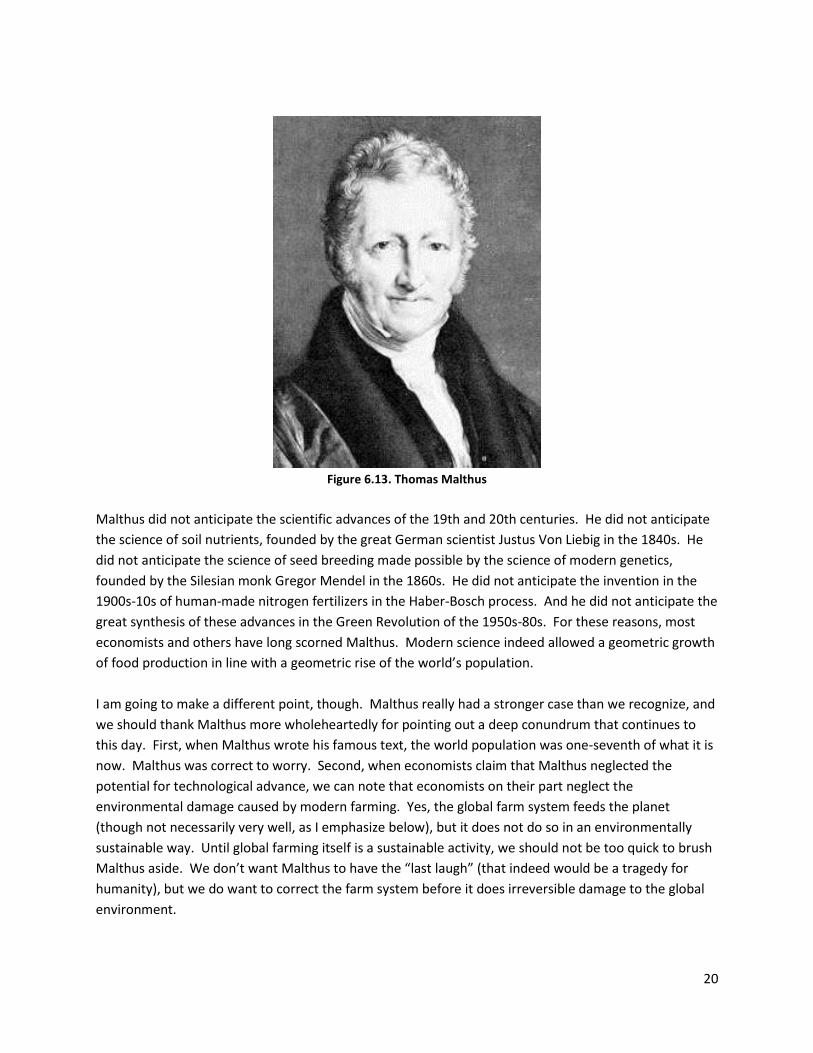
Figure 6.13. Thomas Malthus
Malthus did not anticipate the scientific advances of the 19th and 20th centuries. He did not anticipate
the science of soil nutrients, founded by the great German scientist Justus Von Liebig in the 1840s. He
did not anticipate the science of seed breeding made possible by the science of modern genetics,
founded by the Silesian monk Gregor Mendel in the 1860s. He did not anticipate the invention in the
1900s-10s of human-made nitrogen fertilizers in the Haber-Bosch process. And he did not anticipate the
great synthesis of these advances in the Green Revolution of the 1950s-80s. For these reasons, most
economists and others have long scorned Malthus. Modern science indeed allowed a geometric growth
of food production in line with a geometric rise of the world’s population.
I am going to make a different point, though. Malthus really had a stronger case than we recognize, and
we should thank Malthus more wholeheartedly for pointing out a deep conundrum that continues to
this day. First, when Malthus wrote his famous text, the world population was one-seventh of what it is
now. Malthus was correct to worry. Second, when economists claim that Malthus neglected the
potential for technological advance, we can note that economists on their part neglect the
environmental damage caused by modern farming. Yes, the global farm system feeds the planet
(though not necessarily very well, as I emphasize below), but it does not do so in an environmentally
sustainable way. Until global farming itself is a sustainable activity, we should not be too quick to brush
Malthus aside. We don’t want Malthus to have the “last laugh” (that indeed would be a tragedy for
humanity), but we do want to correct the farm system before it does irreversible damage to the global
environment.

21
Just as we are going to need to find a new energy pathway based on energy efficiency and low carbon
energy supplies, we are also going to need to find new farm systems, adapted to local ecological
conditions and causing much less ecological damage. What is common to nearly all of the world’s major
farm regions is that the farm systems are still not sustainable. We have yet to prove Malthus wrong! His
specter will loom large until the world population is stabilized (or declining) and our production methods
are environmentally sound. The challenge of a sustainable global food supply is therefore a
fundamental part of any 21st century agenda of achieving sustainable development.
V. Population Dynamics and Sustainable Development
A major part of our ability to achieve sustainable development will depend on the future dynamics of
the world’s population. The more people there are on the planet, the more challenging it will be to
reconcile the economic objectives of rising living standards per person and the planetary boundaries.
The more rapidly population is growing in a particular country, the more difficult it will be to combine
economic growth, social inclusion, and environmental sustainability in that place.
Poor countries with high fertility rates (with more than 3 children per woman, and in some countries
reaching 6 or 7 children per woman) are often stuck in a “demographic trap.” Because households are
poor, they have many children. Yet because they have many children, each child is more likely to grow
up poor. These societies end up in a vicious circle in which high fertility and poverty are mutually
reinforcing.
Facing the question of high fertility (and the rapid population growth that accompanies it) is therefore
crucial for breaking free of poverty. When poor families have large numbers of children, they are not
able to provide the necessary investments for each child in the human capital – health, nutrition,
education, and skills – the child needs to be healthy and productive as an adult. Moreover,
governments are not able to keep building the infrastructure – roads, power, ports, and connectivity –
needed to keep up with the growing population. And the country’s fixed natural capital such as land
and depleting natural capital such as hydrocarbons must be subdivided among an ever-growing
population. Reducing the fertility rates voluntarily, while respecting human rights and family desires, is
therefore essential to sustainable development and the end of poverty.
The world’s demographic future is still up for grabs, depending on the fertility choices that households
(especially low-income households) make in the future. Figure 6.14 shows the four fertility scenarios
produced in 2012 by the United Nations Population Division. The single line between 1950 and 2100
shows the actual change of population from 2.5 billion to 7.2 billion in those years. There are four
scenarios after 2010 depending on alternative assumptions about fertility rates between 2010 and 2100.

22
Figure 6.14. World Population Projections (1950-2100)
The “medium” fertility variant shown by the red line reaches about 10.8 billion people in the year 2100.
This would signify a net increase of another 3.6 billion people by 2100, roughly half again of today’s
population. The medium scenario is the one that the UN regards as the most plausible continuation of
current trends.
The purple line at the top shows something unthinkable, but still very interesting. Suppose fertility rates
do not change at all from their current levels. In each country and age group, the fertility rate would
remain as it is currently. Simply running the clock forward based on the current fertility rates, the world
population in 2100 would be 28.6 billion, four times higher than today! The earth could not sustain this,
so it will not happen. Yet this scenario does tell us that fertility rates must decline from their current
levels.
The green line is called the high-fertility variant. It is a bit more plausible than the constant-fertility
variant, and yet still pretty frightening. It says that if women were to have on average just one-half child
more (as a statistical average, or 5 children more per 10 women) than on the medium variant, the world
would reach 16.6 billion. A small change in the fertility rate, of 0.5 children per woman, has an effect of
nearly 6 billion more people on the planet by 2100. Fertility rates matter!
The low-fertility variant is the blue line below the other three. This last scenario is preferable to the
others from a sustainable development standpoint. In this variant, each woman has on average 0.5
children fewer than in the medium variant (or to put it another way, every 10 women have 5 children
fewer than in the medium variant). The population would peak around 2050 at 8.3 billion, and then
gradually decline to 6.8 billion by 2100, fully 4 billion people fewer than in the medium variant! Such an
outcome, with the population at the end of the century less than now, would make it much easier to
meet the social, economic, and environmental needs and goals of humanity.
0
5
10
15
20
25
30
35
19
50
19
60
19
70
19
80
19
90
20
00
20
10
20
20
20
30
20
40
20
50
20
60
20
70
20
80
20
90
21
00
Low fertility
Medium Fertility
High Fertility
Constant Fertility

23
These scenarios show that small changes of fertility rates will have big changes of outcomes. They
suggest that if steps are taken to help facilitate a faster reduction of fertility in today’s high-fertility
regions, for example by helping girls to stay in school through age 18 rather than marrying young, the
positive impacts from the household to the planetary scale could be huge.
Figure 6.15 shows the annual rate of change of population in the medium scenario for different groups
of countries. The solid blue line is the world average, which shows the world’s population growth
peaked at about 2% around 1970. At that time the world population was about 4 billion people, so with
a 2% growth rate the world was adding about 80 million people per year.
Figure 6.15. World Population Changes by Region (1950-2100)
In the year 2010, the growth rate dropped to 1.1% to 1.2% per year, but now the base on which that
percentage growth is occurring is twice as large as back in 1970. Multiplying 1.1% by 7.2 billion people,
and there is still the same 80 million increase as of 40 years ago. This says that while the proportionate
growth rate of population has slowed, the arithmetic increase each year remains around 75 to 80 million
people.
In the medium-fertility variant, the world’s population growth rate tends to decline to almost zero by
the end of the century because fertility rates basically come down to replacement. The replacement
fertility rate means that each mother has two children, one daughter and one son, so each mother is
replacing herself with a daughter who will become the mother of the next generation. This keeps the
24
population stable in the long term. (The replacement rate, technically, is a little bit above 2.0 to take
account of the early mortality of children who do not reach adulthood.)
Figure 6.15 shows clearly that the least developed countries have the highest population growth rate. In
the poorest places, there are many regions where family planning is not used; girls are pulled from
school very young; and women face massive discrimination and are not in the labor market. In these
circumstances, fertility rates tend to be extremely high, for example more than 6 children per woman. It
is these countries where a rapid, voluntary transition to the replacement rate is most important.
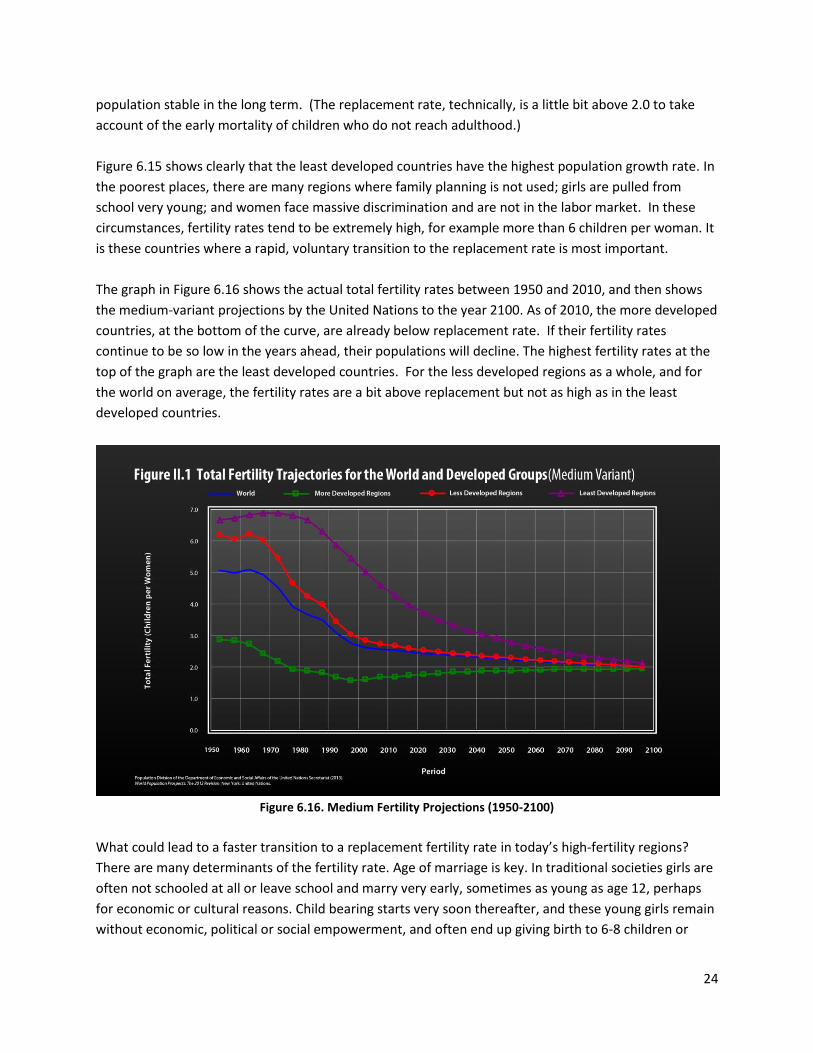
The graph in Figure 6.16 shows the actual total fertility rates between 1950 and 2010, and then shows
the medium-variant projections by the United Nations to the year 2100. As of 2010, the more developed
countries, at the bottom of the curve, are already below replacement rate. If their fertility rates
continue to be so low in the years ahead, their populations will decline. The highest fertility rates at the
top of the graph are the least developed countries. For the less developed regions as a whole, and for
the world on average, the fertility rates are a bit above replacement but not as high as in the least
developed countries.
Figure 6.16. Medium Fertility Projections (1950-2100)
What could lead to a faster transition to a replacement fertility rate in today’s high-fertility regions?
There are many determinants of the fertility rate. Age of marriage is key. In traditional societies girls are
often not schooled at all or leave school and marry very early, sometimes as young as age 12, perhaps
for economic or cultural reasons. Child bearing starts very soon thereafter, and these young girls remain
without economic, political or social empowerment, and often end up giving birth to 6-8 children or

25
even more. A second determinant of fertility is the access (or lack of access) to modern contraception
and family planning services. Places where contraceptives are widely available, where clinical services
work, where there is culturally sensitive advising of households, tend to have lower fertility rates.
Family planning programs that are culturally sensitive and operating effectively in low-income countries
can dramatically lower fertility rates on a wholly voluntary basis. A third determinant of the total
fertility rate is the woman’s role in the labor force. In some countries, women are not allowed to work,
or are restricted to working in the home or in just a few occupations. Fertility rates in these settings tend
to be high. When women are working outside the home, the fertility rates are much lower. There is a
direct “opportunity cost” of foregone earnings when women are home raising many children.
Another possible factor is the urban versus rural location of the household. In farm households, parents
often view their children as “farm assets.” Children do farm work, such as milking the cows, carrying
fuel wood, and fetching water. In an urban setting, by contrast, children are much more likely to be in
school and not working in a formal way (though there are of course painful exceptions). This means that
on average, families in urban areas see the net cost of raising children to be higher than do families in
rural areas. When families migrate from rural to urban areas, their fertility rates thus tend to come
down.
Child survival is another key determinant of fertility. If most children survive to adulthood, families may
choose to have few children; but if the parents worry that many children will die early, they will likely
have more children to ensure the survival of at least some children. One of the keys to a quick voluntary
reduction of fertility therefore is to lower the mortality rate of children, thereby giving confidence to
parents to have fewer children as well. The legality of abortion also plays an evident role as well.
Different societies have widely divergent views about abortion, but the data suggest that those
countries with legal abortion tend to have lower observed fertility rates than countries where abortion
is illegal.
Public leadership also plays a big difference, because the choice of family size is also influenced by social
norms. In most traditional societies, the cultural norm was to have as many children as possible. But
when economic, social, and health conditions change, fertility rates also change. And public policy can
speed or slow that change depending on the messages sent by leaders in the community and
government. Role models also influence fertility rates. Sociologists have found that when television
broadcasting arrives in a poor area, fertility rates tend to come down, often quickly. One hypothesis is
that people watch role models on TV with small families, and therefore choose to emulate these
examples.
Population dynamics are very important for sustainable development. The chances for sustainable
development will be very different if the world population reaches 10.8 billion at the end of the century
or instead peaks by 2050 and declines to 6.8 billion by 2100. The latter trajectory would be much easier
from the point of view of achieving a higher quality of life, greater poverty reduction, higher income per
capita, and environmental sustainability. There is also good reason to believe that lower fertility rates
would be the truly preferred choice of most households if they have affordable and convenient access to
26
family planning; education for their girls; child survival; and decent jobs and the absence of
discrimination for women. When those conditions exist, most likely households would take the
opportunity on a voluntary basis for a sharp reduction of fertility rates, helping to move the world more
quickly to a peak and then gradual decline of the world population. This would enormously help to put
the world on a sustainable development trajectory, where living standards can be raised while
respecting the planetary boundaries.