isbn ––––––––– · meg parkinson (victorian farmers federation), bronwyn teesdale...
TRANSCRIPT

© West Gippsland Catchment Management Authority.
First published 2009.
This publication is copyright. No part may be reproduced by any process except in accordance with the provisions of the Copyright Act 1968.
ISSN ���������
ISBN ���������
Disclaimer
This publication may be of assistance to you but the West Gippsland Catchment Management Authority and its employees do not guarantee that the publication is without flaw of any kind or is wholly appropriate for your particular purpose and therefore disclaims all liability for any error, loss or other consequence which may arise from you relying on any information in this publication.
It should be noted that specific reference to funding levels in this plan are for indicative purposes only. The level of government investment in this strategy will depend upon budgets and Government priorities.
Accessibility
This document is also available in pdf format on the WGCMA website www.wgcma.vic.gov.au


West Gippsland Catchment Management Authority
i
Table of Contents List of Figures .................................................................................................................................. iii
List of Tables .................................................................................................................................... iv
Acknowledgements ......................................................................................................................... vi
Abbreviations and Definitions ....................................................................................................... vii
Glossary of Key Terms.................................................................................................................. viii
Executive Summary ......................................................................................................................... ix
1 Introduction ................................................................................................................................... 1
1.1 Background ........................................................................................................................ 1
1.2 Aim ..................................................................................................................................... 1
1.3 Scope ................................................................................................................................. 2
1.4 Purpose.............................................................................................................................. 3
2 Ecosystem Services Approach ................................................................................................... 4
2.1 Ecosystems and Ecosystem Services ............................................................................... 4
2.1.1 Ecosystems ................................................................................................................... 4
2.1.2 Ecosystem Services ...................................................................................................... 4
2.1.3 Ecosystem Service Values ............................................................................................ 5
2.1.4 Measuring Ecosystem Service Values .......................................................................... 5
2.2 Ecosystem Services and Ecosystem Service Values utilised in the Strzelecki IMS ......... 6
2.2.1 Identification of measureable ecosystem services ........................................................ 6
2.2.2 Grouping Ecosystem Services by the Triple Bottom Line ............................................. 7
2.3 Benefits and Limitations of the Strzelecki IMS Ecosystem Services Approach ................ 8
3 GIS Model..................................................................................................................................... 10
3.1 Explanation of the Strzelecki IMS GIS Model .................................................................. 10
3.2 GIS Model Inputs ............................................................................................................. 11
3.3 Running the GIS Model.................................................................................................... 23
3.4 GIS Model Outputs .......................................................................................................... 24
3.4.1 Environmental Layer.................................................................................................... 24
3.4.2 Social Layer ................................................................................................................. 26
3.4.3 Economic Layer ........................................................................................................... 28
3.4.4 Final Model Output ...................................................................................................... 30
3.5 Benefits and Limitations of the Strzelecki IMS GIS Model .............................................. 33

Strzelecki Integrated Management Strategy
ii
4 Priority Asset Areas.................................................................................................................... 34
4.1 Prioritisation Method ........................................................................................................ 34
4.1.1 Asset Based Approach ................................................................................................ 34
4.1.2 Ecosystem resilience................................................................................................... 34
4.2 Priority Asset Areas ......................................................................................................... 36
4.3 Priority Asset Area Descriptions ...................................................................................... 38
5 Threat Analysis and Local Area Planning ................................................................................ 39
5.1 Threat Analysis ................................................................................................................ 39
5.2 Local Area Planning......................................................................................................... 39
6 References................................................................................................................................... 42
Appendix 1: GIS Model Input Layer Descriptions ............................................................................ 44
Appendix 2: Priority Asset Area Descriptions ............................................................................ 73
Appendix 3: Consolidated Threats List ...................................................................................... 110
Appendix 4: Opportunities for Local Area Planning ................................................................ 112
Appendix 5: Example Integrated Management Strategy Implementation Proposal ............. 113

West Gippsland Catchment Management Authority
iii
List of Figures Figure 1: Strzelecki IMS Final Model Overlay showing Priority Asset Areas.....................................xi
Figure 2: Strzelecki Integrated Management Strategy Study Area (Strzelecki Landscape) showing WGCMA Catchment Ecosystem........................................................................................... 2
Figure 3: Conceptual diagram showing an example of ecosystem services provided by the interaction of biophysical assets within an ecosystem.................................................................. 5
Figure 4: Conceptual diagram describing link between ecosystems and ecosystem service values, incorporating grouping based on the Triple Bottom Line ........................................... 8
Figure 5: Conceptual representation of the GIS model structure used in the Strzelecki IMS .................................................................................................................................................... 10
Figure 6: Spatial representation of ecosystem service values occurring in the Strzelecki Landscape � Surface Water Courses ............................................................................................... 12
Figure 7: Spatial representation of ecosystem service values occurring in the Strzelecki Landscape � Wetlands...................................................................................................................... 13
Figure 8: Spatial representation of ecosystem service values occurring in the Strzelecki Landscape � Native Vegetation and Eucalypt Plantation ................................................................. 14
Figure 9: Spatial representation of ecosystem service values occurring in the Strzelecki Landscape � Significant Flora and Fauna......................................................................................... 15
Figure 10: Spatial representation of ecosystem service values occurring in the Strzelecki Landscape � Public Access .............................................................................................................. 16
Figure 11: Spatial representation of ecosystem service values occurring in the Strzelecki Landscape � Indigenous Heritage .................................................................................................... 17
Figure 12: Spatial representation of ecosystem service values occurring in the Strzelecki Landscape � Non-Indigenous Heritage ............................................................................................ 18
Figure 13: Spatial representation of ecosystem service values occurring in the Strzelecki Landscape � Significant Landscapes................................................................................................ 19
Figure 14: Spatial representation of ecosystem service values occurring in the Strzelecki Landscape � Landuse ....................................................................................................................... 20
Figure 15: Spatial representation of ecosystem service values occurring in the Strzelecki Landscape � Surface Water Supply.................................................................................................. 21
Figure 16: Spatial representation of ecosystem service values occurring in the Strzelecki Landscape � Groundwater Supply.................................................................................................... 22
Figure 17: Modelled spatial representation of known Environmental ecosystem service values as they occur in the Strzelecki Landscape � Environmental Layer ....................................... 25
Figure 18: Modelled spatial representation of known Social ecosystem service values as they occur in the Strzelecki Landscape � Social Layer..................................................................... 27
Figure 19: Modelled spatial representation of known Economic ecosystem service values as they occur in the Strzelecki Landscape � Economic Layer .............................................. 29
Figure 20: Modelled spatial representation of all known ecosystem service values as they occur in the Strzelecki Landscape � Final Model Output .......................................................... 31
Figure 21: Priority 1, 2 and 3 Cells identified for the Strzelecki Landscape based on Final Model Output layer values................................................................................................................. 35
Figure 22: Priority Asset Areas identified for the Strzelecki Landscape based on priority cell groupings .................................................................................................................................... 37
Figure 23: Implementing the Strzelecki IMS - Priority Asset Areas ............................................... 118

Strzelecki Integrated Management Strategy
iv
List of Tables Table 1: Priority Asset Areas - General location and Appendix reference........................................ x
Table 2: Ecosystem services, service values, and potential ecosystem service value indicators identified for the Strzelecki IMS .......................................................................................... 6
Table 3: Ecosystem services grouped according to Triple Bottom Line ............................................ 7
Table 4: Description of individual input layers to the Strzelecki IMS GIS model ............................. 11
Table 5: Priority Asset Areas - General location and Appendix reference...................................... 38
Table 6: RiVERS database river reach valuation attributes (adapted from West Gippsland River Health Strategy 2005 (WGCMA 2005) ................................................................... 45
Table 7: Description of Score Scale applied to Surface Water Courses layer................................. 46
Table 8: Rules, assumptions and limitations associated with the Surface Water Course layer................................................................................................................................................... 47
Table 9: Description of Score Scale applied to Wetlands layer ....................................................... 49
Table 10: Rules, assumptions and limitations associated with the Wetlands layer ......................... 49
Table 11: Description of Score Scale applied to Native Vegetation layer ........................................ 52
Table 12: Rules, assumptions and limitations associated with the Native Vegetation layer............ 52
Table 13: Description of Score Scale applied to Significant Species layer...................................... 55
Table 14: Rules, assumptions and limitations associated with developing the Significant Species layer ..................................................................................................................................... 55
Table 15: Description of Score Scale applied to Public Access layer .............................................. 58
Table 16: Rules, assumptions and limitations associated with developing the Public Access layer ...................................................................................................................................... 58
Table 17: Description of Score Scale applied to Indigenous Heritage layer .................................... 61
Table 18: Rules, assumptions and limitations associated with developing the Indigenous Heritage layer .................................................................................................................................... 61
Table 19: Description of Score Scale applied to Non-Indigenous Heritage layer ............................ 62
Table 20: Rules, assumptions and limitations associated with developing the Non-Indigenous Heritage layer ................................................................................................................. 63
Table 21: Description of Score Scale applied to Significant Landscape layer ................................. 64
Table 22: Rules, assumptions and limitations associated with developing the Significant Landscape layer ................................................................................................................................ 65
Table 23: LUIM landuse valuation criteria (adapted from West Gippsland CMA Soil Erosion Management Plan 2008)...................................................................................................... 66
Table 24: LUIM landuse values scores compiled through stakeholder consultation (adapted from West Gippsland CMA Soil Erosion Management Plan 2008) ................................... 67
Table 25: Description of Score Scale applied to Landuse layer....................................................... 67
Table 26: Rules, assumptions and limitations associated with developing the Landuse layer................................................................................................................................................... 68
Table 27: Description of Score Scale applied to Surface Water Supply layer ................................. 69
Table 28: Rules, assumptions and limitations associated with developing the Surface Water Supply layer ............................................................................................................................ 70
Table 29: Description of Score Scale applied to Groundwater Supply layer ................................... 71
Table 30: Rules, assumptions and limitations associated with developing the Groundwater Supply layer................................................................................................................. 72

West Gippsland Catchment Management Authority
v
Table 31: Average ecosystem service values for Priority Asset Area A .......................................... 73
Table 32: Description of biophysical assets identified correlating with ecosystem service values for the Priority Asset Area A................................................................................................... 74
Table 33: Links to existing Plans and Strategies � Priority Asset Area A........................................ 76
Table 34: Average ecosystem service values for Priority Asset Area B .......................................... 77
Table 35: Description of biophysical assets identified correlating with ecosystem service values for the Priority Asset Area B................................................................................................... 78
Table 36: Links to existing Plans and Strategies � Priority Asset Area B........................................ 80
Table 37: Average ecosystem service values for Priority Asset Area C .......................................... 81
Table 38: Description of primary assets identified correlating with ecosystem service values for the Priority Asset Area C .................................................................................................. 82
Table 39: Links to existing Plans and Strategies � Priority Asset Area C........................................ 84
Table 40: Average ecosystem service values for Priority Asset Area D .......................................... 85
Table 41: Description of primary assets identified correlating with ecosystem service values for the Priority Asset Area D .................................................................................................. 86
Table 42: Links to existing Plans and Strategies � Priority Asset Area D........................................ 88
Table 43: Average ecosystem service values for Priority Asset Area E .......................................... 89
Table 44: Description of primary assets identified correlating with ecosystem service values for the Priority Asset Area E................................................................................................... 90
Table 45: Links to existing Plans and Strategies � Priority Asset Area E........................................ 93
Table 46: Average ecosystem service values for Priority Asset Area F .......................................... 95
Table 47: Description of biophysical assets identified correlating with ecosystem service values for the Priority Asset Area F................................................................................................... 96
Table 48: Links to existing Plans and Strategies � Priority Asset Area F ........................................ 98
Table 49: Average ecosystem service values for Priority Asset Area G.......................................... 99
Table 50: Description of primary assets identified correlating with ecosystem service values for the Priority Asset Area G ................................................................................................ 100
Table 51: Links to existing Plans and Strategies � Priority Asset Area G...................................... 103
Table 52: Average ecosystem service values for Priority Asset Area H ........................................ 105
Table 53: Description of primary assets identified correlating with ecosystem service values for Priority Asset Area H ...................................................................................................... 106
Table 54: Links to existing Plans and Strategies � Priority Asset Area H...................................... 108
Table 55: Threats compiled to create the Strzelecki IMS consolidated threats list........................ 110
Table 56: Natural resource management opportunities for local area planning within the Strzelecki Landscape ...................................................................................................................... 112
Table 57: Indicative budget breakdown (GST exclusive, as of February 2009) for the example project proposal - Implementing the Strzelecki IMS ........................................................ 120
Strzelecki Integrated Management Strategy
vi
Acknowledgements Steering Committee members: Liz Clay (Chair WGCMA), Neil Baker (Greening Australia), Bill Bodman Snr (Victorian Farmers Federation), Jillian Busch (Gippsland Water), Heather Cahill (Wellington Shire Council), Nick Dudley (DPI), Adam Dunn (WGCMA), Kathryn Ewels (HVP Plantations), Carolyn Ferguson (Baw Baw Shire Council), Fiona Fullard (Latrobe City Council), Wayne Gilmour (WGCMA), Shayne Haywood (WGCMA), Yasmin Kelsall (WGCMA), Gaby Mitchell (WGCMA), Theo Morsink (Friends of Gippsland Bush), Meg Parkinson (Victorian Farmers Federation), Bronwyn Teesdale (Greening Australia Victoria), Catheryn Thompson (Save Our Strzeleckis), Owen Trumper (HVP Plantations), Brett Vurlow (South Gippsland Water), Gary Wallis (South Gippsland Conservation Society), Anne Westwood (Trust for Nature), Rolf Willig (DSE).
Technical Reference Group members: Shayne Haywood (WGCMA), Richard Allen (WGCMA), Jillian Busch (Gippsland Water), Michelle Dickson (WGCMA), Nick Dudley (DPI), Adam Dunn (WGCMA), Tracey Jones (WGCMA), Rolf Willig (DSE), Wendy Wright (Monash University).
GIS Assistance: Dale Costigan and Ruth Gazzard
Project Supervisor: Shayne Haywood (WGCMA)
Project Management, Development and Report Writing: Alan Hill (WGCMA)
Others:
Shayne Annett, Manager, Sustainable Landscapes, DSE
Anja George, Senior Policy Officer, Sustainable Landscapes Program, DSE
WGCMA Land & Production Portfolio Group members
WGCMA Biodiversity Portfolio Group members
West Gippsland Catchment Management Authority
vii
Abbreviations and Definitions AAV � Aboriginal Affairs Victoria
BCS � Bioregional Conservation Status
CE � Catchment Ecosystem
CMA � Catchment Management Authority
DPI � Department of Primary Industries
DSE � Department of Sustainability and Environment
EVC � Ecological Vegetation Class
FMO � Final Model Output
GIS � Geographic Information System
GFS � Groundwater Flow System
GMA � Groundwater Management Area
IMS � Integrated Management Strategy
LUIM � Land Use Impact Model
MAT � Management Action Target
PWSC � Proclaimed Water Supply Catchment
RiVERS � River Values and Environment Risk System
TBL � Triple Bottom Line
VROT species � Victorian Rare or Threatened species
WGCMA � West Gippsland Catchment Management Authority
WSPA � Water Supply Protection Area

Strzelecki Integrated Management Strategy
viii
Glossary of Key Terms Asset based approach: An approach to natural resource management focussing on protecting or maintaining biophysical assets, rather than focussing on specific issues.
Biophysical assets: Living or non-living biological and physical characteristics of the environment.
Catchment Ecosystems: Geographic management areas based on catchment boundaries as delineated by the West Gippsland Catchment Management Authority.
Ecosystem: The organisms in a community and the associated biophysical assets with which they interact (DSE 2008).
Ecological resilience: The ability of an ecosystem to withstand and recover from environmental stresses and disturbances (DSE 2008).
Ecosystem services: The role played by organisms in creating a healthy environment for human beings, from production of oxygen to soil formation and maintenance of water quality (DSE2008).
Ecosystem service values: The indicators by which ecosystem services are measured.
Land Use Impact Model: A Geographic Information Systems model developed to represent the relationships between land qualities and landuse activities (WGCMA 2008b).
Local area plan: A collaborative plan developed by informed stakeholders for a land area delineated by a single property boundary, a group of adjacent properties, or a sub-catchment area.
Priority Asset Area: A priority location for developing local action plans. Priority Asset Areas are delineated based on the outputs of the Strzelecki IMS GIS model and the principles of the asset based approach and ecosystem resilience.
Proclaimed water supply catchment: A catchment area proclaimed for regulated domestic supply of water.
RiVERS Database: A computer based resource compiling values and threat data collected for major river reaches within the West Gippsland region.
Significant Landscape Overlay: Shire council planning map overlays created through the Victorian Planning Provisions, implemented to conserve and enhance the character of significant landscapes as identified by local councils (DPCD 2008b).
West Gippsland Catchment Management Authority
ix
Executive Summary The Strzelecki Integrated Management Strategy has been produced by the West Gippsland Catchment Management Authority (WGCMA), through the development of the Strzelecki Integrated Management Strategy (Strzelecki IMS), in an effort to better integrate the management of one of the regions most prominent landscapes � the Strzelecki Ranges.
The Strzelecki Integrated Management Strategy is based on the aspirational target of creating and maintaining a balanced and sustainable landscape. This approach is focused on integrating the management of the various asset classes; to support and enhance ecological resilience whilst recognising and conserving the productive capacity of the landscape in the face of an increasingly uncertain climatic future.
The Strzelecki Integrated Management Strategy was developed to identify and describe, in a transparent, rational and comprehensive manner, local scale priority asset areas for management. This document is a strategic resource which will assist in formulating subsequent local area plans for effective natural resource management.
A computer based Geographic Information System (GIS) model has been developed as a tool to assist in delineating Priority Asset Areas within the landscape. The GIS model provides a unique method for spatially representing and valuing the various ecosystem services identified as occurring within the Strzelecki Landscape.
The use of ecosystem services rather than traditional asset groupings has allowed the recognition of the multiple services provided by one specific biophysical asset, while also allowing recognition of single ecosystem services that may be provided by multiple biophysical assets. At present this approach to valuing the landscape is limited by the quantity of data that is available to accurately capture ecosystem service values, however there is much scope for improving the available data through future research and data development.
Eight Priority Asset Areas were identified through the outputs of the GIS model, using a prioritisation method based on the principles of the asset based approach and the desire to enhance ecosystem resilience. Priority Asset Areas describe the locations where the priority assets occur, however the threats to those assets may occur either within or outside the priority asset areas. As such, collaborative local area planning should result in the maximisation of multiple benefits to biophysical assets and their associated ecosystem services.
Priority Asset Area descriptions have been compiled to provide a resource for local area planning. Each description provides:
A general description of the Priority Asset Area, A summary of the ecosystem service values achieved by the Priority Asset Area, A description of the major biophysical attributes contributing to the ecosystem service
values of the Priority Asset Area, and A summary of links identified between the Priority Asset Area and other existing
plans and strategies.

Strzelecki Integrated Management Strategy
x
The general locations of the eight Priority Asset Areas are described in Table 1, with reference to the Appendix containing the full Priority Asset Area description. Figure 1 shows the location of the Priority Asset Areas within the landscape, overlayed with the Final Model Output layer from the GIS model.
Table 1: Priority Asset Areas - General location and Appendix reference
Priority Asset Area General Location Description WGCMA Catchment Ecosystem
Appendix
Priority Asset Area A Mt Worth Bunurong Coast CE / Latrobe CE
2.1
Priority Asset Area B Narracan Creek Latrobe CE 2.2 Priority Asset Area C Mirboo North Regional
Park/Darlimurla State Forest Bunurong Coast CE 2.3
Priority Asset Area D Billy�s Creek/Morwell National
Park Latrobe CE 2.4
Priority Asset Area E Merrimans Creek/Tarra Bulga National Park/Tarra River
Ninety Mile Beach CE / Corner Inlet CE
2.5
Priority Asset Area F Alberton West State Forest Corner Inlet CE 2.6 Priority Asset Area G Agnes River Corner Inlet CE 2.7 Priority Asset Area H Korumburra/Leongatha Bunurong Coast CE 2.8
The Strzelecki Integrated Management Strategy is a strategic resource to assist in formulating subsequent local area plans for Priority Asset Areas. Effective natural resource management planning for the Priority Asset Areas should be guided by the information provided in this document.
Plans and strategies relevant to the Priority Asset Areas should also be consulted to ensure the most appropriate and consistent local area planning and on-ground delivery is achieved. Specific requirements and measures, such as locations and quantities of intervention, delivery mechanisms, or targets for improvement, are most appropriately developed through the coordination of stakeholders intending to participate in local area planning and delivery.
The Strzelecki Integrated Management Strategy identifies Priority Asset Areas where a collaborative approach to planning, and an integrated approach to delivery, will promote stakeholder participation and improve the overall success of natural resource management programs in the Strzelecki Landscape.
The information provided in this report is current to the date of release. It is recommended that the Strzelecki Integrated Management Strategy be reviewed within five years of its release (no latter than 2014).

West Gippsland Catchment Management Authority
xi
Figure 1: Strzelecki IMS Final Model Overlay showing Priority Asset Areas


West Gippsland Catchment Management Authority
1
1 Introduction
1.1 Background The Strzelecki Integrated Management Strategy has been prepared by the West Gippsland Catchment Management Authority (WGCMA), through the development of the Strzelecki Integrated Management Strategy (Strzelecki IMS), in an effort to better integrate the management of one of the regions most prominent landscapes � the Strzelecki Ranges.
Contemporary natural resource management has tended to focus on singular asset classes as the driver for management intervention, whether it is to improve a degraded asset or protect a high value asset. The need for more integrated and collaborative planning has risen from the desire to build greater ecological resilience within natural systems, and through the recognition of the inter-connected nature of all asset classes.
Integrated Management Strategies (IMSs) aim to focus work to create long term benefits through collaborative planning and a whole-of-landscape approach (DSE 2008). A major impetus in the need for an integrated, whole-of-landscape approach is the realisation that there is little point in addressing one threat to an asset if another unmanaged threat will negate any efforts undertaken.
When applied in an integrated and collaborative way, well informed land management can provide an opportunity for land managers to achieve multiple benefits in a cost effective manner. IMSs are an opportunity to coordinate efforts so as to attract co-investment by governments (Australian and Victorian), community groups and individuals (DSE 2008).
1.2 Aim The aim of the Strzelecki IMS was to develop a strategic planning document to guide and assist successful local-scale natural resource management initiatives by:
Providing a method for spatially representing and valuing ecosystem services that occur within the landscape using a computer based Geographic Information System (GIS) model,
Identifying Priority Asset Areas within the Strzelecki Ranges based on modelled ecosystem service values,
Describing the biophysical properties of the Priority Asset Areas that are influencing the ecosystem service values,
Linking Priority Asset Areas to existing plans and strategies, Identifying potential threats to the Priority Asset Areas, and Informing and providing guidance around the development of finer scale local area
plans for the management of Priority Asset Areas.

Strzelecki Integrated Management Strategy
2
1.3 Scope The Strzelecki IMS has been developed for the landscape delineated by the Strzelecki Ranges Bioregion contained within the boundary of the WGCMA region, an area of 298,437 hectares. Figure 2 shows the geographic boundary of the study area which forms the upper catchment to Corner Inlet, Bunurong Coast, and part of the Latrobe River and Ninety Mile Beach Catchment Ecosystems. For ease of articulation, the defined landscape shall be referred to as the Strzelecki Landscape for the remainder of the document.
Figure 2: Strzelecki Integrated Management Strategy Study Area (Strzelecki Landscape) showing WGCMA Catchment Ecosystem
The development of the Strzelecki IMS draws on the principles for planning outlined in the DSE Land Asset-based Approach Framework (Annett and Adamson 2008). This framework outlines the fundamentals of an approach to natural resource management that ��focuses on protecting and maintaining biophysical assets that are of value to people, rather than focussing on issues� (Annett and Adamson 2008).
Additional to this, the Strzelecki IMS is focused on integrating the management of the various asset classes, to support and enhance ecological resilience whilst recognising and
Strzelecki IMS Study area showing WGCMA Catchment Ecosystems
Strzelecki IMS Study Area

West Gippsland Catchment Management Authority
3
conserving the productive capacity of the land. This approach is based on the aspirational target of creating and maintaining a balanced and sustainable landscape.
The Strzelecki IMS does not set out to create new data. Relevant existing data has been used to generate the best possible output in the time allocated to the project. Gaps in knowledge and areas where data could be improved or updated are identified to highlight the limitations of this approach, and to identify areas of research that could better inform the GIS model.
The information provided in the Strzelecki IMS Strategic Plan report will be current to the date of release. It is recommended that the Strzelecki Integrated Management Strategy be reviewed within five years of its release (no latter than 2014).
1.4 Purpose The Strzelecki Integrated Management Strategy should be viewed as a strategic resource for assisting in formulating subsequent local area plans to achieve multiple benefits through mutual effort.
Recent State and Federal Government policies have indicated that collaborative planning and partnerships between land managers and Government Agencies will be important to the success of natural resource management initiatives. The Strzelecki Integrated Management Strategy provides a resource to inform of locations where collaborative efforts may have the greatest net benefit.
Although IMSs take a whole-of-landscape approach, it is at a local scale that detailed planning and on-ground works are best achieved. The key to this is through the identification of local scale priority areas for management in a transparent, rational and comprehensive manner. The Strzelecki IMS provides this transition from landscape scale perspective to local scale.
The benefit of GIS modelling is that it allows for updated, more informed data to be incorporated as it becomes available. The capacity to update and improve data creates a �live� tool, providing planners the opportunity to re-evaluate priority asset areas based on the latest information as it comes to hand.
The method adopted in the Strzelecki IMS also allows for flexibility and ingenuity in terms of developing and implementing best management practices and on-ground works. Local action plans can be developed through collaboration with relevant stakeholders, creating achievable targets agreed to by all participants.

Strzelecki Integrated Management Strategy
4
2 Ecosystem Services Approach The Strzelecki IMS has developed a method for spatially representing and valuing ecosystem services that occur within the Strzelecki Landscape using a computer based GIS model.
Section 2 of the Strzelecki Integrated Management Strategy explains the theory behind ecosystem services and the benefits of adopting this approach to assessing the landscape.
Section 3 explains the method employed in utilising ecosystem services to assess the Strzelecki Landscape through GIS modelling.
2.1 Ecosystems and Ecosystem Services
2.1.1 Ecosystems An ecosystem is defined in the Victorian Government�s Land and biodiversity at a time of
climate change � Green Paper (DSE 2008) as:
��all the organisms in a community, together with the associated physical environmental factors (living and non-living) with which they interact�.
There is no scale that defines an ecosystem. Ecosystems are usually delineated by a common biophysical characteristic in which the �community� interact. There is no rule that
says an ecosystem must be a natural or unmodified system. Generally, the complexity of an ecosystem increases with an increase in physical size.
An entire river catchment could be regarded as an ecosystem, as could a large rural town, or a single paddock of a farm property. For this reason, it is important to clearly define the physical bounds of the ecosystem to be assessed.
The physical area defined as an ecosystem for the Strzelecki IMS assessment is the 298,437 hectare Strzelecki Landscape. Figure 2 identifies the location and boundaries of the ecosystem being considered in the Strzelecki IMS.
2.1.2 Ecosystem Services Ecosystem services are biophysical services or functions provided by the ecosystem. The Land and biodiversity at a time of climate change � Green Paper (DSE 2008) defines ecosystem services as being:
��the role played by organisms in creating a healthy environment for human
beings, from production of oxygen to soil formation and maintenance of water quality�.
In essence, ecosystem services are any benefits humans perceive that a functioning ecosystem provides, whether it is pristine wilderness or a highly modified landscape. Ecosystem services flow from the interaction of biophysical assets whether living or non-living (Annett and Adamson 2008).
A conceptual diagram of ecosystem services is presented in Figure 3, where the interaction of the biophysical assets is central to the functioning of the ecosystem, and
West Gippsland Catchment Management Authority
5
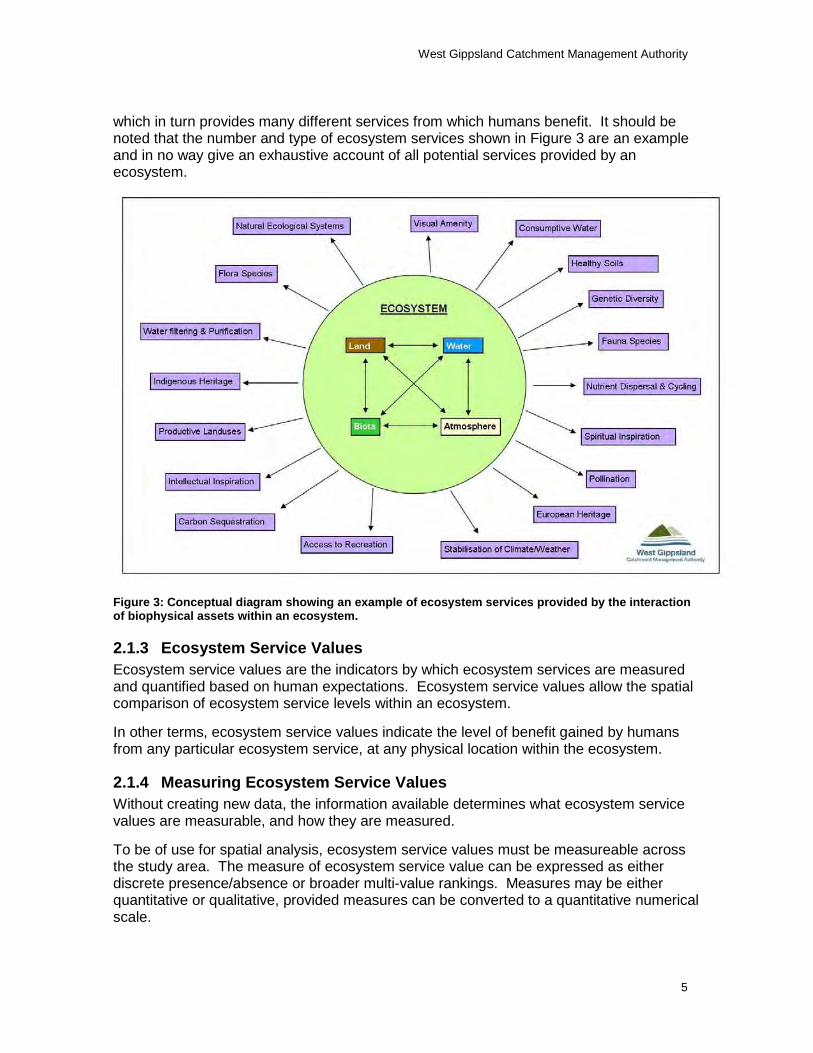
which in turn provides many different services from which humans benefit. It should be noted that the number and type of ecosystem services shown in Figure 3 are an example and in no way give an exhaustive account of all potential services provided by an ecosystem.
Figure 3: Conceptual diagram showing an example of ecosystem services provided by the interaction of biophysical assets within an ecosystem.
2.1.3 Ecosystem Service Values Ecosystem service values are the indicators by which ecosystem services are measured and quantified based on human expectations. Ecosystem service values allow the spatial comparison of ecosystem service levels within an ecosystem.
In other terms, ecosystem service values indicate the level of benefit gained by humans from any particular ecosystem service, at any physical location within the ecosystem.
2.1.4 Measuring Ecosystem Service Values Without creating new data, the information available determines what ecosystem service values are measurable, and how they are measured.
To be of use for spatial analysis, ecosystem service values must be measureable across the study area. The measure of ecosystem service value can be expressed as either discrete presence/absence or broader multi-value rankings. Measures may be either quantitative or qualitative, provided measures can be converted to a quantitative numerical scale.
Strzelecki Integrated Management Strategy
6
Ecosystem service value measures ideally reflect the full range of values attributable to the ecosystem service. However, in many cases this is not feasible due to a lack of appropriate data.
Databases set up to capture multiple values of a singular asset class within the environment, such as the RiVERS database which was developed for major river reaches, are ideal for use in an ecosystems services approach. Relevant values can be selected from the one source to value the ecosystem services of surface water courses as they fit. However, the majority of datasets currently available do not capture this level of detail and as a result rely on simple or less refined indicators for surrogates.
This difficulty in sourcing appropriate ecosystem service valuation is further complicated by the nature of the ecosystem services. Some ecosystem service values can be clearly defined by comparing biophysical properties of an ecosystem, or economic return generated by the service. Alternatively, other ecosystem services, such as spiritual or philosophical services, are less tangible measures of benefits to humans and are often subjective and difficult to represent in a spatial format.
2.2 Ecosystem Services and Ecosystem Service Values utilised in the Strzelecki IMS
2.2.1 Identification of measureable ecosystem services A desktop analysis was conducted of the spatial datasets currently available to the WGCMA for the Strzelecki Landscape. A list was compiled of ecosystem service values believed to be relevant, measureable, available and collected at an appropriate scale to suit the needs of the Strzelecki IMS.
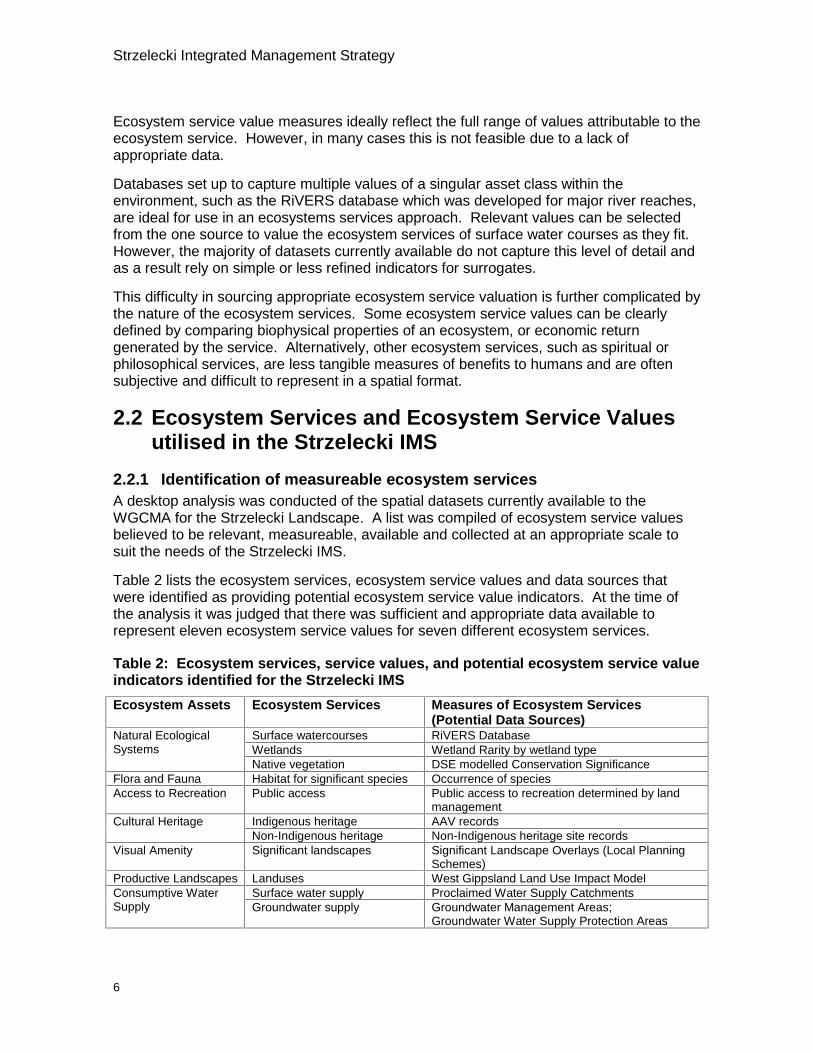
Table 2 lists the ecosystem services, ecosystem service values and data sources that were identified as providing potential ecosystem service value indicators. At the time of the analysis it was judged that there was sufficient and appropriate data available to represent eleven ecosystem service values for seven different ecosystem services.
Table 2: Ecosystem services, service values, and potential ecosystem service value indicators identified for the Strzelecki IMS
Ecosystem Assets Ecosystem Services Measures of Ecosystem Services (Potential Data Sources)
Surface watercourses RiVERS Database Wetlands Wetland Rarity by wetland type
Natural Ecological Systems
Native vegetation DSE modelled Conservation Significance Flora and Fauna Habitat for significant species Occurrence of species Access to Recreation Public access Public access to recreation determined by land
management Indigenous heritage AAV records Cultural Heritage Non-Indigenous heritage Non-Indigenous heritage site records
Visual Amenity Significant landscapes Significant Landscape Overlays (Local Planning Schemes)
Productive Landscapes Landuses West Gippsland Land Use Impact Model Surface water supply Proclaimed Water Supply Catchments Consumptive Water
Supply Groundwater supply Groundwater Management Areas; Groundwater Water Supply Protection Areas

West Gippsland Catchment Management Authority
7
2.2.2 Grouping Ecosystem Services by the Triple Bottom Line Ecosystem services identified in the desktop analysis were grouped based on their capacity to support Triple Bottom Line (TBL) components; environmental, social, and economic. The purpose of grouping the ecosystem services based on TBL is to:
Clearly define what is being valued in each ecosystem service, Avoid double or triple counting ecosystem service values were unbundled into key
value components while acknowledging the connections between TBL elements, Remove the influence of undetermined subjectiveness in the data sources.
TBL Grouping was made by the steering committee based on the following definitions:
Environmental ecosystem services � ecosystem services that support or provide for biodiversity and ecological resilience
Social ecosystem services � ecosystem services that provide or support society�s
��spiritual, cultural heritage and recreational values�� (WGCMA 2004). Economic ecosystem services � ecosystem services that support or generate
economic activity.
Table 3 shows the ecosystem services grouped by TBL. Figure 4 provides a conceptual interpretation of the relationship between ecosystem services and the TBL components.
Table 3: Ecosystem services grouped according to Triple Bottom Line
Triple Bottom Line
Ecosystem Service
Ecosystem Service Value
Ecosystem Service Value Measures/Indicators (Potential Data Sources)
Surface watercourses RiVERS Database Wetlands Wetland Rarity by wetland type
Natural Ecological Systems
Native vegetation DSE modelled Conservation Significance
Environmental
Flora and Fauna Significant species Occurrence of species Access to Recreation
Public access Public access to recreation determined by land management
Indigenous heritage AAV records Cultural Heritage Non-Indigenous heritage
Non-Indigenous heritage site records
Social
Visual Amenity Significant landscapes Significant Landscape Overlays (Local Planning Schemes)
Productive Landuse
Landuse West Gippsland Land Use Impact Model
Surface water supply Proclaimed Water Supply Catchments
Economic
Consumptive Water Supply
Groundwater supply Groundwater Management Areas; Groundwater Water Supply Protection Areas

Strzelecki Integrated Management Strategy
8
Figure 4: Conceptual diagram describing link between ecosystems and ecosystem service values, incorporating grouping based on the Triple Bottom Line
2.3 Benefits and Limitations of the Strzelecki IMS Ecosystem Services Approach
The benefit of approaching a landscape analysis from the perspective of ecosystem services is that it allows the recognition of the multiple services that may be provided by one specific biophysical asset. It also creates the capacity to account for a single ecosystem service which is provided by multiple biophysical assets.
For example, a water asset such as a river can have many ecosystem services. These may include supporting natural ecological systems, supporting significant flora and fauna, providing a recreational opportunity, providing visual amenity, cultural heritage significance, supporting productive landuse, and providing consumptive water.
At the same time, a biodiversity asset such as a native forest can have similar ecosystem services (ie. supporting natural ecological systems, significant species, etc), although the ecosystem service values might be expressed in different ways.
By dividing the ecosystem services into TBL components it is possible to reduce the risk of double counting ecosystem service values. The definitions outlined in Section 2.2.2 for grouping ecosystem services allows data to be analysed and used in a manner that expresses an indicator of an individual ecosystem service value, without compromising the integrity of the data or the intent of the ecosystem service being valued.

West Gippsland Catchment Management Authority
9
The main limitation with the Strzelecki IMS ecosystem services approach relates to the availability of suitable data. Ecosystem services are generally easy to identify and list for any landscape area, however little data is available to sufficiently quantify ecosystem service values. Major deficiencies in data availability are particularly evidenced around information that captures the social ecosystem service values. There is a great deal of scope for improving and generating additional data through research and studies particularly focussed on capturing ecosystem service values. Better data is likely to become available as the ecosystem services approach gathers momentum within natural resource management fields.

Strzelecki Integrated Management Strategy
10
3 GIS Model
3.1 Explanation of the Strzelecki IMS GIS Model A GIS model was designed and developed as a tool to provide spatial representation of the eleven ecosystem service values as they occur in the Strzelecki Landscape.
Eleven individual spatial layers were created to represent the ecosystem services identified in Table 3. These layers were then combined according to their TBL ecosystem service groupings to deliver an environmental, a social and an economic layer.
The combination of these TBL layers provides a final model output layer that spatially represents the total combined ecosystem service values for the landscape. This layer shows where the combined environmental, social and economic ecosystem service values are the highest. This high level approach may result in significant single value assets being overlooked in the final model output as this approach does specifically target multiple benefits. Figure 5 provides a conceptual representation of the GIS model structure from individual ecosystem service layers through to the final model output.
Figure 5: Conceptual representation of the GIS model structure used in the Strzelecki IMS

West Gippsland Catchment Management Authority
11
3.2 GIS Model Inputs The eleven spatial layers that inform the Strzelecki IMS GIS model were tailored to represent the eleven ecosystem service values as they occur in the Strzelecki Landscape. Existing datasets were utilised in creating each layer, some layers combining information from more than one source to achieve the desired information.
Each individual spatial layer was assigned a common zero (0) to one (1) scale. This is an essential step in ensuring each layer has an even weighting of influence on the model. Table 4 provides a brief description of the eleven individual input layers, and the spatial layers are presented in Figures 6 � 16. A detailed description of each individual input layer, explaining the rules, assumptions and limitations of the data used in the GIS model can be found in Appendix 1.
Table 4: Description of individual input layers to the Strzelecki IMS GIS model
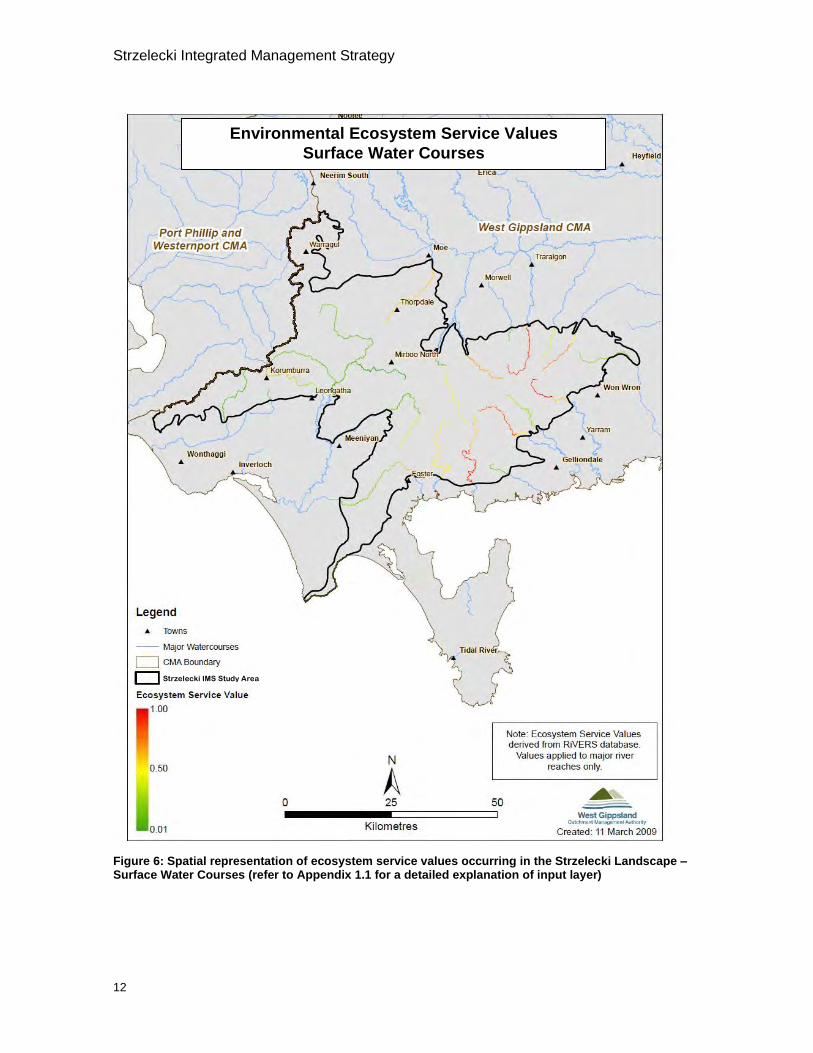
GIS Model Layer Description Figure Surface Water Courses
Quantitative value for major river reaches derived from the Environmental component of the RiVERS database.
6
Wetlands Quantitative value derived from wetland rarity classification for wetlands >1ha (as identified in the WGCMA Wetlands Database).
7
Native Vegetation Quantitative value derived from the Conservation Significance component of the NV2005_LSIMP model, which values existing native vegetation by combining Bioregional Conservation Status data with modelled native vegetation quality data.
8
Significant Flora and Fauna
Quantitative value derived from spatial analysis of occurrence of National, State or Regionally recognised significant species recorded across the study area.
9
Public Access Quantitative value derived from the presence/absence of freely available and publicly accessible recreation based on the type of land management.
10
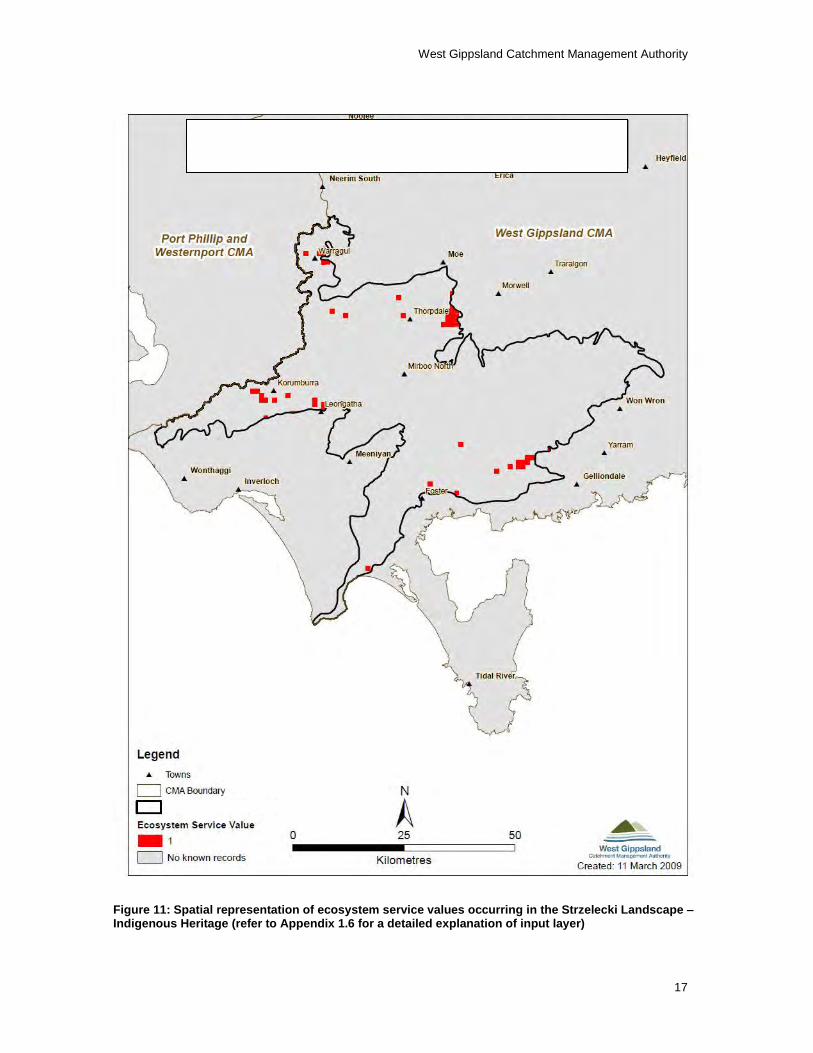
Indigenous Heritage Quantitative value derived from the presence/absence of AAV records across the study area.
11
Non-Indigenous Heritage
Quantitative value derived from the presence/absence of non-Indigenous heritage records across the study area.
12
Significant Landscapes
Quantitative value derived from the presence/absence of a Local Planning Scheme Significant Landscape Overlay across the study area.
13
Landuse Quantitative value derived from the Economic Landuse Values used in the development of the Land Use Impact Model (LUIM) for the West Gippsland Soil Erosion Management Plan.
14
Surface Water Supply Quantitative value derived from the presence/absence of proclaimed water supply catchments across the study area.
15
Groundwater Supply Quantitative value derived from the presence/absence of Groundwater Management Areas and/or Groundwater Water Supply Protection Areas across the study area.
16
Strzelecki Integrated Management Strategy
12
Environmental Ecosystem Service Values Surface Water Courses
Strzelecki IMS Study Area
Figure 6: Spatial representation of ecosystem service values occurring in the Strzelecki Landscape � Surface Water Courses (refer to Appendix 1.1 for a detailed explanation of input layer)

West Gippsland Catchment Management Authority
13
Environmental Ecosystem Service Values Wetlands
Strzelecki IMS Study Area
Figure 7: Spatial representation of ecosystem service values occurring in the Strzelecki Landscape � Wetlands (refer to Appendix 1.2 for a detailed explanation of input layer)

Strzelecki Integrated Management Strategy
14
Figure 8: Spatial representation of ecosystem service values occurring in the Strzelecki Landscape � Native Vegetation and Eucalypt Plantation (refer to Appendix 1.3 for a detailed explanation of input layer)
Environmental Ecosystem Service Values Native Vegetation and Eucalypt Plantation
Strzelecki IMS Study Area

West Gippsland Catchment Management Authority
15
Figure 9: Spatial representation of ecosystem service values occurring in the Strzelecki Landscape � Significant Flora and Fauna (refer to Appendix 1.4 for a detailed explanation of input layer)
Environmental Ecosystem Service Values Significant Species
Strzelecki IMS Study Area

Strzelecki Integrated Management Strategy
16
Figure 10: Spatial representation of ecosystem service values occurring in the Strzelecki Landscape � Public Access (refer to Appendix 1.5 for a detailed explanation of input layer)
West Gippsland Catchment Management Authority
17
Figure 11: Spatial representation of ecosystem service values occurring in the Strzelecki Landscape � Indigenous Heritage (refer to Appendix 1.6 for a detailed explanation of input layer)

Strzelecki Integrated Management Strategy
18
Figure 12: Spatial representation of ecosystem service values occurring in the Strzelecki Landscape � Non-Indigenous Heritage (refer to Appendix 1.7 for a detailed explanation of input layer)
Environmental Ecosystem Service Values Non Indigenous Heritage
Strzelecki IMS Study Area

West Gippsland Catchment Management Authority
19
Figure 13: Spatial representation of ecosystem service values occurring in the Strzelecki Landscape � Significant Landscapes (refer to Appendix 1.8 for a detailed explanation of input layer)
Environmental Ecosystem Service Values Significant Landscapes
Strzelecki IMS Study Area

Strzelecki Integrated Management Strategy
20
Figure 14: Spatial representation of ecosystem service values occurring in the Strzelecki Landscape � Landuse (refer to Appendix 1.9 for a detailed explanation of input layer)
Environmental Ecosystem Service Values Landuse
Strzelecki IMS Study Area

West Gippsland Catchment Management Authority
21
Figure 15: Spatial representation of ecosystem service values occurring in the Strzelecki Landscape � Surface Water Supply (refer to Appendix 1.10 for a detailed explanation of input layer)
Environmental Ecosystem Service Values Surface Water Supply
Strzelecki IMS Study Area

Strzelecki Integrated Management Strategy
22
Figure 16: Spatial representation of ecosystem service values occurring in the Strzelecki Landscape � Groundwater Supply (refer to Appendix 1.11 for a detailed explanation of input layer)
Environmental Ecosystem Service Values Groundwater Supply
Strzelecki IMS Study Area

West Gippsland Catchment Management Authority
23
3.3 Running the GIS Model A Raster grid with cell dimensions of 1km x 1km was overlayed on each individual input layer. Each cell of the overlay is attributed the corresponding ecosystem service value for the asset layer contained within each cell. This is a common GIS practice used in spatial analysis.
The selection of an appropriate cell size is very important to achieving an effective analysis. An appropriate cell size is one that is small enough to capture the detail required from the mapping, without making analysis overly complex or difficult (ESRI 2009). Trial of several cell size options showed 1km x 1km to be an appropriate dimension for use in the Strzelecki IMS.
The purpose for overlaying the 1km x 1km grid over each layer is to create relatively small land areas (100ha) that can represent and isolate high value locations within a landscape area of over 298,000ha. However, a limitation of this approach is that data in some layers may become spatially over represented. In other instances where data has been collected at a very fine scale the grid may reduce the resolution of the data, effectively diluting some values. Understanding this effect is important to understanding the model outputs.
The model was run with even weighting applied to each individual input layer. Each TBL layer was created by adding the applicable layers together to create one layer of environmental ecosystem service values, one layer of social ecosystem service values, and one layer of economic ecosystem service values.
The total cell values of each TBL layer were then converted to a zero (0) to one (1) score range. This is a necessary step to ensure that the model remains evenly weighted, with no bias towards any of the TBL layers. A common scale also ensures consistency of approach and outputs that can be easily comprehended and interpreted.
The final step in running the GIS model was to combine the three TBL layers to create the Final Model Output. For consistency, the Final Model Output was converted to a zero (0) to one (1) score range.

Strzelecki Integrated Management Strategy
24
3.4 GIS Model Outputs
3.4.1 Environmental Layer The Environmental layer, one of three TBL layers, is presented in Figure 17. This layer is the modelled output from overlaying the four environmental ecosystem service layers; Surface Water Courses, Wetlands, Native Vegetation, and Significant Species. The Environmental layer shows the spatial distribution of relative values for combined environmental ecosystem services provided by the landscape.
When considering the Environmental layer it is very important to remember the context in which it was created. The Environmental layer created through the Strzelecki IMS GIS model rates landscape areas based on ecosystem service values. The Environmental layer shows areas where the biophysical assets of the Strzelecki Landscape are interacting to create benefits fulfilling human expectations of a landscape, and indicates the relative value of these benefits in terms of their capacity to support or provide for biodiversity and ecological resilience.
The Environmental layer indicates to natural resource managers where environmental ecosystem service values co-exist in the landscape. This layer relies on the assumption that local area plans will be best tailored to achieve multiple benefit outcomes for environmental gain where multiple environmental ecosystem service values occur. Additionally, the promotion of potential benefits to environmental values in these areas should lead to greater levels of enthusiasm, support and uptake of local area plans.
The highest cell value achieved in the Environmental layer was 0.63, and less than 1% of the Strzelecki Landscape achieved a value of 0.5 or greater. The highest value cells are closely correlated to short sections of rivers and areas of native vegetation that interact with the highest value significant species areas. Wetland layer values have a small but significant influence on individual cells, but a broader effect is constrained by the spatially discrete nature of the data.
The Environmental layer is not a definitive description of the most significant conservation areas of the landscape. It is a map indicating relative values based on capacity of the landscape to provide or support environmental ecosystem services. The relatively low cell values achieved should not be interpreted as an indication that the Strzelecki Landscape has low environmental value. Instead, it should be interpreted that there are few areas where the four environmental ecosystem service values have been identified to coexist, possibly explained by the highly modified condition of the Strzelecki Landscape.
Natural resource managers interested in a single asset may find that some areas known to be environmentally significant for a specific asset class do not receive as high a relative value as would have been thought. This is a result of the multiple objective nature of the model, where an area could be high value for one input layer but very low in the others. As a result, the area achieves a low or moderate value when the ecosystem service value layers are combined.
Scale is very important to consider when reviewing an output such as the Environmental layer. In this broad scale landscape analysis many cells in the study area receive a zero score. This does not mean that these areas contain no environmental ecosystem service values. It is highly likely that these areas would be found to have environmental ecosystem service values through a local scale analysis, such as for a sub-catchment area. However, the parameters required to run a landscape scale analysis do not provide the capacity to recognise the finer level of detail that could inform a more local scale analysis.

West Gippsland Catchment Management Authority
25
Figure 17: Modelled spatial representation of known Environmental ecosystem service values as they occur in the Strzelecki Landscape � Environmental Layer
Strzelecki IMS GIS Model Output Environmental Layer
Strzelecki IMS Study Area

Strzelecki Integrated Management Strategy
26
3.4.2 Social Layer The Social layer, one of three TBL layers, is presented in Figure 18. This layer is the modelled output from overlaying the four social ecosystem service layers; Public Access, Indigenous Heritage, Non-Indigenous Heritage, and Significant Landscapes. The Social layer shows the spatial distribution of relative values for combined social ecosystem services provided by the landscape.
When considering the Social layer it is very important to remember the context in which it was created. The Social layer created through the Strzelecki IMS GIS model rates landscape areas based on ecosystem service values. The Social layer shows areas where the biophysical assets of the Strzelecki Landscape are interacting to create benefits fulfilling human expectations of a landscape, and indicates the relative value of these benefits in terms of their capacity to support or provide for society�s spiritual and cultural
and recreational needs.
The Social layer of the Strzelecki IMS GIS model indicates to natural resource planners where social ecosystem service values co-exist in the landscape. This layer relies on the assumption that where higher levels of social ecosystem service values occur, protection and enhancement of the social values of the landscape can underpin integrated approaches to local area planning. Additionally, the promotion of potential benefits to social values in these areas should lead to greater levels of enthusiasm, support and uptake of local area plans.
The highest cell value achieved in the Social layer was 0.75, and less than 3% of the Strzelecki Landscape achieved a Social layer value of 0.5 or greater. Generally, the higher value cells are clustered around Crown Land areas, their value punctuated by the presence of Indigenous and Non-Indigenous Heritage values.
The Significant Landscape input has a small influence on the Social layer outputs. The areas defined as Significant Landscapes only correlate with multiple other social ecosystem service values around the Baw Baw Shire Council declared Significant Landscape Overlay. The Bass Coast Shire Council Significant Landscape Overlay does not overlay any other ecosystem service values identified through the Strzelecki IMS.
Approximately 63% of the Social layer is valued as zero (0). This is a result of the spatially discrete nature of the input data. The GIS model input layer descriptions for the social ecosystem service values (Appendices 1.5 � 1.8) identifies that values portrayed using spatially discrete data will result in large areas of the landscape receiving no recognised value.
The Social layer component is the most limited TBL component of the Strzelecki IMS GIS model. The availability of suitable input data to create the individual social ecosystem service input layers is very limited. Although the social aspect of land management is often considered, very little quality data was found to be available to accurately and comprehensively inform any quantification of the landscape�s capacity to support social
values in the West Gippsland region.
This lack of quality data has resulted in a very rudimentary assessment of social ecosystem service values occurring in the Strzelecki Landscape. The development of a more sophisticated spatial dataset that better captures major social ecosystem service values, including community capacity to respond to management interventions, would better inform the GIS model developed for the Strzelecki IMS.

West Gippsland Catchment Management Authority
27
Figure 18: Modelled spatial representation of known Social ecosystem service values as they occur in the Strzelecki Landscape � Social Layer
Strzelecki IMS GIS Model Output Social Layer
Strzelecki IMS Study Area
Strzelecki Integrated Management Strategy
28
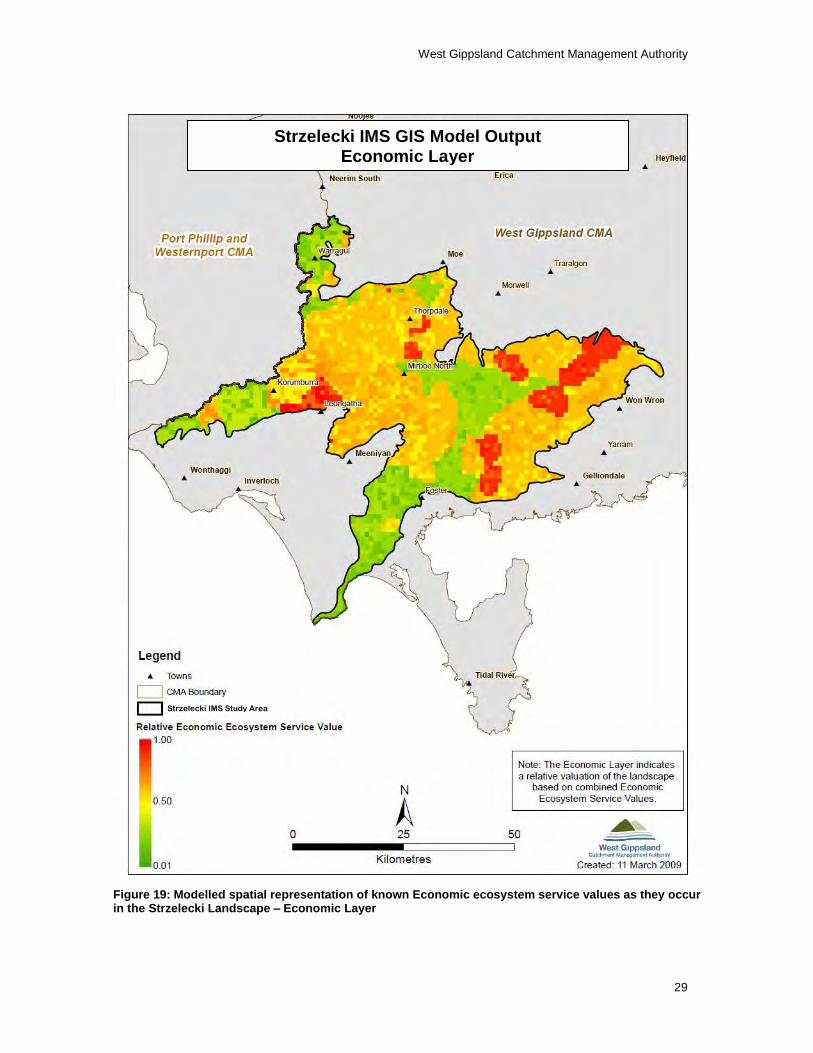
3.4.3 Economic Layer The Economic layer, one of three TBL layers, is presented in Figure 19. This layer is the modelled output from overlaying the three economic ecosystem service layers; Landuse, Surface Water Supply, and Groundwater Supply. The Economic layer shows the spatial distribution of relative values for combined economic ecosystem services provided by the landscape.
When considering the Economic layer it is very important to remember the context in which it was created. The Economic layer created through the Strzelecki IMS GIS model rates landscape areas based on ecosystem service values. The Economic layer shows areas where the biophysical assets of the Strzelecki Landscape are interacting to create benefits fulfilling human expectations of a landscape, and indicates the relative value of these benefits in terms of their capacity to support or generate economic activity.
The Economic layer indicates to natural resource planners where economic ecosystem service values co-exist in the landscape. This layer relies on the assumption that where higher levels of economic ecosystem service values occur, protection and enhancement of the economic values of the landscape can underpin integrated approaches to local area planning. Additionally, the promotion of potential benefits to economic values in these areas should lead to greater levels of enthusiasm, support and uptake of local area plans.
The highest cell value achieved in the Economic layer was 1.00 (maximum achievable), and approximately 68% of the Strzelecki Landscape achieved an Economic layer value of 0.5 or greater. Unlike the Environmental and Social layers, the Economic layer achieved economic ecosystem service values for almost all cells in the Strzelecki Landscape, with only a few partial cells around the perimeter of the study area being scored zero (0).
This extent of values is due to the spatial influence of the Landuse layer input, as the Landuse dataset is a spatially comprehensive evaluation of the entire landscape. Zero values are due to small discrepancies caused by differences in scale between the Strzelecki IMS GIS model and the Land Use Information Model, or by areas classified as �Water� or �Unknown� in the Land Use Information Model valuation.
The Economic layer ranks the landscape according to capacity to support or generate economic activity. The inclusion of two layers representing consumptive water has been identified as a potential compromise to the integrity of the model because of the physical link between the two layers.
Although there is a hydrological link between groundwater and surface water, the current arrangements for the trade of water does not recognise this link. The two water resources were included separately in the Strzelecki IMS GIS model as they are managed as separate commodities in a commercial sense. This issue of management is expected to be rectified in the future by water management authorities. New data may be available to update the model upon rectification of this issue.
When reviewing this output layer it is important to remember that these layers are intended to indicate the economic ecosystem service delivery capacity of the landscape only, and are designed to be unbiased to environmental or social values.
West Gippsland Catchment Management Authority
29
Figure 19: Modelled spatial representation of known Economic ecosystem service values as they occur in the Strzelecki Landscape � Economic Layer
Strzelecki IMS GIS Model Output Economic Layer
Strzelecki IMS Study Area

Strzelecki Integrated Management Strategy
30
3.4.4 Final Model Output The Final Model Output (FMO) layer was created by combining the Triple Bottom Line layers to produce a map indicating the total relative ecosystem service values of the Strzelecki Landscape. The FMO layer is presented in Figure 20.
When considering the FMO layer it is very important to remember the context of the data. The FMO layer is designed to indicate the relative value of areas of the landscape in terms of multiple ecosystem service provision. This layer is not an appraisal of one individual value, but the combination of eleven different values and how they correlate with one another.
This layer relies on the assumption that high ecosystem service value in a specific location indicates that the biophysical assets in that same location are more valuable than those in areas of lower ecosystem service value. Where higher levels of ecosystem service values occur, protection and enhancement of the values of the landscape can underpin integrated approaches to local area planning. Additionally, the promotion of benefits to ecosystem service values in these areas should lead to greater levels of enthusiasm, support and uptake of local area plans.
The highest cell value achieved in the FMO layer was 0.67, and less than 2% of the Strzelecki Landscape achieved a FMO layer value of 0.5 or greater. Upon first glance at the layer it appears that the highest value cells are found in areas identified as having high economic value. However, this is not the case, with the highest value locations in each of the environmental, social and economic layers causing higher value cells to be accentuated in the FMO layer.
The FMO is a map indicating relative values based on the capacity of the landscape to provide or support ecosystem services. The relatively low cell values achieved should not be interpreted as an indication that the Strzelecki Landscape is of low value. Instead, it should be interpreted that there are few areas where the highest value environmental, social and economic ecosystem services have been identified to coexist.
The most likely explanation for the highest ecosystem service values not co-existing is that many of the ecosystem service values are mutually exclusive. For example, generally cells containing the highest value productive Landuses (eg. irrigated dairy, mining) do not co-exist with cells of highest conservation significance Native Vegetation. Cells containing these landuses often contain some native vegetation, however the vegetation is usually of lower conservation significance; often degraded, fragmented and disconnected from other native vegetation. These cells are also unlikely to have a high Public Access value, being predominantly private land.
The FMO layer is useful to natural resource management planners who are planning for a fully integrated approach to achieving a sustainable landscape. The Strzelecki IMS GIS model has been designed to inform planners of the capacity of the landscape to support or provide ecosystem services, the function of all biophysical assets that humans appreciate and benefit from. Areas selected for their high ecosystem service values can then be analysed to understand the biophysical attributes that are supporting the values. It is the protection and enhancement of the biophysical attributes that will actually achieve a sustainable landscape.
The FMO layer can assist planners to gain a better understanding of what makes a particular area valuable, and provide insight to possible considerations required in the development of realistic and achievable targets. By understanding what makes a local area valuable, certain inferences can be made as to what potential management activities, and what scale of activity, would be positively or negatively received by land managers. Understanding the ecosystem service values of the landscape can also be used as potential leverage to promote enthusiasm and support for local area planning.

West Gippsland Catchment Management Authority
31
Figure 20: Modelled spatial representation of all known ecosystem service values as they occur in the Strzelecki Landscape � Final Model Output

Strzelecki Integrated Management Strategy
32

West Gippsland Catchment Management Authority
33
3.5 Benefits and Limitations of the Strzelecki IMS GIS Model
The GIS model developed for use in the Strzelecki IMS relies on suitable data to represent the ecosystem service values, but is limited by what was available at the time of development. In many instances, the quality of the data used to develop the ecosystem service values layers in the Strzelecki IMS could be improved through additional research and resourcing. Through additional resourcing and research it would also be possible to extend the list of ecosystem services and ecosystem service values presented in Table 3 and incorporate more ecosystem service values to the modelling.
High ecosystem service value areas might not always be the same areas as those selected based on the characteristics of individual asset classes alone. The Strzelecki IMS method does not intend to replace the need for singular asset approaches to natural resource management, but provides an alternative method of considering the landscape. It is a way to assign relative values to land areas for prioritisation and integrated planning. Integrated planning should draw information from plans and strategies for individual asset classes where they overlap/correspond with Strzelecki IMS Priority Asset Areas.
The GIS model used in developing the Strzelecki IMS does not need to be restricted to the Strzelecki Landscape and is replicable over any landscape area provided appropriate data can be sourced. The main considerations if intending to run the GIS model on a different landscape area are:
That the data available can be utilised to confidently capture some level of ecosystem service value.
That the scale of the grid cells used in the overlay analysis is appropriate to the landscape area being analysed.
That the model is a tool to assist in prioritisation, considering the landscape in terms of ecosystem service provision.

Strzelecki Integrated Management Strategy
34
4 Priority Asset Areas The Final Model Output (FMO) layer of the Strzelecki IMS GIS model was used to prioritise areas of the Strzelecki Landscape for management. The method used for prioritisation was influenced by the principles of the asset based approach, and the principle of enhancing ecosystem resilience. The Priority Asset Areas identified are priorities for local scale protection of biophysical assets.
4.1 Prioritisation Method
4.1.1 Asset Based Approach The asset based approach �focuses on protecting or maintaining biophysical assets that are of value to people, rather than focussing on issues� (Annett and Adamson 2008). This has been interpreted in the development of the Strzelecki IMS as implying that natural resource planning and management should be prioritised towards the highest value assets or asset areas. This interpretation assumes that the higher the overall benefit of the asset areas to people (ecosystem service value), the higher the priority for protection or maintaining the biophysical assets.
FMO layer values were filtered to identify the highest valued 5% of grid cells, representing approximately 15,000 hectares of the Strzelecki Landscape. Figure 21 illustrates this top 5% of the landscape Priority 1 Cells. Based on ecosystem service values, the Priority 1 Cells contain biophysical assets that are the most important for protection and enhancement through local scale planning and operations.
4.1.2 Ecosystem resilience Ecosystem resilience is defined as �the ability of an ecosystem to withstand and recover from environmental stresses and disturbances� (DSE 2008). Ecological resilience can be increased in natural ecological systems by planning to increase the quality, quantity, complexity and connectivity of the assets contributing to natural ecological systems. Through informed planning for increasing ecological resilience, land managers are also able to protect and enhance social and economic characteristics of the landscape.
For example, the revegetation of a cleared gully system to replicate a more natural condition has the potential to increase ecosystem resilience. Ecosystem benefits would include improved protection of river health and water quality, and enhanced quality, quantity and connectivity of biodiversity values. Soil stabilisation through revegetation of the gully system will also enhance the values of surrounding productive land and water supplies by reducing the effect of soil erosion and sedimentation. Each of these outcomes benefits the ecological resilience of the landscape, improving the capacity to withstand and recover from environmental stresses and disturbances such as droughts, floods and fires.
This principle is important for the identification of Priority 2 and 3 Cells as illustrated in Figure 21. Priority 2 Cells are the 6-10% highest value cells based on the FMO layer, and Priority 3 Cells are the 11-15% highest value cells. Priority 2 and 3 Cells identify landscape areas where the protection and enhancement of biophysical assets will be of greatest benefit to building ecological resilience around Priority 1 Cells. These areas also align with the asset based approach, representing the top 85th percentile of FMO layer values.
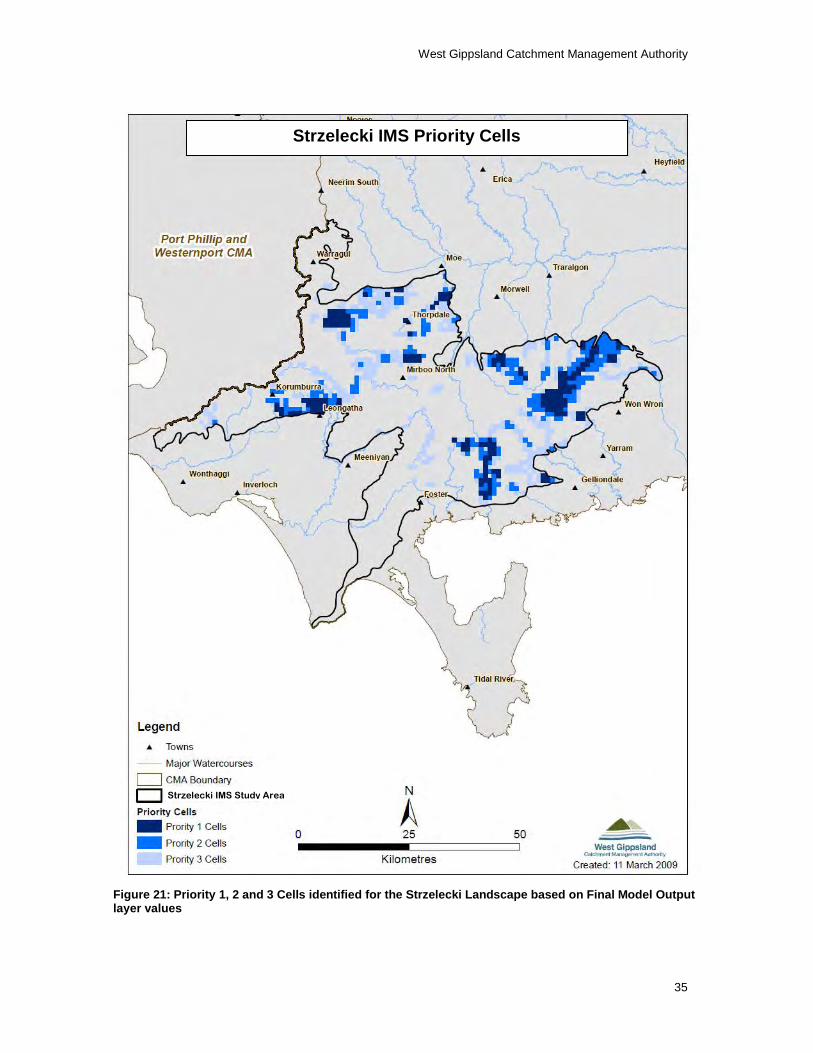
West Gippsland Catchment Management Authority
35
Figure 21: Priority 1, 2 and 3 Cells identified for the Strzelecki Landscape based on Final Model Output layer values
Strzelecki IMS Priority Cells
Strzelecki IMS Study Area

Strzelecki Integrated Management Strategy
36
4.2 Priority Asset Areas Eight Priority Asset Areas were delineated using the identified priority cells. Each Priority Asset Area is a key location for developing local action plans to achieve multiple outcomes within the Strzelecki Landscape. Figure 22 shows the location of the Priority Asset Areas identified for the Strzelecki Landscape, which are described in Section 5 of this document.
Priority Asset Areas were identified as clusters of four or more Priority 1 Cells. Priority 1 Cells are 1km x 1km (100ha) grid cells highlighting land areas containing biophysical assets that provide the highest level of ecosystem service value. Priority 2 Cells were included in Priority Asset Areas where they have a close spatial relationship with clusters of Priority 1 Cells.
Priority Asset Areas describe the locations where the priority assets occur, however the threats to those assets may occur either within or outside the priority asset areas. Priority Asset Areas should provide the best opportunity for creating and maintaining a sustainable landscape through local area planning. Although multiple outcomes can be achieved anywhere throughout a landscape, these Priority Asset Areas are the highest ecosystem service value localities within the Strzelecki Landscape, indicating where multiple benefits may be maximised. Local area planning in these Priority Asset Areas should be guided by local land managers to protect and enhance environmental, social and economic values.
Priority cells not included in Priority Asset Areas (predominantly Priority 3 Cells) provide an opportunity to improve connectivity within the landscape. The locations highlighted by these cells are significant for increasing landscape scale resilience where they provide a connection between Priority Asset Areas. Priority cells that are not included in a Priority Asset Area or do not provide a connection between Priority Asset Areas should still be considered as having local scale significance.
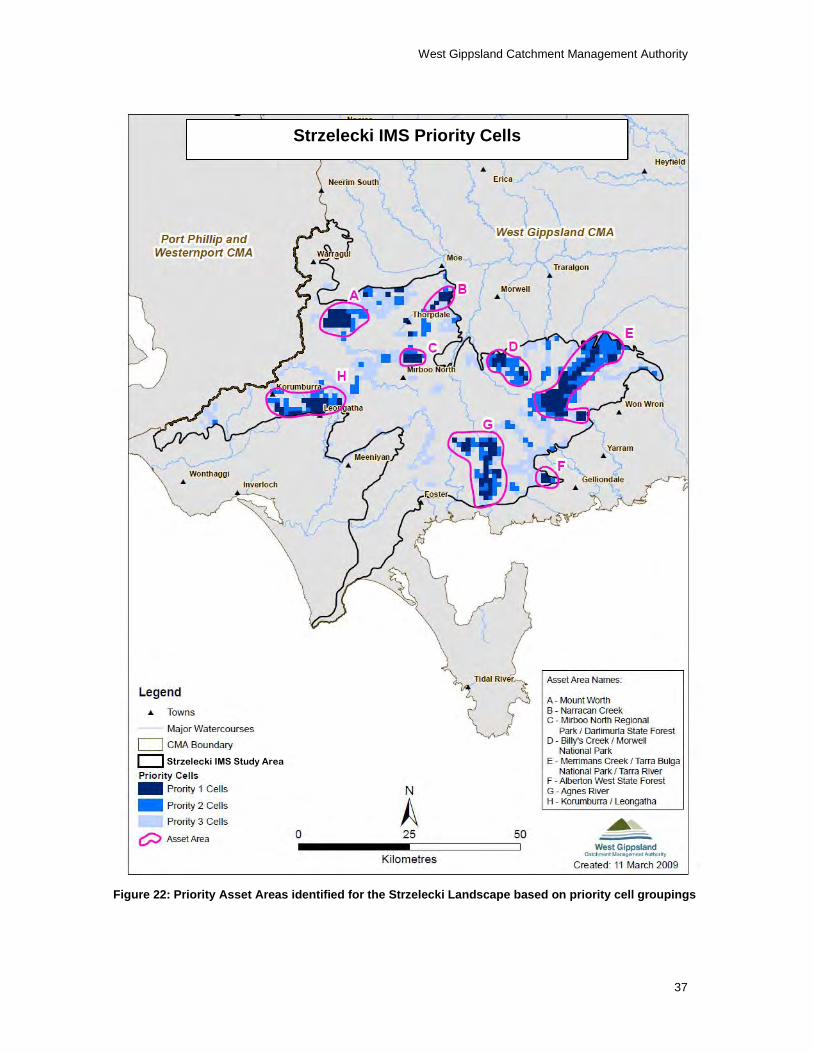
West Gippsland Catchment Management Authority
37
Figure 22: Priority Asset Areas identified for the Strzelecki Landscape based on priority cell groupings
Strzelecki IMS Priority Cells
Strzelecki IMS Study Area
Strzelecki Integrated Management Strategy
38
4.3 Priority Asset Area Descriptions Appendix 2 of the Strzelecki Integrated Management Strategy provides descriptive summaries of the Priority Asset Areas identified. Each Priority Asset Area description will provide:
A general description of the Priority Asset Area, A summary of the ecosystem service values achieved by the Priority Asset Area, A description of the major biophysical attributes contributing to the ecosystem service
values of the Priority Asset Area, and A summary of links identified between the Priority Asset Area and other existing
plans and strategies.
The information provided in the Priority Asset Area descriptions is provided to assist the development of local area plans through the collaboration and coordination of local land managers, service providers and government agencies. Table 5 describes the general locality of each Priority Asset Area, the related WGCMA Catchment Ecosystems, and the Appendix reference containing the Priority Asset Area description.
Table 5: Priority Asset Areas - General location and Appendix reference
Priority Asset Area General Location Description WGCMA Catchment Ecosystem
Appendix
Priority Asset Area A Mt Worth Bunurong Coast CE / Latrobe CE
2.1
Priority Asset Area B Narracan Creek Latrobe CE 2.2 Priority Asset Area C Mirboo North Regional
Park/Darlimurla State Forest Bunurong Coast CE 2.3
Priority Asset Area D Billy�s Creek/Morwell National
Park Latrobe CE 2.4
Priority Asset Area E Merrimans Creek/Tarra Bulga National Park/Tarra River
Ninety Mile Beach CE / Corner Inlet CE
2.5
Priority Asset Area F Alberton West State Forest Corner Inlet CE 2.6 Priority Asset Area G Agnes River Corner Inlet CE 2.7 Priority Asset Area H Korumburra/Leongatha Bunurong Coast CE 2.8
Priority Asset Areas are based on the assumptions that natural resource management intervention to protect and enhance biophysical assets will be best directed at areas where combined ecosystem service values are high. The most appropriate natural resource management intervention may take different forms depending on the key values and assets to be protected or enhanced, and the threats deemed to be posing the most significant risk to the assets. That is, an area may be high value because of high environmental values, another area high value because of high economic values. How to intervene, and what natural resource management interventions will be attractive for uptake by land managers, should be determined through threat analysis and planning conducted in collaboration with interested land managers.

West Gippsland Catchment Management Authority
39
5 Threat Analysis and Local Area Planning
5.1 Threat Analysis In the development of local area plans, location specific threat analysis should be used to inform planning. A list of threats for consideration in the development of local area plans has been compiled and consolidated from existing regional plans and strategies as a guide to the type of threats that may impact on specific assets within the Priority Asset Areas (refer to Appendix 3 for consolidated threats and references). Threats to natural resource suggested for consideration are as follows:
Soil erosion and disturbance Salinity and waterlogging Soil acidification Habitat loss � terrestrial biodiversity Fragmentation of native vegetation Pest plants Pest animals Land contamination Poor water quality (including excess nutrients) Over-consumption of water resources Changed stream bed and bank conditions Altered hydrological regimes Loss of natural wetland habitat and connectivity Altered fire regimes Urban encroachment Climate change Extreme events � Wildfire and Flooding
5.2 Local Area Planning The Strzelecki IMS was developed with the aspirational target of creating and maintaining a sustainable landscape. To achieve this, local area planning guided by the Strzelecki Integrated Management Strategy should aim to support and enhance ecological resilience whilst recognising and conserving the productive capacity of the land.
The asset based approach was used to identify Priority Asset Areas so as to protect and maintain the highest value assets in the landscape. In keeping with the intent of the asset based approach, local area planning should be guided by the following priorities:
Priority 1: Management activities should be targeted to protect Priority Asset Areas from threats.
Priority 2: Management activities should create links between Priority Asset Areas to promote ecosystem resilience.
A compilation of suggested natural resource management opportunities for local area planning can be found in Appendix 4. These are broadly defined management activities

Strzelecki Integrated Management Strategy
40
that could contribute to creating a more sustainable landscape through building greater ecosystem resilience within and between Priority Asset Areas. Potential benefits to biophysical assets and threats that could be addressed from the suggested natural resource management opportunities are also identified. The management opportunities identified are intended to assist in local area planning, and the information provided should not be regarded as either exclusive or prescriptive.
Local area planning should be guided by the information provided in this document, but should not rely on it alone. Plans and strategies relevant to the Priority Asset Areas should be consulted to ensure the most appropriate and consistent local area planning and on-ground delivery is achieved. Specific requirements and measures such as locations and quantities of intervention, delivery mechanisms, land tenure considerations and targets for improvement are most appropriately developed through the coordination of stakeholders intending to participate in local area planning and delivery.
An example of an integrated management strategy implementation proposal is presented in Appendix 5. This proposal includes indicative costs (GST exclusive, as of February 2009) as recommended by stakeholders, and reflects the anticipated cost for the delivery of targeted and coordinated multiple outcome local area planning. The example given in Appendix 5 has been set out to reflect the Victorian Investment Framework 2009 intermediate outcomes and performance descriptors.

West Gippsland Catchment Management Authority
41

Strzelecki Integrated Management Strategy
42
6 References Annett, S and Adamson, K (2008) Land Asset-Based Approach Framework. Department of Sustainability and Environment, Melbourne.
Corrick, AH and Norman, FI (1980) Wetlands of Victoria I. Wetlands and waterbirds of the Snowy River and Gippsland Lakes Catchment. Proceedings of the Royal Society of Victoria. 91:1-15.
DPCD (2008a) Using Victoria�s Planning System. Department of Planning and
Community Development. Accessed online 11.13am, 20/01/2009. http://www.dse.vic.gov.au/DSE/nrenpl.nsf/LinkView/F14D628BDCAC84F5CA256D4E001ADAEEE2544497E47593D1CA2572FF000BB0D9
DPCD (2008b) VPP Amended Clauses for VC50. Department of Planning and Community Development. Accessed online 11.41am, 20/01/2009. http://www.dse.vic.gov.au/planningschemes/VPPs/combinedPDfs/VPP_Amended_Clauses_VC50(2008_12_15).pdf
DPI (2005) Shallow Groundwater Flow Systems of the West Gippsland Region and the Implications for Salinity Management � June 2005. Department of Primary Industries, Victoria.
DSE (2004a) Forest Management Plan for Gippsland. Department of Sustainability and Environment, Melbourne, Victoria.
DSE (2004b) Biodiversity Action Planning � Strategic Overview for the Strzelecki Ranges Bioregion. Department of Sustainability and Environment, East Melbourne, Victoria.
DSE (2008) Green Paper � Land and biodiversity at a time of climate change. Department of Sustainability and Environment, Melbourne, Victoria.
EGCMA and WGCMA (2005) Gippsland�s Water Quality Action Plan 2005. East
Gippsland Catchment Management Authority and West Gippsland Catchment Management Authority.
ESRI (2009) ArcGIS 9.2 Online Help. Accessed 5.00pm, 08/01/2008. http://webhelp.esri.com/arcgisdesktop/9.2/index.cfm?id=2655&pid=2652&topicname=Cell_size_of_raster_data
Greening Australia (2006) West Gippsland Wetland Inventory Project � Report, July 2006. Greening Australia Victoria, Maffra, Victoria.
WGCMA (2003) West Gippsland Native Vegetation Plan 2003. West Gippsland Catchment Management Authority, Traralgon, Victoria.
WGCMA (2004) West Gippsland Regional Catchment Strategy 2004-2009. West Gippsland Catchment Management Authority, Traralgon, Victoria.
WGCMA (2005a) West Gippsland River Health Strategy 2005. West Gippsland Catchment Management Authority, Traralgon, Victoria.

West Gippsland Catchment Management Authority
43
WGCMA (2005b) West Gippsland Salinity Management Plan 2005. West Gippsland Catchment Management Authority, Traralgon, Victoria.
WGCMA (2008a) West Gippsland Wetlands Plan 2007. West Gippsland Catchment Management Authority, Traralgon, Victoria.
WGCMA (2008b) Soil Erosion Management Plan 2008. West Gippsland Catchment Management Authority, Traralgon, Victoria.
WGCMA (2008c) Macalister Land and Water Management Plan 2008. West Gippsland Catchment Management Authority, Traralgon, Victoria.
WGCMA (unpublished) West Gippsland Catchment Management Authority, Biodiversity Action Planning: Strzelecki Ranges Bioregion � Fish Creek Landscape Plan; Grand Ridge Landscape Plan; Narracan Landscape Plan; Strzelecki West Landscape Plan. West Gippsland Catchment Management Authority, Traralgon, Victoria.