isbn 0-14-146913-4 prentice-hall, 2006 copyright 2006 pearson/prentice hall. all rights reserved....
TRANSCRIPT

ISBN 0-14-146913-4Prentice-Hall, 2006
Copyright 2006 Pearson/Prentice Hall. All rights reserved.
Chapter 9
Testing the System
Pfleeger and Atlee, Software Engineering: Theory and Practice
Page 9.2© 2006 Pearson/Prentice Hall
Contents
9.1 Principles of system testing9.2 Function testing9.3 Performance testing9.4 Reliability, availability, and maintainability9.5 Acceptance testing9.6 Installation testing9.7 Automated system testing9.8 Test documentation9.9 Testing safety-critical systems9.10 Information System example9.11 Real-time example9.12 What this chapter means for you

Pfleeger and Atlee, Software Engineering: Theory and Practice
Page 9.3© 2006 Pearson/Prentice Hall
Chapter 9 Objectives
• Function testing• Performance testing• Acceptance testing• Software reliability, availability, and
maintainability• Installation testing• Test documentation• Testing safety-critical systems
Pfleeger and Atlee, Software Engineering: Theory and Practice
Page 9.4© 2006 Pearson/Prentice Hall
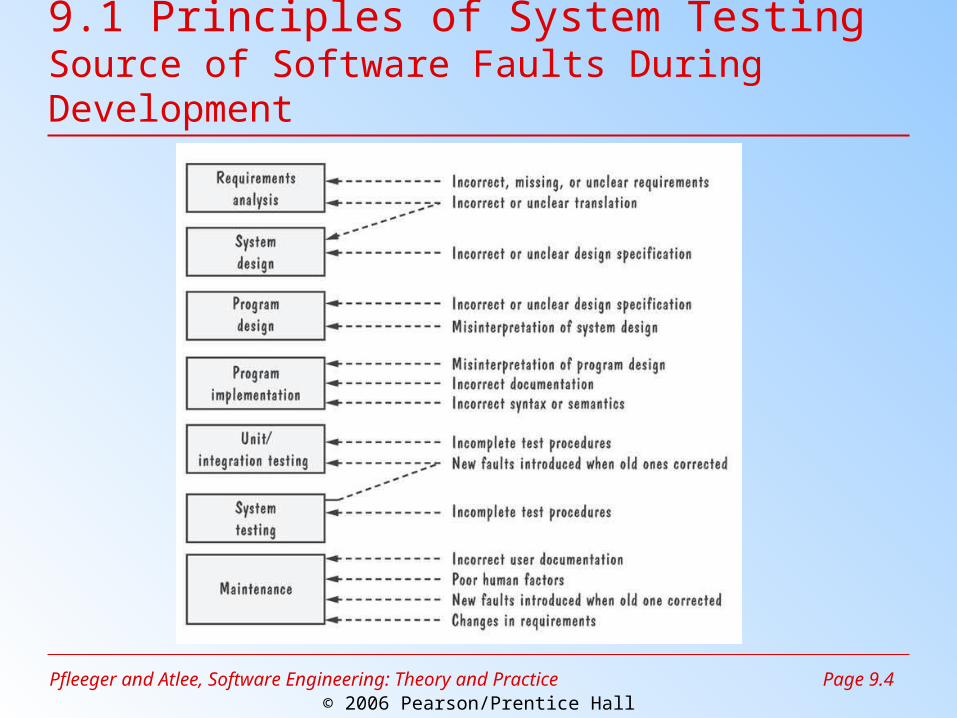
9.1 Principles of System TestingSource of Software Faults During Development
Pfleeger and Atlee, Software Engineering: Theory and Practice
Page 9.5© 2006 Pearson/Prentice Hall
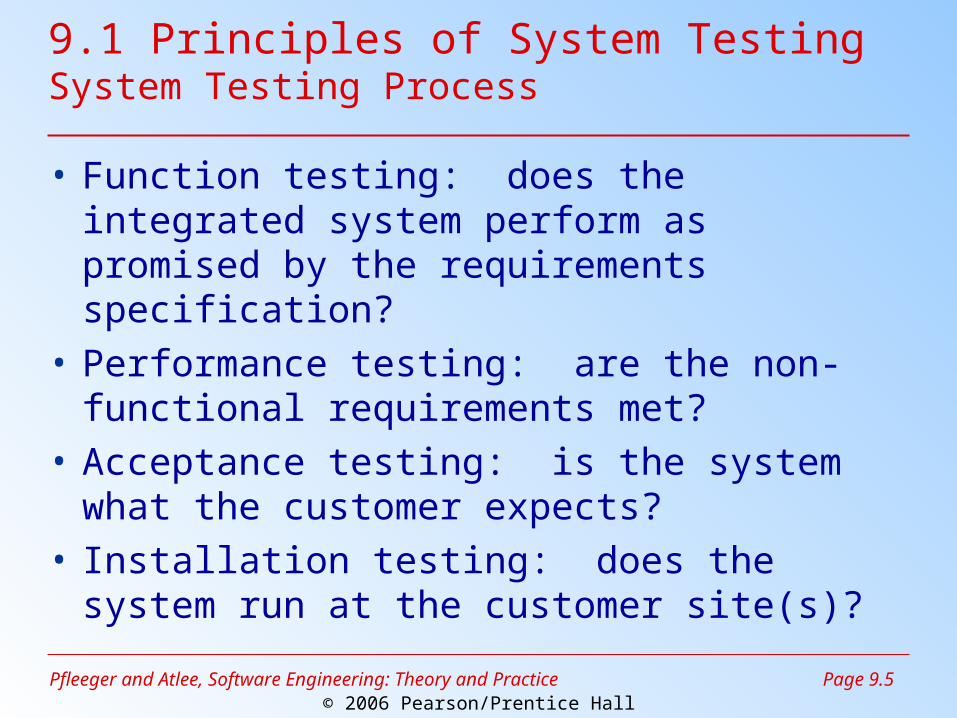
9.1 Principles of System Testing System Testing Process
• Function testing: does the integrated system perform as promised by the requirements specification?
• Performance testing: are the non-functional requirements met?
• Acceptance testing: is the system what the customer expects?
• Installation testing: does the system run at the customer site(s)?
Pfleeger and Atlee, Software Engineering: Theory and Practice
Page 9.6© 2006 Pearson/Prentice Hall
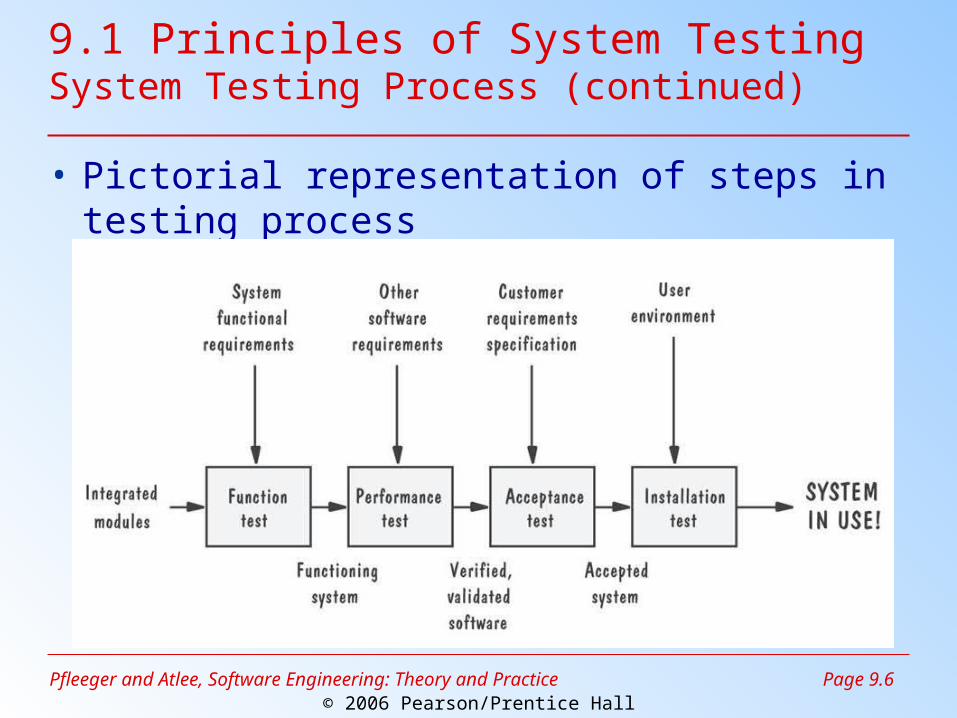
9.1 Principles of System Testing System Testing Process (continued)
• Pictorial representation of steps in testing process
Pfleeger and Atlee, Software Engineering: Theory and Practice
Page 9.7© 2006 Pearson/Prentice Hall
9.1 Principles of System TestingTechniques Used in System Testing
• Build or integration plan• Regression testing• Configuration management
– versions and releases– production system vs. development system– deltas, separate files, and conditional
compilation– change control
Pfleeger and Atlee, Software Engineering: Theory and Practice
Page 9.8© 2006 Pearson/Prentice Hall
9.1 Principles of System TestingBuild or Integration Plan
• Define the subsystems (spins) to be tested• Describe how, where, when, and by whom
the tests will be conducted
Pfleeger and Atlee, Software Engineering: Theory and Practice
Page 9.9© 2006 Pearson/Prentice Hall
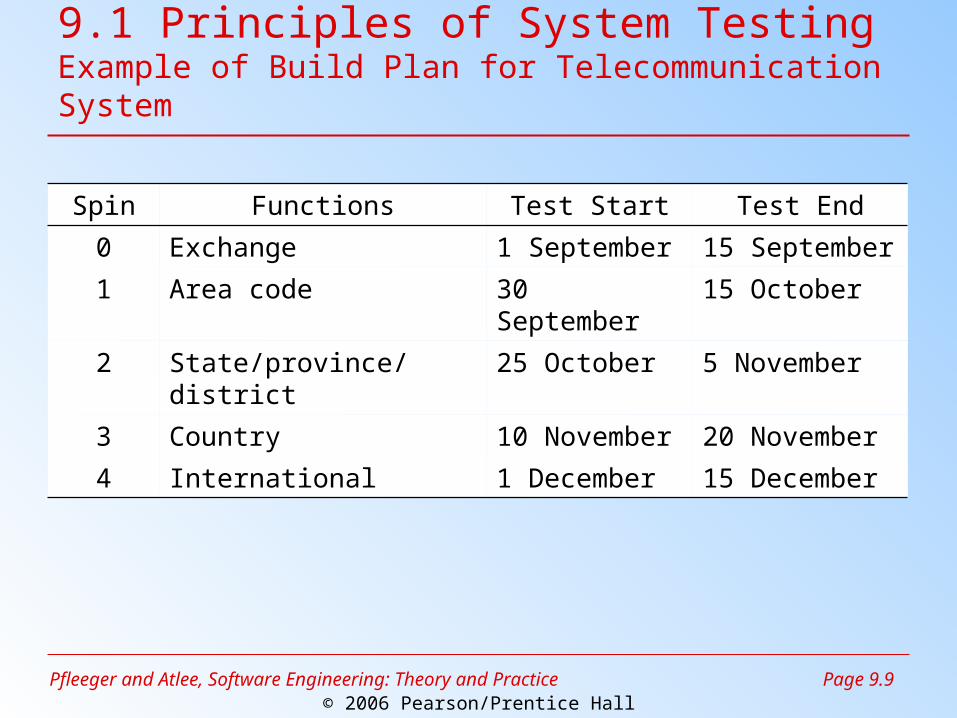
9.1 Principles of System TestingExample of Build Plan for Telecommunication System
Spin Functions Test Start Test End
0 Exchange 1 September 15 September
1 Area code 30 September 15 October
2 State/province/district 25 October 5 November
3 Country 10 November 20 November
4 International 1 December 15 December
Pfleeger and Atlee, Software Engineering: Theory and Practice
Page 9.10© 2006 Pearson/Prentice Hall
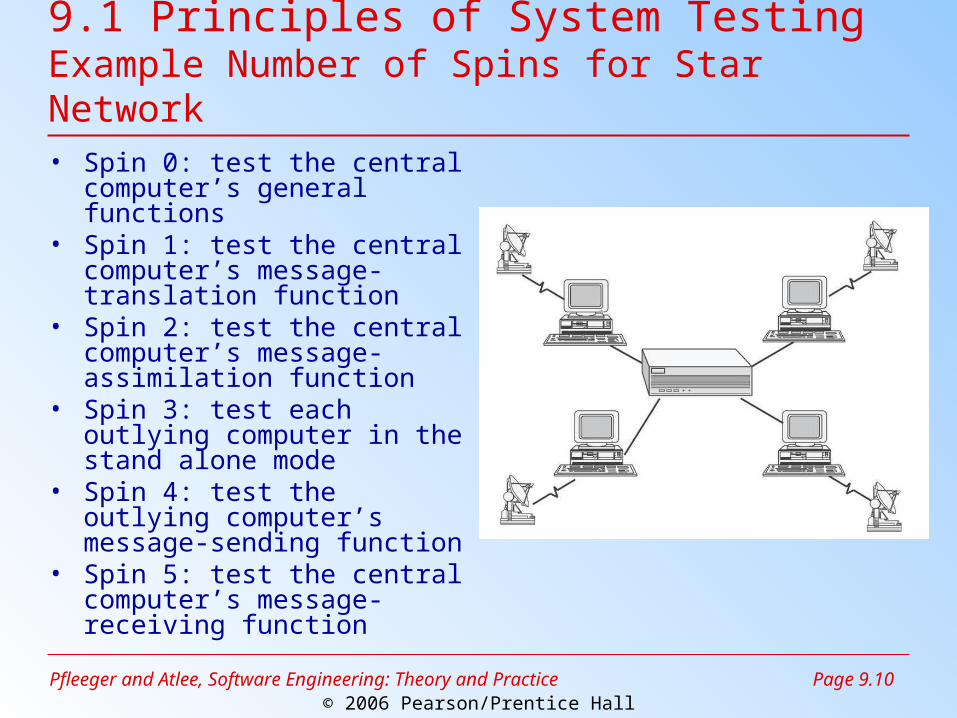
9.1 Principles of System TestingExample Number of Spins for Star Network
• Spin 0: test the central computer’s general functions
• Spin 1: test the central computer’s message-translation function
• Spin 2: test the central computer’s message-assimilation function
• Spin 3: test each outlying computer in the stand alone mode
• Spin 4: test the outlying computer’s message-sending function
• Spin 5: test the central computer’s message-receiving function
Pfleeger and Atlee, Software Engineering: Theory and Practice
Page 9.11© 2006 Pearson/Prentice Hall
9.1 Principles of System TestingRegression Testing
• Identifies new faults that may have been introduced as current ones are being corrected
• Verifies a new version or release still performs the same functions in the same manner as an older version or release

Pfleeger and Atlee, Software Engineering: Theory and Practice
Page 9.12© 2006 Pearson/Prentice Hall
9.1 Principles of System TestingRegression Testing Steps
• Inserting the new code• Testing functions known to be affected by
the new code• Testing essential function of m to verify that
they still work properly• Continuing function testing m + 1
Pfleeger and Atlee, Software Engineering: Theory and Practice
Page 9.13© 2006 Pearson/Prentice Hall
9.1 Principles of System TestingSidebar 9.1 The Consequences of Not Doing Regression Testing
• A fault in software upgrade to the DMS-100 telecom switch– 167,000 customers improperly billed $667,000
Pfleeger and Atlee, Software Engineering: Theory and Practice
Page 9.14© 2006 Pearson/Prentice Hall
9.1 Principles of System TestingConfiguration Management
• Versions and releases• Production system vs. development system• Deltas, separate files, and conditional
compilation• Change control
Pfleeger and Atlee, Software Engineering: Theory and Practice
Page 9.15© 2006 Pearson/Prentice Hall
9.1 Principles of System TestingSidebar 9.2 Deltas and Separate Files
• The Source Code Control System (SCCS)– uses delta approach– allows multiple versions and releases
• Ada Language System (ALS)– stores revision as separate, distinct files– freezes all versions and releases except for the
current one
Pfleeger and Atlee, Software Engineering: Theory and Practice
Page 9.16© 2006 Pearson/Prentice Hall
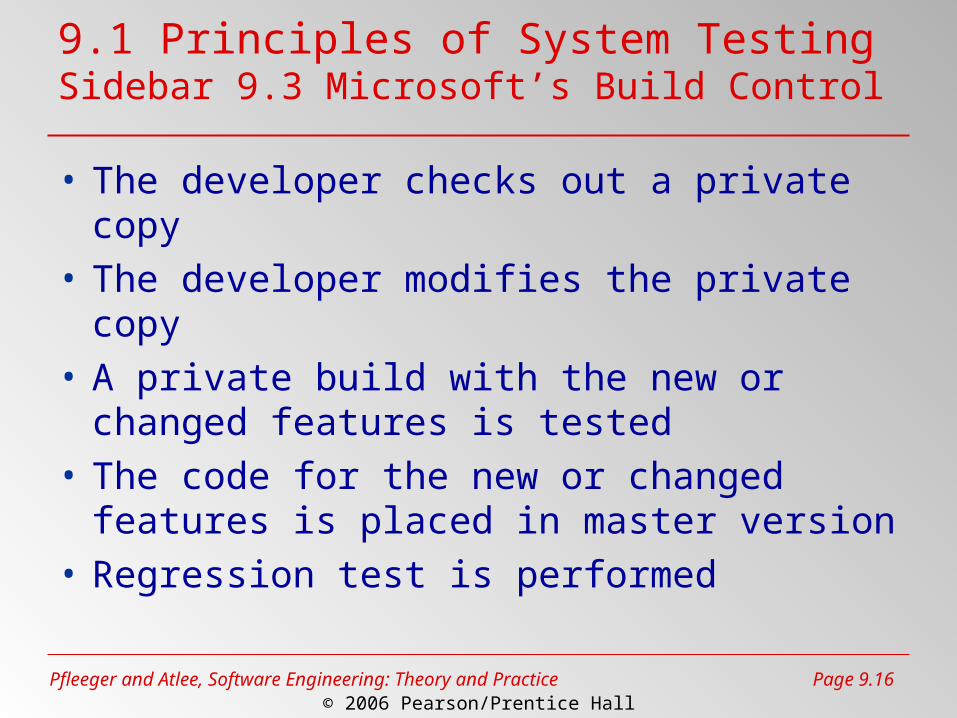
9.1 Principles of System TestingSidebar 9.3 Microsoft’s Build Control
• The developer checks out a private copy• The developer modifies the private copy • A private build with the new or changed
features is tested• The code for the new or changed features
is placed in master version• Regression test is performed
Pfleeger and Atlee, Software Engineering: Theory and Practice
Page 9.17© 2006 Pearson/Prentice Hall
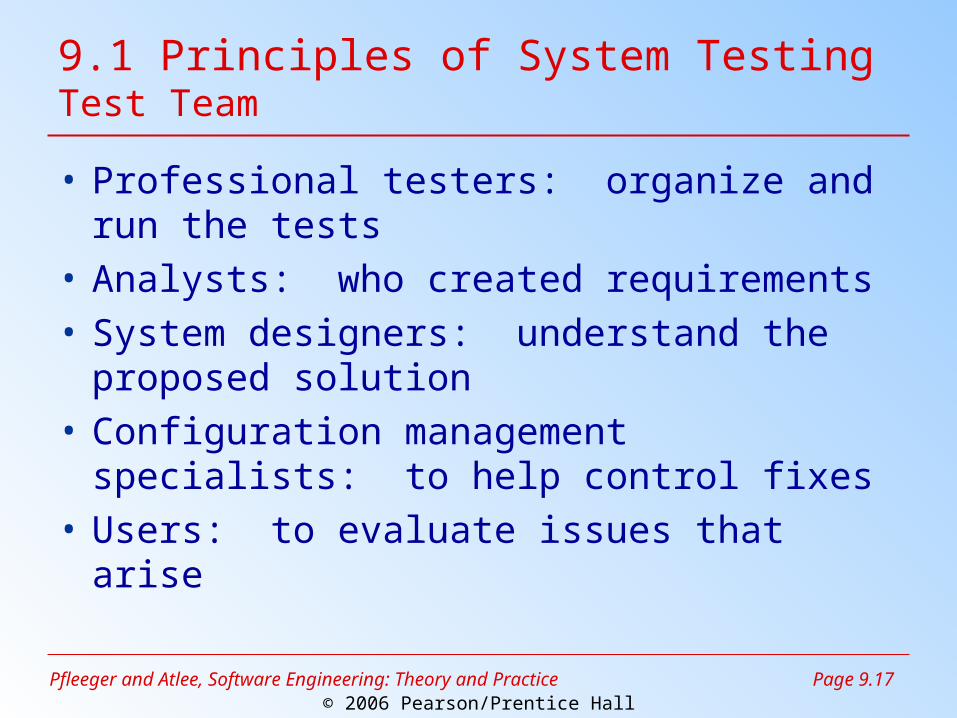
9.1 Principles of System TestingTest Team
• Professional testers: organize and run the tests
• Analysts: who created requirements• System designers: understand the
proposed solution• Configuration management specialists: to
help control fixes• Users: to evaluate issues that arise
Pfleeger and Atlee, Software Engineering: Theory and Practice
Page 9.18© 2006 Pearson/Prentice Hall
9.2 Function TestingPurpose and Roles
• Compares the system’s actual performance with its requirements
• Develops test cases based on the requirements document

Pfleeger and Atlee, Software Engineering: Theory and Practice
Page 9.19© 2006 Pearson/Prentice Hall
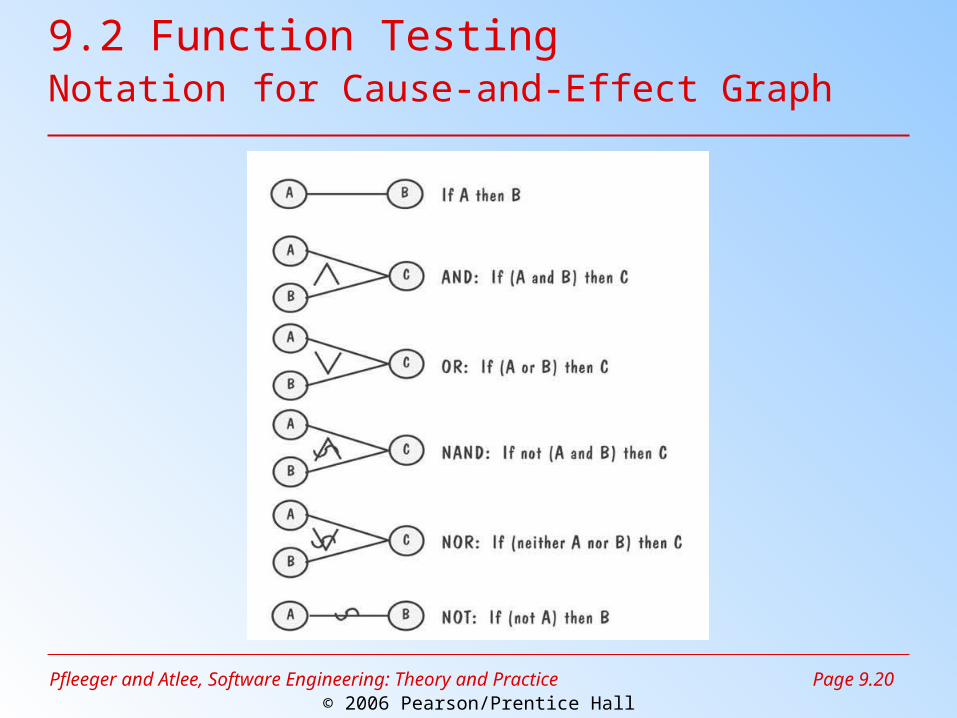
9.2 Function TestingCause-and-Effect Graph
• A Boolean graph reflecting logical relationships between inputs (causes), and the outputs (effects), or transformations (effects)
Pfleeger and Atlee, Software Engineering: Theory and Practice
Page 9.20© 2006 Pearson/Prentice Hall
9.2 Function TestingNotation for Cause-and-Effect Graph
Pfleeger and Atlee, Software Engineering: Theory and Practice
Page 9.21© 2006 Pearson/Prentice Hall
9.2 Function TestingCause-and-Effect Graphs Example
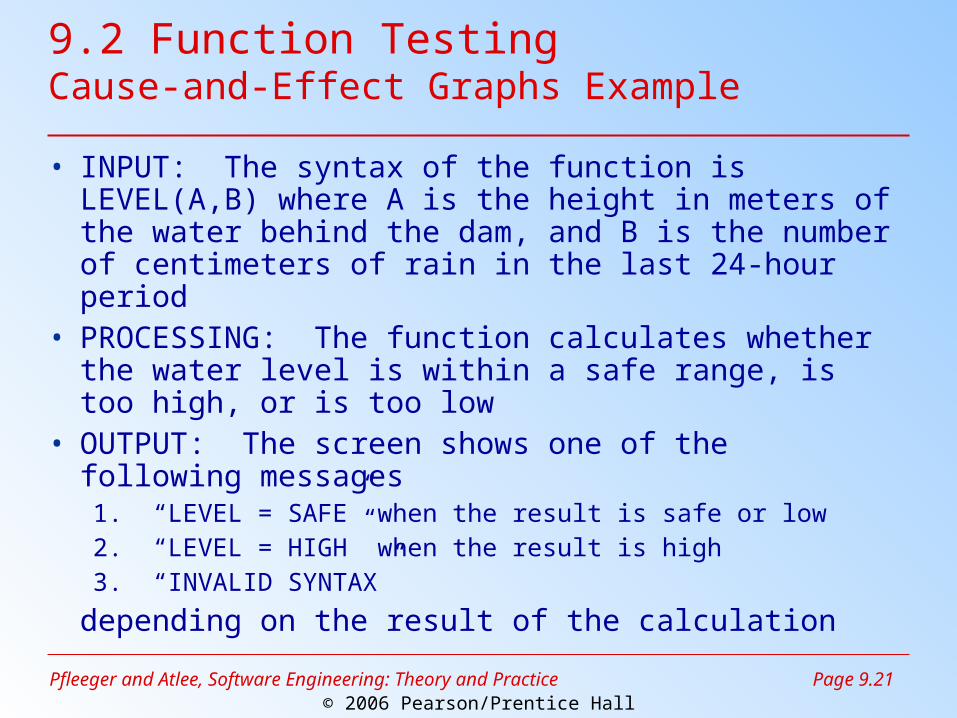
• INPUT: The syntax of the function is LEVEL(A,B) where A is the height in meters of the water behind the dam, and B is the number of centimeters of rain in the last 24-hour period
• PROCESSING: The function calculates whether the water level is within a safe range, is too high, or is too low
• OUTPUT: The screen shows one of the following messages1. “LEVEL = SAFE” when the result is safe or low2. “LEVEL = HIGH” when the result is high3. “INVALID SYNTAX”
depending on the result of the calculation
Pfleeger and Atlee, Software Engineering: Theory and Practice
Page 9.22© 2006 Pearson/Prentice Hall
9.2 Function TestingCause-and-Effect Graphs Example (Continued)
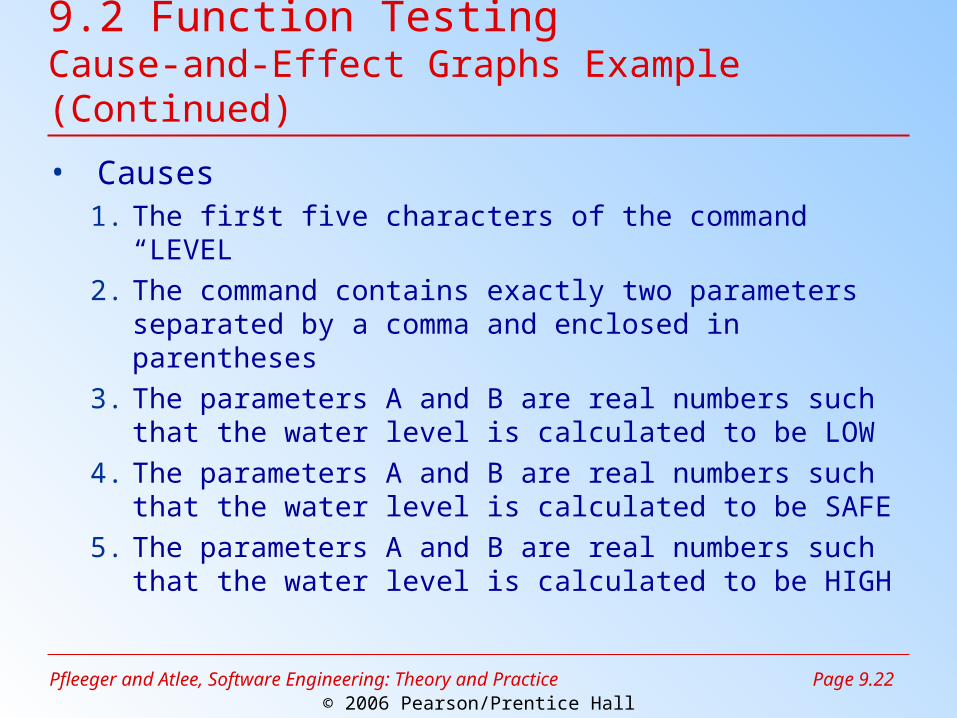
• Causes1. The first five characters of the command
“LEVEL”2. The command contains exactly two parameters
separated by a comma and enclosed in parentheses
3. The parameters A and B are real numbers such that the water level is calculated to be LOW
4. The parameters A and B are real numbers such that the water level is calculated to be SAFE
5. The parameters A and B are real numbers such that the water level is calculated to be HIGH

Pfleeger and Atlee, Software Engineering: Theory and Practice
Page 9.23© 2006 Pearson/Prentice Hall
9.2 Function TestingCause-and-Effect Graphs Example (Continued)
• Effects1. The message “LEVEL = SAFE” is displayed on
the screen2. The message “LEVEL = HIGH” is displayed on
the screen3. The message “INVALID SYNTAX” is printed out
• Intermediate nodes1. The command is syntactically valid2. The operands are syntactically valid
Pfleeger and Atlee, Software Engineering: Theory and Practice
Page 9.24© 2006 Pearson/Prentice Hall
9.2 Function TestingCause-and-Effect Graphs of LEVEL Function Example
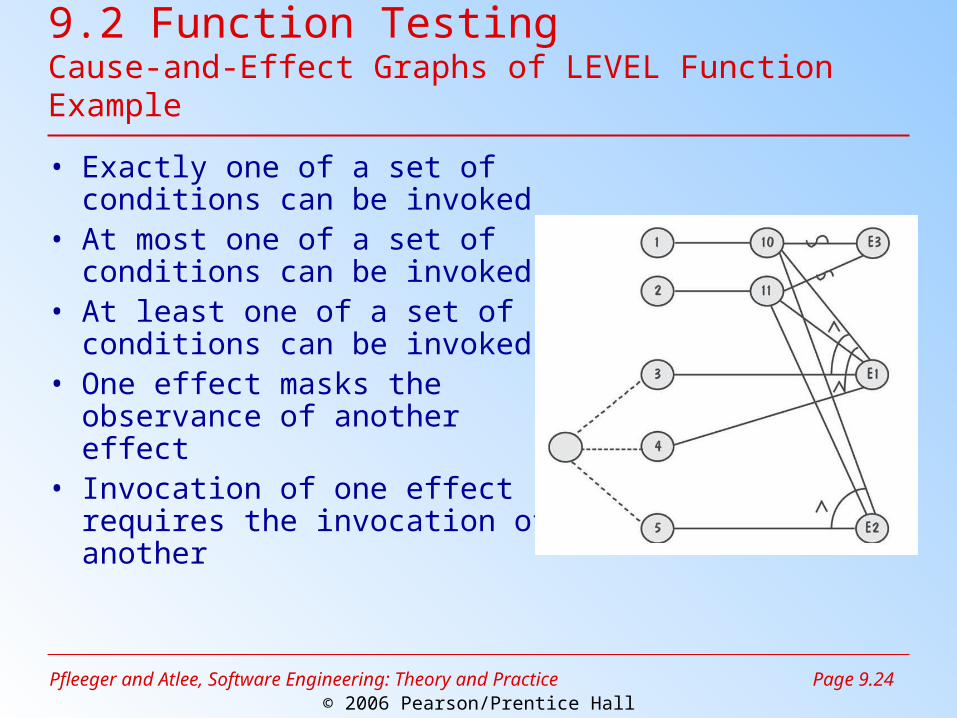
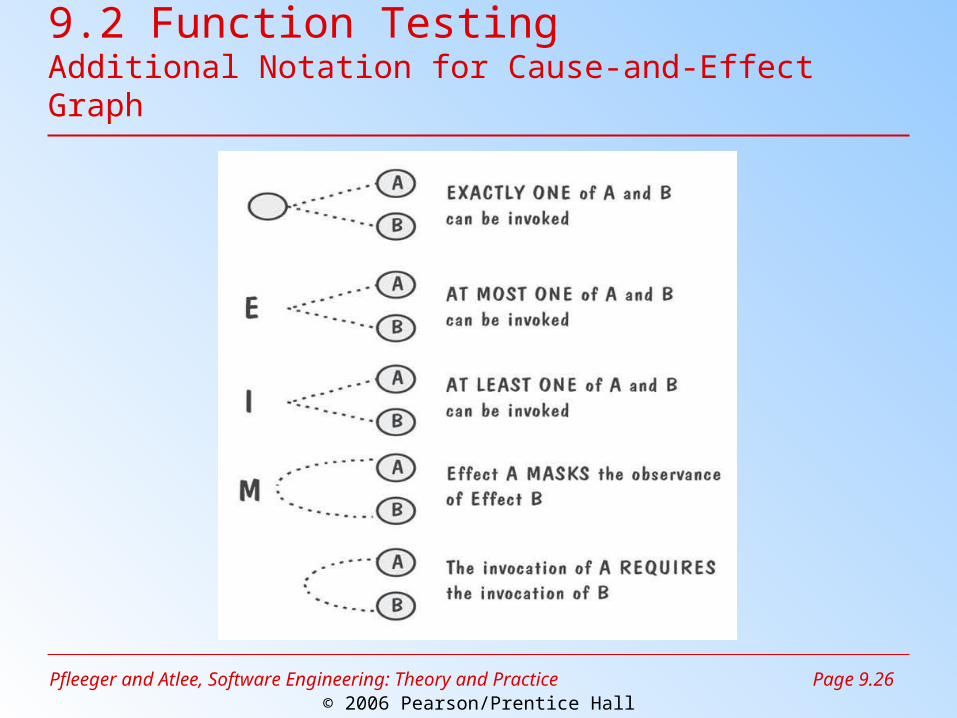
• Exactly one of a set of conditions can be invoked
• At most one of a set of conditions can be invoked
• At least one of a set of conditions can be invoked
• One effect masks the observance of another effect
• Invocation of one effect requires the invocation of another
Pfleeger and Atlee, Software Engineering: Theory and Practice
Page 9.25© 2006 Pearson/Prentice Hall
9.2 Function TestingDecision Table for Cause-and-Effect Graph of LEVEL Function
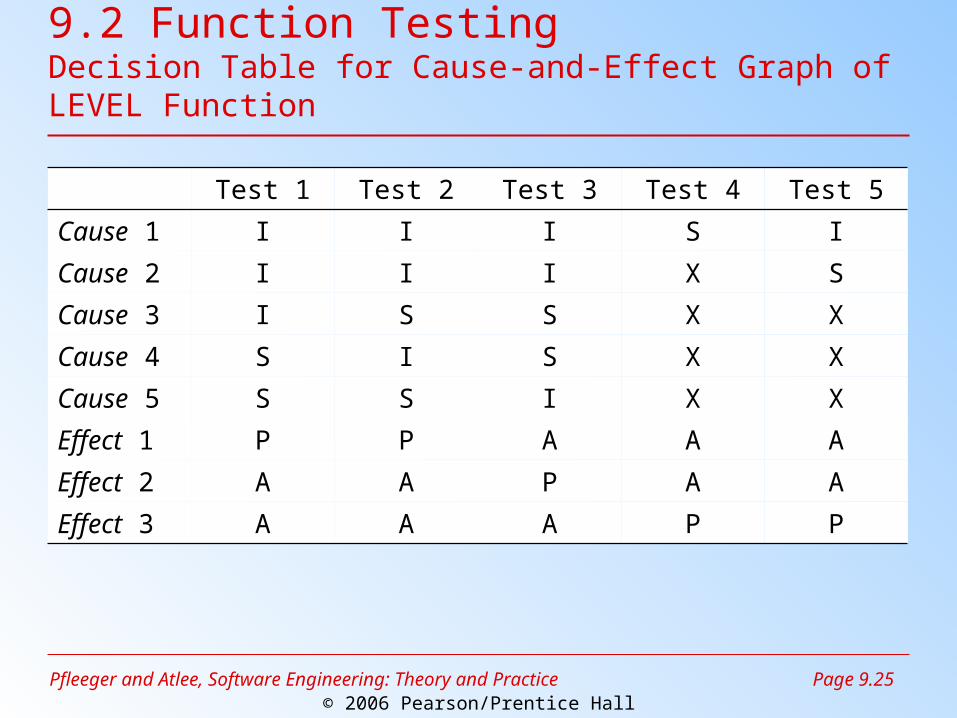
Test 1 Test 2 Test 3 Test 4 Test 5
Cause 1 I I I S I
Cause 2 I I I X S
Cause 3 I S S X X
Cause 4 S I S X X
Cause 5 S S I X X
Effect 1 P P A A A
Effect 2 A A P A A
Effect 3 A A A P P
Pfleeger and Atlee, Software Engineering: Theory and Practice
Page 9.26© 2006 Pearson/Prentice Hall
9.2 Function TestingAdditional Notation for Cause-and-Effect Graph
Pfleeger and Atlee, Software Engineering: Theory and Practice
Page 9.27© 2006 Pearson/Prentice Hall
9.3 Performance TestsPurpose and Roles
• Used to examine – the calculation– the speed of response– the accuracy of the result– the accessibility of the data
• Designed and administrated by the test team
Pfleeger and Atlee, Software Engineering: Theory and Practice
Page 9.28© 2006 Pearson/Prentice Hall
9.3 Performance TestsTypes of Performance Tests
• Stress tests• Volume tests• Configuration tests• Compatibility tests• Regression tests• Security tests• Timing tests
• Environmental tests
• Quality tests• Recovery tests• Maintenance tests• Documentation
tests• Human factors
(usability) tests
Pfleeger and Atlee, Software Engineering: Theory and Practice
Page 9.29© 2006 Pearson/Prentice Hall
9.4 Reliability, Availability, and MaintainabilityDefinition
• Software reliability: operating without failure under given condition for a given time interval
• Software availability: operating successfully according to specification at a given point in time
• Software maintainability: for a given condition of use, a maintenance activity can be carried out within stated time interval, procedures and resources
Pfleeger and Atlee, Software Engineering: Theory and Practice
Page 9.30© 2006 Pearson/Prentice Hall
9.4 Reliability, Availability, and MaintainabilityDifferent Levels of Failure Severity
• Catastrophic: causes death or system loss• Critical: causes severe injury or major
system damage• Marginal: causes minor injury or minor
system damage• Minor: causes no injury or system damage
Pfleeger and Atlee, Software Engineering: Theory and Practice
Page 9.31© 2006 Pearson/Prentice Hall
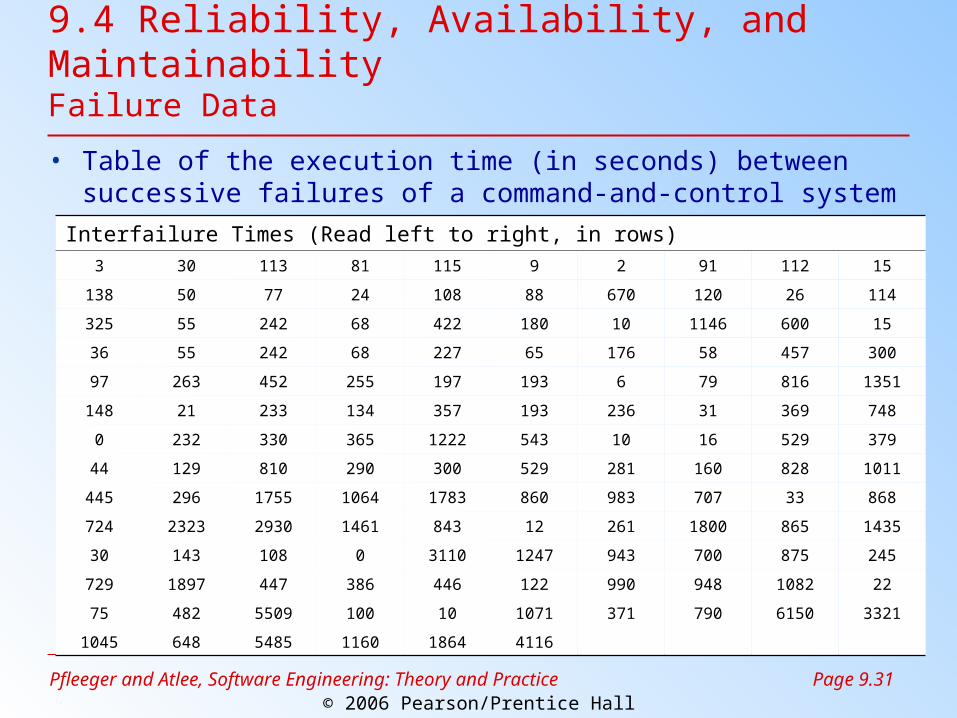
9.4 Reliability, Availability, and MaintainabilityFailure Data
• Table of the execution time (in seconds) between successive failures of a command-and-control system
Interfailure Times (Read left to right, in rows)
3 30 113 81 115 9 2 91 112 15
138 50 77 24 108 88 670 120 26 114
325 55 242 68 422 180 10 1146 600 15
36 55 242 68 227 65 176 58 457 300
97 263 452 255 197 193 6 79 816 1351
148 21 233 134 357 193 236 31 369 748
0 232 330 365 1222 543 10 16 529 379
44 129 810 290 300 529 281 160 828 1011
445 296 1755 1064 1783 860 983 707 33 868
724 2323 2930 1461 843 12 261 1800 865 1435
30 143 108 0 3110 1247 943 700 875 245
729 1897 447 386 446 122 990 948 1082 22
75 482 5509 100 10 1071 371 790 6150 3321
1045 648 5485 1160 1864 4116

Pfleeger and Atlee, Software Engineering: Theory and Practice
Page 9.32© 2006 Pearson/Prentice Hall
9.4 Reliability, Availability, and MaintainabilityFailure Data (Continued)
• Graph of failure data from previous table
Pfleeger and Atlee, Software Engineering: Theory and Practice
Page 9.33© 2006 Pearson/Prentice Hall
9.4 Reliability, Availability, and MaintainabilityUncertainty Inherent from Failure Data
• Type-1 uncertainty: how the system will be used
• Type-2 uncertainty: lack of knowledge about the effect of fault removal
Pfleeger and Atlee, Software Engineering: Theory and Practice
Page 9.34© 2006 Pearson/Prentice Hall
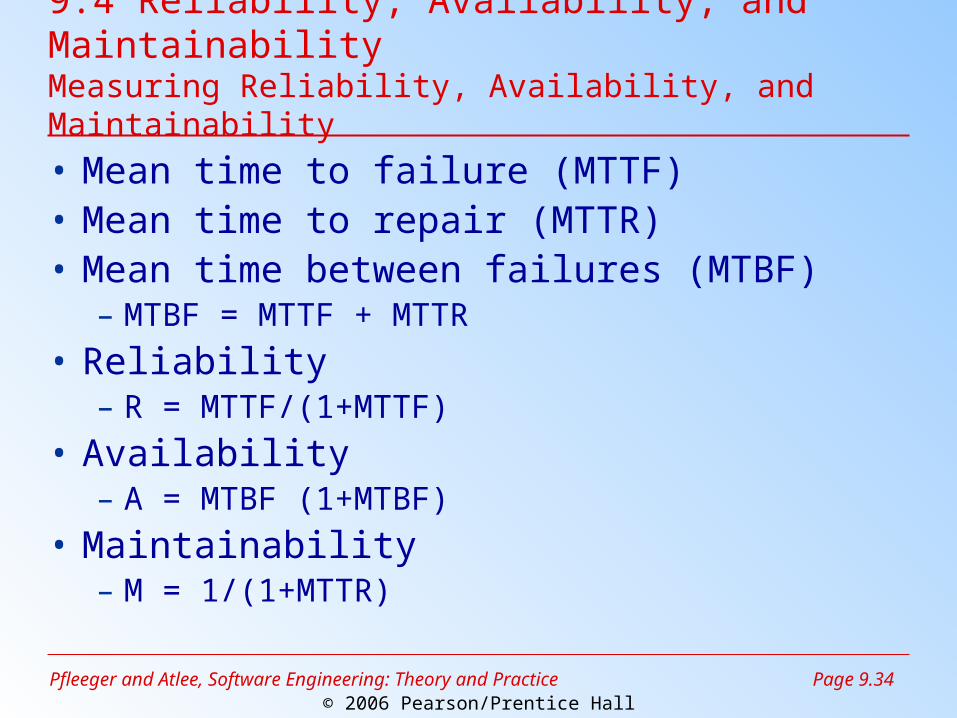
9.4 Reliability, Availability, and MaintainabilityMeasuring Reliability, Availability, and Maintainability
• Mean time to failure (MTTF)• Mean time to repair (MTTR)• Mean time between failures (MTBF)
– MTBF = MTTF + MTTR
• Reliability– R = MTTF/(1+MTTF)
• Availability– A = MTBF (1+MTBF)
• Maintainability– M = 1/(1+MTTR)
Pfleeger and Atlee, Software Engineering: Theory and Practice
Page 9.35© 2006 Pearson/Prentice Hall
9.4 Reliability, Availability, and MaintainabilityReliability Stability and Growth
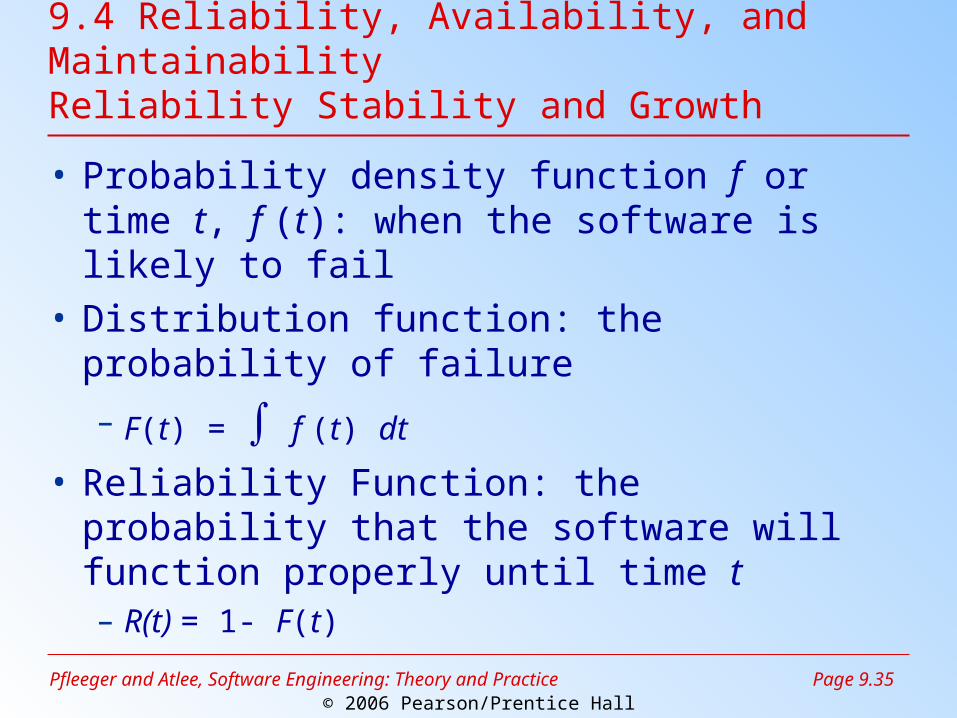
• Probability density function f or time t, f (t): when the software is likely to fail
• Distribution function: the probability of failure
– F(t) = ∫ f (t) dt
• Reliability Function: the probability that the software will function properly until time t– R(t) = 1- F(t)
Pfleeger and Atlee, Software Engineering: Theory and Practice
Page 9.36© 2006 Pearson/Prentice Hall
9.4 Reliability, Availability, and MaintainabilityUniformity Density Function
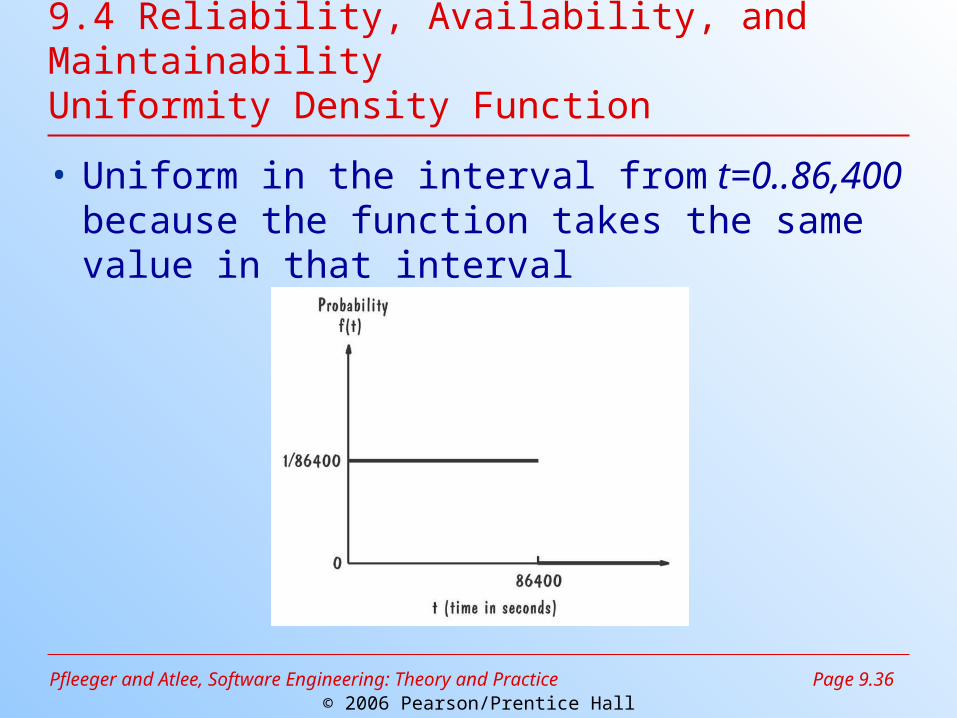
• Uniform in the interval from t=0..86,400 because the function takes the same value in that interval
Pfleeger and Atlee, Software Engineering: Theory and Practice
Page 9.37© 2006 Pearson/Prentice Hall
9.4 Reliability, Availability, and MaintainabilitySidebar 9.4 Difference Between Hardware and Software Reliability
• Complex hardware fails when a component breaks and no longer functions as specified
• Software faults can exist in a product for long time, activated only when certain conditions exist that transform the fault into a failure
Pfleeger and Atlee, Software Engineering: Theory and Practice
Page 9.38© 2006 Pearson/Prentice Hall
9.4 Reliability, Availability, and MaintainabilityReliability Prediction
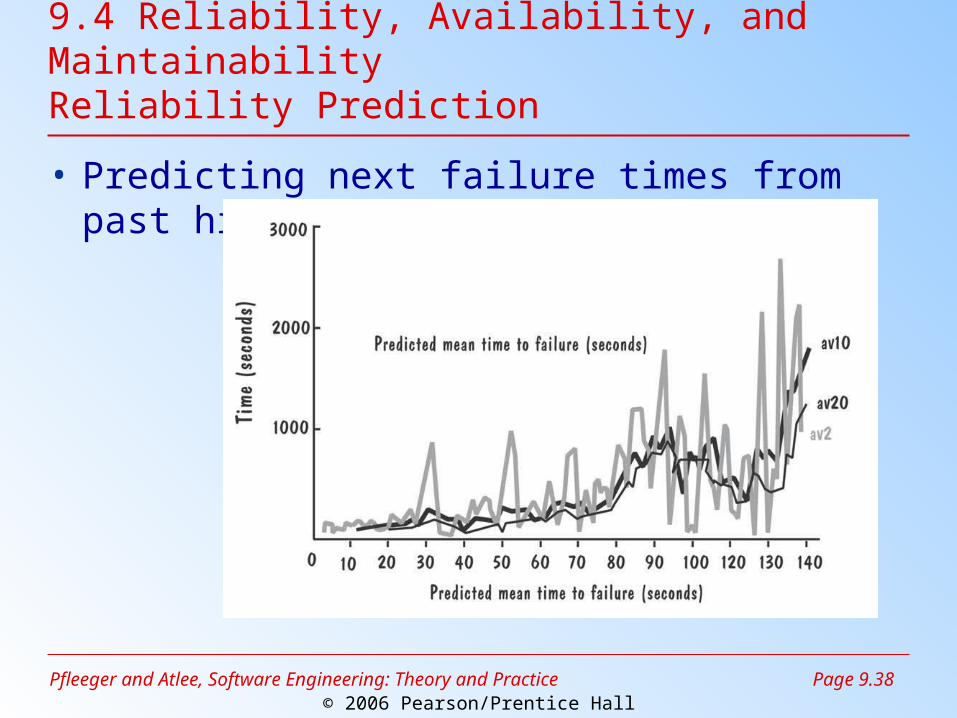
• Predicting next failure times from past history
Pfleeger and Atlee, Software Engineering: Theory and Practice
Page 9.39© 2006 Pearson/Prentice Hall
9.4 Reliability, Availability, and MaintainabilityElements of a Prediction System
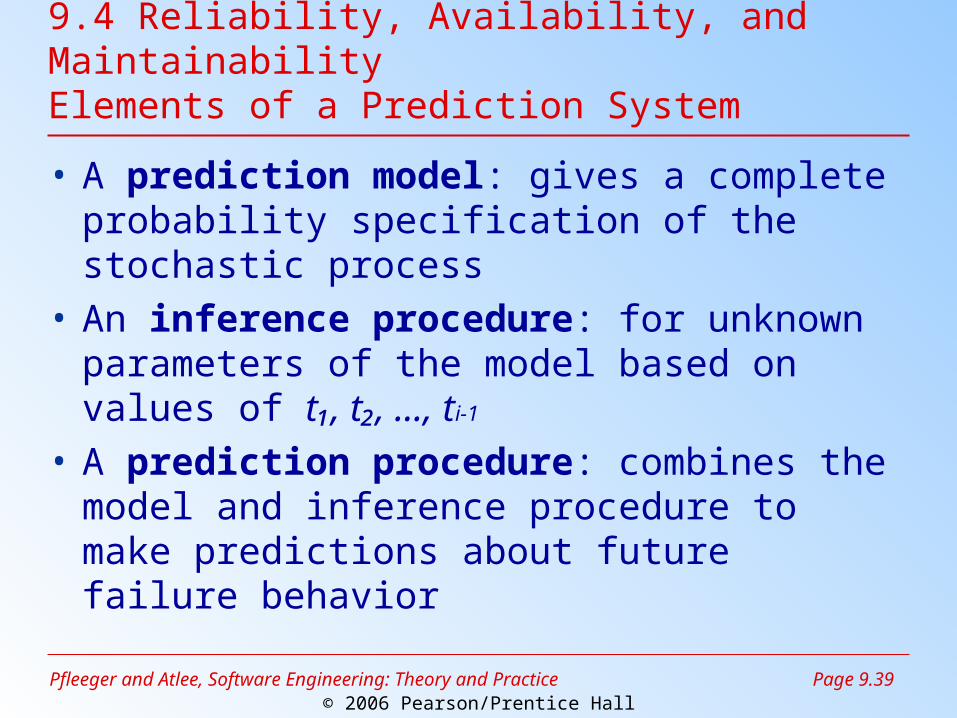
• A prediction model: gives a complete probability specification of the stochastic process
• An inference procedure: for unknown parameters of the model based on values of t₁, t₂, …, ti-1
• A prediction procedure: combines the model and inference procedure to make predictions about future failure behavior
Pfleeger and Atlee, Software Engineering: Theory and Practice
Page 9.40© 2006 Pearson/Prentice Hall
9.4 Reliability, Availability, and MaintainabilitySidebar 9.5 Motorola’s Zero-Failure Testing
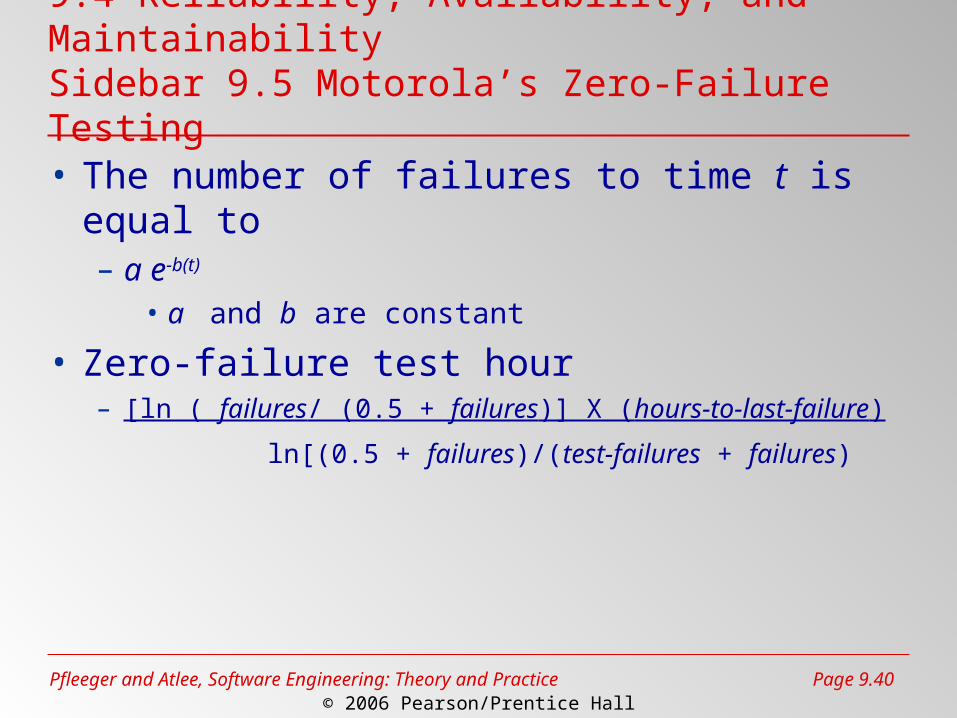
• The number of failures to time t is equal to– a e-b(t)
• a and b are constant
• Zero-failure test hour– [ln ( failures/ (0.5 + failures)] X (hours-to-last-failure)
ln[(0.5 + failures)/(test-failures + failures)
Pfleeger and Atlee, Software Engineering: Theory and Practice
Page 9.41© 2006 Pearson/Prentice Hall
9.4 Reliability, Availability, and MaintainabilityReliability Model
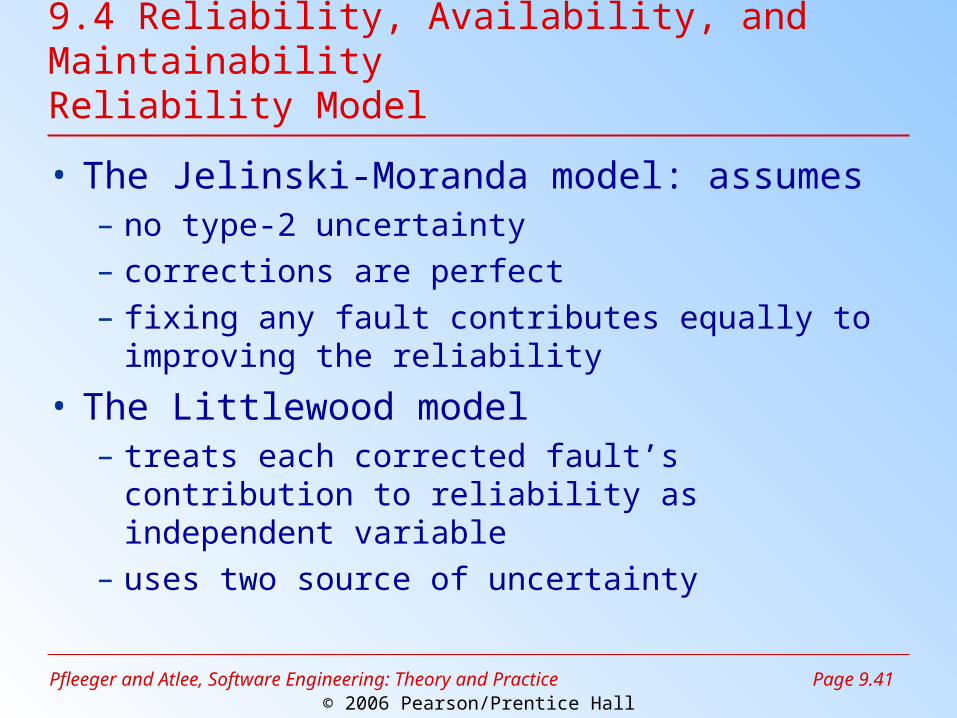
• The Jelinski-Moranda model: assumes– no type-2 uncertainty– corrections are perfect– fixing any fault contributes equally to improving
the reliability
• The Littlewood model– treats each corrected fault’s contribution to
reliability as independent variable– uses two source of uncertainty
Pfleeger and Atlee, Software Engineering: Theory and Practice
Page 9.42© 2006 Pearson/Prentice Hall
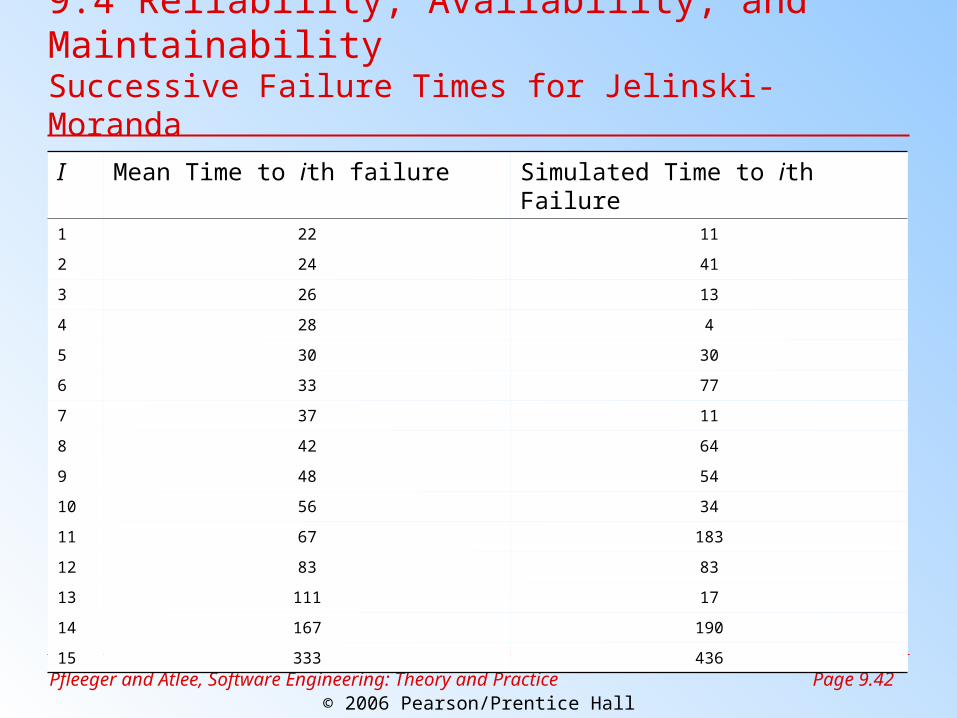
9.4 Reliability, Availability, and MaintainabilitySuccessive Failure Times for Jelinski-Moranda
I Mean Time to ith failure Simulated Time to ith Failure1 22 11
2 24 41
3 26 13
4 28 4
5 30 30
6 33 77
7 37 11
8 42 64
9 48 54
10 56 34
11 67 183
12 83 83
13 111 17
14 167 190
15 333 436
Pfleeger and Atlee, Software Engineering: Theory and Practice
Page 9.43© 2006 Pearson/Prentice Hall
9.4 Reliability, Availability, and MaintainabilitySidebar 9.6 Inappropriate Use of A Beta Version
• Problem with the Pathfinder’s software– NASA used VxWorks operating system for
PowerPC’s version to the R6000 processor• A beta version • Not fully tested
Pfleeger and Atlee, Software Engineering: Theory and Practice
Page 9.44© 2006 Pearson/Prentice Hall
9.4 Reliability, Availability, and MaintainabilityResult of Acceptance Tests
• List of requirements– are not satisfied– must be deleted– must be revised– must be added

Pfleeger and Atlee, Software Engineering: Theory and Practice
Page 9.45© 2006 Pearson/Prentice Hall
9.5 Acceptance TestsPurpose and Roles
• Enable the customers and users to determine if the built system meets their needs and expectations
• Written, conducted, and evaluated by the customers
Pfleeger and Atlee, Software Engineering: Theory and Practice
Page 9.46© 2006 Pearson/Prentice Hall
9.5 Acceptance TestsTypes of Acceptance Tests
• Pilot test: install on experimental basis• Alpha test: in-house test• Beta test: customer pilot• Parallel testing: new system operates in
parallel with old system
Pfleeger and Atlee, Software Engineering: Theory and Practice
Page 9.47© 2006 Pearson/Prentice Hall
9.6 Installation Testing
• Before the testing– Configure the system– Attach proper number and kind of devices– Establish communication with other system
• The testing– Regression tests: to verify that the system has
been installed properly and works
Pfleeger and Atlee, Software Engineering: Theory and Practice
Page 9.48© 2006 Pearson/Prentice Hall
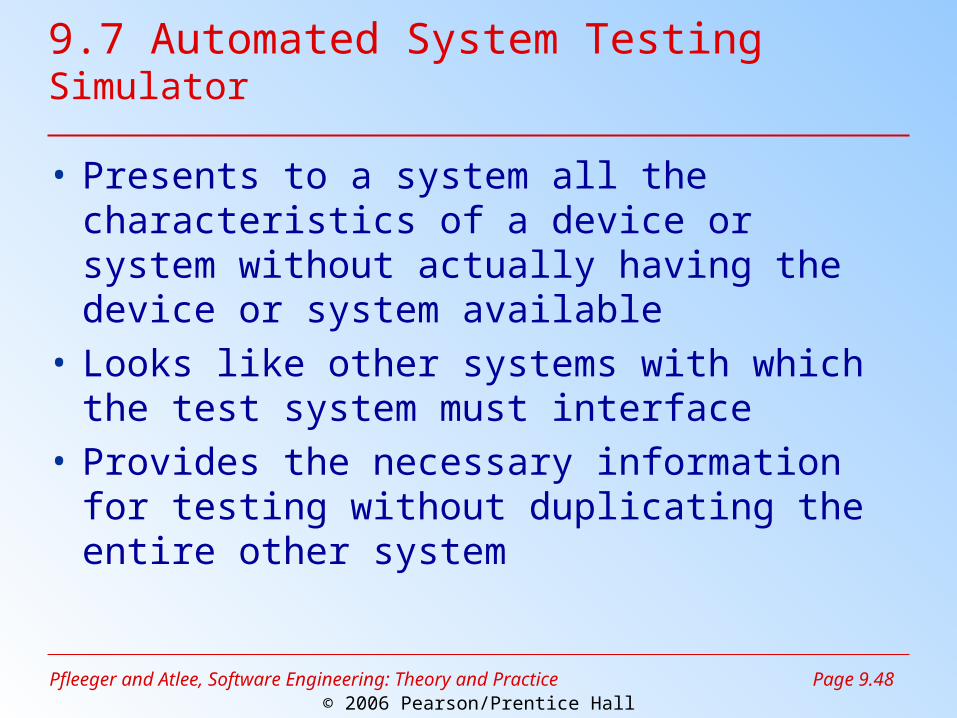
9.7 Automated System TestingSimulator
• Presents to a system all the characteristics of a device or system without actually having the device or system available
• Looks like other systems with which the test system must interface
• Provides the necessary information for testing without duplicating the entire other system
Pfleeger and Atlee, Software Engineering: Theory and Practice
Page 9.49© 2006 Pearson/Prentice Hall
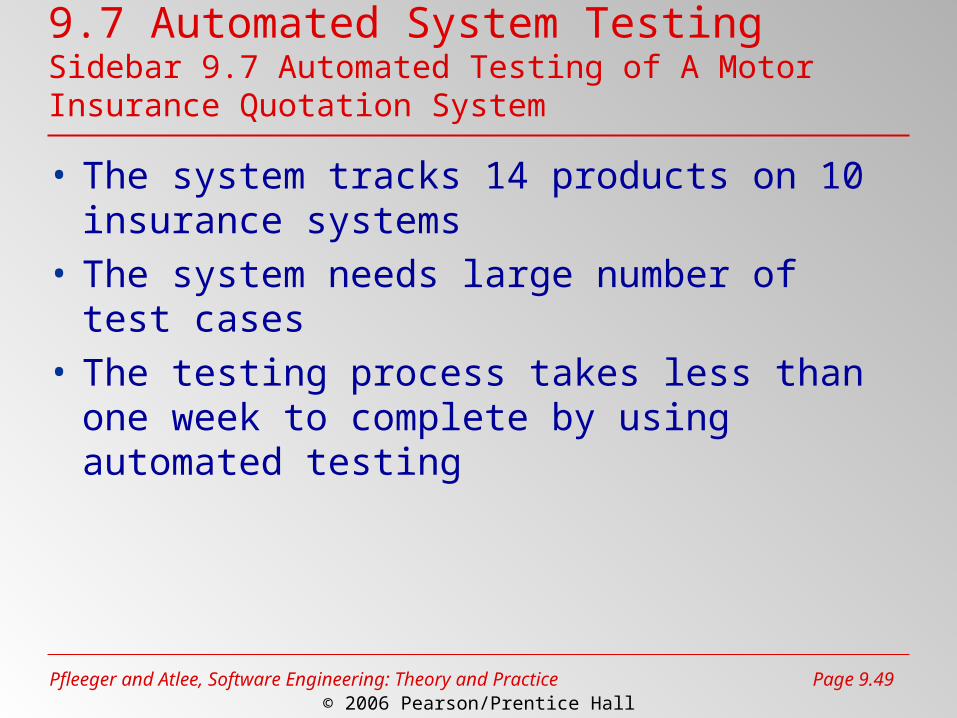
9.7 Automated System TestingSidebar 9.7 Automated Testing of A Motor Insurance Quotation System
• The system tracks 14 products on 10 insurance systems
• The system needs large number of test cases
• The testing process takes less than one week to complete by using automated testing
Pfleeger and Atlee, Software Engineering: Theory and Practice
Page 9.50© 2006 Pearson/Prentice Hall
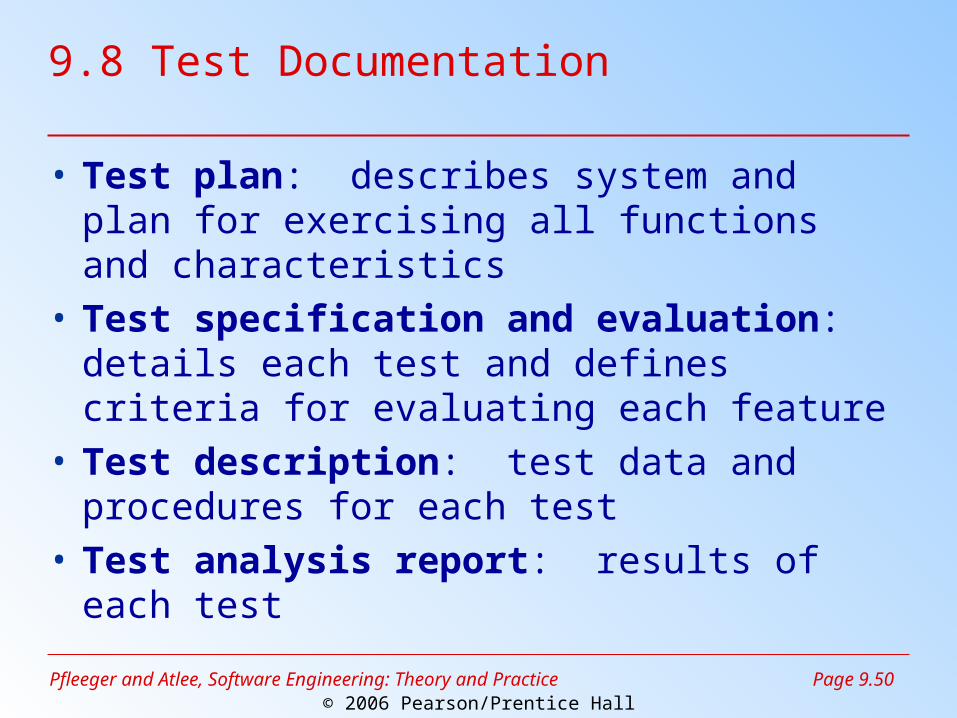
9.8 Test Documentation
• Test plan: describes system and plan for exercising all functions and characteristics
• Test specification and evaluation: details each test and defines criteria for evaluating each feature
• Test description: test data and procedures for each test
• Test analysis report: results of each test
Pfleeger and Atlee, Software Engineering: Theory and Practice
Page 9.51© 2006 Pearson/Prentice Hall
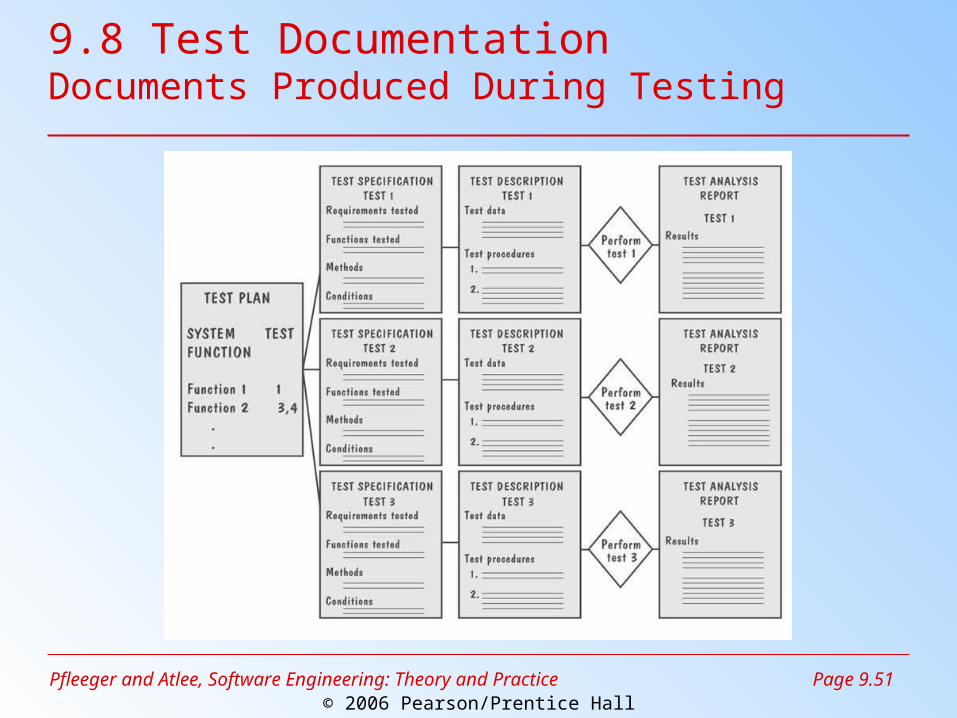
9.8 Test DocumentationDocuments Produced During Testing
Pfleeger and Atlee, Software Engineering: Theory and Practice
Page 9.52© 2006 Pearson/Prentice Hall
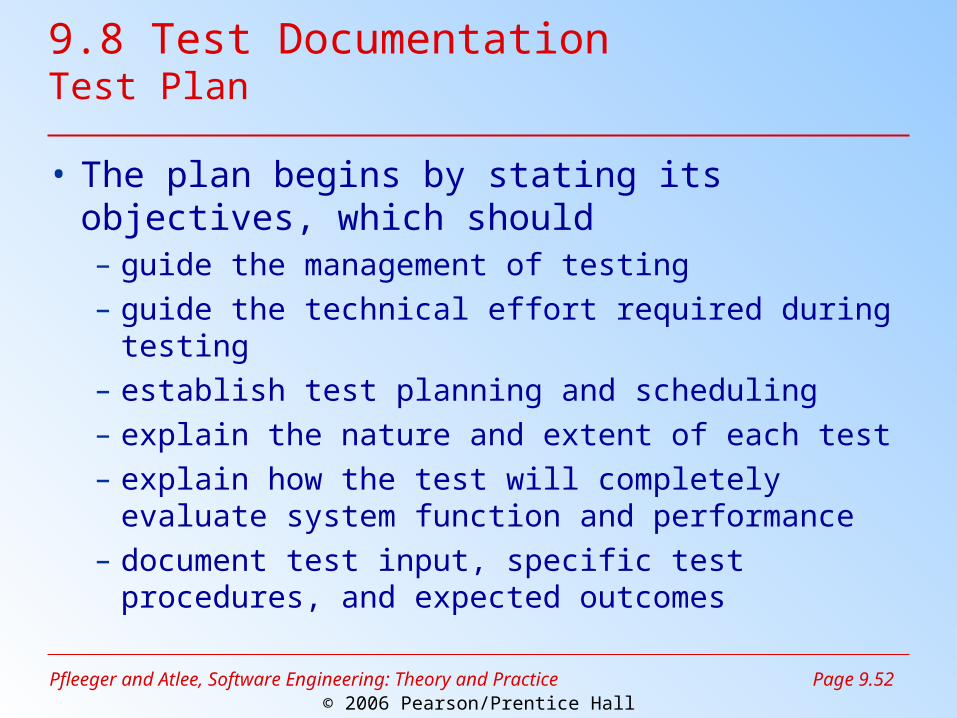
9.8 Test DocumentationTest Plan
• The plan begins by stating its objectives, which should– guide the management of testing– guide the technical effort required during testing– establish test planning and scheduling– explain the nature and extent of each test– explain how the test will completely evaluate
system function and performance– document test input, specific test procedures,
and expected outcomes
Pfleeger and Atlee, Software Engineering: Theory and Practice
Page 9.53© 2006 Pearson/Prentice Hall
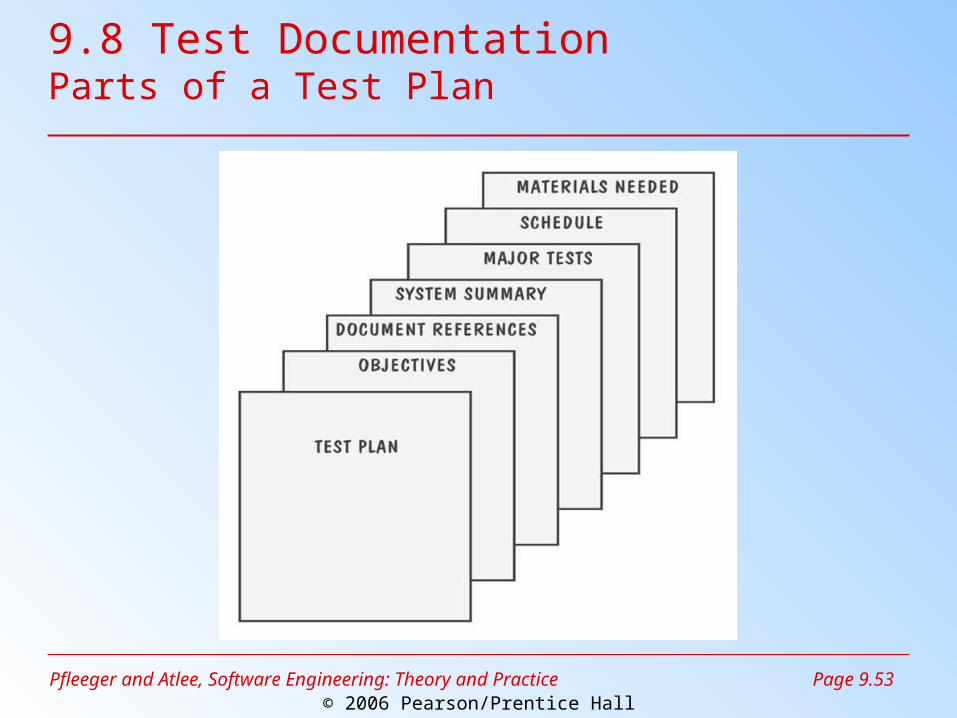
9.8 Test DocumentationParts of a Test Plan
Pfleeger and Atlee, Software Engineering: Theory and Practice
Page 9.54© 2006 Pearson/Prentice Hall
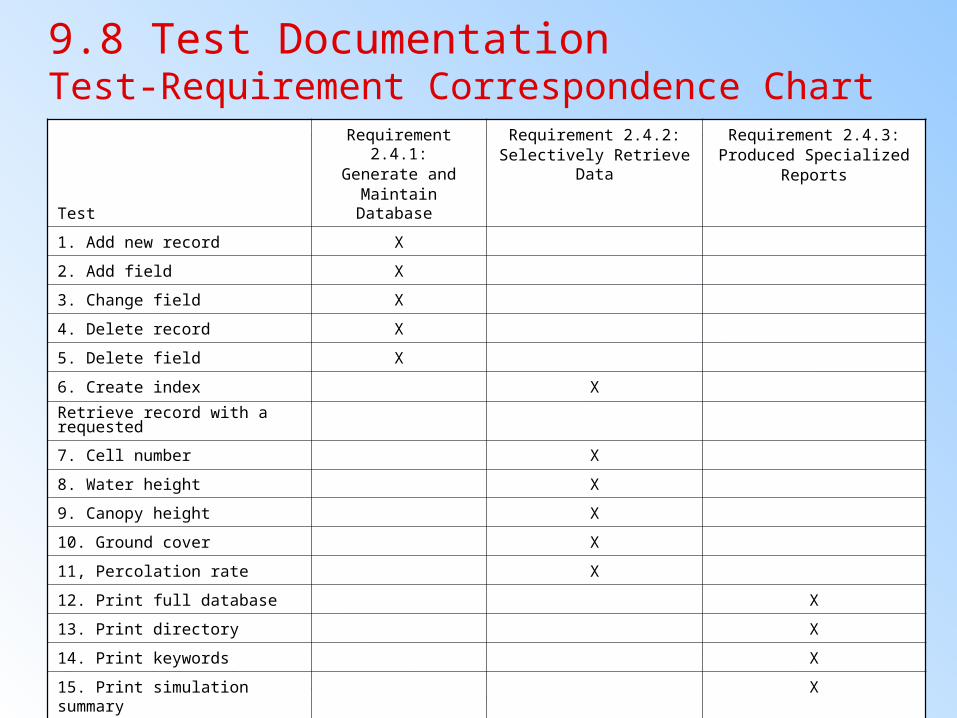
9.8 Test DocumentationTest-Requirement Correspondence Chart
Test
Requirement 2.4.1:Generate and
Maintain Database
Requirement 2.4.2:Selectively Retrieve
Data
Requirement 2.4.3:Produced Specialized
Reports
1. Add new record X
2. Add field X
3. Change field X
4. Delete record X
5. Delete field X
6. Create index X
Retrieve record with a requested
7. Cell number X
8. Water height X
9. Canopy height X
10. Ground cover X
11, Percolation rate X
12. Print full database X
13. Print directory X
14. Print keywords X
15. Print simulation summary X
Pfleeger and Atlee, Software Engineering: Theory and Practice
Page 9.55© 2006 Pearson/Prentice Hall
9.8 Test DocumentationSidebar 9.8 Measuring Test Effectiveness and Efficiency
• Test effectiveness can be measured by dividing the number of faults found in a given test by the total number of faults found
• Test efficiency is computed by dividing the number of faults found in testing by the effort needed to perform testing
Pfleeger and Atlee, Software Engineering: Theory and Practice
Page 9.56© 2006 Pearson/Prentice Hall
9.8 Test DocumentationTest Description
• Including– the means of control– the data– the procedures
Pfleeger and Atlee, Software Engineering: Theory and Practice
Page 9.57© 2006 Pearson/Prentice Hall
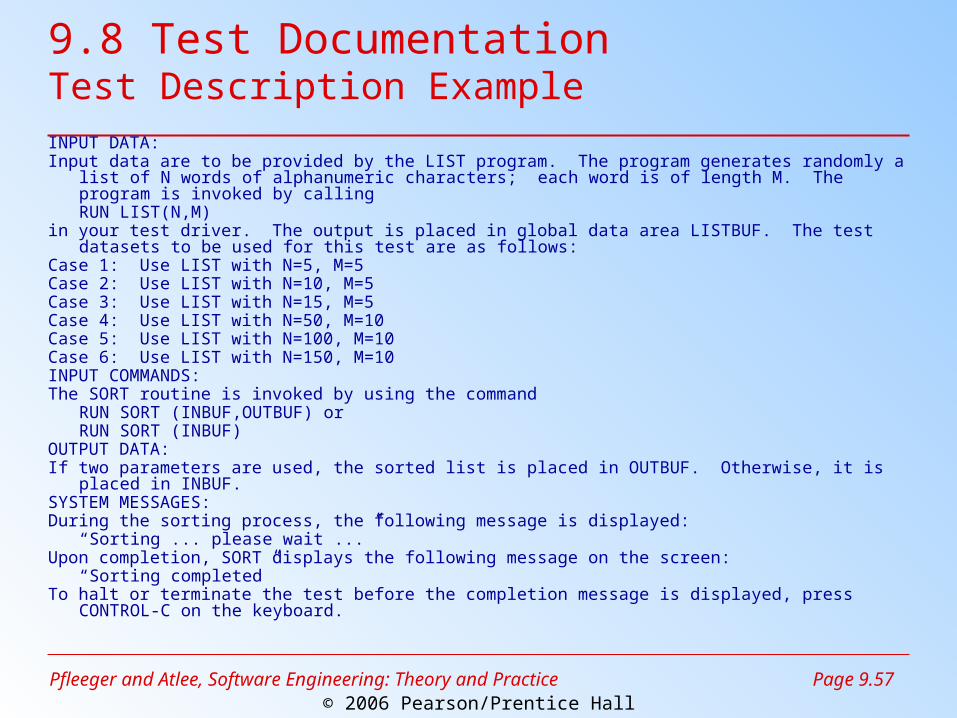
9.8 Test DocumentationTest Description ExampleINPUT DATA:Input data are to be provided by the LIST program. The program generates randomly a list of N
words of alphanumeric characters; each word is of length M. The program is invoked by callingRUN LIST(N,M)
in your test driver. The output is placed in global data area LISTBUF. The test datasets to be used for this test are as follows:
Case 1: Use LIST with N=5, M=5Case 2: Use LIST with N=10, M=5Case 3: Use LIST with N=15, M=5Case 4: Use LIST with N=50, M=10Case 5: Use LIST with N=100, M=10Case 6: Use LIST with N=150, M=10INPUT COMMANDS:The SORT routine is invoked by using the command
RUN SORT (INBUF,OUTBUF) orRUN SORT (INBUF)
OUTPUT DATA:If two parameters are used, the sorted list is placed in OUTBUF. Otherwise, it is placed in INBUF.SYSTEM MESSAGES:During the sorting process, the following message is displayed:
“Sorting ... please wait ...”Upon completion, SORT displays the following message on the screen:
“Sorting completed”To halt or terminate the test before the completion message is displayed, press CONTROL-C on
the keyboard.
Pfleeger and Atlee, Software Engineering: Theory and Practice
Page 9.58© 2006 Pearson/Prentice Hall
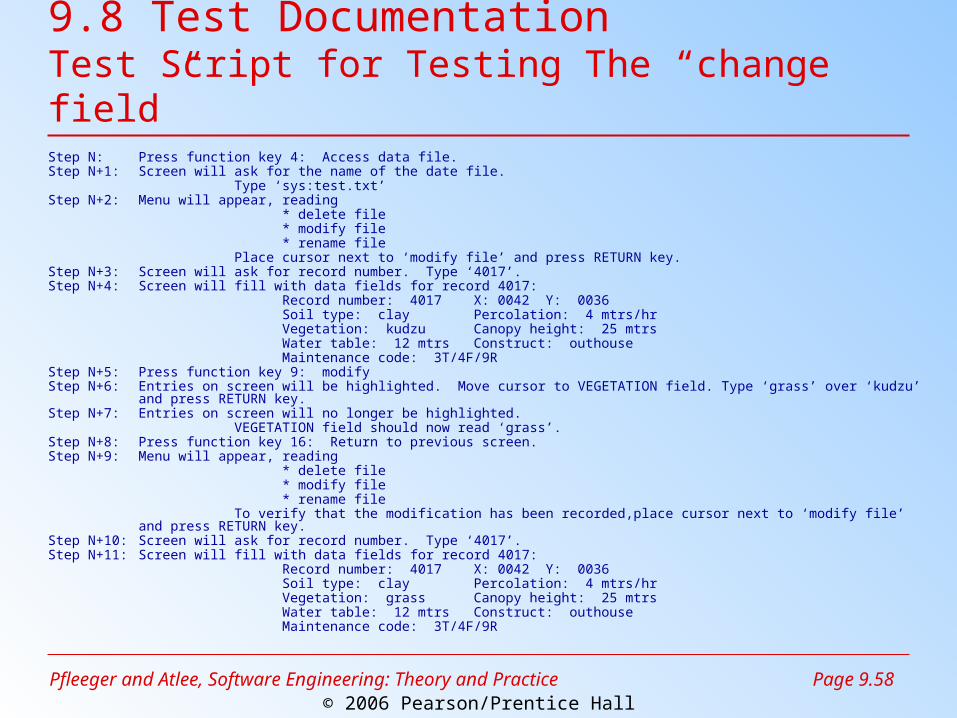
9.8 Test DocumentationTest Script for Testing The “change field”
Step N: Press function key 4: Access data file.Step N+1: Screen will ask for the name of the date file.
Type ‘sys:test.txt’Step N+2: Menu will appear, reading
* delete file* modify file* rename file
Place cursor next to ‘modify file’ and press RETURN key.Step N+3: Screen will ask for record number. Type ‘4017’.Step N+4: Screen will fill with data fields for record 4017:
Record number: 4017 X: 0042 Y: 0036Soil type: clay Percolation: 4 mtrs/hrVegetation: kudzu Canopy height: 25 mtrsWater table: 12 mtrs Construct: outhouseMaintenance code: 3T/4F/9R
Step N+5: Press function key 9: modifyStep N+6: Entries on screen will be highlighted. Move cursor to VEGETATION field. Type ‘grass’ over ‘kudzu’ and press RETURN
key.Step N+7: Entries on screen will no longer be highlighted.
VEGETATION field should now read ‘grass’.Step N+8: Press function key 16: Return to previous screen.Step N+9: Menu will appear, reading
* delete file* modify file* rename file
To verify that the modification has been recorded,place cursor next to ‘modify file’ and press RETURN key.
Step N+10: Screen will ask for record number. Type ‘4017’.Step N+11: Screen will fill with data fields for record 4017:
Record number: 4017 X: 0042 Y: 0036Soil type: clay Percolation: 4 mtrs/hrVegetation: grass Canopy height: 25 mtrsWater table: 12 mtrs Construct: outhouseMaintenance code: 3T/4F/9R
Pfleeger and Atlee, Software Engineering: Theory and Practice
Page 9.59© 2006 Pearson/Prentice Hall
9.8 Test DocumentationTest Analysis Report
• Documents the result of test• Provides information needed to duplicate
the failure and to locate and fix the source of the problem
• Provides information necessary to determine if the project is complete
• Establish confidence in the system’s performance
Pfleeger and Atlee, Software Engineering: Theory and Practice
Page 9.60© 2006 Pearson/Prentice Hall
9.8 Test DocumentationProblem Report Forms
• Location: Where did the problem occur?• Timing: When did it occur?• Symptom: What was observed?• End result: What were the consequences?• Mechanism: How did it occur?• Cause: Why did it occur?• Severity: How much was the user or
business affected?• Cost: How much did it cost?
Pfleeger and Atlee, Software Engineering: Theory and Practice
Page 9.61© 2006 Pearson/Prentice Hall
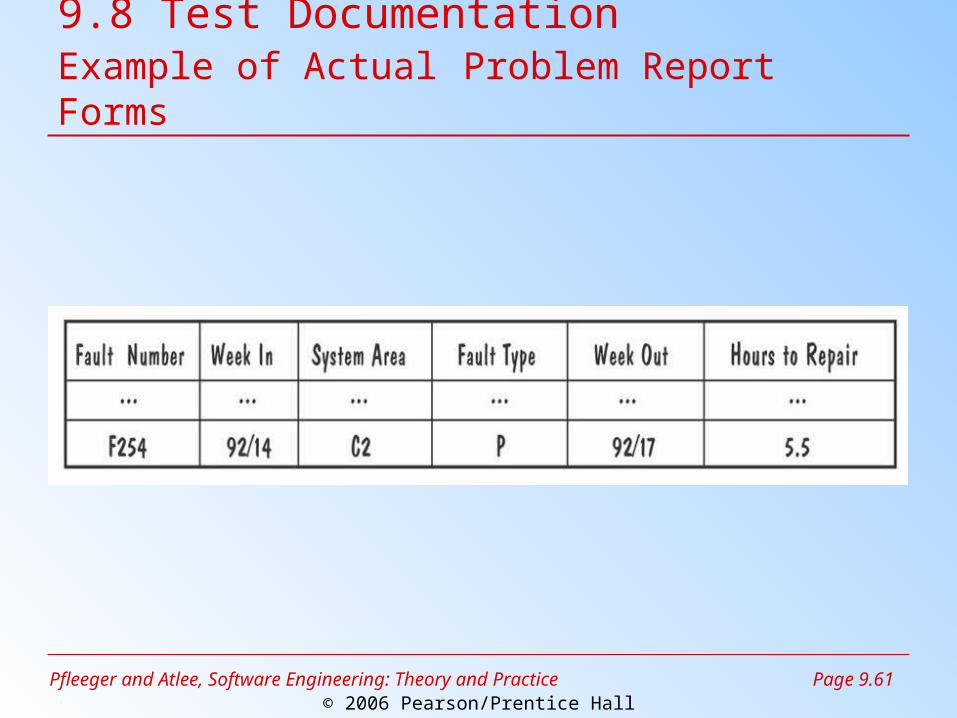
9.8 Test DocumentationExample of Actual Problem Report Forms
Pfleeger and Atlee, Software Engineering: Theory and Practice
Page 9.62© 2006 Pearson/Prentice Hall
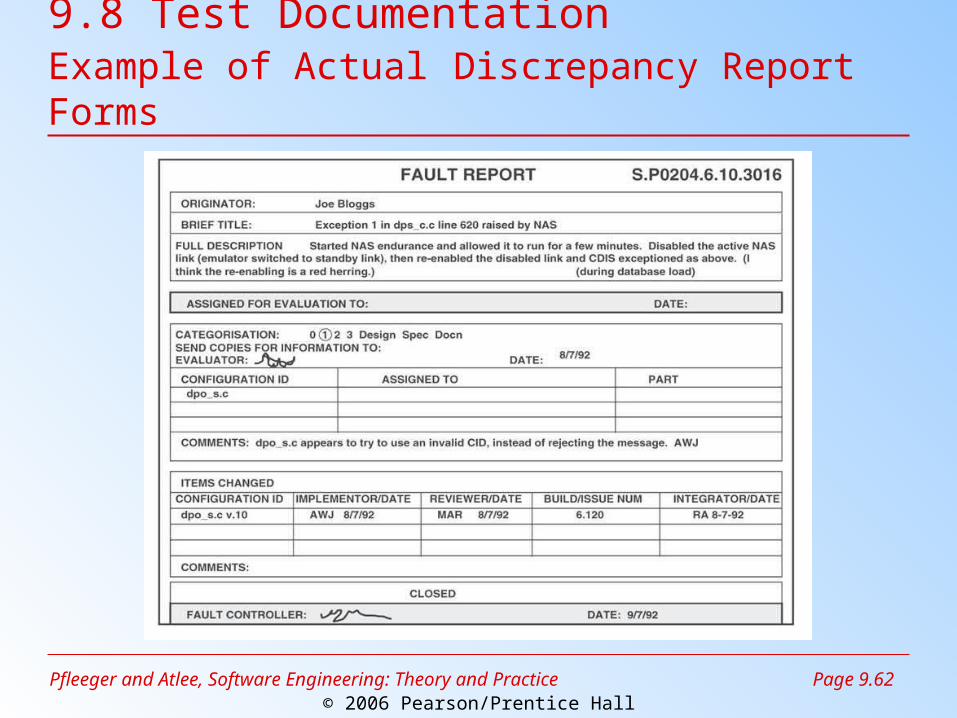
9.8 Test DocumentationExample of Actual Discrepancy Report Forms
Pfleeger and Atlee, Software Engineering: Theory and Practice
Page 9.63© 2006 Pearson/Prentice Hall
9.9 Testing Safety-Critical Systems
• Design diversity: use different kinds of designs, designers
• Software safety cases: make explicit the ways the software addresses possible problems– failure modes and effects analysis– hazard and operability studies (HAZOPS)
• Cleanroom: certifying software with respect to the specification
Pfleeger and Atlee, Software Engineering: Theory and Practice
Page 9.64© 2006 Pearson/Prentice Hall
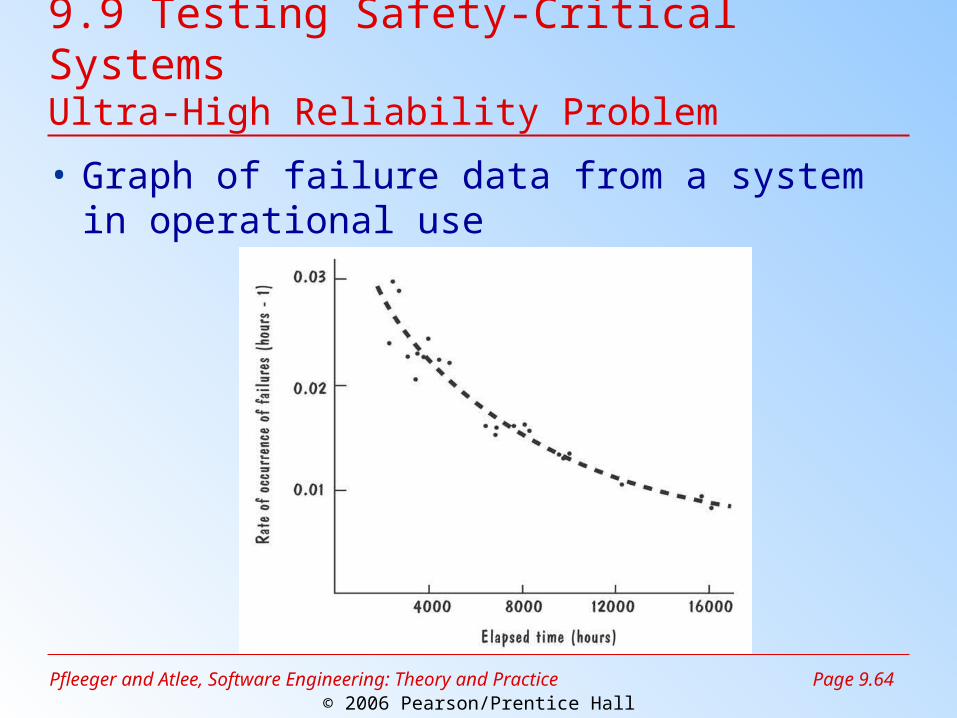
9.9 Testing Safety-Critical SystemsUltra-High Reliability Problem
• Graph of failure data from a system in operational use
Pfleeger and Atlee, Software Engineering: Theory and Practice
Page 9.65© 2006 Pearson/Prentice Hall
9.9 Testing Safety-Critical SystemsSidebar 9.9 Software Quality Practices at Baltimore Gas and Electric
• To ensure high reliability– checking the requirements definition thoroughly– performing quality reviews– testing carefully– documenting completely– performing thorough configuration control

Pfleeger and Atlee, Software Engineering: Theory and Practice
Page 9.66© 2006 Pearson/Prentice Hall
9.9 Testing Safety-Critical SystemsSidebar 9.10 Suggestions for Building Safety-Critical Software
• Recognize that testing cannot remove all faults or risks• Do not confuse safety, reliability, and security• Tightly link the organization’s software and safety
organizations• Build and use a safety information system• Instill a management culture safety• Assume that every mistake users can make will be
made• Do not assume that low-probability, high-impact events
will not happen• Emphasize requirements definition, testing, code and
specification reviews, and configuration control• Do not let short-term considerations overshadow long-
term risks and cost
Pfleeger and Atlee, Software Engineering: Theory and Practice
Page 9.67© 2006 Pearson/Prentice Hall
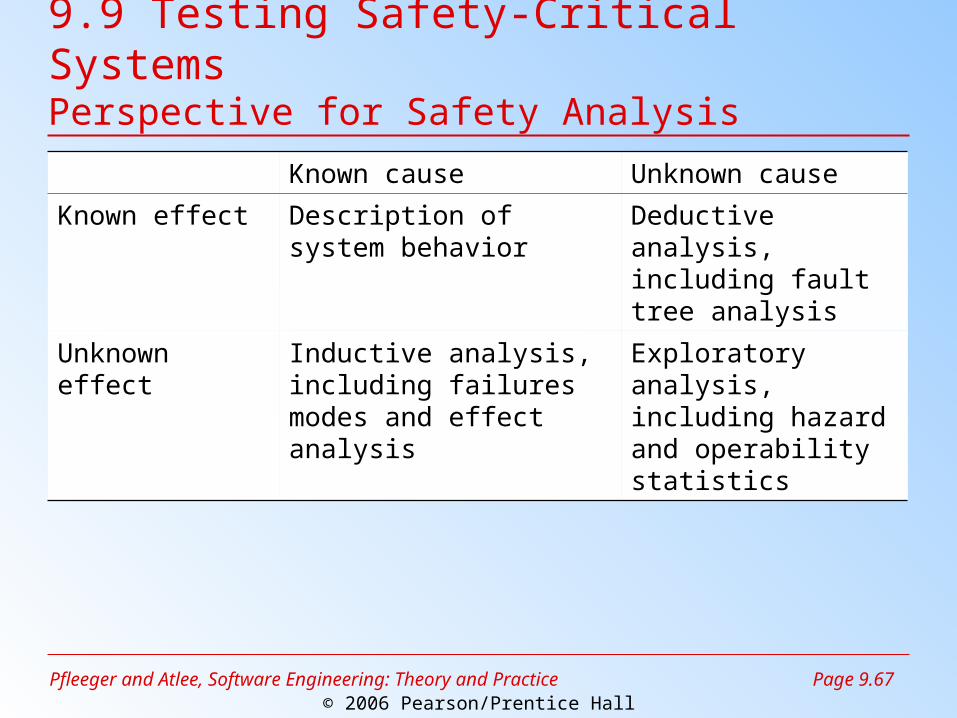
9.9 Testing Safety-Critical SystemsPerspective for Safety Analysis
Known cause Unknown cause
Known effect Description of system behavior
Deductive analysis, including fault tree analysis
Unknown effect Inductive analysis, including failures modes and effect analysis
Exploratory analysis, including hazard and operability statistics
Pfleeger and Atlee, Software Engineering: Theory and Practice
Page 9.68© 2006 Pearson/Prentice Hall
9.9 Testing Safety-Critical SystemsSidebar 9.11 Safety and the Therac-25
• Atomic Energy of Canada Limited (AECL) performed a safety analysis– identify single fault using a failure modes and
effects analysis– identify multiple failures and quantify the results
by performing a fault tree analysis– perform detailed code inspections
• AECL recommended– 10 changes to the Therac-25 hardware,
including interlocks to back up software control energy selection and electron-beam scanning
Pfleeger and Atlee, Software Engineering: Theory and Practice
Page 9.69© 2006 Pearson/Prentice Hall
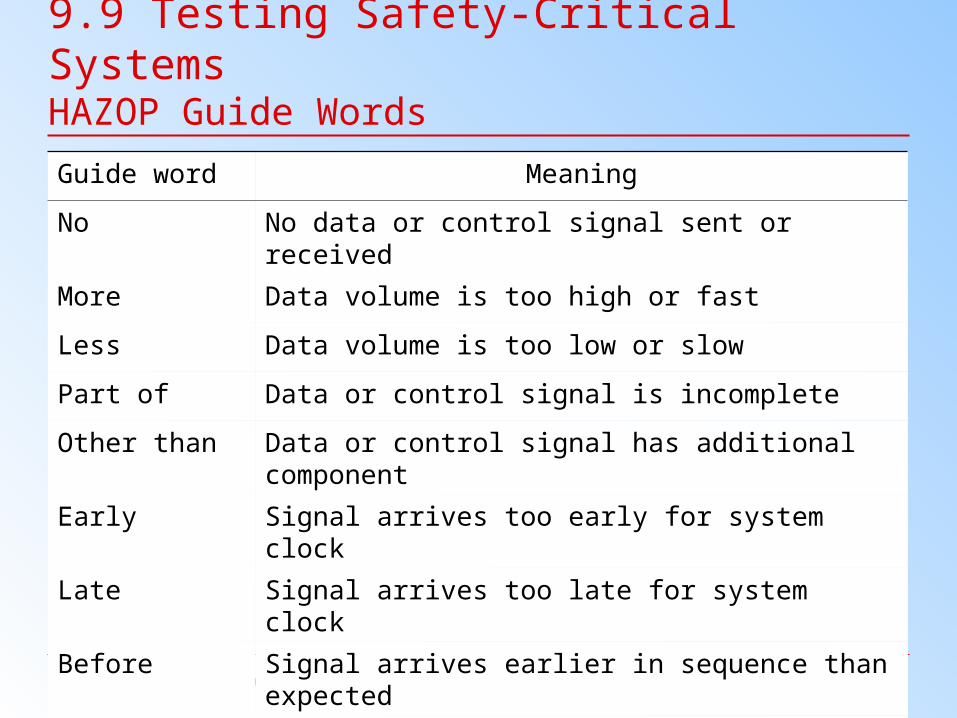
9.9 Testing Safety-Critical SystemsHAZOP Guide Words
Guide word Meaning
No No data or control signal sent or received
More Data volume is too high or fast
Less Data volume is too low or slow
Part of Data or control signal is incomplete
Other than Data or control signal has additional component
Early Signal arrives too early for system clock
Late Signal arrives too late for system clock
Before Signal arrives earlier in sequence than expected
After Signal arrives later in sequence than expected

Pfleeger and Atlee, Software Engineering: Theory and Practice
Page 9.70© 2006 Pearson/Prentice Hall
9.9 Testing Safety-Critical SystemsSHARD Guide Words
Flow Provision
FailureCategorization
Timing Value
Protocol Type Omission Commission Early Late Subtle Coarse
Pool Boolean No update UnwantedUpdate
N/A Old data Stuck at … N/A
Value No update UnwantedUpdate
N/A Old data Wrong tolerance
Out of tolerance
Complete No update UnwantedUpdate
N/A Old data Incorrect Inconsistent
Channel Boolean No data Extra data Early Late Stuck at … N/A
Value No data Extra data Early Late Wrong tolerance
Out of tolerance
Complete No data Extra data Early Late Incorrect inconsistent
Pfleeger and Atlee, Software Engineering: Theory and Practice
Page 9.71© 2006 Pearson/Prentice Hall
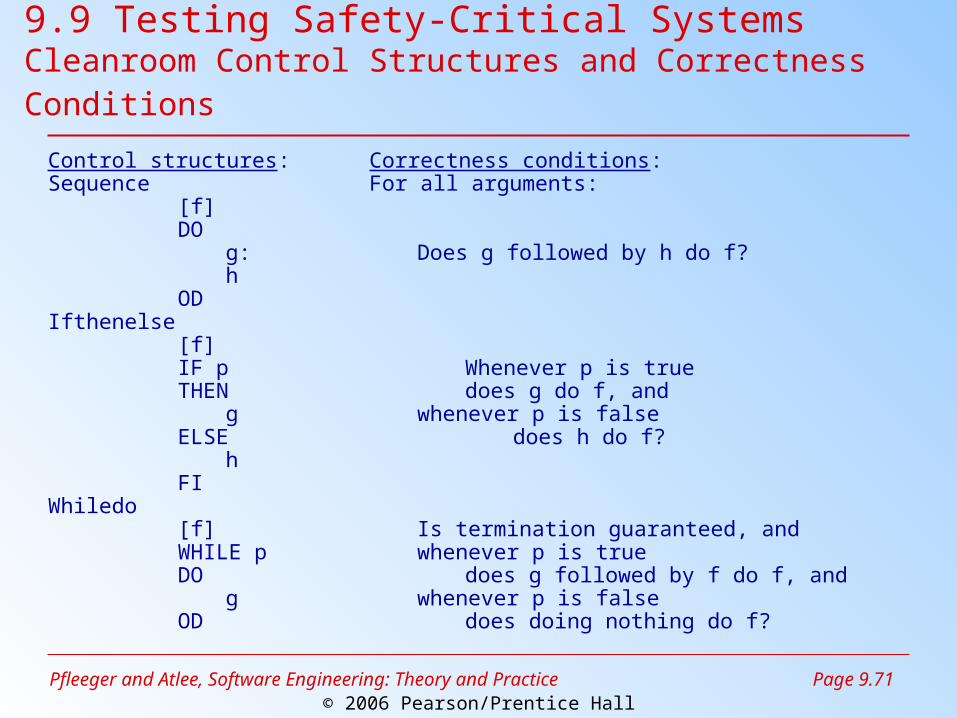
9.9 Testing Safety-Critical SystemsCleanroom Control Structures and Correctness Conditions
Control structures: Correctness conditions:Sequence For all arguments:
[f]DO
g: Does g followed by h do f?h
ODIfthenelse
[f]IF p Whenever p is trueTHEN does g do f, and
g whenever p is falseELSE does h do f?
hFI
Whiledo[f] Is termination guaranteed, andWHILE p whenever p is trueDO does g followed by f do f, and
g whenever p is falseOD does doing nothing do f?
Pfleeger and Atlee, Software Engineering: Theory and Practice
Page 9.72© 2006 Pearson/Prentice Hall
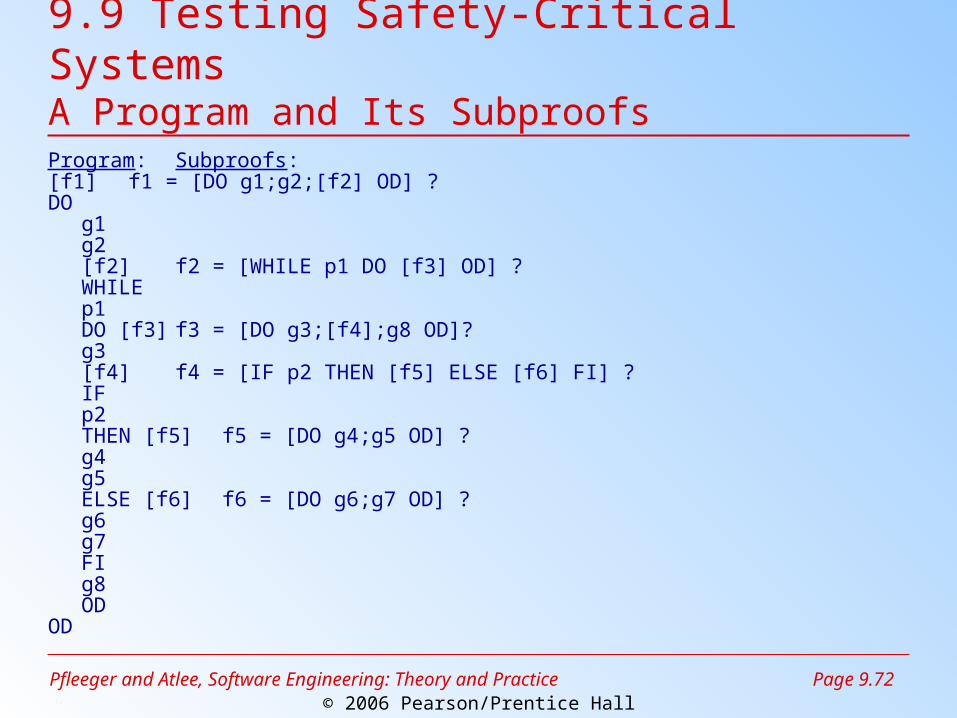
9.9 Testing Safety-Critical SystemsA Program and Its Subproofs
Program: Subproofs:[f1] f1 = [DO g1;g2;[f2] OD] ?DO
g1g2[f2] f2 = [WHILE p1 DO [f3] OD] ?WHILE
p1DO [f3] f3 = [DO g3;[f4];g8 OD]?
g3[f4] f4 = [IF p2 THEN [f5] ELSE [f6] FI] ?IF
p2THEN [f5] f5 = [DO g4;g5 OD] ?
g4g5
ELSE [f6] f6 = [DO g6;g7 OD] ?g6g7
FIg8
ODOD
Pfleeger and Atlee, Software Engineering: Theory and Practice
Page 9.73© 2006 Pearson/Prentice Hall
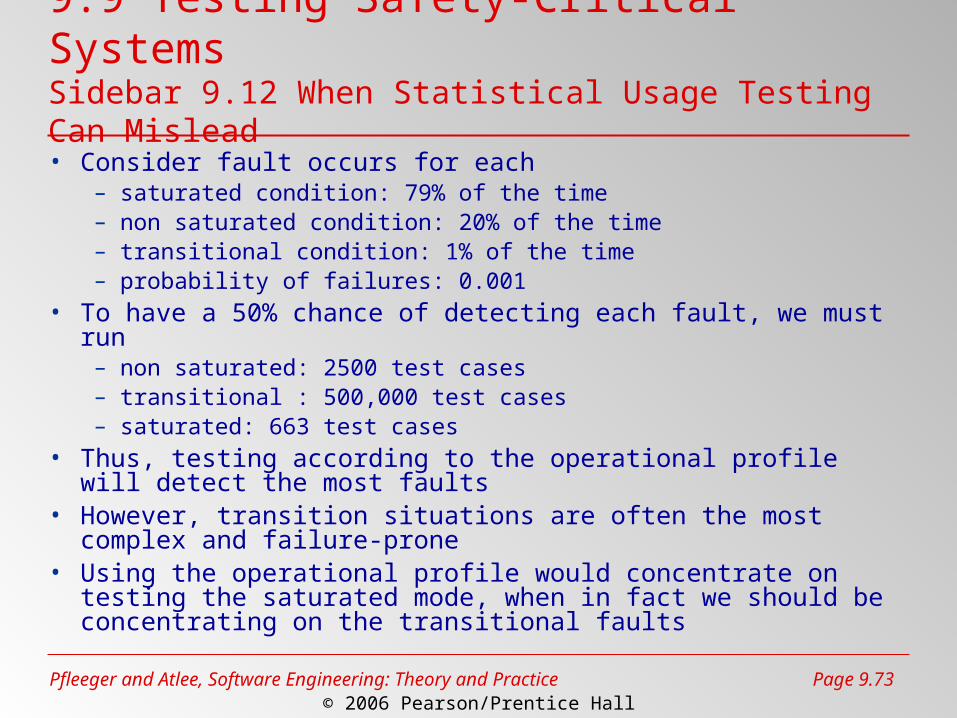
9.9 Testing Safety-Critical SystemsSidebar 9.12 When Statistical Usage Testing Can Mislead
• Consider fault occurs for each– saturated condition: 79% of the time– non saturated condition: 20% of the time– transitional condition: 1% of the time– probability of failures: 0.001
• To have a 50% chance of detecting each fault, we must run– non saturated: 2500 test cases – transitional : 500,000 test cases – saturated: 663 test cases
• Thus, testing according to the operational profile will detect the most faults
• However, transition situations are often the most complex and failure-prone
• Using the operational profile would concentrate on testing the saturated mode, when in fact we should be concentrating on the transitional faults
Pfleeger and Atlee, Software Engineering: Theory and Practice
Page 9.74© 2006 Pearson/Prentice Hall
9.10 Information System ExampleThe Piccadilly System
• Many variables, many different test cases to consider– An automated testing tool may be useful
Pfleeger and Atlee, Software Engineering: Theory and Practice
Page 9.75© 2006 Pearson/Prentice Hall
9.10 Information System ExampleThings to Consider in Selecting a Test Tool
• Capability• Reliability• Capacity• Learnability• Operability• Performance• Compatibility• Nonintrusiveness
Pfleeger and Atlee, Software Engineering: Theory and Practice
Page 9.76© 2006 Pearson/Prentice Hall
9.10 Information System ExampleSidebar 9.13 Why Six-Sigma Efforts Do Not Apply to Software
• A six-sigma quality constraint says that in a billion parts, we can expect only 3.4 to be outside the acceptable range
• It is not apply to software because– People are variable, the software process
inherently contains a large degree of uncontrollable variation
– Software either conforms or it does not, there are no degrees of conformance
– Software is not the result of a mass-production process
Pfleeger and Atlee, Software Engineering: Theory and Practice
Page 9.77© 2006 Pearson/Prentice Hall
9.11 Real-Time ExampleAriane-5 Failure
• Simulation might have helped prevent the failure– Could have generated signals related to
predicted flight parameters while turntable provided angular movement
Pfleeger and Atlee, Software Engineering: Theory and Practice
Page 9.78© 2006 Pearson/Prentice Hall
9.12 What This Chapter Means for You
• Should anticipate testing from the very beginning of the system life cycle
• Should think about system functions during requirement analysis
• Should use fault-tree analysis, failure modes and effect analysis during design
• Should build safety case during design and code reviews
• Should consider all possible test cases during testing