isak froumin prashant k. loyalka
TRANSCRIPT

The concept of public goods, the state, and highereducation finance: a view from the BRICs
Martin Carnoy • Isak Froumin • Prashant K. Loyalka •
Jandhyala B. G. Tilak
Published online: 25 February 2014� Springer Science+Business Media Dordrecht 2014
Abstract Because higher education serves both public and private interests, the way it is
conceived and financed is contested politically, appearing in different forms in different
societies. What is public and private in education is a political–social construct, subject to
various political forces, primarily interpreted through the prism of the state. Mediated
through the state, this construct can change over time as the economic and social context of
higher education changes. In this paper, we analyze through the state’s financing of higher
education how it changes as a public/private good and the forces that impinge on states to
influence such changes. To illustrate our arguments, we discuss trends in higher education
financing in the BRIC countries—Brazil, Russia, India, and China. We show that in
addition to increased privatization of higher education financing, BRIC states are
increasingly differentiating the financing of elite and non-elite institutions.
Keywords Affirmative action � Cost differentiation � Externalities �State legitimacy
The most difficult issues of political economy are those where goals of efficiency, freedom of choice, and
equality conflict.
James Tobin, 1970
M. Carnoy (&) � P. K. LoyalkaStanford University, Stanford, CA, USAe-mail: [email protected]
P. K. Loyalkae-mail: [email protected]
I. FrouminNational Research University Higher School of Economics, Moscow, Russiae-mail: [email protected]
J. B. G. TilakNational University of Educational Planning and Administration, New Delhi, Indiae-mail: [email protected]
123
High Educ (2014) 68:359–378DOI 10.1007/s10734-014-9717-1

Introduction
Higher education has historically been viewed as both a public and a private good, and
higher education financing has been at the center of the debate over this definition (see, for
example, Donahue 1989; Stiglitz 1999). As others have noted, education inherently serves
both private and public interests (Levin 1987; Marginson 2007). It serves private interests
by enhancing the capacity of individuals to gain economic and social benefits. It also has
public value because more highly educated individuals are likely to increase others’
productivity (Romer 1994) and to embrace the fundamental tenets of a tolerant democratic
society, which benefits all citizens (Mill 1869).
Because higher education serves both public and private interests, its conception and
financing is contested politically, appearing in different forms in different societies (Kaul
and Mendoza 2003; Marginson 2007). When seen this way, what is public and private in
education becomes a political–social construct (Mansbridge 1998; Menashy 2011), subject
to various political forces, primarily interpreted through the prism of the state. Mediated
through the state, higher education’s construct can change over time as its economic and
social context changes.
According to Samuelson’s classic definition (1954), a public good is characterized by
nonrivalrous consumption—its consumption by one individual does not detract from
consumption by another individual—and non-excludability—it is difficult if not impossible
to exclude an individual from enjoying the good (Stiglitz 1999). According to this defi-
nition, the public good aspects of the knowledge individuals acquire in higher education
are those that others in society get to consume—for example, co-workers who pick up
some of the higher educated individual’s knowledge or fellow citizens treated more tol-
erantly and fairly because of the knowledge the individual acquired. Thus, a principal issue
in the public/private good controversy is social efficiency. If there are significant economic
and social externalities associated with increasing the number of higher education grad-
uates or if imperfect capital markets pose barriers to socially optimal levels of investment
in higher education, public interest demands levels of state subsidies that would provide
adequate higher education for the public good.
This economic approach is useful heuristically, but much of the value of externalities
ultimately depends on ideology (what ‘‘society’’ defines as having social value), and
ideology, in turn, depends on political power relations. If the political decision process is
truly democratic and pluralistic, and full information is equally available to all individuals,
the value of externalities could closely reflect the sum of the values individuals living in a
society place on them. But this democratic, full information political model is rarely
realized. In most societies, economic power and state power are closely entwined. The
state (the political system) places a value on externalities that reflect these highly unequal
power relations and the asymmetric influence, even in a democracy, of economically
powerful groups in defining the value of externalities associated with certain types of
higher education.
Equity has also played a role in the debate: lower social class families may face
especially large financial, informational, or other disadvantages in gaining entry into higher
education. The most important of these is that higher social class families impart academic
advantages to their children before and during their schooling that are less available to
children of lower social class families. If a society values fairness and places social and
political value on ensuring desired levels of equity, the public aspect of education would
include financing it in ways that mitigate such disadvantages (Koski and Reich 2006). This
equity argument has been extended to make education as a whole—including higher
360 High Educ (2014) 68:359–378
123

education—a human right, situating it completely in the public space, available for all at
public expense.1 Again, social preferences for equity are mediated through the state, and
depending on power relations in the state, the state can interpret what ‘‘equitable’’
financing means in terms of higher education as a public and private good.
In this paper, we analyze how the state’s financing of higher education can shape it as a
public/private good. We also analyze the forces that impinge on states to influence such
changes. We do not pretend to ‘‘prove’’ empirically the model we propose. Our goal is to
understand the dynamics of higher education developments over the past 20 years. The
paper is therefore largely suggestive.
The analysis is also somewhat different from the ‘‘privatization’’ discussion, although
related to it. We focus more on how higher education is paid for than on the types of
institutions students attend. Yet, we do discuss that there are many ways of ‘‘privatizing’’
the costs of higher education, and some of these—such as promoting private institutions
charging tuition to absorb enrollment expansion—could be considered as shifting educa-
tion even more toward a private good than, for example, cost sharing in public institutions.2
In our discussion of higher education as a public/private good, we focus on the
somewhat narrower issue of higher education financing, and we do so using the example of
the BRIC countries—Brazil, Russia, India, and China. The BRICs are particularly inter-
esting in studying shifts in the definition of higher education as a public/private good for
several reasons: forty percent of the world’s population lives in these four countries; their
university systems have expanded enormously since 1995; they have all redefined the
public/private nature of their systems; and before the early 1990s, in two of the BRICs
(China and Russia), higher education was totally publicly financed and managed. The
BRICs are not necessarily typical of developing countries, but they represent a broad range
of interesting and important examples of how nation-states are funding their higher edu-
cation expansion and the implications this has for the private/public good debate in terms
of social efficiency and social equity.
Although we center our analysis on the state, it is not feasible to formulate a single
theory of BRIC state behavior to explain the way BRIC States respond to the pressures for
higher education expansion and quality improvement. State theories are generally situated
in the particular historical contexts of each society (Carnoy 1984), and the four BRIC
countries have very different political, economic, and social histories. This makes it dif-
ficult to come up with a single, unified theory of state behavior for the BRICs.
Nevertheless, for all their different histories, in today’s globalized network society
(Castells 1996), BRIC states do have in common that they reproduce political power
1 Tobin (1970) has argued, for example, that societies may choose to provide basic education to all in thespirit of commodity egalitarianism.2 Although the shift to direct private financing (tuition) does shift political perceptions of higher educationas a public or private good, there are important differences between paying tuition to public and to privateinstitutions. Paying for publicly owned services does not imply that the services are therefore ‘‘private.’’State-owned hospitals and universities and petroleum companies can and do charge for the goods andservices they provide. Public ownership conveys a level of public accountability for how these institutionsbehave that differentiates them from private firms. Similarly, privately-owned institutions subsidized (andregulated) by the state are still ‘‘private’’ in that they are owned by private individuals and accorded propertyrights different from state-owned entities. Students attending and employees working for private and publichigher education institutions generally have different ‘‘rights’’ accorded them by the state. Nevertheless,paying for public services does make them more ‘‘private’’ than when they are free: the individual buyerplays a role in deciding how much of that good to use. Similarly, government subsidies (and regulations) ofprivately owned firms makes them more ‘‘public’’ than when they are free (or obliged) to respond only tomarket forces.
High Educ (2014) 68:359–378 361
123
largely by seeking political legitimacy, that they seek this legitimacy largely domestically
but also internationally, and that they consider their higher education policies as playing a
potentially important role in achieving legitimacy. All states need to reproduce political
power to survive, and various theories of the state present different views of how political
power is reproduced—whether the mass of voters is in control of that reproduction;
whether it is powerful interest groups lobbying the electorate; whether political power
resides in those who control capital, and through capital, the economy; or whether power
resides directly in the structures of power, including knowledge, the means of communi-
cation, ideology, and the state’s control of the means to repress dissent (see Carnoy 1984,
for a summary).
Our main argument is that these states use the expansion of education, including uni-
versity education, to simultaneously promote capital accumulation, economic growth, and
political legitimation with the mass of families who want to enhance their children’s
employability and social mobility (Offe 1973). We contend that the public/private nature
of higher education is played out in this political economic context. Education also helps
realize the self-interest of the state actors (including the intellectual elites in public uni-
versities) to increase state revenue and reproduce state power (Weiler 1983). Different
groups in the state bureaucracy may have different views on how best to reproduce state
power—that is, how to keep control of the state’s revenue and how it is to be used—but
ultimately competing bureaucratic groups are situated in a state that must legitimate itself
or collapse. Expanding education and reforming it serves the state because more and better
education—in the state’s collectivity of competing bureaucrats’ view—increases the
probability that workers find jobs, gives workers the hope that they and their children can
move up the social and economic ladder, and simultaneously increases the profitability of
capital through higher worker productivity, which in turn, increases state revenues and
bureaucrats’ power and legitimacy. How higher education ends up serving private and
public interests is part and parcel of state bureaucracies legitimizing their own power.
It is fair to ask whether in a globalized economy global rather than national social
constructions dominate nation-states’ choices in financing and shaping their higher edu-
cation systems. A number of recent analyses of higher education financing in developing
countries have focused on the shift from central and regional government funding of
universities to a reliance on private tuition paid by students and their families either to
private or public institutions (World Bank 2000; Altbach and Levy 2005; Altbach et al
2009; Tilak 2008). This shift and other aspects of higher education expansion in devel-
oping countries has been linked to a neo-liberal hegemonic globalization of economy and
culture (Marginson and Ordorika 2010).
Our analysis allows that globalization has had an important impact on national state
policies and that part of its impact is probably mediated through favorable neo-liberal
views toward directly privatizing education through the expansion of privately run, pri-
vately paid for schools and universities and increasing the share of education costs col-
lected through tuition in public institutions. However, in the case of the BRICs, we stress
another important impact of globalization, namely its effect on the economic payoff to
higher education, particularly certain programs of study in higher education.
Our analysis also suggests that in terms of society’s preferences for equity, which is an
important part of the public–private debate, the state’s shift from a more public to a more
private definition of higher education could produce more rather than less fairness in the
way the state distributes its resources, particularly when—as in the case of three of the
BRIC countries—only a moderate proportion (and therefore higher income segment) of the
population has access to higher education. Given that merit-based admission (academic
362 High Educ (2014) 68:359–378
123

performance in secondary school and higher education entrance tests) tends to favor stu-
dents from higher socio-economic class families (Astin and Oseguera 2004),3 equity
considerations suggest that those who are inherently favored in getting access to high
private payoffs associated with higher education should be ‘‘taxed’’ for that advantage in
some way, either up front by paying directly for higher education or by being taxed
appropriately on the private economic gains from higher education, or both.4 In either case,
to achieve greater fiscal equity, such tax revenues would have to be redistributed in some
form to services or subsidies for lower income groups.
At the same time, charging tuition—the more popular form of taxing higher education
investors—could pose financial barriers to students from low-income families, who may
therefore view it as inherently unfair. This helps explain why states concerned with a social
preference for equity may simultaneously shift to charging tuition in universities and
implement affirmative action and subsidy programs for disadvantaged groups in both
public and private universities.
Given our framework for how the shaping of higher education as a public and private
good is played out in the contested political terrain of the state, we make the case that the
state’s distribution of both higher education places and public resources going to higher
education among different social class groups provides one important and meaningful basis
for discussing higher education as a public/private good. In effect, the process of collecting
and spending public resources to fund higher education suggests how the state crystalizes
power relations in its shifting provision of higher education as a public/private good, and,
simultaneously, helps us understand the contradictions this crystallization generates as
higher education continues to expand.
The shift to direct private financing
Four decades ago higher education in three of the BRIC countries (all but Russia) was
accessible to a limited few, and, except in Brazil, essentially free to all students who
attended. Today, the four countries have, in one way or another, either implemented cost–
sharing by introducing tuition fees in public universities, or by allowing higher education
to become more of a ‘‘private’’ good through the expansion of publicly regulated or
essentially independent private universities. The main point is that BRIC states have
shifted the responsibility for funding young people’s higher education directly to them and
their families.
China
Of all the world’s countries, China has made the most radical transformation of its higher
education system in the shortest period of time. The state closed down the university
3 In the United States, ‘‘Perhaps the principal obstacle to access to highly ranked institutions among poorand underrepresented students is the system of selective admissions which favors students who perform wellon standardized admissions tests and who have high grade point averages (GPAs) from secondary school’’(Astin and Oseguera 2004, p. 323).4 The traditional European model of providing free public higher education and charging relatively highmarginal income taxes on the middle class to pay for it was not a particularly successful strategy forredistributing the economic gains from higher education to lower income groups, for the reasons of pre-higher education disadvantage discussed above (Bourdieu and Passeron 1977).
High Educ (2014) 68:359–378 363
123

system during the Cultural Revolution in the 1960s (the state defined higher education as
having negative public value). Universities were reopened in the 1970s and very gradually
expanded enrollment. Higher education was completely free, but restricted. By 1996, only
about 3 million (three and four-year degree) students, attended postsecondary institutions.
At that point, the state’s political views concerning the economic and social role of higher
education changed. Enrollment was allowed to increase to 24 % of the age cohort, or about
27 million students, by 2009, of which 14 million were in four-year institutions (about
15 % of the age cohort). The basic sources of financing for higher education in China also
changed substantially—from a system that was paid for mainly by direct government
contributions (83 % of funding; much of the rest came from other monies raised by
universities, not tuition) in 1990 to one in which just less than half (49 %) of the funding
came from direct government contributions and about one-third (33 %) came from tuition
and other student fees in 2009.
Today, 80 % of students attend public institutions and pay fees covering part of the total
costs of their education. The proportion of fees to total costs depends on the tier of the
institution and is lowest for the most expensive elite institutions. The remaining 20 % or so
attend ‘‘overflow’’ private institutions that charge higher tuition fees (which are also set by
the government) but are characterized by lower costs per student. Although onerous for
many families, cost sharing was argued by policymakers to be necessary to support higher
education expansion (Min, 2004). Average fees in public and private institutions rose by
approximately 4–5 times from 1997 to 2006. Then in 2007, explicitly conscious of
potential political backlash from further tuition increases, the State Council fixed tuition at
2006 levels for 5 years such that they would no longer increase but rather continue to differ
systematically by province, university tier, and, to a smaller degree, by field of study (State
Council 2007).
India
India’s higher education system is still influenced by its British colonial legacy and by its
structure as a federal system, with considerable political power over educational policy in
the states (Carnoy and Dossani 2013). In 1985, there were less than 6 thousand colleges
with about 4.5 million students; by 2009–2010, there were more than 32 thousand colleges
with 17 million students (of which about 14 million were undergraduates). Despite such
massive growth, the proportion of the age cohort attending bachelor degree programs has
remained relatively low (as in China), reaching about 15 % in 2009–2010.
An increasing proportion of students attending public colleges in India pay tuition (in
some states, tuition revenue is more than half the public budget for higher education) and
the rapidly increasing number of ‘‘unaided’’ private colleges that rely exclusively on
tuition. Expansion and the shift to private funding have been mainly the product of a
political patronage system in the Indian states (Carnoy and Dossani 2013). Private higher
education accounts for about four-fifths of enrolment in professional programs and about
60 % overall. Private engineering colleges accounted for almost 90 % of the annual stu-
dent enrollment in 2011–2012 (Planning Commission 2012; Carnoy et al. 2013).
At the same time, India has legislated national affirmative action that benefits 50 % of
Indian students designated as ‘‘disadvantaged’’ classes. These students pay the lowest level
of fees (or no fees in some states) even in private unaided institutions. All institutions are
required to admit one-half their students from such designated groups.
364 High Educ (2014) 68:359–378
123

Brazil
Like India’s higher education system, Brazil’s is heavily influenced by its particular
colonial legacy, which made it a late starter in providing university education and with a
higher proportion privately financed than in other Latin American countries. By the 1970s,
private enrollment was already 60 % of the total. Private institutions increasingly absorbed
the expansion after 1997. Enrollment in the higher education system as a whole increased
from 1.8 million students in 1995, of which 1.1 million were in private institutions, to 5.4
million students in 2010, of which 4.0 million were in private institutions. Today, about
75 % of enrollment is in private institutions (INEP 2000, 2008, 2011).
Brazil’s system is very different from the other BRICs in three important ways: First,
public universities have traditionally been essentially free (similarly to the other BRICs in
the 1980s) and continue to be free of tuition. Second, a high fraction (even higher than in
India) of university and other post-secondary students attend fee-for service, unsubsidized
private institutions. Third, some of those private institutions are religious-based, almost all
Catholic. Thus, in terms of defining higher education as a private good, Brazil has relied
heavily on enrolling students in privately owned, tuition-charging institutions, many of
them for-profit, only moderately regulated by the state.
Recently, Brazil passed affirmative action legislation requiring federal universities to
admit disadvantaged minority students who attended public high schools on a quota basis.
The Brazilian government also provides scholarships (ProUni) to these same types of
students to attend private universities.
Russia
Russia’s current university system was largely in place by the 1980s, with high levels of
youth enrollment by developed country standards, completely free for students (by law,
under the Soviet Constitution) and organized to meet the demands of a command economy.
Many universities were linked directly to particular industries. As the command economy
went into economic and political crisis in the late 1980s and early 1990s, funding for higher
education declined by about 40 % and enrollment declined by about 10 %. To support
‘‘excess demand’’ for university places, The Yeltsin government changed the Constitution
during the government’s revenue crisis to allow public universities to admit fee-paying
students (Brainerd 1998). As the economy began recovering in the mid-1990s, Russia
witnessed an enormous enrollment increase over the next 12 years. Eventually, the state
also allowed for private higher education institutions. By 2008, Russia had one of the
world’s highest percentages of young people enrolled in higher education (76 %).
The Russian government continued to allocate government paid (‘‘budgeted’’) places to
universities for different fields of study. Tuition-based financing had a particularly large
effect on highly demanded fields of study such as economics and business, so that by 2006,
almost one in two students in public institutions was paying tuition. In addition, private
institutions served increasing numbers of students. By 2011–2012, about 17 % of students
were in private higher education.
How much do the BRIC countries spend on higher education?
One of the direct effects in three of the BRICs of expanding enrollment by shifting to
increased direct private financing of higher education was to reduce average costs per
High Educ (2014) 68:359–378 365
123

student (Brazil and China) or maintain them at a low level (India). We estimated public
spending for students attending public institutions and the average tuition paid in public
and private institutions for the first decade of the 2000s to suggest the kinds of changes
taking place in spending per student in recent years.5
Figure 1 shows these estimates in 2005 purchasing power parity (PPP) dollars (adjusted
for differences in living costs between countries). Brazil spends about the same per student
as developed countries such as France, Italy, and Spain in 2000. India spends a low 2005
PPP$1,400 per student, including private tuition fees. Adjusted for inflation, Brazil, China,
and India (slightly) reduced average spending per student in 2000–2009 (Brazil sharply
because of the drop in average tuition paid in private institutions), but Russia used
increasing petroleum revenues in the 2000s to increase spending per student from low
levels in the 1990s.
Much of the drop in higher education spending per student in Brazil, China, and India has
come from a ‘‘composition effect.’’ As more students enrolled, low cost (and lower quality)
institutions absorbed a greater proportion. In China, this meant the rapid growth of non-elite
public institutions and eventually low quality private institutions. In Brazil and India in the
2000s, it took the form of a rapid increase of low-cost, generally low quality private
institutions. Thus, the mass of ‘‘new’’ students was largely absorbed in low spending per
student institutions, and this drove down average costs per student in higher education.
Why were the BRICs able to increase cost sharing?
During this period of rapid expansion, all four BRIC countries moved in a variety of ways
away (China, Russia) or further away (Brazil, India) from a free, highly subsidized public
good conception of higher education. One argument is that they did so because of a global
ideological change regarding the state’s role in the economy, driven mainly by the United
States and Great Britain and supported by important national agencies such as the World
Bank and International Monetary Fund. There is evidence that the 1980 s saw such an
ideological shift and that it influenced economic restructuring in Brazil, India, and Russia
in the early 1990s. Shifting ideology therefore probably played some role in the decisions
to shift to private financing in higher education (Serra and Stiglitz 2008; Edwards 1998).
However, in terms of our notion of state legitimation, a better explanation of how
globalization influenced higher education financing in the BRICs is rooted more in
objective economic conditions—namely, globalization and the information revolution
increased worldwide (and national) demand for higher educated labor. Together with the
shift in China and Russia from command to market economies, this increased the relative
incomes of (young) BRIC university graduates, in turn pressuring BRIC states to expand
the number of places in higher education institutions. In addition to this direct pressure, the
boom in information technology probably convinced states that investing in higher edu-
cation had a high social payoff, particularly in terms of increasing average productivity in
the labor force and therefore economic growth.
Nevertheless, the BRIC states in the 1990s were hardly prepared to take on the total cost of
greatly expanding their universities. The BRICs had lower per capita incomes in the mid-
1990s (China and India, much lower) and had less developed fiscal systems to increase
revenues than the developed European countries had in the late 1960s, when they began their
5 In China, we used only public spending per student, although costs are slightly lower in private institu-tions. The estimates are more approximate in Brazil and India because of the large number of fee payingstudents and the relatively little that is known about how much students pay privately for higher education.
366 High Educ (2014) 68:359–378
123

latest higher education expansion. Russia was in a major recession in the early and mid-1990s.
BRIC governments needed to rely on private tuition payments to be able to afford expansion.
From a social efficiency standpoint, policymakers in the BRIC countries might also
have been justified in moving away from the highly subsidized public higher education
model if private returns to higher education were rising rapidly (China, Russia), moder-
ately (India), or already very high (Brazil). The willingness of (mainly higher income)
families to pay for higher education would reflect their perception that their children
realize much higher earnings as graduates. Even lower income families should be more
likely to accept paying tuition when payoffs appear high. If families’ perceptions regarding
payoffs shifted enough, BRIC states could maintain political legitimacy while taxing
families directly for higher education services.
Private rates of return to higher education in the BRICs over the past 25 years appear to
have increased rapidly (China), increased (Russia), remained constant at a fairly high level
(India), and declined slowly from very high levels (Brazil), all in the face of substantial
increases in the absolute and relative number of graduates. The payoff also rose relative to
the payoff to higher secondary school. Except for India, which has the lowest fraction of
the age cohort in higher secondary schooling among the BRICs, the payoffs to higher
education now exceed the payoffs to completing higher secondary schooling (Table 1).6
We also found that the payoffs to engineering and business graduates were higher in all
the BRICs than the average rates of return shown in Table 1. The great expansion of
private unaided colleges in India has been in engineering and business, and in Russia, the
main expansion of paid places in public universities has been in business and economics.
0
1,000
2,000
3,000
4,000
5,000
6,000
7,000
8,000
9,000
10,000
Russia Brazil India China
To
tal S
pen
din
g/S
tud
ent
(200
5 P
PP
$)
2000 2006 2009
Fig. 1 BRIC Countries: total of private plus public spending in higher education per student, by country,2000–2009 (in 2005 PPP dollars). Source Authors’ estimates based on national data sources and OECD,Education at a Glance, 2001, 2002, and 2011
6 Not all the rates we show were corrected for selection bias, but selection bias should probably be decliningas a higher fraction of the age cohort attends and graduates from university.
High Educ (2014) 68:359–378 367
123

The rapidly increasing average payoffs in China and the historically very high payoffs in
Brazil to completing university have made it easier for the state in those countries to charge
tuition in all fields of study.
Such high (and rising) rates of return accentuate the value of higher education as serving
private interests, giving the state options to shift financing of higher education to (mainly elite
and higher middle class) families without jeopardizing the state’s political legitimacy. Social
externalities associated with the expansion of higher education in these societies are still
likely to be positive, and public pressure still exists to keep higher education free. The BRIC
states have in various forms all indicated concern that too high tuition will lead to underin-
vestment in higher education, or simply a political reaction as increasing numbers of students
from lower income families gain entrance to lower tier (often private) universities but have
difficulty paying tuition. India and Brazil have legislated affirmative action programs that
cover both public and private institutions; China has kept tuition rates fixed for the past
7 years; and Russia tightly controls the tuition public and private universities can charge and
has kept up the number of budgeted (free) places in universities despite a declining youth
population. However, the states in all four countries have opted to expand higher education
places rapidly rather than at the much slower rate had higher education been made free to all.
The trend toward increasing differentiation
In addition to shifting to extensive private financing, at least three of the BRIC states have
politically ‘‘negotiated’’ their definition of higher education as a public/private good through
explicit policies that increasingly differentiate financing between elite and non-elite insti-
tutions.7 In part BRIC states maintain legitimacy with economically more powerful groups
by continuing to favor high-income families with much larger than average public subsidies
to attend university. In the new financing configurations, this takes place mainly through the
process of increased cost differentiation between elite and non-elite universities.
Increased financial differentiation results from a complex set of global and domestic
political pressures. Superimposed on BRICs major expansion of enrollment at lower
average cost per student was a new global ‘‘imperative’’: in the first decade of the 2000 s,
countries were increasingly defined in terms of the quality of their education systems. This
included the quality of their higher education institutions. As ‘‘world powers,’’ China and
Russia were especially sensitive to this imperative, and they began investing heavily in
their elite institutions to attain ‘‘world class’’ status.
The ‘‘world class university movement’’ and the focus on developing expensive, research
based elite universities could serve the state’s domestic legitimacy in several ways: (1) such
universities are perceived to contribute significantly to economic growth by producing cut-
ting-edge scientific research and highly trained cadres—less democratic (more ‘‘permanent’’)
regimes, such as those in China and Russia, can take a longer-term view of economic growth
and its impact on their political legitimacy; (2) developing prestigious institutions potentially
helps legitimize the state as a national power, assuming that higher ranking in university
league tables has political meaning domestically; and (3) investing in elite universities can
help the state maintain legitimacy with some privileged groups in society by subsidizing their
7 India has elite universities that spend much more per student than non-elite institutions, but they do notappear to be receiving increasing funding per student relative to mass institutions. Nevertheless, the gap maybe increasing in India because of declining spending per student in private colleges that we could notmeasure.
368 High Educ (2014) 68:359–378
123

children to attend high cost public universities—this keeps relatively high levels of public
spending flowing to high-income families even as the state makes these same (as well as less
elite) families pay for higher education that used to be free.
Therefore, in addition to the ‘‘composition effect’’ that reduces average spending per
student in China, India, and Brazil through enrollment expansion mainly in low cost, low
quality institutions, real (corrected for inflation) spending per student in their mass insti-
tutions in the 2000s also tended to decline. Further, in China, Brazil, and Russia, the gap
between spending in elite and non-elite institutions has increased.
In China, spending per student in elite institutions was about 20 % higher than non-elite
universities (about 3,200 constant (2008) Yuan) in 1997, but doubled by 2007, and
increased substantially after 2007 (Fig. 2).
Since tuition and other fees have been fairly similar between elite and non-elite public
institutions, discrepancies in total spending per student across these institutions throughout
the first decade of the 2000s were largely due to differences in the size of government
allocations to each type of institution. The central government has earmarked major
financial support for elite institutions.8
Table 1 BRIC countries: private rates of return to secondary and higher education, 1980s to 2008 (percentper year of schooling)
Country/level of education 1980 1990 1995 2000 2005 2008
Brazil Secondary 16 12 12 2c
Brazil University 20 25 23 25c
China Secondary 4 5 6 10
China University 3 6 9 20
India Secondary 20 14 6b 12
India University 13 12 12b 12
Russia Professionala 6 7 3
Russia University 5 5 6 10 6
Sources Brazil: Psacharopoulos (1985, 1994); authors’ estimates using 2000 census data and 2008 house-hold survey data. China: Johnson and Chow (1997), Li (2003), de Brauw and Rozelle (2006), Heckman andLi (2004), Zhang et al. (2005); authors estimates for 2005 based on the 1 % national population survey datafor 2005. The results shown were estimated using a censored least absolute deviations (CLAD) model, withdummy indicator variables for level of education completed—these estimates correct for the censoring ofwages at zero (i.e., the estimates account for the fact that many persons do not work and earn wages), but donot correct for other types of selection bias. India: Psacharopoulos (1985), Duraisamy (2002), Dutta (2006);authors’ calculations using India National Household Survey, 2006. Russia: Brainerd (1998), Gor-odnichenko and Peter (2004), Denisova and Kartseva (2005); authors’ calculations using Russian Longi-tudinal Monitoring Survey, 2004–2006 and 2006–2008a Post-secondary, non-universityb Males only—rates of return to secondary school have traditionally been much lower for males thanfemales in India, so the secondary school rate of return in 2000 is not comparable with other yearsc Household survey data are less reliable than census data, so these estimates, particularly the ROR tosecondary school, may be biased
8 ‘‘Project 985’’ has provided the designated top 9 universities in China, as well as the next 26 (in the firststage, 28 in the second stage) institutions with close to 60 billion Yuan between 1999 and 2008 forimproving quality. Specifically 27.5 billion Yuan was allocated in the first stage (1999-2001), 30 billionYuan in the second stage (2004–2008), and an as yet undisclosed amount in the third stage (2010-onwards)of the project. Project 211, which was initially implemented in 1994, well before the expansion of thesystem, has also provided most of the 100 plus Ministry-run (elite) institutions (including the Project 985
High Educ (2014) 68:359–378 369
123

As both public and private non-elite (local-level) institutions have had far fewer funds to
work with than elite (Ministry-level) institutions, they have been motivated to keep costs
per student down. Indeed, the student-faculty ratio in Chinese higher education institutions
has risen rapidly during the expansion, doubling from 8 in 1993 to more than 17 in 2008
(NBS various years).
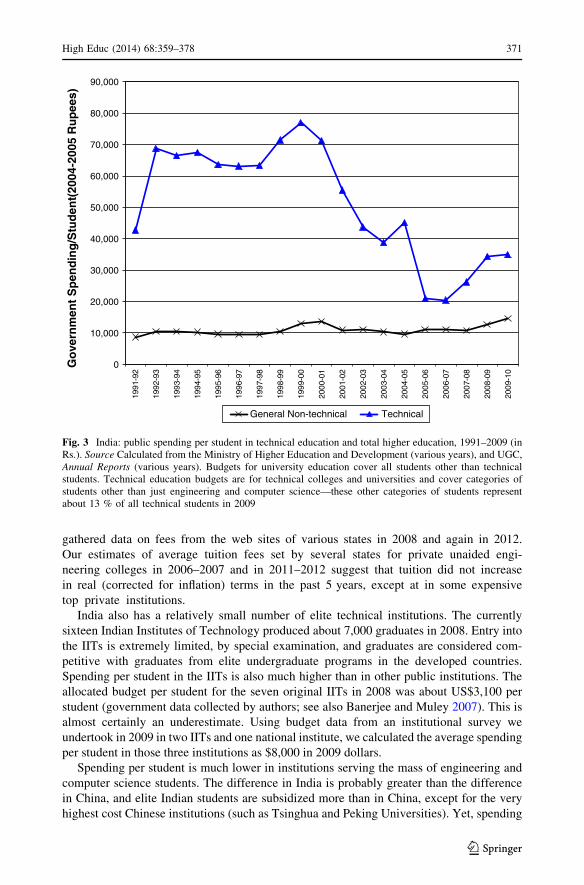
India’s enrollment expansion strategy in the early 2000s was also a steady reduction in
public spending per the total students in higher education until the middle of the decade
when it began rising (Fig. 3).9 These data do not include the increasing private spending
per student, so they only indicate that average public spending per the total number of
students in the 2000s declined somewhat, and that public spending per engineering student
fell by about one-half.
Full costs are recovered for most professional programs in private institutions and,
significantly, also in public institutions (Agarwal 2006). Tuition fees remain low in central
universities (usually attended by the highest scoring students), but they are quite high in
many state universities. In the late 1990s, nearly 50 % or more of the operating budget of
many state universities, such as Madras University (50.4 %), Bangalore University
(63.7 %), and Punjab University (50.4 %) came from student fees (Carnoy et al. 2013;
Beteille 2008).
A high percentage of non-elite engineering students are in private institutions, so
we can estimate spending per these students from fees in private colleges. We
0
5,000
10,000
15,000
20,000
25,000
30,000
35,000
40,000
1994 1995 1996 1997 1998 1999 2000 2001 2002 2003 2004 2005 2006 2007 2008 2009 2010
Sp
end
ing
per
Stu
den
t (2
008
Yu
an)
Ministry HEIs Local HEIs
Fig. 2 China: spending per student by type of institution, 1994–2010 (2008 Yuan) (Includes 3 and 4-year degreegranting higher education institutions). Source NBS, various years. National Bureau of Statistics of China 2010.
Footnote 8 continuedrecipients) with close to 19 billion RMB (until 2011) for improving institutional capacity and developingkey disciplines. See {http://english.people.com.cn/90001/6381319.html} September, 2011.9 It is difficult to get overall spending per student data in India, so our estimates of increasing differentiationare limited to engineering colleges/universities. They should be viewed as approximate.
370 High Educ (2014) 68:359–378
123
gathered data on fees from the web sites of various states in 2008 and again in 2012.
Our estimates of average tuition fees set by several states for private unaided engi-
neering colleges in 2006–2007 and in 2011–2012 suggest that tuition did not increase
in real (corrected for inflation) terms in the past 5 years, except at in some expensive
top private institutions.
India also has a relatively small number of elite technical institutions. The currently
sixteen Indian Institutes of Technology produced about 7,000 graduates in 2008. Entry into
the IITs is extremely limited, by special examination, and graduates are considered com-
petitive with graduates from elite undergraduate programs in the developed countries.
Spending per student in the IITs is also much higher than in other public institutions. The
allocated budget per student for the seven original IITs in 2008 was about US$3,100 per
student (government data collected by authors; see also Banerjee and Muley 2007). This is
almost certainly an underestimate. Using budget data from an institutional survey we
undertook in 2009 in two IITs and one national institute, we calculated the average spending
per student in those three institutions as $8,000 in 2009 dollars.
Spending per student is much lower in institutions serving the mass of engineering and
computer science students. The difference in India is probably greater than the difference
in China, and elite Indian students are subsidized more than in China, except for the very
highest cost Chinese institutions (such as Tsinghua and Peking Universities). Yet, spending
0
10,000
20,000
30,000
40,000
50,000
60,000
70,000
80,000
90,000
1991
-92
1992
-93
1993
-94
1994
-95
1995
-96
1996
-97
1997
-98
1998
-99
1999
-00
2000
-01
2001
-02
2002
-03
2003
-04
2004
-05
2005
-06
2006
-07
2007
-08
2008
-09
2009
-10
Go
vern
men
t S
pen
din
g/S
tud
ent(
2004
-200
5 R
up
ees)
General Non-technical Technical
Fig. 3 India: public spending per student in technical education and total higher education, 1991–2009 (inRs.). Source Calculated from the Ministry of Higher Education and Development (various years), and UGC,Annual Reports (various years). Budgets for university education cover all students other than technicalstudents. Technical education budgets are for technical colleges and universities and cover categories ofstudents other than just engineering and computer science—these other categories of students representabout 13 % of all technical students in 2009
High Educ (2014) 68:359–378 371
123

on operating costs per student in the IITs appears to have increased much more slowly than
in elite Chinese institutions in the past 10 years (Fig. 4).
Since average spending per student (public plus private) for the mass of students in non-
elite engineering institutions probably stayed about the same in 2006–2011, the difference
between the spending per student in the IITs/NITs and the (much lower) spending in the
other aided and unaided technical colleges apparently has not been increasing. The Indian
government has chosen to expand rapidly the (small) number of students attending elite
professional institutions rather than limiting their number and increasing how much is
spent per elite institution student.
The average spending per higher education student in the Brazilian system is equal
to the public spending per student in public institutions—federal, state, and municipal—
plus the average tuition student pay to private institutions.10 There are other contri-
butions to private education budgets, namely the subsidies provided by the various
Church sponsors of private institutions, but these data are unavailable. The percentage
of total revenues these contributions represent is small, according to one study (Hoper
Educacional 2009). Figure 5 shows the official figures for spending per student in the
years 2000–2010 in public institutions and our estimated average tuition paid based on
Hoper Educacional’s estimates of tuition paid in 2000–2011. All the figures are
adjusted for inflation.
0
50
100
150
200
250
300
350
400
1999 2000 2001 2002 2003 2004 2005 2006 2007 2008
Go
vern
men
t S
pen
din
g/S
tud
ent
(th
ou
san
ds
of
2008
Ru
pee
s)
non-plan adjusted plan adjusted total cost adjusted
Fig. 4 India: trends in spending per student in indian institutes of technology, 1999–2008 (2008 rupees).Source Banerjee and Muley (2007), Fig. 2.34, and Ministry of Human Resources and Development (variousyears). Notes In addition to the government grants to IITs as shown, students pay fees that go directly to eachIIT. According to Banarjee and Muley (Table 2.12), fees represented about 10 % of plan and non-plangrants in 2005 at IIT Mumbai, probably typical for IITs. There is not evidence that fees have risen in realterms since 2005 (see their Figure 2.23)
10 Hoper Educacional’s study of spending and revenues in Brazil’s private education sector shows that in2009, 85–90 % of revenues came from tuition.
372 High Educ (2014) 68:359–378
123

There are a number of reasons that average tuition levels declined in private institutions,
including a changing composition of low-cost and high-costs fields of study in public and
private institutions, increasing numbers of private institutions in the marketplace that
increased competition and drove down tuition, and possibly because expansion means
attracting lower income students. This suggests that part of the declining costs per student in
the private sector is probably due to absorbing increasing numbers of new students in
institutions that have lowered costs by lowering quality (for example hiring more part-time,
less-well prepared instructors and increasing class size).
Like the other BRICs, Russia provides more public financing to elite institutions than to
the non-elite institutions. In addition, the large number of students paying fees is a second
source of differentiation: paying students are charged higher tuition fees in the elite public
institutions. The elite institutions not only get more public funding per student, they are
also likely to have more revenues per student from tuition.
Government spending per higher education student corrected for inflation increased in
Russia until 2009. Although elite institutions have always existed in Russia, in the 2000s,
the Russian government moved to officially designate one group of institutions as ‘‘spe-
cial’’ (Category A). Thirty-eight Russian institutions are in this special category. They
include the two traditional leading institutions—Moscow State and St. Petersburg State
Universities—seven Federal Universities (to be eventually increased to 12), which have
been or are in the process of being formed in various regions by combining groups of
existing local institutions, and 29 universities that have been designated as National
0
2000
4000
6000
8000
10000
12000
14000
16000
18000
2000 2001 2002 2003 2004 2005 2006 2007 2008 2009 2010
Sp
end
ing
/Stu
den
t (2
008
Rea
is)
Public Spending/Student Private Spending/Student Average Spending/Student
Fig. 5 Brazil: public spending per public higher education student, average private tuition in private highereducation, and average spending per student, 2000–2010 (2008 Reais). Source Private tuition from HoperEducacional 2009. Public spending per student from INEP [http://portal.inep.gov.br/estatisticas-gastoseducacao-despesas_publicas-p.a._precos.htm] Accessed August 4, 2012. Average spending per student estimated byweighting public spending and private tuition per student by percent enrollment in public and private institutions
High Educ (2014) 68:359–378 373
123
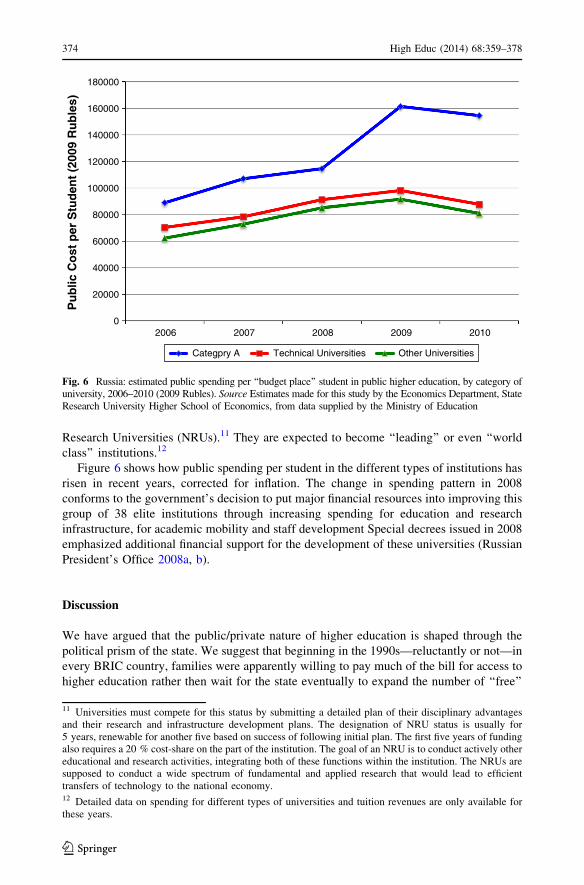
Research Universities (NRUs).11 They are expected to become ‘‘leading’’ or even ‘‘world
class’’ institutions.12
Figure 6 shows how public spending per student in the different types of institutions has
risen in recent years, corrected for inflation. The change in spending pattern in 2008
conforms to the government’s decision to put major financial resources into improving this
group of 38 elite institutions through increasing spending for education and research
infrastructure, for academic mobility and staff development Special decrees issued in 2008
emphasized additional financial support for the development of these universities (Russian
President’s Office 2008a, b).
Discussion
We have argued that the public/private nature of higher education is shaped through the
political prism of the state. We suggest that beginning in the 1990s—reluctantly or not—in
every BRIC country, families were apparently willing to pay much of the bill for access to
higher education rather then wait for the state eventually to expand the number of ‘‘free’’
0
20000
40000
60000
80000
100000
120000
140000
160000
180000
2006 2007 2008 2009 2010
Pu
blic
Co
st p
er S
tud
ent
(200
9 R
ub
les)
Categpry A Technical Universities Other Universities
Fig. 6 Russia: estimated public spending per ‘‘budget place’’ student in public higher education, by category ofuniversity, 2006–2010 (2009 Rubles). Source Estimates made for this study by the Economics Department, StateResearch University Higher School of Economics, from data supplied by the Ministry of Education
11 Universities must compete for this status by submitting a detailed plan of their disciplinary advantagesand their research and infrastructure development plans. The designation of NRU status is usually for5 years, renewable for another five based on success of following initial plan. The first five years of fundingalso requires a 20 % cost-share on the part of the institution. The goal of an NRU is to conduct actively othereducational and research activities, integrating both of these functions within the institution. The NRUs aresupposed to conduct a wide spectrum of fundamental and applied research that would lead to efficienttransfers of technology to the national economy.12 Detailed data on spending for different types of universities and tuition revenues are only available forthese years.
374 High Educ (2014) 68:359–378
123
places using public revenues. At the same time, BRIC central and regional states appar-
ently were implicitly able to get the public to accept that the public sector did not have
sufficient funds to respond reasonably quickly to rapidly growing demand.
Thus, in the trough of the post-Soviet early 1990s recession, the Russian public accepted
a change in the constitution allowing public universities to accept tuition payments. The
Chinese public went along with a decree in China in the mid-1990s that all students would
pay tuition. In India, regional states promoted and the public accepted the creation of
private colleges in lieu of rapid growth of public college enrollment (Carnoy and Dossani
2013). And, in Brazil, as a continuation of an earlier tradition of private institutions as
major players the higher education system, public university expansion slowed in the late
1990s, and for-profit private institutions surged, again with little resistance until quite
recently. For both capital owners and the public as a whole, we contend, higher private
rates of return made the large ‘‘externalities’’ argument associated with providing free
public education both less necessary and less compelling politically. In terms of equity
preference, as private rates of return increased, it may have also become more obvious to
the public at large that the externalities argument for free elite public universities had
served a certain class of citizens to appropriate public revenues for its private use.
We also argued that an important aspect of how the BRICs redefined the ‘‘public’’
nature of higher education was to increase the spending on elite university students (except
in India, where it was already very high compared to non-elite colleges) and to allow the
spending on the mass of newly incorporated higher education students to fall (except in
Russia). In all the BRICs, the public subsidy to students in elite universities, the vast
majority from high social class families, is much higher than in mass universities and
colleges.
There are potential political pitfalls (contradictions) in redefining the public/private
aspects of higher education in this way. For one, expanding higher education enrollment in
such mass, low-and-declining-quality institutions risks creating major gaps in employ-
ability and income between an elite few and the mass of fee-paying students (driving down
the average rate of return to higher education). The graduates of such mass institutions
might blame the state for their plight, even if the institutions are privately owned. Capital
owners might also become dissatisfied with the quality of skilled workers produced by the
higher education system.
This strategy can also conflict with changing preferences for social and income equality.
If public funding for higher education is allocated to various social class groups in an
increasingly unequal fashion it could exacerbate inequality of economic opportunity.13
Such increasing differentiation is typically justified by an argument that economic and
social externalities to investing in higher social class groups are increasing over time.
Indeed, the implicit argument for spending heavily on developing ‘‘world class’’ institu-
tions is precisely that in today’s global information economy, the value of high quality
university education (and research) is much higher than in the past. If all social groups
benefit from the externalities, the equity implications of increasingly differentiated public
spending are less clear. Yet, because of rising private rates of return that are associated
with the global knowledge economy, particularly to studying business and engineering, the
political persuasiveness of such claims may not be as great as in the past.
13 Higher social class groups have a disproportionately higher likelihood of entering elite institutions thanlower social class groups. In the BRICs, for example, higher social class groups are more likely to take andscore higher on university entrance exams because they have more resources in the home and greater accessto higher quality pre-tertiary schooling.
High Educ (2014) 68:359–378 375
123
The second type of issue arises from an increasingly differentiated system of private
higher education institutions. In countries that rely heavily on private institutions for
expanding enrollment (Brazil and India), increasing differentiation means either that (1)
more elite institutions are able to provide ‘‘better’’ education by charging higher tuition,
effectively increasingly excluding those students unable to pay, or, alternatively, that (2)
for non-elite institutions to provide education to lower income students at lower tuition, the
quality of their education must steadily decrease. In either case, the quality of education
received is increasingly differentiated on the basis of ability to pay, so access to subsequent
economic opportunities is determined directly by family finances. We observe both types
of equity issues in the BRICs—mostly the first in China, a combination of the first and
second in India and Brazil, and a different combination of the first and second in Russia.
Further, having placed Brazil and India’s higher education systems increasingly in the
hands of private owners (with private interests) could also create serious political issues for
those states should private rates of return decline.
Acknowledgments The authors would like to thank Stanford University’s International Initiative at theFreeman Spogli Institute, the U.S. Department of Education’s Fund for the Improvement of SecondaryEducation (FIPSE), Peking University’s China Institute for Educational Finance Research, The NationalResearch University Higher School of Economics (Russia), and the National University for EducationalPlanning and Administration (India) for their contributions to the funding of this project.
References
Agarwal, P. (2006). Higher education in India: The need for change. ICRIER Working Paper No. 180.Altbach, P., & Levy, D. (Eds.). (2005). Private higher education: A global revolution. the Netherlands:
Sense Publishers.Altbach, P., Reisberg, L., & Rumbley, L. (2009). Trends in global higher education: Tracking an academic
revolution. Chestnut Hill, MA: Boston College Center for International Higher Education.Astin, A., & Oseguera, L. (2004). The declining ‘‘equity’’ of American higher education. The Review of
Higher Education, 27(3), 321–341.Banerjee, R., & Muley, V. (2007). Engineering education in India. Mumbai: Energy Systems Engineering.Beteille, T. (2008). India’s higher educational expansion in the global knowledge economy. Stanford, CA:
Stanford University Graduate School of Education (mimeo).Bourdieu, P., & Passeron, J. C. (1977). Reproduction. Beverly Hills, CA: Sage Publications.Brainerd, E. (1998). Winners and losers in Russia’s transition. American Economic Review, 88(5),
1094–1116.Carnoy, M. (1984). The state and political theory. Princeton, NJ: Princeton University Press.Carnoy, M., & Dossani, R. (2013). Goals and governance of higher educaton in India. Higher Education,
65(5): 595–612.Carnoy, M., Loyalka, P., Dobryakova, M., Dossani, R., Froumin, I., Kuhns, K., Tilak, B. G., & Wang, R.
(2013). University expansion in a changing global economy: Triumph of the BRICs? Stanford, CA:Stanford University Press.
Castells, M. (1996). The rise of the network society. London: Blackwell.Commission, Planning. (2012). Approach to the twelfth five year plan, 2012–2017. New Delhi: Government
of India.de Brauw, A. & Rozelle, S. (2006). Reconciling the returns to education in off-farm wage employment in
rural China. Stanford, CA: Freeman-Spogli Institute, Stanford University (mimeo).Denisova, I., & Kartseva, M. (2005). Advantages of education in engineering: Estimates of returns to
educational specialization in Russia. Moscow: National Research University Higher School of Eco-nomics, Working paper WP3/2005/02.
Donahue, J. D. (1989). The privatization decision: Public ends, private means. New York: Basic Books.Duraisamy, P. (2002). Changes in returns to education in India, 1983–94, by gender, age-cohort and
location. Economics of Education Review, 21, 609–622.Dutta, P. V. (2006). Returns to education: New evidence for India, 1983–1999. Education Economics, 54,
431–451.
376 High Educ (2014) 68:359–378
123

Edwards, B. (1998). Neoliberalism and educational reform in Latin America. Nature, Society, and Thought,11(4), 471–488.
Gorodnichenko, Y., & Peter, K. S. (2004). Returns to schooling in Russia and Ukraine: A semiparametiricapproach of cross-country comparative analysis. University of Bonn, Institute for the Study of Labor(IZA), Discussion Paper, No. 1325.
Heckman, J., & Li, X. (2004). Selection bias, comparative advantage, and heterogeneous returns to edu-cation: Evidence from China in 2000. Pacific Economic Review, 9, 155–171.
Hoper Educacional. (2009). Analise setorial do ensino superior privado do Brasil. Sao Paulo: HoperEducacional.
Instituto Nacional de Estudos e Pesquisas (INEP). (2000, 2008, 2011). Sinopse Estadistico da EducacaoSuperior. Brasilia: INEP.
Johnson, E. N., & Chow, G. C. (1997). Rates of return to schooling in China. Pacific Economic Review, 2,101–113.
Kaul, I., & Mendoza, R. U. (2003). Advancing the concept of public goods. In I. Kaul, P. Conceicao, K.L. Goulven, & R. U. Mendoza (Eds.), Providing global public goods (pp. 78–111). Oxford: OxfordUniversity Press.
Koski, W. S., & Reich, R. (2006). When ‘‘adequate’’ isn’t: The retreat from equity in educational law andpolicy and why it matters. Emory Law Journal, 56(3), 547–618.
Levin, H. M. (1987). Education as a public and private good. Journal of Policy Analysis and Management,6(4), 628–641.
Li, H. (2003). Economic transition and returns to education in China. Economics of Education Review, 22,317–328.
Mansbridge, J. (1998). On the contested nature of the public good. In W. Powell & E. Clemens (Eds.),Private action and the public good. New Haven: Yale University Press.
Marginson, S. (2007). The public/private divide in higher education: A global revision. Higher Education,53, 307–333.
Marginson, S., & Ordorika, I. (2010). Global hegemony in higher education and research. New York: SocialScience Research Council.
Menashy, F. S. (2011). Education as a private or a global public good: Competing conceptual frameworksand their power at the world bank. Unpublished PhD dissertation, University of Toronto.
Mill, J. S. (1869). On liberty. London: Longman, Roberts, & Green.Min, W. F. (2004). Chinese higher education: The legacy of the past and the context of the future. In P.
G. Altbach & T. Umakoshi (Eds.), Asian universities: Historical perspectives and contemporarychanges. Baltimore, MD: The John Hopkins University Press.
Ministry of Human Resource Development (MHRD). (various years). Analysis of budget expenditure oneducation. New Delhi: Bureau of Planning, Monitoring & Statistics.
National Bureau of Statistics of China. (2010). 2009 China educational finance statistical yearbook. Beijing:China Statistics Press.
National Bureau of Statistics of China (NBS). (various years). China educational statistical yearbook.Beijing: China Statistics Press.
Offe, C. (1973). The capitalist state and the problem of policy formation. In L. Lindberg, R. Afford, C.Crouch, & C. Offe (Eds.), Stress and competition in modern capitalism. Lexington, MA: DC Heath.
Organization for Economic Cooperation and Development (OECD). (2001, 2002, 2011). Education at aglance. Paris: OECD.
Psacharopoulos, G. (1985). Returns to education: A further international update and implications. Journal ofHuman Resources, 20, 583–604.
Psacharopoulos, G. (1994). Investment in education: A global update. World Development, 22, 1325–1343.Romer, P. (1994). The origins of endogenous growth. Journal of Economic Perspectives, 8(1), 3–22.Russian President’s Office. (2008a). Presidential decree 716. http://graph.document.kremlin.ru/page.
aspx?960170. Accessed January 7, 2014.Russian President’s Office. (2008b). Presidential decree 1448. http://graph.document.kremlin.ru/page.
aspx?977443. Accessed January 7, 2014.Samuelson, P. A. (1954). The pure theory of public expenditure. Review of Economics and Statistics, 11,
387–389.Serra, N., & Stiglitz, J. (Eds.). (2008). The Washington consensus reconsidered: Towards a new global
governance. Oxford: Oxford University Press.State Council of China. (2007). Opinions on establishing and improving the policies for subsidizing students
in universities of regular undergraduate education, postsecondary vocational schools and secondaryvocational schools from families with financial difficulties. Beijing: State Council of China. (inChinese).
High Educ (2014) 68:359–378 377
123

Stiglitz, J. E. (1999). Knowledge as a global public good. In I. Kaul, I. Grunberg, & M. A. Stern (Eds.),Global public goods: International cooperation in the 21st century (pp. 308–325). New York: TheUnited Nations Development Programme.
Tilak, J. B. G. (2008). Transition from higher education as a public good to higher education as a privategood: The saga of the Indian experience. Journal of Asian Public Policy, 1(2): 220–234.
Tobin, James. (1970). On limiting the domain of inequality. Journal of Law and Economics, 13(2), 263–277.University Grants Commission (UGC). (various years). Annual report. New Delhi: UGC.Weiler, H. N. (1983). Legalization, expertise, and participation: Strategies for compensatory legitimation in
educational policy. Comparative Education Review, 27(2), 259–277.World Bank. (2000). Higher education in developing countries: Peril and promise. Published for the Task
Force on Higher Education and Society. Washington, DC: World Bank.Zhang, J., Zhao, Y., Park, A., & Song, X. (2005). Economic returns to schooling in urban China, 1988 to
2001. Journal of Comparative Economics, 33, 730–752.
378 High Educ (2014) 68:359–378
123