isaaa briefs brief 52isaaa.org/resources/publications/briefs/52/download/isaaa-brief-52... · isaaa...
TRANSCRIPT

ISAAA Briefs
brief 52
Global Status of Commercialized Biotech/GM Crops: 2016
Up to ~18 million farmers in 26 countries planted 185.1 million hectares (457.4 million acres) in 2016, an increase of 3% or 5.4 million hectares (13.1 million acres) from 2015.
No. 52 – 2016
Over the last 21 years, ISAAA has devoted considerable effort to consolidate all the available data on officially approved biotech crop adoption globally; it is important to note that the database does not include plantings of biotech crops that are not officially approved. The database draws on a large number of sources of approved biotech crops from both the public and private sectors in many countries throughout the world. The range of crops is those defined as food, feed and fiber crops in the FAO database, which totaled ~10 billion metric tons of production in 2010 (http://www.geohive.com. Charts/ag_crops.aspx). Data sources vary by country and include, where available, government statistics, independent surveys, and estimates from commodity groups, seed associations and other groups, plus a range of proprietary databases. In the interest of uniformity, continuity, and comparability, wherever possible, ISAAA utilizes the same published data source annually; for example, for Brazil, the August biotech reports of Celeres are used; similarly, for the US, the USDA/NASS crop acreage reports published on 30 June annually are used. Published ISAAA estimates are, wherever possible, based on more than one source of information and thus are usually not attributable to one specific source. Multiple sources of information for the same data point greatly facilitate assessment, verification, and validation of specific estimates. The “proprietary” ISAAA database on biotech crops is unique from two points of view; first, it provides a global perspective; second, it has used the same basic methodology, improved continuously for the last 20 years and hence provides continuity from the genesis of the commercialization of biotech crops in 1996, to the present. The database has gained acceptance internationally as a reliable benchmark of the global status of biotech food, feed and fiber crops and is widely cited in the scientific literature and the international press. Whereas individual data points make-up the data base, the most valuable information is the trends of adoption over time, for example the increasing dominance of developing countries which is clearly evident.
Note that the words rapeseed, canola, and Argentine canola are used synonymously, as well as transgenic, genetically modified crops, GM crops, and biotech crops, reflecting the
usage of these words in different regions of the world, with biotech crops being used exclusively in this text because of its growing usage worldwide. Similarly, the words corn, used in North America, and maize, used more commonly elsewhere in the world, are synonymous, with maize being used consistently in this Brief, except for common names like corn rootworm where global usage dictates the use of the word corn. All $ dollar values in this Brief are US dollars unless otherwise noted. Some of the listed references may not be cited in the text – for convenience they have been included because they are considered useful reading material and were used as preparatory documents for this Brief. Global totals of millions of hectares planted with biotech crops have in some cases been rounded off to the nearest million and similarly, subtotals to the nearest 100,000 hectares, using both < and > characters; hence in some cases this leads to insignificant approximations, and there may be minor variances in some figures, totals, and percentage estimates that do not always add up exactly to 100% due to rounding off. It is also important to note that countries in the Southern Hemisphere plant their crops in the last quarter of the calendar year. The biotech crop areas reported in this publication are planted, not necessarily harvested hectarage, in the year stated. Thus, for example, the 2016 information for Argentina, Brazil, Australia, South Africa, and Uruguay is hectares usually planted in the last quarter of 2016 and harvested in the first quarter of 2017, or later, with some countries like the Philippines planting crops in more than one season per year. Thus, for countries of the Southern hemisphere, such as Brazil and Argentina the estimates are projections, and thus are always subject to change due to weather, which may increase or decrease actual planted area before the end of the planting season when this Brief went to press. For Brazil, the winter maize crop (safrinha) planted at the end of December 2016 and more intensively through January and February 2017, is classified as a 2016 crop in this Brief, consistent with a policy which uses the first date of planting to determine the crop year. All biotech crop hectare estimates in this Brief, and all ISAAA publications, are only counted once, irrespective of how many traits are incorporated in the crops. Country figures were sourced from The Economist, supplemented by data from World Bank, FAO and UNCTAD, when necessary.
Note to ReadeRS:

ISAAA Briefs
brief 52
Global Status of Commercialized Biotech/GM Crops: 2016
No. 52 – 2016

Published by:
Copyright:
Citation:
iSBN:
Publication orders:
info on iSaaa:
electronically:
ISAAA prepares this Brief and supports its free distribution to developing countries. The objective is to provide information and knowledge to the scientific community and society on biotech/GM crops to facilitate a more informed and transparent discussion regarding their potential role in contributing to global food, feed, fiber and fuel security, and a more sustainable agriculture. ISAAA takes full responsibility for the views expressed in this publication and for any errors of omission or misinterpretation.
The International Service for the Acquisition of Agri-biotech Applications (ISAAA).
ISAAA 2016. All rights reserved. Whereas ISAAA encourages the global sharing of information in Brief 52, no part of this publication may be reproduced in any form or by any means, electronically, mechanically, by photocopying, recording or otherwise without the permission of the copyright owners. Reproduction of this publication, or parts thereof, for educational and non-commercial purposes is encouraged with due acknowledgment, subsequent to permission being granted by ISAAA.
ISAAA. 2016. Global Status of Commercialized Biotech/GM Crops: 2016. ISAAA Brief No. 52. ISAAA: Ithaca, NY.
This 2016 ISAAA Brief is an extension of the 20 Volumes of Annual Briefs (1996 to 2015) on global status of biotech/GM crops authored by Clive James, Founder & Emeritus Chairman of ISAAA.
978-1-892456-66-4
Full Brief 52 and the Executive Summary are downloadable free of charge from the ISAAA website (http://www.isaaa.org). Please contact the ISAAA SEAsiaCenter to acquire a hard copy of the full version of Brief 52.
ISAAA SEAsiaCenter c/o IRRIDAPO Box 7777Metro Manila, Philippines
For information about ISAAA, please contact the Center nearest you:
ISAAA AmeriCenter ISAAA AfriCenter ISAAA SEAsiaCenter105 Leland Lab PO Box 70, ILRI Campus c/o IRRICornell University Old Naivasha Road DAPO Box 7777Ithaca NY 14853, U.S.A. Uthiru, Nairobi 00605 Metro Manila Kenya Philippines
or email to [email protected]
For Executive Summaries of all ISAAA Briefs, please visit http://www.isaaa.org
table of Contents
List of Tables and Figures IntroductionGlobal Area of Biotech Crops in 2016Distribution of Biotech Crops in
Industrial and Developing Countries
Distribution of Biotech Crops, by Country
Economic Benefits of Biotech CropsCountry Chapters
United States of AmericaBrazilArgentinaCanadaIndiaParaguayPakistanChinaSouth AfricaUruguayLatin American Countries Bolivia Mexico Colombia Honduras Chile Costa Rica
Future Prospects for Latin America
Asia and the Pacific Australia Philippines Myanmar Vietnam Bangladesh
Future Prospects of Biotech Crops in Asia and the Pacific
The European Union (EU 28) Spain Portugal Slovakia
ii122
4
7
81619242833364145495050515455565758
58586165676973
73747677
Czech RepublicNeed for EU to Change Stance
on Biotech CropsUnited Kingdom’s Exit (BREXIT)
from the EU Could Open GM Opportunities
Benefits of Biotech CropsFuture Prospects of Biotech
Crops in the EUAfrica Sudan
Progress with Biotech Crops Research in Other African Countries
Biosafety Policy DevelopmentsTechnology DemandPartnerships Emerging in
AfricaPolicy Pronouncements
Distribution of Biotech Crops, by Crop Biotech soybean Biotech maize Biotech cotton Biotech canola Biotech alfalfa Other biotech cropsDistribution of Biotech Crops, by TraitThe Global Value of the Biotech Crop
MarketTrends in Biotech Crop Approvals
1992-2016Benefits of Biotech/Genetically
Modified CropsFuture of Biotech Crops: A Game
ChangerBiotech/GM Crop Regulation
Supportive of InnovationConclusion and Closing CommentsAcknowledgmentsReferencesAppendices
7879
80
8181
818183
848787
87898989919192929294
95
96
106
109
113116117121
i

List of Tables and Figures
taBleS
Table 1. Global Area of Biotech Crops, the First 21 Years, 1996 to 2016Table 2. Global Area of Biotech Crops, 2015 and 2016: Industrial and Developing Countries (Million
Hectares)Table 3. Global Area of Biotech Crops in 2015 and 2016: by Country (Million Hectares)Table 4. Biotech Crop Hectarage in the USA, 2016Table 5. Biotech Crop Hectarage in Brazil, 2016Table 6. Biotech Crop Hectarage in Argentina, 2016Table 7. Economic Benefits of Biotech Crops in Argentina (Billion US$) and PercentageTable 8. Biotech Crop Hectarage in Canada, 2016Table 9. Seed Yield (Kg/ha) of Biotech Mustard Hybrid DMH-11 During BRL-I in 2010-11 and 2011-12 Table 10. Status of Biosafety Research Trials of Biotech Crops in India, 2016Table 11. Biotech Crop Area in Paraguay, 2016Table 12. Adoption of IR Cotton in Pakistan, 2010 to 2016Table 13. IR (Bt) Cotton Varieties (20) with MON531 Event Approved by PSC, 2010 to 2016Table 14. New IR (Bt) Cotton Varieties Approved by PSC in 2016Table 15. Commercial Release of IR/HT Maize Events in Pakistan, 2016Table 16. Biotech Crop Hectarages in China, 2016Table 17. Biotech Crop Hectarage in South Africa, 2016Table 18. Biotech White and Yellow Maize Planted in South Africa, 2016 Estimates (Million Hectares)Table 19. Biotech Crop Hectarage in Uruguay, 2016Table 20. Biotech Crop Hectarage in Mexico, 2016Table 21. Biotech Crop Planting in Chile, 2016Table 22. Biotech Crop Hectarage in Australia, 2016Table 23. Hectares of Canola Planted in Australia, by State, 2015-2016Table 24. Biotech Maize Hectarage in the Philippines, 2016Table 25. Adoption of Bt Cotton in Myanmar, 2006 to 2016Table 26. Policy and Legislative Reform in Myanmar, 2016Table 27. Adoption of IR (Bt) Brinjal in Bangladesh, 2016Table 28. Chronology of Development of LBR Potato in Bangladesh, 2008 to 2016Table 29. Biotech Maize Area in the European Union, 2006-2016Table 30. Biotech Maize Hectarage and Adoption in 2015 and 2016Table 31. Area of Biotech Maize by Region in Spain (Hectares)Table 32. Area of Biotech Maize by Region in Portugal, 2011-2016 (Hectares) Table 33. Commercial Production of IR Cotton in Sudan, 2016 (Hectares)Table 34. Global Area of Biotech Crops, 2015 and 2016: by Crop (Million Hectares)Table 35. Global Area of Biotech Crops, 2015-2016: by Trait (Million Hectares)Table 36. The Global Value of the Biotech Crop Market, 1996 to 2016Table 37. Approvals per Country for 2016Table 38. Economic Gains and Productivity at the Farm LevelTable 39. Land Savings Through Biotech Crops Table 40. Reduction in Pesticides and Environmental Impact Quotient
ii

List of Tables and Figures
Table 41. Savings on CO2 Emissions Equated with Number of Cars off the RoadTable 42. Economic Benefits by Trait/Crops (Million US$), 2015Table 43. Crops and Traits under Field Testing by the Public Sector in 2016
fiGuReS
Figure 1. Global Area of Biotech Crops, 1996 to 2016: Industrial and Developing Countries (Million Hectares)
Figure 2. Global Area (Million Hectares) of Biotech Crops, 1996 to 2016, by Country, Mega-Countries, and for the Top Ten Countries
Figure 3. Adoption of Biotech Crops in Brazil, 2003 to 2016Figure 4. Fifteen Years of Adoption of IR (Bt) Cotton in India, 2002 to 2016Figure 5. Indian Mustard (Brassica juncea) Yield in India, 2000 to 2015Figure 6. Trend in Area and Productivity of Maize in Pakistan, 1960 to 2016Figure 7. BARI/DAE Field Demonstration of IR (Bt) Brinjal in Bangladesh, 2014 to 2016Figure 8. Bt Brinjal Breeder Seed Production by BARI, 2014 to 2016Figure 9. On-going Biotech/GM Crops Research Activities in Africa by December 2016Figure 10. Global Area of Biotech Crops, 1996 to 2016: by Crop (Million Hectares)Figure 11. Global Adoption Rates (%) for Principal Biotech Crops, 2016 (Million Hectares)Figure 12. Global Area of Biotech Crops, 1996 to 2016: by Trait (Million Hectares)Figure 13. Number of Countries that Issued Approvals, 1992-2016Figure 14. Number of Events Approved per Year, 1992–2016Figure 15. Trait Distribution in Approved Events, 1992-2016
iii

iNtRoduCtioN
The first 20 years of commercialization of biotech crops (1996 to 2015) has confirmed that biotech crops have delivered substantial agronomic, environmental, economic, health and social benefits to farmers, and increasingly to the consumers. The rapid adoption of biotech crops reflects the substantial multiple benefits realized by both large and small farmers in industrial and developing countries which have commercially grown biotech crops. In 20 years, an accumulated 2 billion hectares of biotech crops have been grown commercially comprised of 1.0 billion hectares of biotech soybean, 0.6 billion hectares of biotech maize, 0.3 billion hectares of biotech cotton, and 0.1 billion hectares of biotech canola. Biotech products derived from this 2 billion hectares significantly contributes food and shelter to the current 7.4 billion people. Hence, feeding the world which is continuously increasing and predicted to be 9.9 billion in 2050 and 12.3 billion in 2100 is indeed a daunting task. It is estimated that the world will require some 50% to 70% increase in food production with dwindling resources of land, water, and the environmental and agricultural challenges brought by climate change.
Productivity gained in the last 20 years through biotech crops also proves that conventional crop technology alone cannot allow us to feed the immense increase in population, but neither is biotechnology a panacea. The global scientific community adheres to the option that a balanced, safe and sustainable approach using the best of conventional crop technology such as the well-adapted and agronomically desirable and high-yielding germplasm, and the best of biotechnology (GM and non-GM traits) to achieve sustainable intensification of crop productivity on the 1.5 billion hectares of cropland globally.
The more than 18 million farmers (up to 90% were small/poor farmers) in up to 30 countries
Global Status of Commercialized Biotech/GM Crops first Year after two decades
who have planted biotech crops attest to the multiple benefits they derived in the last 20 years as follows:
• Increased productivity that contributes to global food, feed and fiber security;
• Self-sufficiency on a nation’s arable land;
• Conserving biodiversity, precluding deforestation and protecting biodiversity sanctuaries;
• Mitigating challenges associated with climate change; and
• Improving economic, health and social benefits.
At the close of the UN Development Goals in 2015, the United Nations developed a successor framework termed 2030 Agenda for Sustainable Development Goals (SDGs) which will undertake 17 goals and 169 specific targets to eliminate poverty, fight inequality, and tackle climate change in the next 15 years. One of the 17 goals aims to end hunger, achieve food security, improve nutrition, and promote sustainable agriculture. In 2016, the international body reiterated the call and underscored the need to utilize a broad portfolio of tools and approaches, including agroecology and biotechnology to eradicate hunger, fight every form of malnutrition and achieve sustainable agriculture.
Following this call, the International Service for the Acquisition of Agri-biotech Applications publishes the annual series of Annual Global Review of Biotech Crop Commercialization. This publication documents the latest information on the subject, global database on the adoption and distribution of biotech crops since the first year of commercialization in 1996, country situations and future prospects of the technology in the country and the world. ISAAA Briefs is the most cited reference in the field of modern agribiotechnology due to its credibility and accuracy.
1
Global Status of Commercialized Biotech/GM Crops: 2016
2
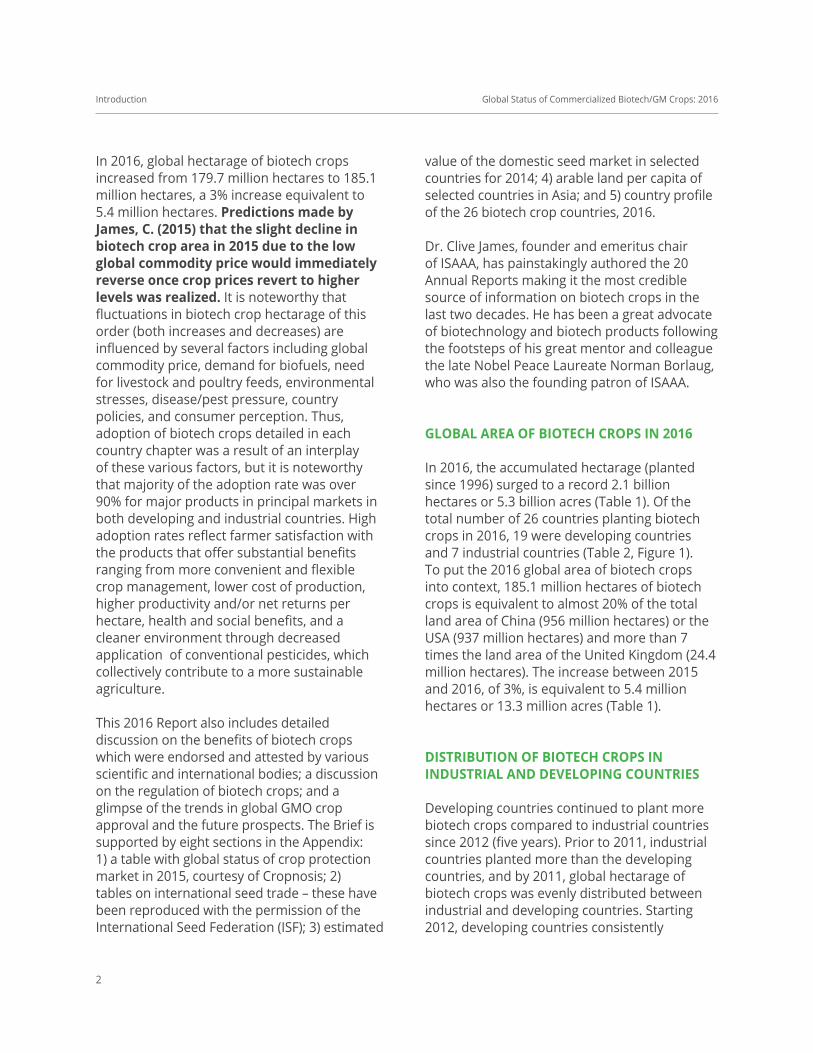
In 2016, global hectarage of biotech crops increased from 179.7 million hectares to 185.1 million hectares, a 3% increase equivalent to 5.4 million hectares. Predictions made by James, C. (2015) that the slight decline in biotech crop area in 2015 due to the low global commodity price would immediately reverse once crop prices revert to higher levels was realized. It is noteworthy that fluctuations in biotech crop hectarage of this order (both increases and decreases) are influenced by several factors including global commodity price, demand for biofuels, need for livestock and poultry feeds, environmental stresses, disease/pest pressure, country policies, and consumer perception. Thus, adoption of biotech crops detailed in each country chapter was a result of an interplay of these various factors, but it is noteworthy that majority of the adoption rate was over 90% for major products in principal markets in both developing and industrial countries. High adoption rates reflect farmer satisfaction with the products that offer substantial benefits ranging from more convenient and flexible crop management, lower cost of production, higher productivity and/or net returns per hectare, health and social benefits, and a cleaner environment through decreased application of conventional pesticides, which collectively contribute to a more sustainable agriculture.
This 2016 Report also includes detailed discussion on the benefits of biotech crops which were endorsed and attested by various scientific and international bodies; a discussion on the regulation of biotech crops; and a glimpse of the trends in global GMO crop approval and the future prospects. The Brief is supported by eight sections in the Appendix: 1) a table with global status of crop protection market in 2015, courtesy of Cropnosis; 2) tables on international seed trade – these have been reproduced with the permission of the International Seed Federation (ISF); 3) estimated
value of the domestic seed market in selected countries for 2014; 4) arable land per capita of selected countries in Asia; and 5) country profile of the 26 biotech crop countries, 2016.
Dr. Clive James, founder and emeritus chair of ISAAA, has painstakingly authored the 20 Annual Reports making it the most credible source of information on biotech crops in the last two decades. He has been a great advocate of biotechnology and biotech products following the footsteps of his great mentor and colleague the late Nobel Peace Laureate Norman Borlaug, who was also the founding patron of ISAAA.
GloBal aRea of BioteCh CRoPS iN 2016
In 2016, the accumulated hectarage (planted since 1996) surged to a record 2.1 billion hectares or 5.3 billion acres (Table 1). Of the total number of 26 countries planting biotech crops in 2016, 19 were developing countries and 7 industrial countries (Table 2, Figure 1). To put the 2016 global area of biotech crops into context, 185.1 million hectares of biotech crops is equivalent to almost 20% of the total land area of China (956 million hectares) or the USA (937 million hectares) and more than 7 times the land area of the United Kingdom (24.4 million hectares). The increase between 2015 and 2016, of 3%, is equivalent to 5.4 million hectares or 13.3 million acres (Table 1).
diStRiButioN of BioteCh CRoPS iN iNduStRial aNd develoPiNG CouNtRieS
Developing countries continued to plant more biotech crops compared to industrial countries since 2012 (five years). Prior to 2011, industrial countries planted more than the developing countries, and by 2011, global hectarage of biotech crops was evenly distributed between industrial and developing countries. Starting 2012, developing countries consistently
Introduction

Global Status of Commercialized Biotech/GM Crops: 2016
3
Year hectares (million) acres (million)1996 1.7 4.21997 11.0 27.21998 27.8 68.71999 39.9 98.62000 44.2 109.22001 52.6 130.02002 58.7 145.02003 67.7 167.32004 81.0 200.22005 90.0 222.42006 102.0 252.02007 114.3 282.42008 125.0 308.92009 134.0 331.12010 148.0 365.72011 160.0 395.42012 170.3 420.82013 175.2 432.92014 181.5 448.52015 179.7 444.02016 185.1 457.4total 2,149.7 5,312.0
table 1. Global area of Biotech Crops, the first 21 Years, 1996 to 2016
Global hectarage of biotech crops in 2016 increased to 185.1 million hectares compared with 179.7 million hectares in 2016, equivalent to 3% or 5.4 million hectares.
Source: ISAAA, 2016
increased in hectarage and by 2016, a difference of 14.1 million hectares between developing and industrial countries was achieved. Developing countries grew 54% of the global biotech hectares compared to 46% for industrial countries (Table 2, Figure 1). Moreover, industrial countries increased by 3.5% in 2016,
compared to 2015, while developing countries increased by 2.6%.
The 3.5% increase in the industrial countries between 2015 and 2016 is due mainly to increases in the USA at 2%, Canada at 0.6% and Australia at 0.2%. Increases in developing countries, led by Brazil at 4.9% and South Africa at 0.4% contributed mainly to the 2.5% difference in 2015 and 2016 (Table 3). The trend for a higher share of global biotech crops in developing countries is likely to continue in the near, mid and long-term, firstly, due to more countries from the southern hemisphere adopting biotech crops and secondly, adoption of crops such as rice, 90% of which is grown in developing countries, are deployed as “new” biotech crops.
figure 1. Global area of Biotech Crops, 1996 to 2016: industrial and developing Countries (Million hectares)
Source: ISAAA, 2016
20
40
60
80
100
120
140
160
180
200
1996 2002 2009 2016
Total Industrial Developing
Distribution of Biotech Crops in Industrial and Developing Countries

Global Status of Commercialized Biotech/GM Crops: 2016
4
2015 % 2016 % +/– %Industrial countries 82.6 46 85.5 46 +2.9 +3.5Developing countries 97.1 54 99.6 54 +2.5 +2.6total 179.7 100 185.1 100 +5.4 +3.0
table 2. Global area of Biotech Crops, 2015 and 2016: industrial and developing Countries (Million hectares)
Source: ISAAA, 2016
diStRiButioN of BioteCh CRoPS, BY CouNtRY
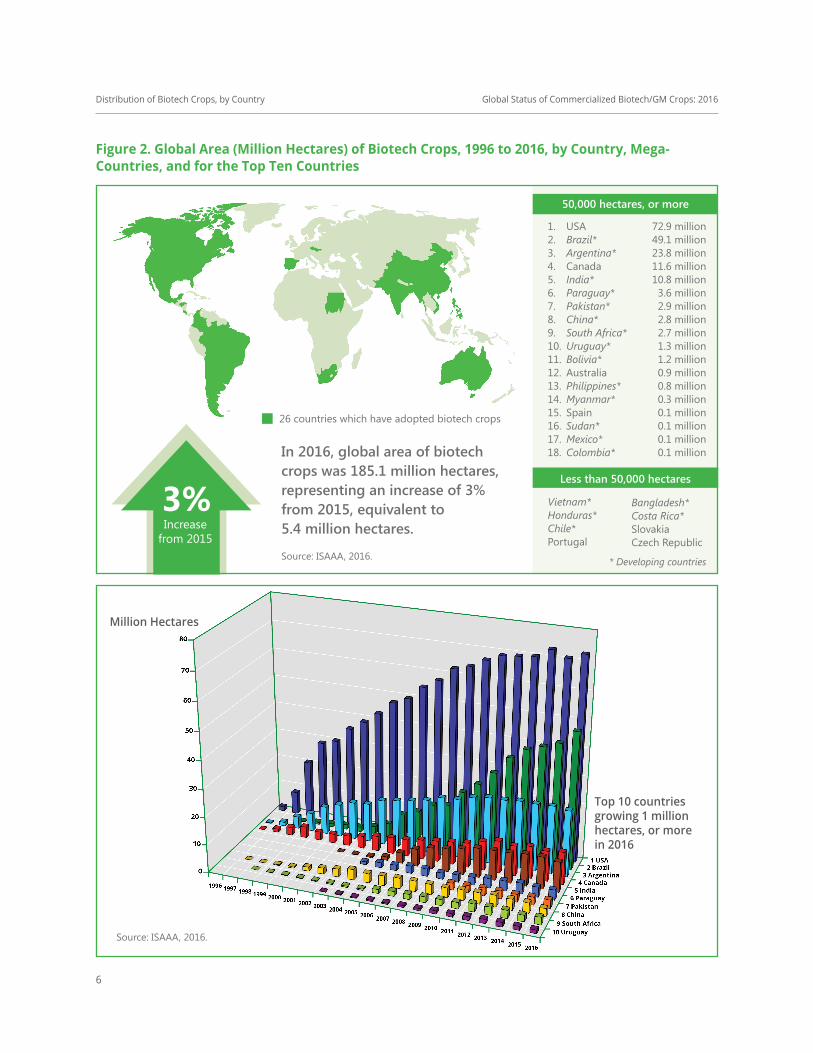
A total of 26 countries, 19 developing and 7 industrial countries, planted biotech crops in 2016. The top ten countries, each of which grew over 1 million hectares in 2016, is led by the USA which grew 72.9 million hectares (39% of global total, similar to 2015), Brazil with 49.1 million hectares (27%), Argentina with 23.8 million hectares (13%), Canada with 11.1 million hectares (6%), India with 10.8 million hectares (6%), Paraguay with 3.6 million hectares (2%), Pakistan with 2.9 million hectares (2%), China with 2.8 million hectares (2%), South Africa with 2.7 million hectares (1%) and Uruguay with 1.3 million hectares (1%). An additional 16 countries grew a total of approximately 4.9 million hectares in 2016 (Table 3 and Figure 2).
It should be noted that of the top ten countries, each growing 1.0 million hectares or more of biotech crops, the majority (8 out of 10) are developing countries, with Brazil, Argentina, India, Paraguay, Pakistan, China, South Africa and Uruguay, compared with only two industrial countries, USA and Canada. Burkina Faso and Romania did not plant biotech crops in 2016 due to internal problems brought by change in cotton germplasm and onerous reporting requirements of biotech crops planting, respectively.
The number of biotech mega-countries (countries which grew 50,000 hectares, or more, of biotech crops) was 18. Notably, 14 of the 18 mega-countries are developing countries from latin america, asia and africa. The high proportion of biotech mega-countries in 2016, 18 out of 26 equivalent to 69% reflects the significant broadening, deepening and stabilizing in biotech crop adoption that has occurred within the group of more progressive mega-countries adopting more than 50,000 hectares of biotech crops, on all six continents.
It is noteworthy that in absolute hectares, the largest year-over-year growth, by far, was Brazil with 4.9 million hectares, followed by USA with 2 million hectares, Canada with 600,000, South Africa with 400,000 hectares and Australia with 200,000 hectares. The top three biotech countries in terms of global share of the million hectares planted globally were USA at 39%, Brazil at 27% and Argentina at 13% for a total of 78%.
Of the 26 countries that planted biotech crops in 2016, 12 (46%) of the countries were in the Americas, 8 (31%) in Asia, 4 (15%) were in Europe and 2 (8%) in Africa. On a hectarage basis, of the 26 countries that planted biotech crops in 2016, 88% of the hectarage was in the Americas, 10% in Asia, 2% in Africa and <1% in Europe.
Distribution of Biotech Crops, by Country

Global Status of Commercialized Biotech/GM Crops: 2016
5
Country 2015 % 2016 % +/– %1 USA* 70.9 39 72.9 39 2.0 3%2 Brazil* 44.2 25 49.1 27 4.9 11%3 Argentina* 24.5 14 23.8 13 –0.7 –3%4 Canada* 11.0 6 11.1 6 0.6 5%5 India* 11.6 6 10.8 6 –0.8 –7%6 Paraguay* 3.6 2 3.6 2 0 0%7 Pakistan* 2.9 2 2.9 2 0 0%8 China* 3.7 2 2.8 2 –0.9 –24%9 South Africa* 2.3 1 2.7 1 0.4 17%
10 Uruguay* 1.4 1 1.3 1 –0.1 –7%11 Bolivia* 1.1 1 1.2 1 0.1 9%12 Australia* 0.7 <1 0.9 <1 0.2 29%13 Philippines* 0.7 <1 0.8 <1 0.1 14%14 Myanmar* 0.3 <1 0.3 <1 0 015 Spain* 0.1 <1 0.1 <1 0.1 016 Sudan* 0.1 <1 0.1 <1 0.1 017 Mexico* 0.1 <1 0.1 <1 0.1 018 Colombia* 0.1 <1 0.1 <1 <0.1 <0.119 Vietnam <0.1 <1 <0.1 <1 <0.1 <0.120 Honduras <0.1 <1 <0.1 <1 <0.1 <0.121 Chile <0.1 <1 <0.1 <1 <0.1 <0.122 Portugal <0.1 <1 <0.1 <1 <0.1 <0.123 Bangladesh <0.1 <1 <0.1 <1 <0.1 <0.124 Costa Rica <0.1 <1 <0.1 <1 <0.1 <0.125 Slovakia <0.1 <1 <0.1 <1 <0.1 <0.126 Czech Republic <0.1 <1 <0.1 <1 <0.1 <0.127 Burkina Faso 0.5 <1 -- -- -- --28 Romania <0.1 <1 -- -- -- --
total 179.7 100 185.1 100 5.4 3.0
table 3. Global area of Biotech Crops in 2015 and 2016: by Country (Million hectares**)
* Biotech mega-countries growing 50,000 hectares or more** Rounded-off to the nearest hundred thousand or more
Source: ISAAA, 2016
Distribution of Biotech Crops, by Country
Global Status of Commercialized Biotech/GM Crops: 2016
6
figure 2. Global area (Million hectares) of Biotech Crops, 1996 to 2016, by Country, Mega-Countries, and for the top ten Countries
26 countries which have adopted biotech crops
Source: ISAAA, 2016.
50,000 hectares, or more
Less than 50,000 hectares
1. USA2. Brazil*3. Argentina*4. Canada5. India*6. Paraguay*7. Pakistan*8. China*9. SouthAfrica*10. Uruguay*11. Bolivia*12. Australia13. Philippines*14. Myanmar*15. Spain16. Sudan*17. Mexico*18. Colombia*
72.9 million49.1 million23.8 million11.6 million10.8 million3.6 million2.9 million2.8 million2.7 million1.3 million1.2 million0.9 million0.8 million0.3 million0.1 million0.1 million0.1 million0.1 million
Vietnam*Honduras*Chile*Portugal
Bangladesh*CostaRica*SlovakiaCzech Republic
*Developingcountries
Increase from 2015
3%In 2016, global area of biotech crops was 185.1 million hectares, representing an increase of 3% from 2015, equivalent to 5.4 million hectares.
Distribution of Biotech Crops, by Country
Million Hectares
Top 10 countriesgrowing 1 millionhectares, or more in 2016
Source: ISAAA, 2016.

Global Status of Commercialized Biotech/GM Crops: 2016
7
There are now 10 countries in Latin America which benefit from the extensive adoption of biotech crops. Listed in descending order of hectarage, they are Brazil, Argentina, Paraguay, Uruguay, Bolivia, Mexico, Colombia, Honduras, Chile, and Costa Rica. There are 8 countries planting biotech crops in Asia and the Pacific led by India, Pakistan, China, Australia, Philippines, Myanmar, Vietnam and Bangladesh. It is noteworthy, that Japan grew, for the sixth year, a commercial biotech flower, the blue rose in 2016. The rose was grown under partially covered conditions and not in open field conditions like the other food, feed and fiber biotech crops grown in other countries listed in this Brief. Australia and Colombia also grew biotech carnations.
Four EU countries (Spain, Portugal, Czechia, and Slovakia) continued to plant biotech crops in 2016 led by Spain, Portugal, Slovakia and Czech Republic with an increase of 17% in 2016 at 136,363 hectares, compared to 116,870 in 2015. Romania decided not to plant in 2016 due to onerous requirement by the government.
eCoNoMiC BeNefitS of BioteCh CRoPS
Of the US$167.8 billion additional gain in farmer income generated by biotech crops in the 20 years of commercialization (1996 to 2015), it is noteworthy that US$81.7 billion was generated in industrial countries and US$86.1 billion in developing countries. Moreover in 2015, developing countries had a lower share, 48.7% equivalent to US$7.5 billion of the total US$15.4 billion gains with industrial countries at US$17.9 billion (Brookes and Barfoot, 2017, Forthcoming).
The six principal countries that have gained the most economically from biotech crops, during the first 20 years of commercialization of biotech crops, 1996 to 2015 are, in descending order of magnitude, the USA (US$73 billion),
Argentina (US$21.1 billion), India (US$19.6 billion), China (US$18.6 billion), Brazil (US$16.4 billion), Canada (US$7.3 billion), and others (US$11.8 billion) for a total of US$167.8 billion (Brookes and Barfoot, 2017, Forthcoming).
In 2015 alone, economic benefits globally were US$15.4 billion of which US$7.5 billion was for developing and US$7.9 billion was for industrial countries. The six countries that gained the most economically from biotech crops in 2015 were, the USA (US$6.9 billion), India (US$1.3 billion), China (US$1 billion), Argentina (US$1.5 billion), Brazil (US$2.5 billion), and Canada (US$0.9 billion), and others (US$1.3 billion) for a total of US$15.5 billion (Brookes and Barfoot, 2017, Forthcoming).
Economic Benefits of Biotech Crops
Global Status of Commercialized Biotech/GM Crops: 2016
8
CouNtRY ChaPteRS
uNited StateS of aMeRiCa The United States of America is the leader in hectarage planted with commercialized biotech crops since 1996. In 2016, 72.92 million hectares were planted to major biotech crops: maize (35.05 million hectares); soybean (31.84 million hectares); cotton (3.70 million hectares); some areas of biotech crops: alfalfa (1.23 million hectares); canola (0.62 million hectares); and sugar beet (0.47 million hectares) and small areas of virus resistant papaya and squash (1,000 hectares each), and non-browning Innate™ potatoes (2,500 hectares). The United States Department of Agriculture (USDA) estimates indicate that the percentage adoption of the three principal biotech crops were at, or close to optimal adoption: soybean at 94% (same as 2015), maize 92% (same as 2015), and cotton 93% (lower by 1% in 2015) (USDA, NASS, 2016), with an average of 93%. The 2016 biotech crop area in the USA of ~73 million hectares is 39% of the global biotech area and 3% higher than the 2015 planting of 70.9 million hectares (Table 4).
The immediate increase of biotech/GM planted area in 2016 proves that the 2015 slight decrease attributed to low commodity prices of maize and cotton was only temporary. Resumption of global prices and the active trade with countries for livestock feeds, food processing, and biofuel needs in 2016 put the US biotech crop adoption back on its track with a 3% increase from 2015. Accessibility of the technology and the stability of commodity prices benefit farmers, the food industry, and most especially the consumers who will be the end users of the food products.
Since 1996, USA has approved 195 single trait events in 20 crop species: alfalfa (3 events), apple (3), Argentine canola (20), chicory (3), cotton (28), creeping bentgrass (1), flax (1),
maize (43), melon (2), papaya (3), plum (1), potato (43), rice (3), rose (2), soybean (24), squash (2), sugar beet (3), tobacco (1), tomato (8), and wheat (1). In 2016 alone, food, feed and cultivation approvals were made for apple (1 event), maize (2) and potato (3).
Biotech maizeAccording to USDA, NASS 2016, 38.10 million hectares were planted to maize, an increase of 7% from 2015, and the third highest planted acreage since 1944. At 92% adoption rate in 2016 (same as 2015), the total biotech maize planted was 35.05 million hectares, up by 6% from 33.1 million hectares in 2015. The 92% adoption rate (35.05 million hectares) was composed of 3% insect resistant (IR), 13% herbicide tolerant (HT), and 76% stacked IR/HT. As of November 2016, US regulators have approved 44 single maize events since 1996 with insect resistance, herbicide tolerance, drought tolerance and stacks thereof, for food, feed, and cultivation. In 2016, MON 87419 with stacked herbicide tolerance (glufosinate and dicamba) and MZIR098 with glufosinate-resistance and stacked IR (multiple) were approved for food, feed and cultivation (ISAAA GM Approval Database, 2016). It is noteworthy that maize has been improved to increase the production of amino acid in event LY038 and approved for commercialization in the US in 2006.
As of November 2016, the US Drought Monitor (2016) reported the continued deterioration of drought conditions in the south and southeast USA as dry conditions and above average temperatures prevailed. This occurrence further negatively impacted soil moisture and agriculture across the regions. In addition, some parts of the interior USA observed deteriorating conditions due to a continued lack of rainfall combined with well above average temperatures.
United States of America

Global Status of Commercialized Biotech/GM Crops: 2016
9
Crops total area (M ha)
Biotech area (Million ha)(% of total Biotech)
% of total area
iR ht iR/ht other traits
total
Soybean 33.87 – 31.84(100%)
– 31.84 94
Maize 38.10 1.14(3%)
4.95(13%)
28.96(76%)
35.05 92
Cotton 3.98 0.16(4%)
0.36(9%)
3.18(80%)
3.70 93
Canola 0.69 – 0.62(100%)
– 0.62 90
Sugar beet 0.47 – 0.47(100%)
– 0.47 100
Alfalfa* 8.46 – 1.21(98%)
0.02 1.23 14
Papaya** <0.01 – – – <0.01 <0.01 <0.01Squash** <0.01 – – – <0.01 <0.01 <0.01Potato <0.01 – – – <0.01 <0.01 <0.01total 85.60 – – – 72.92 86
table 4. Biotech Crop hectarage in the uSa, 2016
*PQ **VR
Source: ISAAA, 2016
According to Texas A&M University’s AgriLife Extension estimates, agricultural losses due to drought in 2016 are expected to exceed US$5.2 billion dollars, a record loss for the state’s agricultural industry. These losses were due to failed crops of cotton, maize, sorghum, wheat and hay. This reduced hay production caused business losses worth more than US$700 million. When combined with the loss in maize production, it can cause significant problems for hay livestock producers (The North American Farmers, 2016).
In California on the other hand, the 2016 drought resulted in US$247 million loss of farm gate revenues and 1,815 full and part time
jobs statewide. These are concentrated in the Central Valley south of the Delta. Considering the spill over effects to other sectors of the economy, it is estimated that the total value losses of US$600 million and 4,700 full and part time jobs statewide are due to drought impact in agriculture (Medellin-Azuara et al, 2016). Thus, the approval in 21 December 2011 by the USDA of the first generation drought tolerant trait for maize, MON87460 was a timely solution to the worsening drought in the US. It signaled the start of the on farm trials with 250 growers on 10,000 acres (4,000 hectares) across the western Great Plains in 2012, where there was extreme to exceptional
United States of America
Global Status of Commercialized Biotech/GM Crops: 2016
10
drought. The drought trait was developed by Monsanto in collaboration with BASF Plant Science, combining the drought tolerant traits and improved hydro efficiency to ensure conservation of soil moisture and reduces yield loss under drought conditions (CBU, 6 January 2012). From 50,000 hectares in 2013, 275,000 in 2014, and 810,000 in 2015, DroughtGard™ maize hybrids were planted to 1.173 million hectares in 23 states in the US in 2016 – equivalent to 45% increase from 2015. This reflects strong US farmer acceptance of the first biotech-derived drought tolerant maize technology which is hoped to be deployed globally.
Continued successful adoption of the drought tolerant maize in the US can be easily picked up by other countries experiencing drought spells such as in Africa and Europe. It is noteworthy that Event MON 87460 was donated by Monsanto to the Water Efficient Maize for Africa (WEMA), a public-private partnership (PPP) designed to deliver the first biotech drought tolerant maize to selected African countries starting 2017.
Biotech SoybeanSoybean was planted on a total area of 33.87 million hectares in 2016 (USDA, NASS, 2016). More than 81,000 hectares are estimated to be planted in Kansas, Minnesota and Missouri. Other soybean states with record high plantings include Michigan, New York, North Dakota, Ohio, Pennsylvania and Wisconsin. Some 94% of the 2016 hectarage (31.84 million hectares) were biotech crops with herbicide resistance, a slight decrease of 1.7% compared to 32.39 million hectares in 2015. Roundup Ready® soybean was the first and most successful herbicide tolerant soybean to be commercialized in the USA since 1996 with 24 GM soybean events approved for food, feed, and cultivation by 2016.
Since 1997, biotech soybean with improved nutritional quality have been commercialized in the US including those with high monounsaturated oleic acid in the seed such as Event 260-05 (approved in 1997), Event DP-305423-1 (2009) and Vistive Gold MON87705-6 (2011); and omega-3 fatty acid enriched soybean MON87769 (2011).
Biotech CottonTotal upland cotton area was estimated at 3.98 million hectares in 2016 (USDA-NASS, 2016). Cotton planting was extremely affected in Texas due to heavy rains and severe weather, needing replanting in some areas. Low yields and losses due to flooding in 2015 made farmers to plant other crops in North Carolina, South Carolina and Virginia, hence, cotton planting was down. Biotech cotton was planted on 93% of the total cotton area (~3.7 million hectares) comprised of 4% IR, 9% HT, and 80% stacked IR/HT. Biotech cotton was planted in the USA since 1996 and 28 events with insect resistance, herbicide tolerance, and stacked IR/HT have been approved for food, feed, and cultivation.
Biotech CanolaCanola producers planted 690,000 hectares of canola in 2016, the fourth largest planting on record (USDA, NASS, 2016). 90% (621,000 hectares) was planted to herbicide canola which is 5% higher than the 2015 hectarage of 591,000 hectares. There are 20 biotech canola events approved for food, feed and cultivation in the USA (as of November 2016). Yield of canola increased by 6% since the introduction of GM canola. The Canadian Food Inspection Agency approved SU Canola™ in 2016.
Some biotech canola events have improved oil content for the health-conscious public, such as high lauric acid canola (Laurical Canola™) Event 28 and Event 23 approved in 1994. Event MPS 963 Phytaseed™ (1998) with high
United States of America
Global Status of Commercialized Biotech/GM Crops: 2016
11
lauric acid approved in 1994, that contains an enzyme to break down plant phytases to make phosphorous available to monogastric animals.
Biotech Sugar beetTotal hectarage of sugar beet in 2016 was similar to 2015 at ~472,000 hectares, also at 100% adoption. Since its introduction in 2006, farmers in the USA welcomed the commercialization of biotech sugar beet which provided superior weed control, more cost effective and much easier to cultivate than conventional sugar beet. From small farmer trials in 2006-2008, adequate seed supplies became available in 2009, and ~485,000 hectares were planted in the USA. Despite critics’ attempts to restrict planting biotech sugar beet in 2009, the scientific and farming logic of biotech sugar beet prevailed. Thus, in a landmark decision RR®sugar beet was deregulated by the USDA in July 2012 (USDA, 19 July 2012). And from 2010 to 2015, the total hectarage of sugar beet was the same at approximately 500,000 hectares, of which biotech percentage increased from 95% in 2011 to 98.5% in 2014 and 100% in 2015 and 2016. Since 2009, three herbicide tolerant sugar beet events have been approved for food, feed, and commercialization in the USA.
herbicide tolerant and low lignin alfalfa Alfalfa is the fourth largest crop in the US occupying 8.46 million hectares. In 2016, it was estimated that 1.23 million hectares herbicide tolerant alfalfa were planted for hay, alfalfa haylage and green chop. The planted area was composed of 1.214 million hectares herbicide tolerant and 20,000 hectares of altered lignin alfalfa (HarvXtra™). Over 90% of the alfalfa in the USA is used for animal feed with about 7% used as sprouts for human consumption.
Herbicide tolerant RR®alfalfa was first approved for commercialization in the USA in June 2005
with 20,000 hectares planted in the fall of 2005 that increased to 100,000 hectares in 2005/2006. A court order (not based on safety reasons) filed by critics, stopped planting in 2007, pending completion of an environmental impact statement (EIS) by USDA. Farmers who had planted the 100,000 hectares of RR®alfalfa were not required to uproot the RR®alfalfa already planted which has remained in the ground for up to 6 years, due to the perennial nature of alfalfa which is normally ploughed at up to six years. On 21 June 2010, the Supreme Court overturned the ban, and on 16 December, USDA announced that the EIS was completed. By 27 January it declared that planting of RR®alfalfa could be resumed on 2 February 2011 – the first planting since 2007. Farmer demand has been significant and it was estimated that the total accumulated hectarage of this herbicide tolerant perennial crop planted from 2011 to 2016 is more than 1 million hectares.
There have only been two herbicide tolerant alfalfa events approved for food, feed, and cultivation in the USA since 2005. In 2014, a new biotech low-lignin alfalfa event KK179 was approved for cultivation in the US. The product, which has less lignin, has higher digestibility and offer a 15 to 20% increase in yield.
other Biotech Crops Planted in the uSA portfolio of biotech crops have been approved for commercialization in the USA since 1996 including creeping bent grass, flax, melon, papaya, plum, potato, rice, squash and tobacco. Small areas of biotech virus resistant squash (1,000 hectares) and PRSV resistant papaya in Hawaii (1,000 hectares) continued to be grown in the USA in 2016.
Biotech Products for ConsumersThe new generation of biotech crops are those that are fruit and vegetable staples that can be eaten raw or cooked. These include biotech
United States of America

Global Status of Commercialized Biotech/GM Crops: 2016
12
crops PRSV resistant papaya, Innate™ potato (with non-browning, low acrylamide content potential, low reducing sugars and bacterial blight resistance traits), non-browning Arctic® apple, and biotech salmon. These are biotech products that are not only economically important but also cater to the needs of the consuming public for nutrition, aesthetics and address the problem of wastage. The acceptance of the US market of the first generation biotech crops with agronomic traits geared towards livestock and manufacturing industry use, has elevated the US agricultural industry as a major exporter globally. Acceptance and adoption of these new products directly by the consuming public will no doubt boost the food and health industry of the country.
PRSV Resistant Papaya Papaya is a fruit staple not only in Hawaii but also the mainland USA. Ring spot virus had infected virtually all of Hawaii’s papaya production in the early 1990s, dropping from 58 million pounds in 1993 to 35 million pounds in just five years, and a production decline worth US$17 million per year. Papaya ring spot virus (PRSV) resistant papaya was developed by Cornell University (USA) and University of Hawaii in 1997, and commercialized immediately in the US since 1998, 18 years ago. In less than four years, papaya production recovered and Hawaii has started exporting its biotech papayas to Canada in 2002. In 2011, the Japanese approval was granted and officially announced by Japan’s Ministry of Agriculture, Forestry and Fisheries responsible for GM processed food quality labeling. Article 7 Clause 1 on GM fresh food quality labeling was amended on 31 August 2011 to include papaya as Japan’s 8th GM imported food; the notification was effective on 1 December 2011 (MAFF, 2011). In the US, there are a nominal 1,000 hectares planted to virus-resistant papaya and 1,000 hectares with virus resistant squash, in 2014.
In 2015, the Maui County Council dismissed a proposal to ban biotech papaya filed in 2014. Chris Wozniak of the US Environmental Protection Authority emphasized that there is no difference between eating rainbow papaya and a papaya with the virus, which is prevalent (CBU, 9 July 2014). Moreover, US District Court Chief Judge Susan Oki Mollway has ruled that the Maui County’s ordinance to ban the cultivation of genetically engineered crops in Hawaii preempts the federal and state laws and therefore invalid (AgProfessional, 6 July 2015). A court decision against the said ordinance was decided by the U.S. Court of Appeals (Herald Tribune, 2016). The court found the ban violated state and federal law. The decision is similar to the earlier one made by the U.S. District Court. Decision made by the Court of Appeals ruled that the USDA is the sole authority that can regulate field trials and experimental GM crops, which neither state nor local governments can ban or regulate.
In 2016, University of Florida filed an application at the EPA for its PRSV papaya commercialization in Florida. Researchers at the university commented that more than 60% of papaya growers are willing to grow biotech papaya if available. These growers need this option to reduce costs of production by reducing the need to replant every 18 to 24 months. In 2016, some 1,000 hectares of PRSV-R papaya are estimated to be planted in Hawaii.
Non-browning Arctic® ApplesThe USDA Animal and Plant Healthy Inspection Service (APHIS) approved the first two apple varieties genetically engineered to resist browning in 2015. The non-browning apple varieties, Arctic®Golden and Arctic® Granny apples, and recently the Arctic®Fuji were developed by Okanagan Specialty Fruits Inc. (OSF), a small grower-led company based in Canada. The non-browning Arctic apples went through rigorous review and were in field trials for more than a decade. The US Food and Drug
United States of America

Global Status of Commercialized Biotech/GM Crops: 2016
13
Administration’s (US FDA) publicly available risk assessment documents concluded that Arctic apples are just as safe and healthful as any other apple, and they are unlikely to pose a plant pest risk, and deregulation is not likely to have a significant impact on human environment.
In 2016, the company announced the successful completion of the first commercial harvest of its biotech Arctic® apple varieties. These are planned to be sold across North America in early 2017. The company has also completed its 70,000 tree planting goal for 2016 including both Arctic® Golden and Arctic® Granny varieties. It has 300,000 and 500,000 trees for 2017 and 2018, respectively under contract in North America. Annually, these trees will produce over 30 million pounds of Arctic® apples (Intrexon, 2016).
Biotech PotatoesInnate™ potato with lower levels of acrylamide, a potential carcinogen, and less wastage due to bruising was developed by Simplot. The company licensed the biotech late blight resistant potato from the John Innes Institute in the UK and developed the late blight resistant potato with low acrylamide potential, reduced black spot bruising and lowered reducing sugars. Levels of acrylamide can be reduced by up to 90% when potatoes are cooked at high temperatures. Lowering the reducing sugars enable cold storage at 38oF for more than six months without the build up of sugars, that maintains quality (Simplot Website, 2016; NBC News, 2016). After passing through regulation (US FDA and APHIS) in 2014, three Innate™ potato generation 1 varieties (Russet Burbank, Ranger Russet and Atlantic) were given deregulation approvals and planted on 160 hectares in the US in 2015, which increased to 2,500 hectares in 2016. The company said that about 40 million pounds of the first generation potatoes have been sold to consumers in more than 35 states, equivalent to 1 percent of all
potato sales. Of the 40 million pounds, about two-thirds went to produce sections of stores (Phys.org, 31 October 2016).
By August 2015, a Russet Burbank generation 2 with late blight resistance, low acrylamide potential, reduced black spot bruising, and lowered reducing sugar was deregulated by the USDA-APHIS (CBU, August 2015). This generation 2 event underwent an FDA evaluation concluding that these potatoes are not materially different in composition, safety, and other relevant parameters, from any other potato or potato-derived food or feed currently on the market. In October 2016, two variants of generation 2 event, J.R. Simplot Co.’s Ranger Russet and Atlantic varieties, were given clearance by the USDA for commercial planting sometime in 2017. These two varieties join Russet Burbank variety with the same traits that has already been approved by the Agriculture Department and FDA, with EPA approval is also expected in January 2017 (Idaho Statesman, 31 October 2016).
It is important to note that late blight continues to be a major problem for potato growers around the world, especially in wetter regions. These new types of potatoes will bring 24-hour protection to farmers’ fields and reduce the use of fungicide spray of up to 45 percent to control late blight, reduce waste and increase by 15% the top-quality potatoes due to the non-browning trait.
Non-browning apples and potatoes are the first two biotech crops that address food wastage in these commodities. In the US alone, it is estimated that 31% or 133 billion pounds of food is wasted annually, contributing to 18% of the total methane emissions that comes from landfills (GMO Answers, 2016).
Biotech SalmonBiotech salmon, the first genetically engineered salmon for human consumption given approval
United States of America
Global Status of Commercialized Biotech/GM Crops: 2016
14
by USDA FDA in 2015, received a temporary hold on its import and sale until the agency can publish labeling guideline. AquAdvantage salmon was developed by US-based AquaBounty that contains a growth hormone gene from a Chinook salmon and a fragment of ocean pout DNA to perpetually activate it. This allows the salmon to get to mature size in 18 months compared to the typical three years. Initially, the agency required additional labeling of GM foods if “there is material difference, such as difference in nutritional profile.” As of this writing, AquaBounty has no information on when the FDA will finalize its labeling guidance for the biotech salmon. Meanwhile, Health Canada gave approval for its salmon to be produced, sold and consumed in the country in 2016, similar to the US FDA approval in 2015. In the meantime field trials of biotech salmon have started in April 2016 in Brazil and Argentina (Undercurrent News, 28 July 2016).
Biotech Products in the Pipeline
Biotech/GM Chestnut TreesAmerican chestnut (Castanea dentata) is a native keystone species that was nearly eradicated by chestnut blight caused by the fungal pathogen, Cryphonectria parasitica. The fungus killed the chestnut tree by secreting oxalic acid but this can be detoxified by an enzyme, oxalate oxidase, found in wheat. A new approach to producing American chestnut trees with enhanced blight resistance is through the introduction of the wheat oxalate using Agrobacterium-mediated transformation. The transgenic American chestnut ‘Darling4’ which expresses a wheat oxalate oxidase gene exhibited an intermediate blight resistance. It was found to be more resistant than American chestnut but less resistant to Chinese chestnut (Castanea mollissima), the source of the resistant genes. Enhanced resistance was first observed in an assay of young chestnuts grown indoors.
Attempts to save the American chestnut trees against chestnut blight are progressing after the successful field tests of 800 GM chestnuts that contain various combinations of 6 genes from Chinese chestnuts in 2014 (CBU, 15 May 2013; 14 May 2014). According to lead scientists Dr. Chuck Maynard and Dr. William Powell, field tests were conducted in 2016, and field trials for three years will soon commence. They estimate that GM chestnuts will be in the US in about four years if all regulations proceed smoothly. Plans to re–establish this tree in its natural range is being pursued with APHIS so that the transgenic chestnut genes can be spread as far and mix with as many chestnut stump sprouts as possible. The team also developed transgenic elm seedlings to fight Dutch elm disease, field tested GM hybrid poplars, and identified other pathogens that affected butternut, white pine, beech, dogwood, and oak (Phys.org, 19 January 2016).
Citrus Greening Resistant CitrusA citrus disease has been wreaking havoc in citrus-growing states of Florida and neighboring states. The disease caused by the bacteria Candidatus liberibacter asiaticus and spread by psyllids was recorded in the early 70’s. The disease turns oranges into green, misshapen, and bitter-tasting fruits, thus the name citrus greening or Huanglongbing (HLB) disease. Millions of acres of citrus crops have already been lost in the US and overseas, and 80% of Florida’s citrus trees are infected and declining. The bacterial disease incubates in the tree’s roots, moves back up the tree in full force, causing nutrient flows to seize up. Florida’s US$5.1 billion citrus industry could be a complete loss unless it soon finds a way to fight the disease. Cocktails of chemicals/insecticides to kill the vector psyllids are no longer effective. A Texas A&M scientist, with funds from Southern Gardens – a large citrus growing company – inserted a spinach gene to fight the bacteria. Five years of successive small field trials of the transgenic trees have
United States of America

Global Status of Commercialized Biotech/GM Crops: 2016
15
shown high degree of resistance. A successful two-year larger trial of second- and third-generation trees was completed in 2013. Southern Gardens is now seeking to deregulate these oranges for free use, anticipating first commercial planting in three to four years (Food Safety News, 13 December 2013). In 2015, US EPA approved wider testing of the biotech citrus by providing an Experimental Use Permit under the Federal Insecticide, Fungicide and Rodenticide Act. The permit allows Southern Gardens to move forward in its development of the possible use of a spinach protein to help control the devastating citrus greening disease, or Huanglongbing (HLB) (CBU, 20 May 2015). In 2016, the genes are planned to be transferred into additional commercial varieties and rootstock of citrus commonly grown in Florida (UF News, 2016).
Political Will and Support for Biotech Crops
Modernizing the US Regulatory SystemOn 16 September 2016, the United States Federal Government took an important step to ensure public confidence in their regulatory system for products of biotechnology, and to improve the transparency, predictability, coordination, and efficiency of the system. The U.S. Environmental Protection Agency, U.S. Food and Drug Administration, and U.S. Department of Agriculture released two documents to modernize the Federal regulatory system for biotechnology products.
The first document, a proposed Update to the Coordinated Framework, which was last updated in 1992, is the first time in 30 years that the Federal government has produced a comprehensive summary of the roles and responsibilities of the three principal regulatory agencies with respect to the regulation of biotechnology products. The update also offers to the public a complete picture of the robust and flexible regulatory structure providing
appropriate oversight for all products of modern biotechnology.
The second document, the National Strategy for Modernizing the Regulatory System for Biotechnology Products, sets forth a vision to ensure that the Federal regulatory system can efficiently assess the risks, if any, associated with future products of biotechnology while supporting innovation, protecting health and the environment, maintaining public confidence in the regulatory process, increasing transparency and predictability, and reducing unnecessary costs and burdens. In the Strategy, the Federal agencies demonstrate their sustained commitment to ensure the safety of future products of biotechnology, increase public confidence in the regulatory system, and prevent unnecessary barriers to future innovation and competitiveness (CBU, 28 September, 2016).
Benefits of Biotech Crops
In the 20 years of commercialization of biotech crops (1996-2015), the USA accrued the highest benefits at US$72.9 billion and US$6.9 billion for 2015 alone (Brookes and Barfoot, 2017 Forthcoming). The US, one of the first six countries to commercialize biotech crops has been benefiting from the technology, and is expected to retain its position with the most new biotech crops and traits being developed and commercialized.
In summary, the United States remains at the forefront of biotech/GM crops development and commercialization. As the major biotech crops soybean, maize and cotton in the US reach its optimum adoption of 93%, new crops and traits have been developed and commercialized for consumer traits to reduce wastage and to improve taste and nutrition such as the non-browning apple and potato (with additional late blight disease resistance). Expansion of
United States of America

Global Status of Commercialized Biotech/GM Crops: 2016
16
planted areas for these new crops and traits are expected as consumers realize the benefits and accompanying cost reduction of the technology, including low lignin content alfalfa and drought tolerant maize.
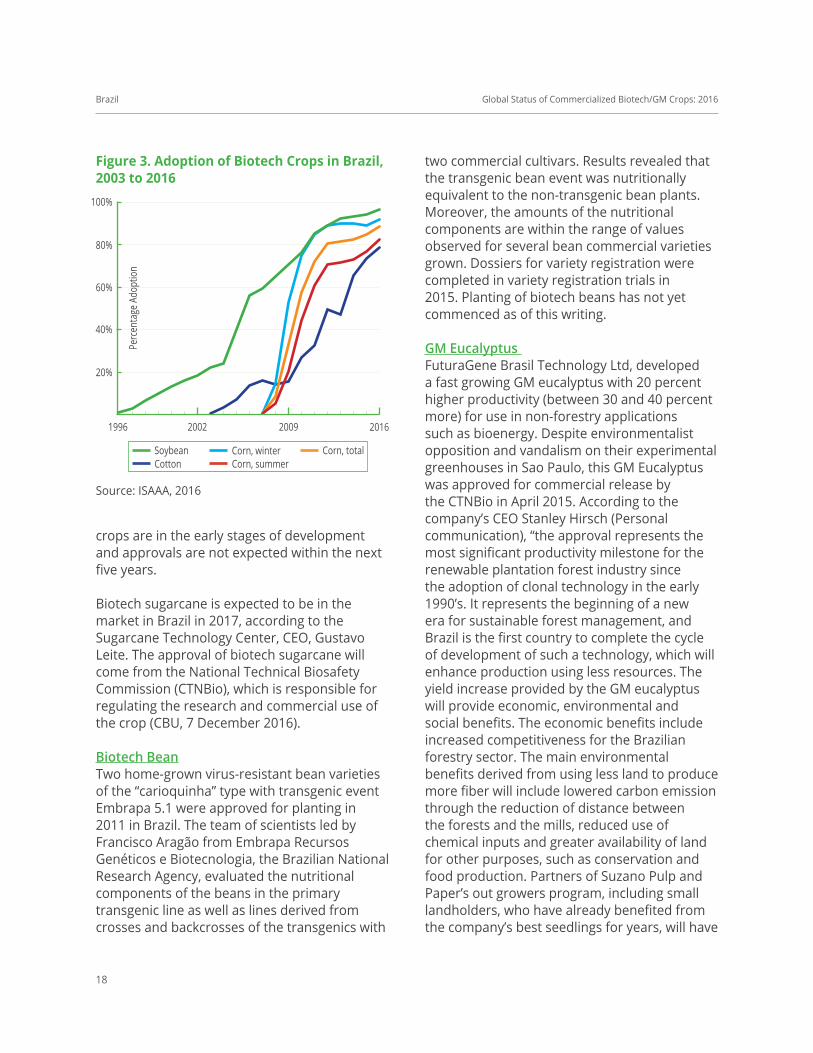
BRazil In 2016, Brazil retained its #2 world ranking after the US (72.92 million hectares), with 49.1 million hectares of biotech crops planted, representing 27% of the global hectarage of 185.1 million hectares. Brazil’s total biotech crop hectarage of ~49.14 million hectares is an increase of 11%, from 2015 (44.2 million hectares), or 4.9 million hectares. This 4.9 million hectare increase was by far the highest increase in any country worldwide in 2016 making Brazil the engine of growth in biotech crops worldwide. Biotech crops planted include: ~32.7 million hectares biotech soybean; 15.7 million hectares of biotech maize (summer and winter maize); and ~0.8 million hectares of biotech cotton. The total planted area of these three crops in Brazil was estimated at 52.6 million hectares of which 49.14 million hectares or 93.4% was biotech. The adoption rate of 93.4% is a 2.7% increase in adoption compared to 2015 (90.7%) (Table 5).
From 2003 to 2016, Brazil has approved 57 events for import for food, feed processing and cultivation including 33 maize events, 12 cotton events, 10 soybean events, one bean event and one eucalyptus. In 2016 alone, Brazil approved a maize event MON89034 x TC1507 x NK603 x DAS40278 for food, feed and cultivation (ISAAA GM Approval Database, 2016).
Biotech SoybeanIn Brazil, biotech soybean has the highest hectarage with 32.69 (~32.7) million hectares, a year-to-year increase of 2.3 million hectares or 7.5% (from 30.3 million hectares in 2015),
and a 96.5% adoption rate of 33.87 million total hectares in 2016/2017. The 32.69 million hectares of biotech soybean was comprised of 12.43 million hectares herbicide tolerant (36.7%) and 20.25 million hectares stacked IR/HT (59.8%). “Intacta™”, the IR/HT soybean was first planted on 2.2 million hectares in 2013/14; in its second season, 2014/15, it reached an estimated area of 5.2 million hectares, and further increased to 11.9 hectares in 2015/2016, and 20.25 million hectares in 2016/2017. The adoption rate of biotech soybean increased by 2.3% from 94.2% in 2015 to the current 96.5%. This was despite the expected higher cost of production, higher interest rates, concerns about the domestic economy, and soybean areas shifting back to the more profitable maize.
Biotech MaizeBiotech maize, the second most important biotech crop in Brazil was planted on a total of 15.67 million hectares (summer 5.28 million hectares and winter 10.39 million hectares), an increase of 2.53 million hectares or 16.1% from 2015 (13.14 million hectares). This year-on-year increase is due to a larger total maize planted area of 17.73 million hectares compared to 15.53 million hectares in 2015 and an increased adoption rate of 88.4% from 84.6% in 2015. The 15.67 million hectares of biotech maize was comprised of 3.67 million hectares IR (20.7%), 0.68 million hectares HT (3.8%) and 11.32 million hectares IR/HT (63.9%), with a total of 88.4% adoption rate. The increasing percent hectarage of stacked traits follows the global trend where farmers prefer seeds with stacked traits compared to single traited-seeds. Biotech maize adoption in summer was 82.3% or 5.28 million hectares and 91.8% or 10.39 million hectares in winter.
Maize was expected to become a more profitable crop than soybean in 2016, because of the high domestic maize prices. To support the livestock industry, the country imported
United States of America

Global Status of Commercialized Biotech/GM Crops: 2016
17
Crops Planted area
(Million ha)
adoption rate | (% of total) Planted area with biotech | (Million ha)
iR ht iR/ht total iR ht iR/ht total
Soybean 33.87 36.7 59.8 96.5 12.43 20.25 32.69Maize, summer 6.41 13.5 2.5 66.4 82.3 0.86 0.16 4.26 5.28Maize, winter 11.32 24.8 4.6 62.4 91.8 2.81 0.52 7.07 10.39Maize, total 17.73 20.7 3.8 63.9 88.4 3.67 0.68 11.32 15.67Cotton 1.01 12.1 24.0 42.3 78.3 0.12 0.24 0.43 0.79Brazil 52.6 7.2 25.4 60.8 93.4 3.79 13.35 32.00 49.14
table 5. Biotech Crop hectarage in Brazil, 2016
Source: ISAAA, 2016
maize from Argentina, Paraguay and the USA. National Technical Biosafety Commission (CTNBio) approved three US biotech events (Syngenta 3272, MON87460, and MON 87427) on 6 October to allow importation. It was also reported that the state of Mato Grosso will expand their maize ethanol production in 2016.
Biotech CottonBiotech cotton was the third biotech crop in Brazil, estimated to occupy 0.79 million hectares in 2016/17, a 78.3% adoption rate of the total 1.01 million hectares (same as 2015) planted with cotton. In 2016/17, biotech cotton increased by 6.3% over 2015 (0.74 million hectares). Biotech cotton hectarage of 0.79 million hectares was comprised of 0.12 million hectares IR (12.1%), 0.24 million hectares HT (24%) and 32 million hectares stacked IR/HT (42.3%), with a total of 79% adoption.
The gain in hectares in cotton was obtained despite the economic crisis in Brazil brought by the devaluation of the Real. For cotton farmers, the Real depreciation benefited the farmers as they were able to buy inputs using a stronger Real in the first half of 2015, but domestic prices were protected by a weaker Real they got while selling the crop in the second half of the year.
Thus, prices of domestic cotton went up even if the global cotton price was lower. As a result of the weaker Real, the cost of production (seeds, fertilizers, pesticides) has gone up tremendously.
In summary, the collective hectares for all three biotech crops in Brazil in 2016/17 was 49.14 million hectares equivalent to 93.4% adoption; more specifically biotech soybean adoption was 96.5%; biotech summer maize adoption was 82.3%; biotech winter maize was 91.8% and biotech cotton adoption was 78.3% (Table 5 and Figure 3). The 2016/17 adoption rate of 93.4% is 2.7% higher than the 2015/2016 adoption rate of 90.7%. Stacked traits in the three biotech crops increased by an average of 34% with Intacta™ soybean gaining the highest increase at 70.9%.
Biotech Crops in the Pipeline
Brazilian and multinational seed companies and public sector research institutions are working on the development of various biotech crops. Currently, there are a number of biotech crops in the pipeline waiting for commercial approval, of which the most important are beans, sugarcane, potatoes, papaya, rice and citrus. Except for beans and sugarcane, most of these
Brazil
Global Status of Commercialized Biotech/GM Crops: 2016
18
crops are in the early stages of development and approvals are not expected within the next five years.
Biotech sugarcane is expected to be in the market in Brazil in 2017, according to the Sugarcane Technology Center, CEO, Gustavo Leite. The approval of biotech sugarcane will come from the National Technical Biosafety Commission (CTNBio), which is responsible for regulating the research and commercial use of the crop (CBU, 7 December 2016).
Biotech BeanTwo home-grown virus-resistant bean varieties of the “carioquinha” type with transgenic event Embrapa 5.1 were approved for planting in 2011 in Brazil. The team of scientists led by Francisco Aragão from Embrapa Recursos Genéticos e Biotecnologia, the Brazilian National Research Agency, evaluated the nutritional components of the beans in the primary transgenic line as well as lines derived from crosses and backcrosses of the transgenics with
two commercial cultivars. Results revealed that the transgenic bean event was nutritionally equivalent to the non-transgenic bean plants. Moreover, the amounts of the nutritional components are within the range of values observed for several bean commercial varieties grown. Dossiers for variety registration were completed in variety registration trials in 2015. Planting of biotech beans has not yet commenced as of this writing.
GM Eucalyptus FuturaGene Brasil Technology Ltd, developed a fast growing GM eucalyptus with 20 percent higher productivity (between 30 and 40 percent more) for use in non-forestry applications such as bioenergy. Despite environmentalist opposition and vandalism on their experimental greenhouses in Sao Paulo, this GM Eucalyptus was approved for commercial release by the CTNBio in April 2015. According to the company’s CEO Stanley Hirsch (Personal communication), “the approval represents the most significant productivity milestone for the renewable plantation forest industry since the adoption of clonal technology in the early 1990’s. It represents the beginning of a new era for sustainable forest management, and Brazil is the first country to complete the cycle of development of such a technology, which will enhance production using less resources. The yield increase provided by the GM eucalyptus will provide economic, environmental and social benefits. The economic benefits include increased competitiveness for the Brazilian forestry sector. The main environmental benefits derived from using less land to produce more fiber will include lowered carbon emission through the reduction of distance between the forests and the mills, reduced use of chemical inputs and greater availability of land for other purposes, such as conservation and food production. Partners of Suzano Pulp and Paper’s out growers program, including small landholders, who have already benefited from the company’s best seedlings for years, will have
Soybean Corn, totalCorn, winterCorn, summerCotton
20161996 2002 2009
20%
40%
60%
80%
100%
Perc
enta
ge A
dopt
ion
figure 3. adoption of Biotech Crops in Brazil, 2003 to 2016
Source: ISAAA, 2016
Brazil

Global Status of Commercialized Biotech/GM Crops: 2016
19
access to the technology under terms of current contracts, which do not involve the payment of royalties.” As of this writing, planting of GM eucalyptus has not commenced.
economic Benefits of Biotech Crops in Brazil
Rural producers of cotton, maize and soybean crops first adopted agricultural biotechnology in Brazil 20 years ago. For the seventh consecutive year, Céleres® has studied and analyzed the economic benefits resulting from the use of this technology, collected from rural producers and the industries that develop the technology. Based on field studies it was estimated that since the introduction of agricultural biotechnology in Brazil in the 1996/97 to 2012/13 crop period, the economic benefits to users of this technology — in this case rural producers and the controlling industry — have reached US$24.8 billion.
Another annual global study of benefits from biotech crops covering a different period (2003 to 2015) concluded that Brazil gained US$16.4 billion during the ten year period 2003 to 2015 and US$2.5 billion for 2015 alone (Brookes and Barfoot, 2017 Forthcoming).
The successful development of the home-grown biotech bean and herbicide tolerant soybean confirms Brazil’s internationally recognized self-sufficient capability for developing biotech crops which are important for Brazil’s fast-growing domestic and export needs as well as its contribution to global food security.
In summary, Brazil obtained the highest increase of 11% or 4.9 million hectares of biotech crops in 2016 compared to 2015. Similar to the US, adoption rates of the three major biotech crops almost reached market saturation at an average of 93.4%. IR/HT soybean Intacta™ has gained popularity among the farmers because of the savings in pesticide and the no-till technology, thus, the increased hectarages. Maize hectarage
may expand with the increasing need by the pork and livestock industry for feeds. New products waiting to be commercialized which are expected to impact the Brazilian economy are the biotech eucalyptus, sugarcane and virus resistant bean.
aRGeNtiNa Total biotech crops planted in Argentina in 2016 was 23.81 million hectares, 0.67 million hectares less than the 24.49 million hectares in 2015 (Table 1). Argentina maintained its ranking as the third largest producer of biotech crops in the world in 2016, after the USA and Brazil, occupying 13% of global hectarage.
In 2016, the 23.82 million hectares was comprised of 18.7 million hectares of biotech soybean, an all time high of 4.74 million hectares of biotech maize and a reduced cotton biotech area of 0.38 million hectares of biotech cotton (Table 6). Argentina is one of the six “founder biotech crop countries” having commercialized RR®soybean and Bt cotton in 1996, the first year of global commercialization of biotech crops. After retaining the second ranking position in the world for biotech crops area for 13 years, Argentina was narrowly displaced from being the second largest producer of biotech crops in the world in 2009, by Brazil. Argentina has achieved a marked improvement in its promotion of biotech crops and has pursued their timely regulation aggressively.
The 47 biotech crop products approved for commercial planting in Argentina and for import as food and feed products from 1996 to 2016 include: 4 cotton events, 35 maize events, and 8 soybean events. In 2016, six maize events were approved for food, feed and cultivation: IR stacked MON810 x MIR162; IR/HT stacked TC1507 x MON810 x MIR162 x
Argentina

Global Status of Commercialized Biotech/GM Crops: 2016
20
NK603 and its combinations: MIR162 x NK603, TC1507 x MON810 x MIR162, TC1507 x MIR162 x NK603, and MON810 x MIR162 x NK603. In 2015, the country approved the herbicide tolerant soybean DAS 44406-6, drought tolerant IND 00410-5, and modified fatty acid profile x HT DP 305423-1 x MON 04032-6, and more importantly the potato virus Y resistant potato TIC-AR233-5.
The approval by Argentina of two locally-developed biotech crops, a drought tolerant soybean and a virus Y resistant potato reflects Argentina’s increasing national capability of developing its own biotech crops which is also the case in neighboring Brazil.
Biotech Soybean In 2016, Argentina planted 18.7 million hectares
Crops area (Million hectares)
Y/Y diff (%) trait Percentage and (adoption Rate)
2015 2016 2015 2016Soybean
Total Crop Planted 21.10 18.70 -2.40 (-11%)HT 20.40 16.18 -4.22 (-21%) 97 87IR/HT 0.70 2.52 1.82 (260%) 3 13Total Biotech Crop Planted 21.10 18.70 -2.40 (-11%) (100%) (100%)
MaizeTotal Crop Planted 3.00 4.90 1.90 (63%)IR 0.60 0.43 -0.17 (-28%) 21 09HT 0.24 0.62 0.38 (158%) 8 13IR/HT 2.02 3.70 1.68 (83%) 71 78Total Biotech Crop Planted 2.86 4.74 1.88 (66%) (95%) (97%)
CottonTotal Crop Planted 0.53 0.40 -0.13 (-25%)HT 0.04 0.23 0.19 (457%) 8 62IR/HT 0.49 0.15 -0.34 (-70%) 92 38Total Biotech Crop Planted 0.53 0.38 -0.15 (-28%) (100%) (95%)
total argentinaTotal Crop Planted 24.63 24.00 -0.63 (-3% )IR 0.60 0.43 -0.17 (-28%) 2 2HT 20.68 17.08 -3.60 (-17%) 84 72IR/HT 3.21 6.32 3.11 (97%) 13 27Total Biotech Crop Planted 24.49 23.81 -0.67 (-3%) (99%) (99%)
table 6. Biotech Crop hectarage in argentina, 2016
Source: ISAAA, 2016
Argentina

Global Status of Commercialized Biotech/GM Crops: 2016
21
of biotech soybean, 78% of the ~24.00 million hectares of biotech crops planted in the country. There was a decrease of 2.4 million hectares (11%) of biotech soybean from 21.1 million hectares in 2015. Biotech soybean was comprised of 16.18 million hectares HT and 2.52 million hectares of stacked IR/HT soybean. It is notable that Intacta™ (stacked IR/HT) adoption was increased by 260% in 2016 – an indication of farmers adopting a technology that reduces costs and increases profits. According to USDA FAS (2016), the decreased area of soybean production was due to greater competition from alternative crops such as maize and sunflower, as well as lower than expected wheat plantings. Adverse weather conditions, crop damage, and harvest delays forced some producers to abandon planting wheat for winter. As such, the area originally designated for the 2nd cropping of soybean after wheat, was lowered.
A drought and salinity tolerant soybean event IND-ØØ41Ø-5 event developed by the Institute of Agriculture Biotechnology of Rosario (Indear) was approved by the Argentine Secretary of Agriculture, Livestock and Fisheries Gabriel Delgado in 2015. A sunflower gene hahba-4 that confers drought and salinity tolerance was introduced by the group of Rachel Chan of the Universidad Nacional del Litoral in collaboration with Arcadia Biosciences Inc. and Verdeca (Valorsoja, 6 October 2015). This biotech soybean will create significant value for soybean growers and end markets by increasing the productivity and sustainability of the world’s most important protein crop.
Biotech soybean event DP305423 x GTS 40-3-2 with high oleic acid was approved in 2015. This is the only biotech crop in Argentina so far that is targeted to the health conscious consumers.
Biotech Maize Of the total maize hectarage in 2016 of 4.9 million hectares, 4.74 million hectares were
planted to biotech maize comprised of 0.43 million hectares IR, 0.62 million hectares HT, and 3.70 million hectares stacked IR/HT. Thus, the stacked gene IR/HT maize product occupied 78%, higher by 8% compared to 2015 of the biotech maize, and is expected to retain this premier position in the future. Earlier estimates were for a reduced maize planting due to lack of soil humidity and reduced temperature for optimum planting. However with the rains in the later part of the year, farmers were able to finish planting of early maize which in 2016 is 63% higher than 2015.
Insect resistant biotech maize was introduced in Argentina in 1998 and herbicide tolerant maize in 2004. Stacked trait (IR/HT) varieties became available in 2007, and by 2016, 78% of biotech maize was planted with stacked varieties.
Biotech Cotton Biotech insect resistant cotton has been planted in Argentina since 1998 and herbicide tolerant cotton since 2002. A total of 400,000 hectares were planted to cotton in 2016, 0.13 million hectares (25%) less than that in 2015. Biotech cotton was 95% (380,000 hectares) of the total cotton planted, comprised of 150,000 hectares IR/HT stacked products and 23,000 hectares herbicide tolerant (HT) cotton. Since 2015, there is no recorded IR cotton planted in the country.
It is noteworthy, that farmer-saved seeds (prevalent in Argentina) can lead to problems with IR cotton if the purity drops to a point where larvae can establish on non-IR cotton plants and start an infestation which can compromise insect resistant management strategies. There has been a shift towards more cotton grown on larger farms due to the damage caused by boll weevil which is more easily controlled by larger farmers than smaller farmers.
Argentina

Global Status of Commercialized Biotech/GM Crops: 2016
22
An analysis made by Trigo et al, 2011 on the adoption of transgenic crops in Argentina reveals an unprecedented process of incorporating the technologies both at the international and a local level. Such that, when compared with hybrid maize or wheat with Mexican germplasm, it took 27 and 12 years, respectively to surpass 80% of the planted area while biotech varieties reached this figure in less than one decade (Trigo, 2011).
Biotech Crops in the Pipeline
Secretary of Agriculture, Livestock and Fisheries Gabriel Delgado authorized the marketing of a potato event (TIC-AR233-5) resistant to PVY (Potato Virus Y) throughout the national territory on 6 October 2015. The authorization does not cover Valles and some places of the Oasis Irrigation; the provinces of Salta and Jujuy to preserve commercially producing areas of Andean tubers (Valorsoja, 6 October 2015). Although the potato event TIC-AR233-5 will not eliminate the need to repurchase PVY free seed, it will allow producers to replant their own seed and eventually reduce production costs for two to three seasons. Potato farmers will benefit from the virus resistance which infects non-GM plants by up to 80%. The biotech potato was developed by Fernando Bravo Almonacid from the National Research Council of Argentina, CONICET at the Institute for Research on Genetic Engineering and Molecular Biology (INGEBI, CONICET-UBA) with Alejandro Mentaberry.
Wheat is being developed in the country to be drought resistant by researchers at Instituto Nacional de Tecnología Agropecuaria (INTA) in collaboration with lead scientist Eduardo Blumwald of University of California Department of Plant Sciences at UC Davis. The team used a cytokinin synthesis gene under a water stress inducible promoter to confer
drought resistance in wheat. Regenerated plants remain green and do not enter into senescence during drought stress (Valorsoja, 6 October 2015). In the pipeline as well is a glyphosate tolerant sugarcane being developed at the Obispo Colombres Agricultural Station.
Benefits from Biotech Crops in argentina
Recent data on the economic benefits from biotech crops, Brookes and Barfoot (2017, Forthcoming) estimates that Argentina has enhanced farm income from biotech crops by ~US$21.1 billion in the 20 years of commercialization of biotech crops (1996 to 2015) and the benefits for 2015 alone were estimated at US$1.2 billion.
A comprehensive study by Trigo (2016) on the benefits of biotech crops (soybean, maize and cotton) in Argentina for the 20 years of its commercialization (1996-2016) indicated a gross benefit of US$126.97 billion (Table 7), an unprecedented 75% increase in benefits from the previous US$72,363 million determined by Trigo (2011) for 1996-2010. The total benefits are summarized in Table 1.
With permission from the author, the Press Release is presented in full below that reflects the total benefits in the last 20 years (1996-2015). Biotech crops contributed with around US$127,000 million to the country’s economy.
Since its incorporation in 1996, cumulative gross benefits generated by genetically modified crops are estimated to amount to US$126,969.27 million. Most of these benefits went 66% to farmers, 26% to the National Governments and the remaining 8% to input suppliers (seeds and herbicides).
Since 1996, when the first herbicide-tolerant soybean was introduced, Argentina has been a leader in using genetically modified (GM)
Argentina

Global Status of Commercialized Biotech/GM Crops: 2016
23
crops, reaching about 24.5 million hectares of transgenic crops in the latest crop season 92015/2016). The incorporation process of these technologies has been quick and continuous, with an unprecedented adoption dynamics both at a national and international level. This has led to the fact that GM varieties currently represent almost the total planted area with soy, maize and cotton.
According to a commissioned study carried out by Dr. Eduardo Trigo for the Argentine Council for Information and Development of Biotechnology (ArgenBio), over the 1996-2016 period, this adoption process has contributed to the country with a cumulative gross benefit of US$126,969.27 million. These benefits went 66% to farmers, 8% to technology providers (seeds and herbicides) and 26% top the National Government (through export taxes). To put these figures into context, the National Government collected during the 2011-2015 period the equivalent to 1.4 times the annual cost of the Universal Allowance program – publicly known in Spanish as AUH (Asignacion Universal por Hijo).
At a social level, the study estimates that – considering the surplus generated from these technologies – over a 20-year period,
Crop and trait total Benefits
(Billion uS$)
amount (Percentage) of Benefits accrued tofarmers National
Governmenttechnology developers
HT Soybeans 118.36 77.943 (65.9%) 32.406 (27.4%) 8.006 (6.7%)BT/HT Maize 5.51 2.490 (45.2%) 0.975 (17.7%) 2.044 (37.1%)BT/HT Cotton 3.10 2.495 (95.0%) 0 0.155 (5.0%)total 126.97
table 7. economic Benefits of Biotech Crops in argentina (Billion uS$) and Percentage
Source: Trigo, 2016
this surplus should have created a total of 2,052,922 jobs.
The study also mentions some environmental impacts related to GM crops, and it emphasizes the synergy between the adoption of these technologies and no-till farming practices, considering the positive impact the latter has on the conservation of soils, the emission of greenhouse gases, carbon sequestration and the energetic efficacy of crop management. At the same time, the author warns about other issues that should be addressed, considering the competitiveness and sustainability of agriculture, as well as the need for rotating crops and active principles, recycling nutrients and implementing refuges in the case of insect resistant crops.
As to the future, the study highlights the importance of keeping agricultural biotechnology as a Policy of State. In this sense, it emphasizes that the future is one of a growing complexity regarding the demands for technological solutions, so that Argentine agricultural production continues in the path of expansion that it has gone through for the last decades. The challenge lies in creating an appropriate institutional framework for these technologies to be available. Respect for intellectual property, solid science-based
Argentina
Global Status of Commercialized Biotech/GM Crops: 2016
24
regulatory frameworks as well as effective international negotiations are key aspects to encourage investments in R&D and to sustain long-term biotechnology policies.
Biotechnology is an essential component to face in a sustainable manner, the demands from a constantly growing population, with increasingly scarce and limited resources due to environmental changes effects. The challenge is to find the paths and tools of adequate policies that suit today’s needs, so as to ensure that the country can keep on leading this technological field, as it has done until today.
Economic benefits per crop and sectorSoybeans accounted for US$118,355.91 million, which represent approximately 25% of Argentine Gross Domestic Product in 2015. Most of these benefits favored farmers (65.9%), while 27.4% was for the National Government – through export taxes – and the remaining 6.7% went to technology suppliers (seeds and herbicides, divided into approximately equal shares).
In the case of maize, insect-resistant and herbicide-technologies accounted for US$5,510.50 million. 45.2% of benefits went to farmers, 17.78% to the National Government and 37.1% to technology suppliers with about 31.4% going to the seed sector).
Finally cotton accounted for US$3,102.86 million, which went mainly to farmers (95%). With the remaining 5% distributed between seeds and herbicide suppliers.
Full report available at: www.argenbio.org.
In summary, a slight decline in hectarage of biotech crops was largely due to substantial reduction in soybean area and minimally on cotton area. The adverse weather condition
affected wheat planting, as well as the second soybean planting after wheat. On the other hand, increased maize planting was mainly due to favorable weather conditions. With almost maximum adoption of biotech crops in Argentina of 97%, expansion of biotech crop commercialization can be achieved using new crops and traits. The development of drought tolerant soybean which is now in testing stage will allow utilization of marginal areas affected by drought. Also, adoption of virus resistant potato will be beneficial to farmers in increasing yield and reduction of production cost. The biotech virus resistant potato and the high oleic acid soybean cater well to farmers and consumers who are keen on reasonably priced and healthy food products.
CaNada In 2016, Canada is fourth in world ranking of biotech crops, with an area of 11.1 million hectares, a 5% increase from 2015 of 10.95 million hectares, with an average adoption rate of 93%, similar to 2015 (Table 1 and Table 8). The four biotech crops grown in Canada in 2016 were canola (7.53 million hectares), soybean (2.08 million), maize (1.49 million), sugar beet (8,000 hectares with 100% adoption) and for the first time alfalfa (809 hectares). Total planting of these crops also increased by 5% from 11.74 million hectares (2015) to 12.38 million hectares.
Canada is a member of the group of six “founder biotech crop countries”, having commercialized herbicide tolerant canola in 1996, the first year of commercialization of biotech crops. Since 1996, Canada has approved 171 biotech events for food and feed use, and cultivation in various crops: alfalfa (3), apple (2), Argentine canola (18), cotton (25), flax (1), maize (64), papaya (1), Polish canola (4), potato (24), rice (1), soybean (21), squash (1), sugar beet (2), and tomato (4).
Argentina

Global Status of Commercialized Biotech/GM Crops: 2016
25
In 2016, Canada approved seven events for food, feed and cultivation including stacked HT MON 87419 and MZHG0JG, IR/HT MZIR098, as well as biotech potato events J3, J55, F10 and E12 which contains traits for reduced acrylamide potential and black spot bruise tolerance.
Biotech Canola Canada was the first country to commercialize biotech herbicide tolerant canola in 1996. HT canola occupied the largest biotech crop area in the country in 2016 at 7.53 million hectares of the total 8.1 million hectares planted to canola. This compares with 7.44 million hectares of the
Canada
Crops area (Million hectares)
Y/Y diff (%) trait Percentage and (adoption Rate)
2015 2016 2015 2016Soybean
Total Crop Planted 2.18 2.21 0.03 (1%)HT 2.05 2.08 0.03 (1%) 94 94Total Biotech Crop Planted 2.05 2.08 0.03 (1%) (94%) (94%)
MaizeTotal Crop Planted 1.57 1.62 0.05 (3%)IR 0.04 0.05 0.01 (3%) 3 3HT 0.19 0.21 0.02 (11%) 13 14IR/HT 1.21 1.23 0.02 (2%) 84 83Total Biotech Crop Planted 1.44 1.49 0.04 (3%) (92%) (92%)
Sugar beetTotal Crop Planted 0.02 <0.01 0.01 (-4.7%)HT 0.02 <0.01 0.01 (-4.7%) 100 100Total Biotech Crop Planted 0.02 <0.01 0.01 (-4.7%) (100%) (100%)
CanolaTotal Crop Planted 7.97 8.10 0.13 (2%)HT 7.44 7.53 0.09 (1%) 93 93Total Biotech Crop Planted 7.44 7.53 0.09 (1%) (93%) (93%)
total CanadaTotal Crop Planted 11.74 12.38 0.65 (5% )IR 0.04 0.05 0.01 0.4 0.4HT 9.70 10.27 0.58 (6%) 89 89IR/HT 1.21 1.23 0.02 (2%) 11 11Product Quality (Alfalfa) <0.01Total Biotech Crop Planted 10.95 11.10 0.60 (5%) (93%) (93%)
table 8. Biotech Crop hectarage in Canada, 2016
Source: ISAAA, 2016

Global Status of Commercialized Biotech/GM Crops: 2016
26
total 7.97 million hectares in 2015. In 2016, the national adoption rate for biotech canola was 93% similar to 2015.
The Canadian Food Inspection Agency approved the cultivation of SU Canola™ in 2016. Cibus expects a full-commercial launch for the 2017 growing season so that farmers can have the option to use the non-GM technology rapid trait development system (RTDS) to control glyphosate tolerant weeds such as pigweed. Canada has a potential to increase planting canola to 26 million acres (10.5 million hectares) by 2020. Cibus is currently using the RTDS technology to introduce non- transgenic glyphosate tolerant flax in 2019, late blight resistant potato in 2020, as well as a herbicide tolerant rice (Germination, 6 July 2016).
The Canola Council of Canada, the first industry association in the country, continues to promote its 2025 Strategic Plan that sets industry targets; increased canola production to 26 MMT by 2025. This target is planned to be achieved through yield improvement of up to 52 bushels per acre, up from 40 bushels per acre in 2013/2014. Likewise, the Council sets export seed targets of 12 MMT by 2025, up 40% from 2013/2014 levels as well as to double domestic processing from 7.5 MMT to 14 MMT. Only about 15% of the Canadian canola crop is consumed in Canada in various forms. Some 85% of Canadian canola seed oil and meal are exported to the US, Japan, Mexico and China.
Benefits of planting biotech HT canola have been due to lower cost of production and cost of the technology. Thus, savings were due to reduced expenditure on herbicides and some savings in fuel and labor.
Some biotech canola events have improved oil content for the health-conscious public, such as high lauric acid canola (Laurical Canola™) Event 18 and Event 23 approved in 1996.
Biotech SoybeanBiotech herbicide tolerant soybean has been cultivated in Canada since 1997. In 2016, the total soybean planting in Ontario and Quebec was 2.2 million hectares, with biotech herbicide tolerant soybean at 2.08 million hectares at 94% adoption. Soybean planting in Canada increased through the years particularly in Quebec and Ontario because of new varieties developed for the Western Canadian climates. Increased farmer interest was mainly due to the resilience of the crop, its profitability, as well as high oilseed prices. In addition, soybean has a different disease profile than canola and wheat so it fits well in a crop rotation system.
Soybean events approved in Canada for improved product quality include: high oleic acid Event 260-05 (approved in 2000), DP305423 high oleic acid (2009), stacked DP305423x GTS40-3-2 (2009), Vistive Gold (2011), omega-3 fatty acid enriched MON 87769 (2011) and stacked high oleic acid in MON87705 x MON87708 x MON89788 (2015).
Biotech MaizeBiotech insect resistant (IR) maize has been grown commercially in Canada since 1996 and the herbicide tolerant (HT) maize since 1999. Throughout the 20 year period, biotech adoption has increased significantly and by 2016, the area of biotech maize was 1.5 million hectares of the total 1.62 million hectares planted in Ontario and Quebec. Biotech maize hectarage of 1.62 million is marginally higher than last year’s 1.57 million hectares and at 92% adoption (similar to last year’s 92%). Maize is consumed in Canada for livestock feed and ethanol production. Usage of maize for feed is forecast to increase in 2016/17 to reach 7.525 million metric tons. Ethanol usage is also expected to increase in response to more gasoline consumption resulting from lower gas prices. Biotech maize event LY038
Canada

Global Status of Commercialized Biotech/GM Crops: 2016
27
with improved amino acid lysine was approved in 2006.
Biotech Sugar beetBiotech RR®sugar beet was launched in 2008 and planting in 2016 was estimated at 8,000 hectares at virtually optimal adoption (100%). This was the 9th year of planting in Ontario in Eastern Canada, (with the beets transported and processed in the USA), and the 6th year of production in Taber, Alberta, Western Canada where they were also processed.
Biotech alfalfa On 26 April 2013, the Canadian Food Inspection Agency issued a press release confirming that it registered a variety of RR®alfalfa – this allows Gold Medal Seeds, a subsidiary of Forage Genetics International LLC to sell the seed of this variety commercially in Canada (USDA FAS-GAIN Agri-biotech Annual, Canada, 2015). However, no RR®alfalfa has been planted as yet. Instead, 809 hectares of HarvXtra™ alfalfa (with reduced lignin content) were planted in 2016, of the 445,000 hectares of total alfalfa for the first time in Canada. In March 2016, Forage Genetics announced that it will offer commercial seed sales of HarvXtra™ alfalfa with Roundup Ready® Technology to farmers in Eastern Canada, however, no planting was recorded as of this writing. Canadian regulatory agencies authorized planting of HarvXtra™ alfalfa with RR technology in December 2014 (Monsanto Canada, 29 March 2016).
New approvals of Biotech Crops
Non-browning Arctic® Apples The Canadian Food Inspection Agency (CFIA) and Health Canada approved the unconfined environmental release for commercial planting purposes, livestock feed and food use for apple (Malus domestica) Arctic® apple events
GD743 and GS784 which have been genetically engineered to be non-browning. The two approved varieties will be marketed under the name “Arctic®Granny” and “Arctic®Golden”. In 2016, the technology developers Okanagan Specialty Fruits planned to increase production levels in the US so that test market quantities would be available in late 2016 in Canada. The company also planned to expand biotech apple varieties such as “Arctic®Fuji” and “Arctic®Gala” in 2017. There is no planting yet of the Arctic® apples in Canada (USDA FAS GAIN Agribiotechnology Annual Canada 2016).
Four Innate™ Potato EventsThe Canadian Food Inspection Agency and Health Canada have approved the commercial use of four Innate™ potato events in March 2016. All four events were developed by J.R. Simplot and possess traits to improve the quality of the produce: reduced levels of reducing sugars, reduced acrylamide potential and black spot bruising tolerance. The approval decisions for the Innate potato varieties have arrived too late for the current growing season. It is expected that Canadian producers will be able to plant these varieties during the 2017 season. A second generation of the Innate™ potatoes that the Simplot company seeks approval for will be resistant to blight, a potato disease, therefore reducing the need for pesticides to prevent this disease (USDA FAS GAIN Agribiotechnology Annual Canada 2016).
AquAdvantage Salmon Health Canada approved AquAdvantage salmon for use in Canada as food on 19 May 2016. AquAdvantage salmon is an Atlantic salmon that contains a growth hormone gene from Chinook salmon. The biotech salmon grows faster and reaches market size quicker. According to the federal department the changes made to the salmon do not pose a greater risk to human health as currently available in the Canadian marketplace. The agency also concluded that the AquAdvantage salmon would have no
Canada

Global Status of Commercialized Biotech/GM Crops: 2016
28
impact on allergies, and the nutritional value is similar to other farmed salmon available for consumption.
On the same day, the Canadian Food Inspection Agency (CFIA) approved the genetically engineered salmon for use as animal feed. The CFIA has determined that feed ingredients derived from the AquAdvantage salmon do not present livestock feed safety or nutrition concerns when compared to feeds derived from salmon currently permitted to be used as livestock feed in Canada. In Canada, the AquAdvantage salmon is subject to the same commercialization and import requirements as unmodified salmon, including requirements emerging from the Feeds Act and Regulations and the Food and Drugs Act and Regulations.
Benefits of Biotech Crops in Canada
Canada is estimated to have enhanced farm income from biotech canola, maize and soybean by US$7.3 billion in the period 1996 to 2015 and the benefits for 2015 alone is estimated at US$933 million (Brookes and Barfoot, 2017, Forthcoming).
In summary, biotech crop planting in Canada increased in 2016 following increases in total area of canola, soybean, and maize. Canola Council of Canada actively pursues its Strategic Plan of producing 26 MMT canola by 2025 through yield improvement technologies. The increase in soybean area was due to its profitability and high oilseed prices. For maize, increased gasoline and ethanol consumption due to lower gas prices provided incentive for maize planting. Some consumer acceptance issues on sugar derived from biotech sugar beet could have negatively-affected maize planting. The introduction of low-lignin alfalfa on 800 hectares provided an opportunity for Canadian dairy farmers to benefit from the technology by reducing cost and increasing profit. Biotech
soybean with high oleic acid and biotech maize with high lysine content have been available in the Canadian market for health-conscious public. The average adoption of 93%, similar to the US, Brazil and Argentina means additional market growth towards new crops and traits such as the approval for commercialization of non-browning Arctic® apple, the four-traited Innate™ potatoes and new herbicide tolerant stacked soybean.
iNdia 2016 was the turning point for biotech in India as it transcended from the shadows of the moratorium on IR brinjal (eggplant) imposed in 2010 to the ultimate step of commercial release of biotech mustard in 2016. India has successfully completed the process of inviting public comments on biosafety dossier of biotech mustard seeking permission for environmental release of transgenic mustard hybrid DMH-11 and parental lines containing events bn 3.6 and modbs 2.99 expressing barnase, barstar and bar genes. Biotech mustard is the first genetically modified crop developed indigenously by the Centre for Genetic Manipulation of Crop Plants (CGMCP) of the University of Delhi. Approval of field trials of IR chickpea and IR pigeon pea developed by ICAR-Indian Institute of Pulses Research was another major development in 2016. India retained the title as the number one cotton producing country in the world with cotton production surpassing 35 million bales despite the slowed down global cotton market.
India, for the first time in 14 years of insect resistant (IR, Bt) cotton planting (since 2002), has recorded a drop in area planted by 0.8 million hectare, from 11.6 million hectares in 2015 to 10.8 million hectares in 2016 (Figure 4). The percentage adoption however increased to 96%, slightly higher than 95% adoption in 2015, distributed evenly among the ten major
Canada

Global Status of Commercialized Biotech/GM Crops: 2016
29
cotton growing states. It was estimated that around 7.2 million farmers planted IR cotton in 2016, slightly less than 7.7 million in 2015. The rapid adoption of IR cotton hybrids spurred the growth of cotton production to 39 million bales in 2014-15, down to 33.8 million in 2015 due to heavy infestation of the cotton leaf curl virus (CLCV) particularly in Northern cotton growing zones including Haryana and Punjab, and has again gained an upward trend in 2016 achieving the target of 35 million bales.
The cotton market is heavily dominated by India and China both on the production and consumption side. These countries produced and consumed over 55% of the total cottonseed oil made during the 2015-2016 period. This dominance is largely attributed to the large amount of cotton cultivation in the region and the high domestic demand for low-priced
figure 4. fifteen Years of adoption of iR (Bt) Cotton in india, 2002 to 2016
Source: Analyzed and compiled by ISAAA, 2016
Area
(Milli
on H
ecta
res)
% Adoption
Total Cotton AreaIR Cotton
% Adoption of IR Cotton
2
4
6
8
10
12
14
20
40
60
80
100
120
2002 2006 2011 2016
cooking oil. Thus, in the last fifteen years, 2002 to 2016, cottonseed has become an important source of oilseeds in India as the production of Bt cotton-based oil increased by three-fold from 0.46 million tons in 2002-03 to 1.50 million tons in 2016-17. Remarkably, Bt cottonseed oil contributed 1.5 million tons to the total production of ~8 million tons of edible oil from all domestic sources, including cotton oil which is equivalent to 15% of total edible oil production in the country in 2016-17.
In 2016, 7.2 million cotton farmers adopted IR cotton representing 96% of estimated 11.2 million hectares in India. In recent years, farmers increased the density of cotton planting particularly in irrigated and semi-irrigated conditions that led to substantial increases in cotton productivity per hectare across the states. The major states growing IR cotton in 2016 include Maharashtra, Gujarat, Andhra Pradesh and Telangana, Madhya Pradesh, Punjab, Haryana, Rajasthan, Karnataka, Tamil Nadu and Odisha. The high percentage of adoption of IR cotton by farmers across the different states reflects the importance of controlling the menace of the American bollworm complex, a group of deadly borer insects that caused heavy damage to cotton crop in the past. Evidently, the country achieved a near phasing out of single gene Bollgard-1 cotton hybrids, which has been almost replaced with dual gene Bollgard-II (BG-II™) cotton hybrids introduced in 2006. The double gene IR cotton hybrids provided additional protection to Spodoptera (a leaf eating tobacco caterpillar) while protecting cotton crop from American bollworm, pink bollworm and spotted bollworm. It was reported that double gene IR cotton farmers earned a higher profit through cost savings associated with fewer sprays for Spodoptera control as well as increasing yield by 8-10% over single gene IR cotton hybrids. Over the years, a large number of IR cotton hybrids (primarily G. hirsutum x G. hirsutum) suitable for different agro-climatic cotton zones spurred
India

Global Status of Commercialized Biotech/GM Crops: 2016
30
the adoption of IR cotton hybrid technology in India. In recent years, new IR cotton hybrids consisting of G. hirsutum x G. barbadense have been approved for cultivation. Notably, CICR has developed improved desi IR cotton varieties G. arboreum and G. herbaceum, which are being field tested under the high density planting system in India, and nearing commercial approval in the near future.
Streamlining indian Biosafety Regulatory System
The Genetic Engineering Appraisal Committee (GEAC), an apex regulatory body in India administered by the Ministry of Environment, Forests and Climate Change (MOEF&CC), met six times after a gap of many years. As a part of strengthening the biosafety regulatory system in India, the Genetic Engineering Appraisal Committee (GEAC) of MOEF&CC prepared and released a new guideline titled “Guidelines for the Environmental Risk Assessment of Genetically Engineered Plants, 2016” emphasizing the proper assessment of environmental effects. Underscoring the importance of environmental assessment, the GEAC has also released two additional documents “Environmental Risk Assessment of Genetically Engineered Plants: A Guide for Stakeholders” and “Risk Analysis Framework, 2016” that helps in understanding the concepts and data generation by the developers, and biosafety assessment by the regulatory bodies and experts. These documents were supported by the UNEP GEF Supported Phase-II Capacity Building Project on Biosafety implemented by the Ministry of Environment, Forests and Climate Change (MOEF&CC) of the Government of India.
In early 2016, the project has also released the manual on the “Monitoring of Confined field trials of Regulated Genetically Engineered (GE) Plants” with a view to strengthen the capacity of researchers, developers and regulators in conducting biotech crop field trials in a specific
manner. The manual covers three broad topics including risk assessment and management of confined field trials, guidelines for management of confined field trials and the monitors’ role in the management of risks from the confined field trials.
In addition, the MOEF&CC prepared a series of crop specific biology documents as a reference for developers, evaluators and regulators for biotech crops under regulatory review, as well as those new biotech crops and traits under development in the country. Crop specific biology documents were released in the last two-year period for Brassica juncea (Indian Mustard), Cajanus cajan (pigeonpea); Carica papaya (papaya); Cicer arietinum (chickpea); Hevea brasiliensis (rubber); Solanum lycopersicum (tomato); Solanum tuberosum (potato) and Sorghum bicolor (sorghum).
environmental release of biotech mustard
In January 2016, the GEAC constituted a Sub-Committee of scientific experts to thoroughly address each aspect of the dossier of biotech mustard, which was under consideration for permission for environmental release. The transgenic mustard hybrid DMH-11 and parental lines containing events bn 3.6 and modbs 2.99 with barnase, barstar and bar genes were developed by the Centre for Genetic Manipulation of Crop Plants (CGMCP) of the University of Delhi. Over the next 8 months, the Sub-Committee and the Department of Biotechnology’s (DBT) Biosafety Support Unit (BSU) deliberated on the biosafety dossier of biotech mustard, and prepared a comprehensive document “Assessment of Food and Environmental Safety (AFES)”. This was presented to the Genetic Engineering Appraisal Committee (GEAC) for consideration in its meeting held on 20 June 2016 (MOEF&CC, 2016a). The Report submitted to GEAC contains a thorough assessment of the biosafety data
India

Global Status of Commercialized Biotech/GM Crops: 2016
31
generated by the applicant, its comparison with such international assessment by well-known regulatory agencies such as the European Food Safety Authority (EFSA), Office of the Gene Technology Regulator (OGTR), and Canadian regulatory authorities, and existing scientific literature on the subject in the peer reviewed journals, as well as addressing the specific uses of mustard in Indian context.
The Sub-Committee was of the opinion that the biotech mustard is “as safe as conventional mustard” and “does not raise any public health or safety concerns for human beings and animal health.” The Sub-Committee concluded that the environmental release of parental lines for hybrid production DMH-11 “may not pose any risk to biodiversity and the agro-system”. In order to address the concern raised by anti-biotech activists, the GEAC also held a special meeting on 18 July 2016 to record their objection regarding the environmental release of transgenic mustard hybrid DMH-11 and parental lines. Subsequently, MOEF&CC, on the recommendation of the Genetic Engineering Appraisal Committee (GEAC), published the “assessment of food and environmental Safety (afeS)” report on the MOEF&CC website and made available a biotech biosafety dossier for review at MOEF&CC office for public comment from 5 September to 5 October 2016.
The MOEF&CC received over 750 comments from various stakeholders including students, farmers, researchers and other key stakeholders on the report by 5 October 2016 (MOEF&CC, 2016b). These public comments were sent to the Sub-Committee, which submitted their report on the public comments to MOEF&CC by the end of 2016. The GEAC of MOEF&CC is likely to review the final assessment of the biotech mustard dossier, including public comments and expected to take a final view on the permission for environmental release of transgenic mustard hybrid DMH-11 and parental lines some time
in 2017. Therefore, it is highly likely that the 6 million mustard farmers in India who suffer from very low yields in mustard (1000 kg per hectare) – one third of that in Canada, China and Australia will have access to high vigor biotech mustard hybrids in 2017.
Annually, mustard is cultivated on over 6.5-7 million hectares in the Rabi (winter) season predominately in Rajasthan, Haryana, Punjab and Madhya Pradesh. Ironically, mustard production and yields have remained stagnant for the past 20 years (Figure 5). Farmers continue to suffer from low yield, meagre farm income and loss of opportunity costs due to the denial of farm technologies.
Globally, a quarter of all the Brassica (mustard/canola) hectares on 8.6 million hectares (24% of total Brassica area of 36 million hectares) were genetically engineered varieties in 2016. Farmers in Australia, Canada and USA have been benefiting from biotech canola since 1996. Biotech improvement in Brassica have transformed canola production in Canada, and now constitutes a major export farm produce from Canada. India is a major importer of biotech canola (Canadian mustard) oil and biotech soybean oil and has been consuming biotech cotton oil produced domestically by cotton farmers for the past 15 years. India consumes approximately 5 million tons of edible biotech oil as cooking oil every year. Biotech Indian mustard oil would be no different from imported biotech canola (Canadian mustard) and biotech soybean oils. Canada, Australia and USA have approved multiple trait biotech canola allowing for more than 90% of their farmers to harness the yield potential through hybridization and deploying an efficient weed control system by adopting multiple mode of action weed control systems of glyphosate and glufosinate tolerance.
Biotech Indian mustard was developed by Delhi University South Campus and is India’s
India
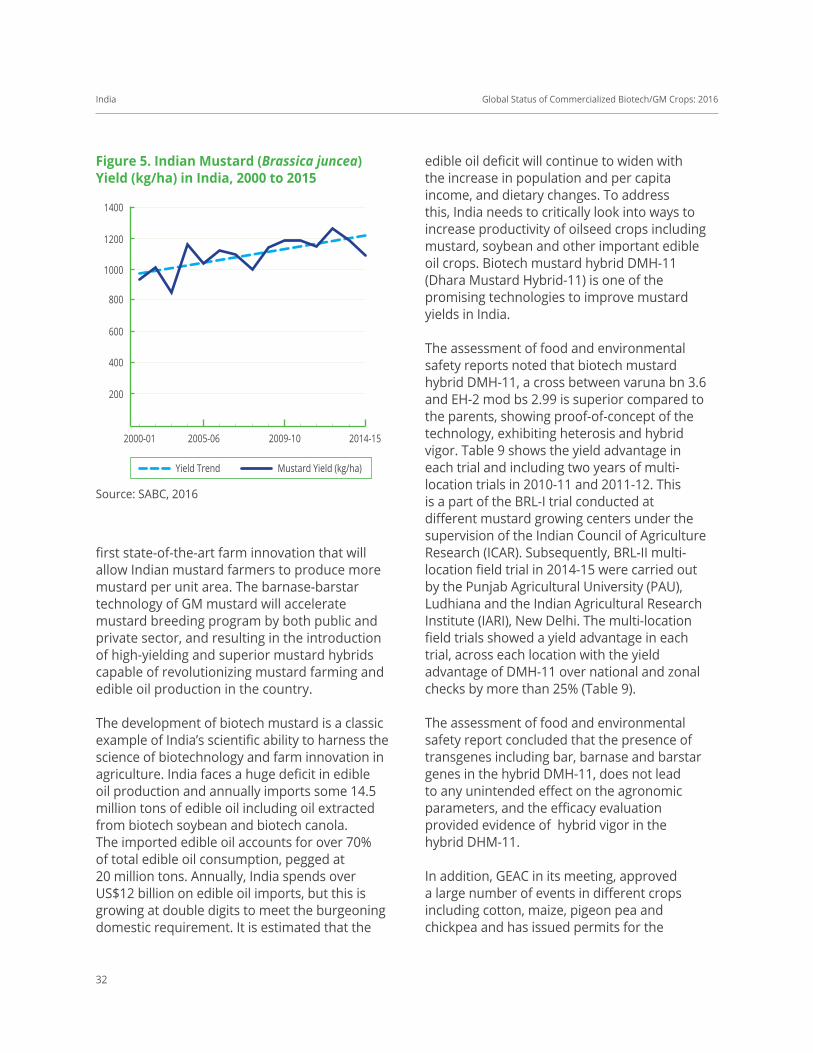
Global Status of Commercialized Biotech/GM Crops: 2016
32
edible oil deficit will continue to widen with the increase in population and per capita income, and dietary changes. To address this, India needs to critically look into ways to increase productivity of oilseed crops including mustard, soybean and other important edible oil crops. Biotech mustard hybrid DMH-11 (Dhara Mustard Hybrid-11) is one of the promising technologies to improve mustard yields in India.
The assessment of food and environmental safety reports noted that biotech mustard hybrid DMH-11, a cross between varuna bn 3.6 and EH-2 mod bs 2.99 is superior compared to the parents, showing proof-of-concept of the technology, exhibiting heterosis and hybrid vigor. Table 9 shows the yield advantage in each trial and including two years of multi-location trials in 2010-11 and 2011-12. This is a part of the BRL-I trial conducted at different mustard growing centers under the supervision of the Indian Council of Agriculture Research (ICAR). Subsequently, BRL-II multi-location field trial in 2014-15 were carried out by the Punjab Agricultural University (PAU), Ludhiana and the Indian Agricultural Research Institute (IARI), New Delhi. The multi-location field trials showed a yield advantage in each trial, across each location with the yield advantage of DMH-11 over national and zonal checks by more than 25% (Table 9).
The assessment of food and environmental safety report concluded that the presence of transgenes including bar, barnase and barstar genes in the hybrid DMH-11, does not lead to any unintended effect on the agronomic parameters, and the efficacy evaluation provided evidence of hybrid vigor in the hybrid DHM-11.
In addition, GEAC in its meeting, approved a large number of events in different crops including cotton, maize, pigeon pea and chickpea and has issued permits for the
first state-of-the-art farm innovation that will allow Indian mustard farmers to produce more mustard per unit area. The barnase-barstar technology of GM mustard will accelerate mustard breeding program by both public and private sector, and resulting in the introduction of high-yielding and superior mustard hybrids capable of revolutionizing mustard farming and edible oil production in the country.
The development of biotech mustard is a classic example of India’s scientific ability to harness the science of biotechnology and farm innovation in agriculture. India faces a huge deficit in edible oil production and annually imports some 14.5 million tons of edible oil including oil extracted from biotech soybean and biotech canola. The imported edible oil accounts for over 70% of total edible oil consumption, pegged at 20 million tons. Annually, India spends over US$12 billion on edible oil imports, but this is growing at double digits to meet the burgeoning domestic requirement. It is estimated that the
India
figure 5. indian Mustard (Brassica juncea) Yield (kg/ha) in india, 2000 to 2015
Source: SABC, 2016
200
400
600
800
1000
1200
1400
2000-01 2005-06 2009-10 2014-15
Yield Trend Mustard Yield (kg/ha)

Global Status of Commercialized Biotech/GM Crops: 2016
33
conduct of event selection trials and biosafety research trials in 2016 (Table 10).
Socio-economic Benefits and impact of iR cotton in india
The summary and key findings of 14 studies conducted by public institutes on the cost-benefits of IR cotton were included in previous ISAAA Briefs (26 to 51) released from 2002 to 2015. Readers are encouraged to refer to previous ISAAA briefs for more details about the socio-economic benefits of IR cotton in India from 2002 to 2015.
Estimates by Brookes and Barfoot (2017, Forthcoming) indicate that India has enhanced farm income from IR cotton by US$19.6 billion in the thirteen year period 2002 to 2015 and US$1.3 billion in 2015 alone).
In summary, a slight decrease (7%) in the biotech cotton planting was brought by a slight decrease in the total cotton planting (8%) in the
10 states of India. Adoption however increased from 95% to 96% indicative of acceptance by as many as 7.2 million farmers benefiting from the technology. Biosafety regulations in the country have been streamlined with revised guidelines on the monitoring of confined field trials of biotech crops. Biotech mustard expressing the barnase-barstar gene is under final review including public comments for environmental release in 2017. Mustard production and yields have remained stagnant for the past 20 years and it is hoped that the introduction of the biotech mustard can revive the mustard industry so it will be competitive with canola.
PaRaGuaY Paraguay has successfully grown biotech crops since 2004 starting with RR®soybean. In 2016, Paraguay grew 3.52 million hectares of biotech crops comprised of 3.21 million hectares soybean, 0.31 million hectares maize, and 0.010 million hectares cotton. This compares with 3.63 million hectares of biotech crops planted in
entry *MeanYield
2010-211
% Yieldincrease
over Checks
**Mean Yield
2011-12
% Yield increase
over Checks
***Mean Yield
2014-15
% Yieldincrease
over Checks
Varuna (Barnase) 2096 24 2291 32 1861 28EH-2 (Barnase) 2009 29 1611 88 1558 53Varuna 2093 24 2272 33 1887 26EH-2 1897 37 1741 74 1378 73RL1359 2037 28 2016 50 1776 34DMH-11 2600 – 3025 – 2386 –
table 9. Seed Yield (Kg/ha) of Biotech Mustard hybrid dMh-11 during BRl-i in 2010-11 and 2011-12
* Conducted in Kumber, Navgaon and Sriganganagar** Conducted in Kumber and Navgaon *** Conducted in Ludhiana, Bhatinda, and IARI
Source: MOEF&CC, 2016a; Analyzed by ISAAA, 2016
Paraguay
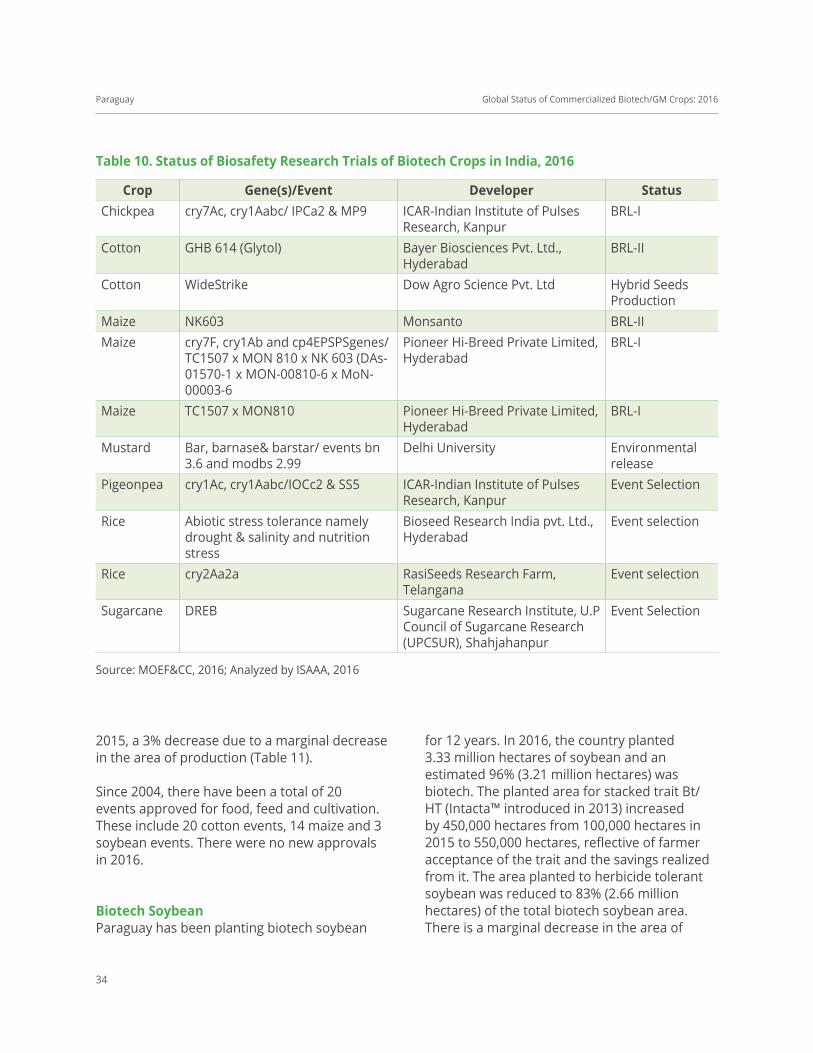
Global Status of Commercialized Biotech/GM Crops: 2016
34
Crop Gene(s)/event developer StatusChickpea cry7Ac, cry1Aabc/ IPCa2 & MP9 ICAR-Indian Institute of Pulses
Research, KanpurBRL-I
Cotton GHB 614 (Glytol) Bayer Biosciences Pvt. Ltd., Hyderabad
BRL-II
Cotton WideStrike Dow Agro Science Pvt. Ltd Hybrid Seeds Production
Maize NK603 Monsanto BRL-IIMaize cry7F, cry1Ab and cp4EPSPSgenes/
TC1507 x MON 810 x NK 603 (DAs-01570-1 x MON-00810-6 x MoN-00003-6
Pioneer Hi-Breed Private Limited, Hyderabad
BRL-I
Maize TC1507 x MON810 Pioneer Hi-Breed Private Limited, Hyderabad
BRL-I
Mustard Bar, barnase& barstar/ events bn 3.6 and modbs 2.99
Delhi University Environmental release
Pigeonpea cry1Ac, cry1Aabc/IOCc2 & SS5 ICAR-Indian Institute of Pulses Research, Kanpur
Event Selection
Rice Abiotic stress tolerance namely drought & salinity and nutrition stress
Bioseed Research India pvt. Ltd., Hyderabad
Event selection
Rice cry2Aa2a RasiSeeds Research Farm, Telangana
Event selection
Sugarcane DREB Sugarcane Research Institute, U.P Council of Sugarcane Research (UPCSUR), Shahjahanpur
Event Selection
table 10. Status of Biosafety Research trials of Biotech Crops in india, 2016
Source: MOEF&CC, 2016; Analyzed by ISAAA, 2016
2015, a 3% decrease due to a marginal decrease in the area of production (Table 11).
Since 2004, there have been a total of 20 events approved for food, feed and cultivation. These include 20 cotton events, 14 maize and 3 soybean events. There were no new approvals in 2016.
Biotech SoybeanParaguay has been planting biotech soybean
for 12 years. In 2016, the country planted 3.33 million hectares of soybean and an estimated 96% (3.21 million hectares) was biotech. The planted area for stacked trait Bt/HT (Intacta™ introduced in 2013) increased by 450,000 hectares from 100,000 hectares in 2015 to 550,000 hectares, reflective of farmer acceptance of the trait and the savings realized from it. The area planted to herbicide tolerant soybean was reduced to 83% (2.66 million hectares) of the total biotech soybean area. There is a marginal decrease in the area of
Paraguay

Global Status of Commercialized Biotech/GM Crops: 2016
35
Crops area (Million hectares)
Y/Y diff (%) trait Percentage and (adoption Rate)
2015 2016 2015 2016Soybean
Total Crop Planted 3.43 3.33 0.63 (18%)HT 3.21 2.66 –0.56 (–17%) 97 83IR/HT 0.10 0.55 0.45 (462%) 3 17Total Biotech Crop Planted 3.31 3.21 –0.10 (–3%) (96%) (96%)
MaizeTotal Crop Planted 0.70 0.71 0.01 (1%)IR 0.05 0.05 <0.01 (2%) 17 3HT 0.01 0.01 –<0.01 (–13%) 3 14IR/HT 0.24 0.25 <0.01 (1%) 80 83Total Biotech Crop Planted 0.31 0.31 0 (44%) (44%)
CottonTotal Crop Planted 0.012 0.010 –0.002 (–17%) –IR/HT 0.012 0.010
Total Biotech Crop Planted 0.012 0.010 0.013 (108%) (100%) (100%)total Paraguay
Total Crop Planted 4.15 4.05 0.095 (–2.3%) IR 0.05 0.06 0.01 (21%) 1 2HT 3.22 2.66 –0.56 (–17%) 89 75IR/HT 0.35 0.80 0.45 (128%) 10 23Total Biotech Crop Planted 3.63 3.52 –0.11 (–3%) (88%) (87%)
table 11. Biotech Crop area in Paraguay, 2016
Source: ISAAA, 2016
total soybean production as production area in the major soybean states of Itapua, Alto Parana, Catindeyu and Caaguazu have been maximized and there is some competition for maize area. Soybean adoption in Paraguay usually ranges from 94 to 96%.
Domestic consumption of soybeans and its by-products is minimal in the country, and used largely for pork and poultry industries.
Most of the soybean produce is exported to the EU, Russia, Brazil, Turkey, Mexico, Israel and Peru.
Biotech MaizeBiotech insect resistant maize was first commercialized in 2013 in Paraguay at 550,000 hectares. Total biotech maize plantings in 2016 were 0.31 million hectares, similar to 2015 and
Paraguay

Global Status of Commercialized Biotech/GM Crops: 2016
36
comprised of 0.05 million hectares IR, 0.01 million hectares HT and 0.25 million hectares IR/HT maize. Paraguay is enjoying the same environmental and social benefits that its neighbors Argentina and Brazil receive from IR and herbicide tolerant maize, as well as from the stacked products for many years. Adoption of biotech maize was 44%, similar to 2015.
Maize is planted throughout Paraguay, in the areas of Alto Parana, Itapua, and Canindeyu, representing 80% of maize production. Most farmers use the no-till drill technology, good volumes of fertilizers and biotech seeds. Domestic maize consumption was found to be higher than the previous year, which is estimated to increase with the expansion of the pork industry. Maize prices are relatively higher due to demand from Brazil and Chile, the main export markets.
Biotech Cotton Paraguay approved IR cotton for commercial production in 2011. In 2013, the IR/HT cotton was approved for planting and by 2016, 10,000 hectares of cotton were planted, 100% of which was IR/HT. This is compared to 12,000 hectares planted in 2015. Paraguay will benefit from biotech cotton also being successfully grown in the neighboring countries of Argentina and Brazil.
Benefits from Biotech Crops in Paraguay
Paraguay is estimated to have enhanced farm income from biotech soybean by US$1.2 billion in the period 2004 to 2015 and the benefits for 2015 alone is estimated at US$117 million (Brookes and Barfoot, 2017, Forthcoming). In summary, adoption rates of biotech crops in Paraguay was slightly reduced by 2% due to a marginal decrease in the area of crop production, particularly soybean which has
some competition with maize plantings. An increase in the total maize area was observed due to the expansion of the pork industry. This is likely to continue in the next few years because maize prices will be relatively higher due to demand from Brazil and Chile. Biotech maize adoption may also increase consequently.
PaKiStaN Pakistan achieved optimal adoption of insect resistant IR (Bt) cotton varieties with adoption reaching 2.9 million hectares equivalent to 97% of the total 3 million hectares of cotton (Table 12). Approximately ~725,000 smallholder cotton farmers continued to grow IR cotton varieties in 2016, which was the seventh year of commercial planting since 2010. The adoption rate of IR cotton increased by an average of 4%, from 75% in 2010 to 97% in 2016. This is indicative of farmer satisfaction with Bt technology that may be replicated with the upcoming adoption of biotech maize in the country.
The Federal National Biosafety Committee (FNBC) of the Ministry of Climate Change
Paraguay
Year adoption of iR
Cotton (Mha)
total Cotton (Mha)
% adoption
2010-11 2.40 3.10 75%2011-12 2.60 3.20 81%2012-13 2.80 3.40 82%2013-14 2.80 3.20 86%2014-15 2.85 3.20 88%2015-16 2.90 3.12 93%2016-17 2.90 3.00 97%
table 12. adoption of iR Cotton in Pakistan, 2010 to 2016
Source: Analyzed and Compiled by ISAAA, 2016

Global Status of Commercialized Biotech/GM Crops: 2016
37
(MOCC) met in 2016 (the last one was 2014), to consider 119 applications which had pending approvals for import, field trials and commercial release in the country. The 13th and 14th meetings of the FNBC held back to back in February and April 2016, resulted in approvals for 32 single Bt cotton varieties: 20 varieties expressing MON531 event (deregulated in 2010), 12 new varieties with the same event; and two new varieties with pyramided Bt genes called CEMB-2 event, for a total of 34 varieties (Tables 13 and 14). Cotton event CEMB-2 was developed by the Centre of Excellence in Molecular Biology (CEMB) of the University of the Punjab, Pakistan and contain Bt genes cry1Ac and cry2A gene, which obtained commercial approval from the provincial Punjab Seeds Council (PSC) between 2010 and 2016.
The official approval of old and new IR (Bt) cotton varieties by the FNBC will ensure supply of genuine good quality IR cotton seeds that meet minimum specifications including resistance to cotton leaf curl virus (CLCV), well-adapted to the different ecologies, possess required fiber quality standards, and other desirable features. In the recent past, the supply of substandard and spurious IR cotton varieties and the continued reliance on old IR cotton technology has not yielded desirable cotton output. The threat of bollworms, especially pink bollworms were growing due to farmers’ reluctance for timely insecticide applications (USDA FAS GAIN Agribiotechnology Pakistan, 2016). The cotton yield gains remained low due to repeated infestation of sap-sucking pests such as white fly and leaf hoppers spreading the CLCV in the absence of control measures. Despite these, IR cotton has proliferated in cotton growing provinces of Punjab, Sindh, Baluchistan and Khyber Pakhtunkhwa, and occupied almost the entire cotton crop hectarage in Pakistan.
Unencumbered by policy and regulatory hurdles, Pakistan made significant strides on
the approval of genetically modified crops in 2016. For the first time NBC officially approved the commercial cultivation of single and stacked insect resistant and herbicide tolerant IR/HT maize events developed by DuPont Pioneer and Monsanto Pakistan, subject to varietal registration by the Federal Seed Certification and Registration Committee, Ministry of
Pakistan
variety (*hybrid)
developer
MNH-886 and VH-259
Central Cotton Research Institution (CCRI), Multan
FH-114 and CIM-599
Cotton Research Institute, AARI, Faisalabad
CIM-598 and BH-178
Central Cotton Research Institution (CCRI), Multan
TARZAN-1 Four Brothers Seeds Corporation Pakistan Pvt. Ltd.
SITARA-009 Sitara Seed CompanyNIBGE-3 and NIBGE-901
NIBGE, Faisalabad
FH-118 College of Agri & Environmental Sciences, Islamia University, Bahawalpur
FH-142 CEMB, University of the Punjab, Lahore
CIM-602 Nuclear Institute for Agricultural Biology (NIAB), Faisalabad
NIAB-824 Auriga Seed, LahoreIUB-222 Agri Farm Service, MultanSAYBAN-201 and KZ-181
Kanzo Quality Seeds, Lahore
Sitara-11M 1Four Brothers Seeds, MultanA-555 Ali Akbar Seeds, LahoreTarzan-2 Four Brothers Seeds
table 13. iR (Bt) Cotton varieties (20) with MoN531 event approved by PSC, 2010 to 2016
Source: PSC/NBC/PCCC, Compiled by ISAAA, 2016

Global Status of Commercialized Biotech/GM Crops: 2016
38
National Food Security and Research. The commercial authorization of one HT and three IR/HT maize events developed by these companies will spur tremendous growth of adoption of biotech maize and will drive adoption of maize hybridization in the country (Table 15).
In 2016, Pakistan planted over 1.2 million hectares of maize, roughly producing around
5 million tons of maize. Most maize is planted in two provinces of Pakistan including some 50% or 0.6 million hectares planted in the province of Khyber-Pakhtunkhwa (KP) followed by 45% of total maize in Punjab province. Notably, the area and production of maize has increased substantially in the last decade. Figure 6 demonstrates the growth of maize area and production in Pakistan from 1960 to 2016 due to large scale adoption of hybrid maize. Adoption of hybrid maize reached 90% of total maize area in Punjab province while adoption in Khyber-Pakhtunkhwa (KP) reached 10-15% in 2016. Industry sources estimate that in Punjab alone the large scale adoption of maize hybrids has increased maize yield from 2,800 to 3,000 kilograms per acre on average, to 800-1,200 kilograms per acre. It is expected that the approval of four events of IR/HT maize will spur adoption in the remaining maize area of Khyber-Pakhtunkhwa and the Punjab province. Similarly, it is estimated that the rapid adoption of IR/HT maize in Pakistan beginning 2017 will deliver around US$1 billion additional benefits to farmers in the next 10 year-period.
Pakistan
variety (*hybrid) with
cry1Ac gene(MoN531
event)
developer
VH-305, FH-Lalazar, and BH-184
Cotton Research Institute, Faisalabad
MNH-988 Cotton Research Station, MultanSayaban-202 Auriga Seed Corporation, LahoreLeader-1 Suncrop Pesticides, MultanBS-52 and SILKEE
HI SELL Seed Industry, Multan
AGC-999 and AGC-777
M/s Weal AG Corporation, Multan
IUB-13 and MM-58
Islamia University, Bahawalpur
variety (*hybrid)
cry1Ac and cry2A gene
(CeMB-2 event)
developer
CEMB-33 CEMB, University of the Punjab, Lahore
CA-12 M/s Ali Akbar Seeds Pakistan, Lahore
table 14. New iR (Bt) Cotton varieties approved by PSC in 2016
Source: PSC/NBC/PCCC, Compiled by ISAAA, 2016
Gene(s)/event
traits developer
MON 89034 x NK603
Insect Resistant and Herbicide Tolerant
Monsanto Pakistan
NK603 Herbicide Tolerant
Monsanto Pakistan
TC1507 x MON810 x NK603
Insect Resistant and Herbicide Tolerant
Dupont Pioneer Pakistan
TC1507 x NK603
Insect Resistant and Herbicide Tolerant
Dupont Pioneer Pakistan
table 15. Commercial Release of iR/ht Maize events in Pakistan, 2016
Source: PSC/NBC/PCCC, Compiled by ISAAA, 2016

Global Status of Commercialized Biotech/GM Crops: 2016
39
Pursuant to the 18th Amendment to the Constitution (18th Amendment) Act, 2010 which devolved many federal subjects including environment to the Provinces in April 2010, the National Biosafety Committee (NBC) remains an ad hoc project of the Environmental Protection Agency (EPA) of the Ministry of Climate Change (MOCC). With the devolution of power, the MOCC has yet to make significant progress on whether biosafety shall be regulated by the federal agency or each province shall establish a provincial biosafety committee to accord approval for field testing and commercial release of many GM crops pending approval in Pakistan. Meanwhile, at the federal level, the Government of Pakistan has enacted crucial laws including the Seed (Amendment) Act in 2015 and the Plant Breeders Rights Act in 2016.
The Seed (Amendment) Act 2015 clearly defines the scope of regulation of genetically
modified plant varieties. The Federal Seed Certification and Registration Department (FSC&RD) is authorized to register a GM crop variety provided that the applicant declares the absence of terminator gene technology, a clearance certificate from NBC set up by “Federal Government”, and performance trials data for two years (Ali, 2015; The Gazette of Pakistan, 2015). In 2016, the enactment of Plant Breeders’ Rights Act, 2016 shall encourage the development of new plant varieties and to protect the rights of breeders of new varieties. This Act encouraged plant breeders and seed organizations of both public and private sector to invest in research and plant breeding, develop superior varieties of vegetables and ornamental crops, facilitate access to protect foreign varieties, and support new technologies including next generation stacked insect and herbicide tolerant cotton and maize varieties in the country (Sher, 2016).
Pakistan
figure 6. trend in area and Productivity of Maize in Pakistan, 1960 to 2016
Source: USDA, 2016 and Pakistan Bureau of Statistics, 2016; analyzed by ISAAA, 2016
Maize Area (Mha) Maize Production (Mtons)
2.0
3.0
4.0
5.0
6.0
2016201020001960 1970 1980 1990
1.0
Global Status of Commercialized Biotech/GM Crops: 2016
40
In addition, both the federal and provincial governments laid a greater emphasis on the supply of quality IR cotton seeds to farmers, and directed the suppliers of IR cotton seeds to ensure marketing of 100% certified seeds only. The textile ministry has accorded highest priority to develop seed varieties that could withstand the impact of climate change. To curb the supply of sub-standard and spurious seeds, the textile ministry has approached the NBC to start a monitoring programme for IR cotton varieties and their gene expression. A massive program was devised in 2016 to educate farmers by organizing seminars, field trips and workshops in cotton-growing areas infested with pink bollworm (Muhammad, 2016).
In 2016, the International Cotton Advisory Committee (ICAC) held its 75th plenary meeting in Pakistan and recognized that biotech cotton benefited farmers by reducing the need for insecticide applications and positively impacted yields without raising the costs of fertilizers and agronomic operations. However, the pink bollworm has developed resistance to the earlier insect-resistant biotech varieties in some countries including Pakistan. ICAC expected that the new generation of biotech cotton resistant to whitefly, which is at advanced stages of development, will bring big relief to growers. Likewise, ICAC called for the early deployment of transgenic cotton resistant to the cotton leaf curl disease in many countries especially in India and Pakistan (ICAC, 2016).
In 2016, the International Food Policy Research Institute (IFPRI) released a discussion paper “Varietal integrity, damage abatement, and productivity: Evidence from the cultivation of Bt cotton in Pakistan”. The paper revealed that the effectiveness of the Bt toxin, which depends on many technical constraints, is heterogeneous, and in many cases demonstrates that varieties sold as Bt in Pakistan may not contain the genes or express them effectively. The study reinforced the need for the supply of quality
Bt cotton seeds and, introduction of new generation Bt cotton technologies to overcome yield fatigue. The study also indicated the need for more effective monitoring systems for Bt cotton in Pakistan, and implied a significant improvement in the functioning of Pakistan’s regulatory system governing both GM crops and supply of quality seeds (Ma, 2016). Notably, a study by Kouser et al. (2016) on “Bt cotton and employment effects for female agricultural laborers in Pakistan” reported that Bt technology can contribute to additional employment income for the poor and to more equitable rural development. Broadening the gain of Bt cotton to society particularly to cotton pickers, the study estimated that Bt adoption has increased the demand for hired labor by 55%, and estimated to have generated a significant economic benefits to landless laborers particularly women, who often belong to the most disadvantaged groups of rural societies.
Similarly, a joint research study “Biosafety assessment of transgenic Bt cotton on model animals” conducted by the Centre of Excellence in Molecular Biology, University of Punjab and the Department of Botany, Lahore College for Woman University, Lahore, Pakistan to see the effect of Bt on two different groups of earthworms observed “no lethal effects of transgenic Bt protein on the survival of earthworm and rats.” The study confirmed “the absence of Cry1ac protein in blood and urine samples of rats, which were fed with Bt protein in their diet.” Furthermore, the histological studies showed “no difference in cellular architecture in liver, heart, kidney and intestine of Bt and non-Bt diet fed rats”. The research study confirmed the safety of Bt technology and therefore it will be helpful in successful deployment and commercial release of genetically modified crop in Pakistan (Shahid, 2016).
Pakistan
Global Status of Commercialized Biotech/GM Crops: 2016
41
On the socio-economic side, it is estimated that the economic gains from biotech crops for Pakistan for the period 2010 to 2015 was US$4.3 billion and US$398 million for 2015 alone (Brookes and Barfoot, 2017, Forthcoming).
In summary, biotech hectarage in Pakistan was similar to the previous year but the adoption rate increased even if the total cotton hectarage planted decreased. This is indicative of farmer satisfaction on Bt technology that can be replicated in the upcoming adoption of biotech maize in the country. A total of 34 varieties of cotton were approved by the Federal National Biosafety Committee providing more options for farmers in planting insect resistant biotech cotton. The committee has also approved the commercial release of four biotech maize events with stacked IR and HT. This is expected to spur growth of adoption of biotech maize and will drive adoption of maize hybrids in the country.
ChiNa Similar to the USA, Argentina and Canada, China is a member of the group of six “founder biotech crop countries”, having first commercialized biotech crops in 1996, the first year of global commercialization. China has been one of the leaders in planting IR (Bt) cotton since 1997, as well as a small hectarage of biotech papaya, poplar and other vegetables. In 2016, IR cotton was planted on ~2.8 million hectares, virus resistant papaya on 8,550 hectares and some 543 hectares IR (Bt) poplar trees (Table 1 and Table 13).
China has approved 60 biotech crop events for food and feed use and cultivation since 1994 including Argentine canola (12 events), cotton (10), maize (17), papaya (1), petunia (1), poplar (2), rice (2), soybean (10), sugar beet (1), sweet pepper (1) and tomato (3).
iR (Bt) Cotton The national area planted to cotton in China in 2016 was 2.92 million hectares compared to 3.8 million hectares in 2015. Consistent with several other cotton growing countries including the US, the decrease in national cotton hectares in China was attributed to low cotton prices and high reserve stocks since 2015. This led to a decrease in total hectares of cotton planted, as well as the biotech cotton area. The adoption rate of biotech cotton planting also decreased from 96% in 2015 to 95% in 2016. After IR cotton was introduced in the market in 1996, the area of IR cotton increased more than 12 times from 0.26 million ha in 1998 to 3.8 million hectares in 2015. IR cotton adoption in China was further recorded from 68% in 2008 and 2009, 69% (2010), 71.5% (2011), 80% (2012), 90% (2013), 93% (2014), 96% (2015) and 95% (2016).
virus Resistant PapayaPRSV resistant papaya was planted on 8,550 hectares in 2016 compared to 7,000 hectares in 2015, a 22% increase (Personal Communication, Prof. Li, South China Agricultural University). This increase came after a slight decline in planting in 2015 due to an oversupply of papaya. The virus resistant papaya is planted mainly in Guangdong, and some smaller areas in Hainan Island where planting started in 2012. The technology developed by South China Agricultural University features the viral replicase gene that made it highly resistant to all the local strains of PRSV. In September 2006, China’s National Biosafety Committee recommended its approval and commercialization in the country – a significant development for a fruit/food crop widely consumed in the country.
Biotech insect Resistant PoplarIR (Bt) poplar has been cultivated since 2003, according to the latest information available. From 2013 to 2016, a total of 543 hectares were planted in China. This helps supply the
China

Global Status of Commercialized Biotech/GM Crops: 2016
42
estimated 330-340 million cubic meters of timber that China needs annually. GM/biotech poplars were developed by the Research Institute of Forestry in Beijing, which is part of the Chinese Academy of Forestry.
The transgenic poplar plantations have effectively inhibited the fast-spread of target insect pests and have significantly reduced the number of insecticide applications required. The performance of the IR black poplar plantations is significantly better than the clones deployed locally. The availability of commercial IR poplar plantations has made it possible to empirically assess gene flow via pollen and seeds, and also
for assessing the impact of IR poplar on the insect community when intercropping with IR cotton.
Benefits from Biotech Crops in China
Benefits from IR cotton include higher yields and significant cost savings on insecticide application, as well as on labour use in spray application. It is estimated that China has enhanced its farm income from biotech cotton by US$18.6 billion in the period 1997 to 2015 and by US$1.0 billion in 2015 alone (Brookes and Barfoot, 2017, Forthcoming).
China
Crops area (Million hectares)
Y/Y diff (%) trait Percentage and (adoption Rate)
2015 2016 2015 2016Cotton
Total Crop Planted 3.80 2.92 -0.88 (-23%)IR 3.65 2.78 -0.87 (-24%) 94 94Total Biotech Crop Planted 3.65 2.78 -0.87 (-24%) (96%) (95%)
PapayaTotal Crop Planted 0.008 0.010 0.002 (19%)Virus Resistant 0.007 0.009 0.002 (22%) 100 100Total Biotech Crop Planted 0.007 0.009 0.002 (22%) (87.5%) (90%)
PoplarTotal Crop Planted <0.01 <0.01 0 IR <0.01 <0.01 0 100 100Total Biotech Crop Planted <0.01 <0.01 0 (100%) (100%)
total ChinaTotal Crop Planted 3.81 2.93 -0.88 (-23%) IR 3.65 2.78 -0.87 (-24%) 100% 100%Virus Resistance <0.01 <0.01 0Total Biotech Crop Planted 3.65 2.79 -0.87 (-24%) (96%) (95%)
table 16. Biotech Crop hectarages in China, 2016
Source: ISAAA, 2016

Global Status of Commercialized Biotech/GM Crops: 2016
43
Based on studies conducted by the Center for Chinese Agricultural Policy (CCAP), on average, at the farm level, IR cotton increases yield by 10%, reduces insecticide use by 60%, with positive implications for both the environment and farmers’ health, and generates a substantial US$220 per hectare increase in income which makes a significant contribution to their livelihood as the income of many cotton farmers can be as low as around US$1 per day (Jikun Huang, 2008, Personal Communication). At the national level, it is estimated that increased income from IR cotton was approximately US$1 billion per year in 2011.
An important paper in Science (Wu et al. 2008) suggested that the potential number of small farmers actually benefiting indirectly from IR cotton in China might be as high as an additional 10 million. A paper by Hutchison (2010) based on studies in the USA draws similar conclusions as Wu et al. (2008) that the indirect benefits for conventional crops grown in the same area where biotech crops are deployed are actually greater than the direct benefits from biotech crops.
A study by the Beijing Institute of Technology (Zhang et al, 2016) revealed that adoption of biotech crops in China could improve the health of Chinese farmers. The study claims that biotech crops not only increase glyphosate use, but also reduce the use of non-glyphosate herbicides, while adoption of biotech insect resistant crops significantly reduce insecticide use. The study was aimed to associate the uses of different pesticides related to biotech crops with the health condition of Chinese farmers. The pesticides used by these farmers were recorded and classified as glyphosate herbicides, non-glyphosate herbicides, chemical lepidopteran insecticides, biological lepidopteran insecticides, non-lepidopteran insecticides and fungicides.
The team’s analysis revealed that none of the examined health indicators were associated with glyphosate. However, the use of non-glyphosate herbicides was found to induce renal dysfunction. The use of chemical lepidopteran insecticides on the other hand could be associated with hepatic dysfunction, inflammation, and severe nerve damage. The results of this study indicate that adoption of biotech crops will cause the replacement of other herbicides with glyphosate, which may actually benefit farmer health in China and around the world, and has positive implications for biotech crops (CBU, 19 October 2016).
Potato, the fourth Staple food in China
China is the largest producer of potatoes in the world at more than 95.6 million tonnes annually (FAOSTAT, 2014). In 2015, the country announced its intention to double its potato hectarage and designate potato as its fourth food staple following rice, maize and wheat (FFTC Agricultural Platform, 2017). Compared with the other staple foods, potato has the advantages of easy storage, high yield, low planting requirement, wide planting area, high nutritive value and does not require complicated farm machinery in cultivation. Potatoes provide more calories, vitamins, and nutrients per area than other staple crops. In addition, the crop is also being considered for industrial uses as a source of starch. Currently, potato is cultivated on 5.6 million hectares which is projected to increase to 7 million hectares in 2020. Potato has been the focus of research and development in China since 2013, increasing its scientific research and innovation to address varietal improvement for yield, disease resistance, nutrition and starch content. This focus on potato is timely with the commercialization in the US of the first generation Innate™ potato which has lower
China
Global Status of Commercialized Biotech/GM Crops: 2016
44
levels of acrylamide, and less wastage due to bruising. These first generation potatoes were improved to include two additional traits: the late blight resistance and lowered reducing sugars. With the four traits in biotech potato, its adoption will surely contribute to the food and agriculture transformation in China for food security, healthy eating habits, and motivate farmers to utilize innovative technologies.
Support for Biotech Crops in China
Some observers speculate that home-grown biotech maize (Bt or phytase maize) will be commercialized in the next three years opening up an enormous potential market of 35 million hectares of maize. Biotech crops could help China become less dependent on increasing imports of soybean and maize, over 90% of which are biotech. In 2016/17, 85 million tons of soybean and 3.17 million tons of maize were imported from the USA to support domestic feed demand (USDA FAS GAIN Agribiotechnology China, 2016).
Since 2015, President Xi Jing has been actively supporting “strong research and innovation” on biotech crops. The government funded a major biotech research program with at least US$3 billion to research institutes and domestic companies to develop home-grown disease and drought resistant wheat, disease resistant rice, drought resistant maize and soybeans that produce more oil. There were also research conducted on GM peanuts. This government push is also reflected in the government-owned corporation ChemChina’s US$44 billion bid for Switzerland’s Syngenta. Once this landmark ChemChina bid becomes successful, this will have provided ChemChina with immediate access to a large portfolio of ready-made commercial GM crop products.
One of the noteworthy features of crop biotechnology in China is the emergence of
private seed companies, which conduct R&D in crop biotechnology, and develop and distribute both conventional and biotech hybrid seed. One such company is Origin Agritech Limited, which is based in Beijing, and trades on the NASDAQ in the US as SEED – it is China’s lead, vertically integrated biotech seed company. On 22 September 2010, Origin announced that it had reached an agreement with the Institute of Plant Protection of the Chinese Academy of Agricultural Sciences (CAAS) for the worldwide exclusive rights of the Bt gene developed by the Academy. Origin already had the rights to use the Bt gene in China, but under the new agreement, Origin has the right to sublicense the Bt gene and/or to improve its performance (Business Wire, 22 September 2010).
Origin was founded in 1997 and conducts R&D to produce conventional and biotech hybrid seed, of which conventional maize is currently the principal commercial crop. Origin operates in China and South East Asia and has a large network of 3,800 primary distributors and 65,000 secondary distributors. Origin prepares financial statements according to the US GAAP accounting procedures. For the third quarter, 1 April to 30 June 2010, revenues were approximately US$68 million with a gross profit of US$28 million (Business Wire, 30 August 2010). Origin had also acquired the rights to phytase maize from CAAS and this product was approved for biosafety by China on 27 November 2009 (Origin Agritech, 2009). The potential phytase maize market worldwide is estimated at US$500 million per year, of which US$200 million is in China alone.
Recently, the Chinese biotech seed firm announced it has planted genetically modified maize seeds in the US at a greenhouse designated by the USDA. The testing involves around insect resistance and herbicide tolerance technologies that were developed in China (Yorkton This Week, 2016).
China

Global Status of Commercialized Biotech/GM Crops: 2016
45
The recent banning of biotech crops in Heilongjiang province was met with criticism from academics and the government. According to Financial Times, experts told state media that the ban was out of step with government efforts to gradually increase the use of GM crops. An agricultural researcher at Beijing-based consultancy China Policy opined that Heilongjiang is particularly important for gaining trust because they would like to protect its advantage as a producer of non-GMO soybean for domestic and international markets. The ban was mainly to protect local produce with comparative advantage in response to increasing imports from the US and other countries (Financial Times, 21 December 2016)
In summary, total cotton planting in China decreased by 870,000 hectares due to high reserve stocks and low global cotton prices. This resulted in a reduction of IR cotton planting by 24%. There were also continuous small scale plantings of biotech papaya and poplar. Biotech crop prospects in the country rest on the expansion of biotech cotton plantings as the price of cotton stabilizes. Phytase maize and IR (Bt) rice have been in the pipeline awaiting government approval for planting in the last four years. It is also apparent that with China’s increasing need for poultry and livestock feeds, biotech maize maybe commercialized in the very near future. The government is committed to make China a strong biotech country disbursing funds for research and capacity building as well as the pending acquisition of Syngenta by ChemChina to strengthen its portfolio of biotech crops.
South afRiCa South Africa planted its first biotech crops in 1998 with insect resistant cotton; insect resistant maize and herbicide tolerant soybean were planted in 2001 and herbicide tolerant maize in 2003. In 2016, the country planted 2.66
million hectares of biotech crops comprised of maize (2.16 million hectares), soybean (494,000 hectares), and cotton (9,000 hectares) – a 16% increase from the reported biotech crop area of 2.29 million hectares in 2015. Average biotech crop adoption increased marginally at 91% in 2016. The total area planted to maize, soybean and cotton was 2.93 million hectares, a 15% increase from the last report in 2015 (Table 17).
The El Niño weather pattern persisted from 2015 through to November 2016, seriously damaging all agricultural sectors, water resources, grazing for livestock, and raised food prices. A La Niña pattern developed later during December with good rainfall in most parts of the country, except the far western provinces. Promising outcomes include increased late planting of food crops and expected higher crop yields per hectare.
Since 1998, the 70 events approved for planting in South Africa include 5 Argentine canola events, 10 for cotton, 42 for maize, 1 rice event (for food), and 12 soybean events.
Biotech Maize Maize is the main field crop in South Africa and is used for both human consumption (mainly white maize) and animal feed (mainly yellow maize). Biotech maize was planted on 2.16 million hectares at an adoption level of 90%, 22% higher than 2015. This hectarage comprised of 19.5% (420,000 hectares) insect tolerant, 18.9% (407,000 hectares) herbicide tolerant and 61.7% (1.33 million hectares) of stacked IR/HT. Biotech white maize was planted on 52% (1.123 million hectares) of the total biotech maize, with yellow maize at 48% (Table 18).
Maize is the most critical staple food in South Africa and the South African Development Community (SADC) region. The severe drought also hit food production very hard in these
South Africa
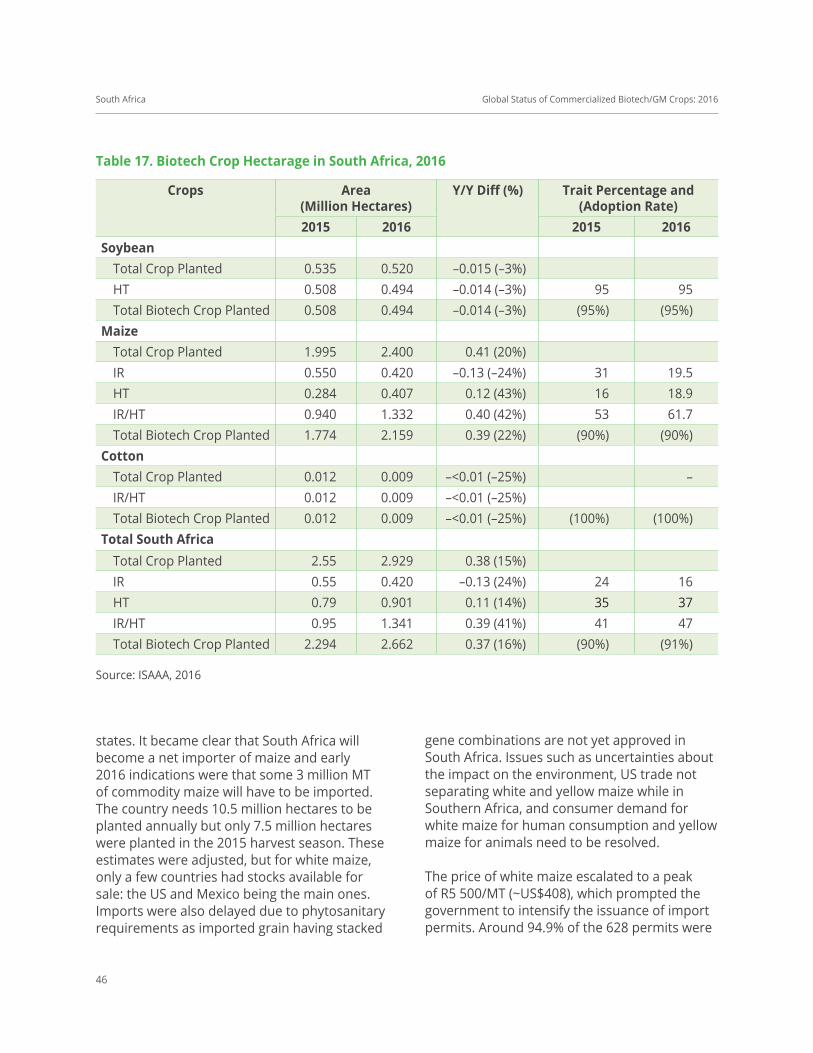
Global Status of Commercialized Biotech/GM Crops: 2016
46
Crops area (Million hectares)
Y/Y diff (%) trait Percentage and (adoption Rate)
2015 2016 2015 2016Soybean
Total Crop Planted 0.535 0.520 –0.015 (–3%)HT 0.508 0.494 –0.014 (–3%) 95 95Total Biotech Crop Planted 0.508 0.494 –0.014 (–3%) (95%) (95%)
MaizeTotal Crop Planted 1.995 2.400 0.41 (20%)IR 0.550 0.420 –0.13 (–24%) 31 19.5HT 0.284 0.407 0.12 (43%) 16 18.9IR/HT 0.940 1.332 0.40 (42%) 53 61.7Total Biotech Crop Planted 1.774 2.159 0.39 (22%) (90%) (90%)
CottonTotal Crop Planted 0.012 0.009 –<0.01 (–25%) –IR/HT 0.012 0.009 –<0.01 (–25%) Total Biotech Crop Planted 0.012 0.009 –<0.01 (–25%) (100%) (100%)
total South africaTotal Crop Planted 2.55 2.929 0.38 (15%) IR 0.55 0.420 –0.13 (24%) 24 16HT 0.79 0.901 0.11 (14%) 35 37IR/HT 0.95 1.341 0.39 (41%) 41 47Total Biotech Crop Planted 2.294 2.662 0.37 (16%) (90%) (91%)
table 17. Biotech Crop hectarage in South africa, 2016
Source: ISAAA, 2016
states. It became clear that South Africa will become a net importer of maize and early 2016 indications were that some 3 million MT of commodity maize will have to be imported. The country needs 10.5 million hectares to be planted annually but only 7.5 million hectares were planted in the 2015 harvest season. These estimates were adjusted, but for white maize, only a few countries had stocks available for sale: the US and Mexico being the main ones. Imports were also delayed due to phytosanitary requirements as imported grain having stacked
gene combinations are not yet approved in South Africa. Issues such as uncertainties about the impact on the environment, US trade not separating white and yellow maize while in Southern Africa, and consumer demand for white maize for human consumption and yellow maize for animals need to be resolved.
The price of white maize escalated to a peak of R5 500/MT (~US$408), which prompted the government to intensify the issuance of import permits. Around 94.9% of the 628 permits were
South Africa

Global Status of Commercialized Biotech/GM Crops: 2016
47
traits White Maize
Yellow Maize
total Maize
Total Maize Planted
1.248 (52%)
1.152 (48%)
2.400
IR 0.208 0.202HT 0.153 0.267IR/HT 0.762 0.568Total Biotech Maize Planted
1.123 (52%)
1.037 (48%)
2.160
table 18. Biotech White and Yellow Maize Planted in South africa, 2016 (Million hectares)
Source: ISAAA, 2016
for white maize. New information on imported volumes and late rains showed higher than expected yields of crops in the field and more stocks available with US grain coming in, creating a possible surplus, and difficulties for local farmers as white maize prices went down to some R2 300/MT (~US$170). Despite these setbacks, farmer confidence is coming back and normalcy may return in early 2017. Hence, the latest estimate on the area of biotech maize planting showed a 22% increase of up to 2.16 million hectares.
South Africa in partnership with Kenya, Mozambique, Tanzania and Uganda are involved in the development and deployment of biotech maize under the Water Efficient Maize for Africa (WEMA) project. Maize varieties with stacked drought tolerance and insect resistance were approved in June 2015 but seeds will only be available in late 2017 to a limited number of smallholders. The official wide scale release to commercial farms is planned for 2018.
Maize production in South Africa indicates the long term trend of producing more maize
on less area with the use of more efficient and effective farming methods and practices. These are accompanied by the use of less marginal land in the maize production systems, better seed cultivars, and adoption of biotechnology. With biotechnology, yield of maize doubled over the past 20 years in South Africa (USDA, Agbiotechnology Annual for South Africa, 2016).
Biotech Soybean Soybean has been planted in South Africa since 2001 and in 2016 it was planted on 520,000 hectares, a 3% decrease (15,000 hectares) from 535,000 hectares planted in 2015 due to drought. Biotech soybean was planted on 494,000 hectares, 95% of the total soybean area. Experts believe that the increasing trend in soybean hectarage before the onset of drought in 2016 will continue due to the demand created by the growing investments in the oilseed processing industry in the country. The USDA post estimates that there will be a 39% growth in the area planted with soybeans in 2016-2017 due to the added soybean crushing capacity and the increased affinity by farmers to use soybeans as a rotational crop with maize (USDA FAS GAIN Agribiotechnology South Africa 2016). The Oilseed Industry Office has been stimulating and supporting soybean adoption by way of new imported varieties, better use of Rhizobia and farming systems. The Industrial Development Council provided funding through the Department of Trade and Industry to boost oilseed pressing facilities. In 2014-15 a one million MT crop was achieved, one year ahead of the target date set by the Oilseed Office.
Biotech Cotton Cotton with insect resistance (Bt) has been planted in South Africa since 1998, and in
South Africa

Global Status of Commercialized Biotech/GM Crops: 2016
48
2016, there were 9,000 hectares planted to IR/HT cotton, a 25% decrease in planting due to drought and low global cotton price. All cotton is GM with Bt-Bt stack and glyphosate tolerance. It is expected that cotton prices will increase as global prices stabilize, leading to increased prospects for cotton in the 2017-2018 season.
the Regulatory Permit System
The GMO Act, its regulations and biosafety framework require applications and approval of permits for all GMO activities, from plants to animals, microbes and vaccines, and cover imports/exports, contained field trials, seed and commodity trade, food and animal feed. Also included in some 12 types of permits, is assessing biosafety standards at labs and other facilities where GMOs are handled or researched. In many cases, two permits are required. Apart from meeting standard phytosanitary requirements, a GM seed import permit is required, and a second permit to plant or to multiply such seed. Commodity grain imports are subject to Commodity Clearance approval, then a permit for import, followed by a permit for commodity use – food, feed and/or processing.
Previous biosafety assessments of application documentation are carried out by a scientific team comprised of 10 experts, the GMO Advisory Committee (AC) and its sub-committees on a case-by-case basis. The AC opinion is presented to the official Executive Committee, the chairman and senior representatives from six government departments, to reach a consensus decision.
In 2016, the approval of regular annual permits jumped from 350 to 628 due to emergency imports of commodity grains for food, feed and processing purposes.
Contained field trials (Cft) approved in 2016
Following years of extensive testing new GM varieties move to contained field trials (CFT). The only CFT approved in 2016 were three varieties of cotton, each containing several stacked genes with insect resistance and herbicide tolerant traits. In 2016, there was no approval for general commercial release.
economic Benefits
It is estimated that the economic gains from biotech crops for South Africa for the period 1998 to 2015 was ~US$2.1 billion and US$237 million for 2015 alone (Brookes and Barfoot, 2017, Forthcoming). In summary, the increase in biotech crop planting in South Africa was spurred by increased planting of maize because of improved weather and water conditions at the end of 2016. There were also a slight decline in soybean planting due to drought during the beginning of planting season, as well as the 25% decrease in cotton area due to low global price. The 2015 planting season started dry and eventually destroyed some 29% of the maize crop and 25% of soybeans, with cotton areas also affected. There were losses incurred due to moisture stress. El Niño persisted throughout late 2015 and into 2016 with the entry of La Niña late in November. It is estimated that biotech crops hectarage will increase in the coming year since rainfall came in late 2016 for most crops, and there was increased demand for maize for food and feed, and increased crushing oilseed capacity for soybean. Water deficiency that affects South Africa can be addressed by the WEMA maize expected to be distributed widely to farmers by 2018, as well as the drought tolerant soybean that will be available from Argentina. The decline in cotton planting was affected by low global prices, which can rebound back when the price stabilizes.
South Africa

Global Status of Commercialized Biotech/GM Crops: 2016
49
uRuGuaY Uruguay introduced biotech soybean in 2000, followed by IR (Bt) maize in 2003. In 2016, biotech soybean and biotech maize were planted on ~1.3 million hectares, a 9% decrease from 1.4 million hectares in 2015. This is consistent with several other countries where a decrease in total plantings of the two crops is due to low prices, along with other local issues. The biotech crops planted in Uruguay were comprised of 1.23 million hectares biotech soybean and 60,000 hectares of biotech maize, with an adoption rate of 97% (Table 19).
Since 2000, Uruguay has approved 17 events including maize (10 events) and soybean (7 events). In 2016, no biotech events were
approved. In 2014, the regulatory system was working slowly with just some authorizations for trials. The lack of decisions on GMOs was due to “internal affairs” in the Government including the restructuring of the biosafety committees which caused a delay in approvals.
Biotech Soybean Biotech soybean occupied 98% (1.23 million hectares) of the national soybean hectarage of 1.26 million hectares in 2016. The adoption rate was marginally lower at 98% in 2016 compared to 100% in 2015. National soybean plantings decreased minimally by 8% from 1.33 million hectares in 2015 to 1.26 million hectares. The biotech soybean area was comprised of 1.06 million hectares HT and 171,000 hectares
Uruguay
Crops area (Million hectares)
Y/Y diff (%) trait Percentage and (adoption Rate)
2015 2016 2015 2016Soybean
Total Crop Planted 1.333 1.260 –0.07 (–5%)HT 1.106 1.059 –0.05 (–4%) 83 86IR/HT 0.227 0.171 –0.06 (–25%) 17 14Total Biotech Crop Planted 1.333 1.230 –0.10 (–8%) (100%) (98%)
MaizeTotal Crop Planted 0.100 0.070 –0.03 (–30%)HT 0.002 0.003 –<0.01 (43%) 2 5IR/HT 0.086 0.057 –0.03 (–34%) 98 95Total Biotech Crop Planted 0.088 0.060 –0.03 (–32%) (88%) (86%)
total uruguayTotal Crop Planted 1.433 1.330 –0.10 (–7%)HT 1.108 1.062 –0.05 (–4%) 78 82IR/HT 0.313 0.228 –0.09 (–27%) 22 18Total Biotech Crop Planted 1.421 1.290 –0.13(–9%) (99%) (97%)
table 19. Biotech Crop hectarage in uruguay, 2016
Source: ISAAA, 2016

Global Status of Commercialized Biotech/GM Crops: 2016
50
Intacta™ (Bt/HT stacked traits). The reduced biotech soybean area was representative of the reduced total soybean planting in the country brought on by lower global soybean prices, higher production costs and positive policy developments for the grain and soybean sector in Argentina (USDA FAS GAIN, Uruguay, 2016).
Biotech Maize2016 was the thirteenth year for Uruguay to plant 60,000 hectares of biotech maize, a 32% decline from 88,000 hectares planted in 2015. The adoption rate in 2016 declined from 88% to 86%. The biotech maize area of 60,000 hectares was comprised of 3,000 hectares HT and 57,000 hectares IR/HT stacked traits. Similar to soybean, biotech maize planting has been affected by the policy developments for the grain and soybean sector in Argentina. However, with the enhanced cattle importation from Uruguay by Argentina, an increase in biotech maize planting to provide silage feed and grains may be expected in the future (AG Online, 2016). Cattle farming in Uruguay utilizes feedlots extensively, but it is widespread practice to supplement this with the use of silage, hay, and grains from maize and sorghum, particularly during winter months.
Benefits from Biotech Crops in uruguay
Uruguay is estimated to have enhanced farm income from biotech soybean and maize of US$216 million in the period 2000 to 2015 and the benefits for 2015 alone is estimated at US$32 million (Brookes and Barfoot, 2017, Forthcoming).
In summary, biotech soybean and maize planted in Uruguay slightly decreased by 9% from 1.4 million hectares in 2015 to 1.3 million hectares in 2016. This was accompanied by a decrease in adoption rates from 99% to 97%. Decreased total planting of the two crops
resulted from decreased biotech crop planting. This was mainly due to lowered global prices, higher production costs and positive policy developments for grain and soybean sector in Argentina. It is likely that once global prices become stable, biotech crop plantings will resume and be profitable to farmers. The impending cattle importation by Argentina is expected to boost biotech maize planting for silage, hay, and grain feeds.
latiN aMeRiCaN CouNtRieS
Ten countries in Latin America are planting biotech crops, led by Brazil, which has the highest increase of ~5 million hectares in 2016, followed by Argentina, Paraguay, and Uruguay which are included in the top ten biotech countries planting more than 1 million hectares. This is followed by Bolivia, Mexico, Colombia, Chile, Honduras and Costa Rica, in decreasing order of hectarage.
Bolivia
In Bolivia, soybean is the most treasured crop largely produced in Santa Cruz region. The country is the ninth largest producer of soybean globally. Hectarage of total soybean in the country marginally declined from 1.31 million hectares in 2015 to 1.3 million hectares in 2016. However, adoption of herbicide tolerant soybean increased to 91% (from 80%) and the biotech soybean area increased by 13% from 1.05 million hectares to 1.2 million hectares.
Reduction in the total soybean planting was due to a historic and severe drought that affected major soybean growing areas in the country, and losses in crops affecting soybean growers (132,000 families ) in 131 municipalities. According to the USDA Report, the drought hit earlier in the year in
Uruguay

Global Status of Commercialized Biotech/GM Crops: 2016
51
the lower elevated areas of Sta. Cruz and affected the winter soybean crop season. As a consequence, Bolivia lost 111,000 hectares and 726,000 metric tons of grain at an estimated US$200 million. Bolivia had to import 45,000 MT of maize and 15,000 MT rice from Argentina. There is optimism that with developments in drought/stress tolerant biotech seeds, the government may consider approving other biotech crops of maize, cotton, and sugar cane. Currently, Bolivia only allows one biotech soybean event, GTS-40-3-2.
With the government’s ambitious plan to boost the area of land cultivation from 2.7 million hectares in 2015 to 4.5 million hectares in 2020, an accompanying unrelentless expansion of cultivable land has created some of the highest deforestation rates in the world. From almost 150,000 hectares of deforestation a year during the 1990s, as much as 300,000 hectares were affected by deforestation in 2010. It is disturbing to note that some 1 million hectares of deforestation are being planned (Financial Times, 27 October 2015). This move is going to be environmentally dangerous, but can be remedied by adopting biotech seeds that can increase food production on limited land area.
Benefits from Biotech SoybeanIt estimated that the economic gains from biotech crops for Bolivia for the period 2008 to 2015 was US$722 million and US$86 million for 2015 alone (Brookes and Barfoot, 2017, Forthcoming).
MexiCo
Mexico has been planting biotech crops since 1996, and is one of the six pioneer biotech planting countries. In 2016, Mexico planted 101,000 hectares of biotech crops, down from 141,000 hectares in 2015. The 101,000
hectares were comprised of 97,000 hectares of biotech cotton (with an adoption rate of 98%) and 4,000 hectares of biotech soybean (2% adoption rate) (Table 20).
Since 1996, Mexico approved 158 biotech events for food/feed use and cultivation. There were 5 alfalfa events, 13 for Argentine canola, 30 for cotton events, 68 for maize, 13 potato, 1 rice, 22 soybean, 1 sugar beet, and 5 tomato events. For cultivation alone, there were a total of 15 events approved including 2 for alfalfa, 12 for cotton and 1 for soybean. There were no approvals in 2016.
Biotech CottonCotton is the most important biotech crop grown in Mexico. Of the 97,000 hectares of biotech cotton, 93,000 hectares are stacked and 4,000 hectares are HT. The decrease in total hectares of cotton in Mexico, consistent with some other cotton-growing countries around the world, was due to historically low prices for cotton, which led farmers to reduce total cotton plantings. On 3 February 2016, the Secretariat of Agriculture, Livestock, Rural Development, Fisheries and Food (SAGARPA) National Health Service Food Safety and Quality Service (SENASICA) gave official recognition to the state of Baja California and Sonora for reaching the status of “free zone” from pink bollworm in cotton. The eradication of Pink Bollworm and Boll Weevil was undertaken by SAGARPA in collaboration with the United States Department of Agriculture (USDA). Control actions were taken to successfully eradicate these pests by using integrated pest management, and biotech seeds, and applying the sterile insect and pheromone mating disruption techniques. As a result, 85 percent of Mexico’s cotton producing area is now free of pink bollworm and 70 percent of the area is free from boll weevils.
Mexico

Global Status of Commercialized Biotech/GM Crops: 2016
52
Biotech SoybeanTotal soybean area increased slightly from 188,000 hectares to 211,000 hectares, a 12% increase in 2016 due to the normal weather conditions during the year. However, adoption of biotech soybean went down as expected from 18,000 hectares in 2015 to 4,000 hectares in 2016, because of the negative impact brought by EU’s ruling on honey entering EU.
Mexico is equipped with knowledge and expertise in agricultural biotechnology and has regulatory systems in place to assess biotechnology products. However, there are negative propaganda and cultural prejudices that opponents use to confuse the public about the technology. Strategic engagement with stakeholders and effective messaging to the general public are necessary to address biotech marketing issues, support Mexican
scientists and the industry to invest more in biotechnology applications.
the Biotech Maize Story
A legal ban on planting biotech maize in Mexico was introduced in 2013, which was overturned in August 2015 by a court decision but was appealed later in the year. However, in March 2016, a federal judge decided to allow the cultivation of biotech maize for experimental purposes only and not for commercialization. Technology developers are optimistic that the decision may represent a positive precedent for the development of biotechnology in Mexico.
Mexico is increasingly dependent on large and costly imports of maize from the US and there is merit in exploring options that would reduce
Crops area (Million hectares)
Y/Y diff (%) trait Percentage and (adoption Rate)
2015 2016 2015 2016Soybean
Total Crop Planted 0.188 0.211 0.020 (12%)HT 0.018 0.004 –0.014 (–76%) 100 100Total Biotech Crop Planted 0.018 0.004 –0.014 (–76%) (9.7%) (2.1%)
CottonTotal Crop Planted 0.128 0.099 –0.029 (–23%)HT 0.005 0.004 –0.001 (–19%) 4 4IR/HT 0.118 0.093 –0.025 (–21%) 96 96Total Biotech Crop Planted 0.123 0.097 –0.026 (–21%) (96%) (98%)
total MexicoTotal Crop Planted 0.316 0.310 –0.006 (–1.9%)HT 0.023 0.008 –0.015 (–64%) 16 8IR/HT 0.118 0.093 –0.025 (–21%) 84 92Total Biotech Crop Planted 0.141 0.101 –0.040 (–28%) (45%) (33%)
table 20. Biotech Crop hectarage in Mexico, 2016
Source: ISAAA, 2016
Mexico

Global Status of Commercialized Biotech/GM Crops: 2016
53
increasing dependency on imported maize. The hope of proponents of biotech maize in Mexico is that the federal government will adopt a national, science-based public policy that will allow the centers of origin and diversity of maize, in the south, center and north of the country to be protected, with commercial production of biotech maize restricted to certain regions of the northern states of the country. This strategy would ensure that Mexico and its people would benefit from biotech maize which can contribute to national food/feed security and also mitigate new challenges, such as more frequent and severe droughts, associated with climate change.
Biotech Crops in the Pipeline
The National Institute of Forestry, Agriculture and Livestock Research (INIFAP) has developed biotech beans (Phaseolus vulgaris) with resistance to fungi Colletorichum lindemuthianum, Fusarium lateritium and Rhizoctonia solani. Biotech bean events FMA-pdf1.2-INIFAP were tested in Celaya, Guanajuato after a permit for experimental release was granted in 2014. The non-profit International Maize and Wheat Improvement Center (CIMMYT) have tested experimental releases of GM wheat over the last seven years with various traits including drought tolerance. Various institutes in Mexico including the National Laboratory of Genomics for Biodiversity (LANGEBIO) at the Researcher Center and Advanced Studies (CINVESTAV) and a private company are developing biotech crops that will absorb and optimize the use of phosphorus. There will be less fertilizer and phosphorus that will be applied to soil, a disadvantage to weeds, hence less herbicide use (USDA_FAS GAIN Agricultural Biotechnology Annual Mexico, 15 July 2015).
CINVESTAV is developing a GM lemon tree (Citrus aurantifolia) resistant to the disease
known as Huanglongbing (HLB). They obtained three release permits in 2014 to test different events in Tecoman, Colima.
Benefits from Biotech Crops in Mexico
Since 1996, according to officials, biotech cotton farmers from Chihuahua have saved 30 percent on their production costs, due to reduced pesticide applications from 18 to once per cotton growing season. At the same time, the use of GM seeds increased yields from 3.7 to 7.7 bales of cotton per hectare. In Mexico, the 2015/16 total cotton production and harvested area estimates were 0.9 million bales in a harvested area of 130,000 hectares (SAGARPA, 2016). According to the Food and Fisheries Statistics Service (SIAP), nearly 95 percent of the total surface planted was biotech cotton.
Mexico is estimated to have enhanced farm income from biotech cotton and biotech soybean by US$489 million in the period 1996 to 2015 and the benefits for 2015 alone is estimated at US$77 million (Brookes and Barfoot, 2017, Forthcoming).
In summary, biotech crop (soybean and cotton) plantings in Mexico decreased by 28% from 141,000 hectares in 2015 to 101,000 hectares in 2016. Reduction in total and biotech cotton planting was due to low prices of cotton. On the other hand, reduction in soybean planting was due to the complications and dispute farmers had with Mayan Indians who needed to comply with the EU regulation of labeling the honey if GE pollen exceeds 0.9%. Mexico has vigilant scientists and experts that can address negative propaganda through strategic engagements with stakeholders and effective messaging to the general public. The recent judicial decision to allow cultivation of biotech maize for experimental purposes may stir interest and positive shift for the development of biotechnology in the country.
Mexico
Global Status of Commercialized Biotech/GM Crops: 2016
54
ColoMBia
Colombia planted its first biotech cotton in 2002 and its first biotech maize in 2009. In 2016, Colombia planted 110,000 hectares of biotech crops; 21,000 hectares (~24%) more than in 2015 (89,000 hectares). This is comprised of 100,000 hectares of biotech maize and 9,800 hectares of biotech cotton. Increased biotech maize was due to a program to increase biotech maize hectarage for the poultry industry. The global low cotton prices affected biotech cotton area in the country.
Since 2002, Colombia has approved 82 events for food, feed, and cultivation including 8 carnation events, 11 cotton, 1 flax, 44 maize, 2 rice, 2 rose, 12 soybean, 1 sugar beet, and 1 wheat. For cultivation, Colombia has approved 22 events: 8 carnation, 5 cotton, 6 maize, 2 rose, and 1 soybean.
In 2016, Colombia approved nine events for food, feed and cultivation including, for cotton: stacked HT and IR event COT102; stacked HT/IR maize Event 4414, BT11 x MIR162 x TC1507 x GA21, BT11 x Event 59122 x MIR604 x TC1507 x GA21 x MIR162, and TC1507 x MON810 x MIR162; and for stacked HT soybean: DAS44406-6 and DAS68416-4.
Biotech Dutch blue carnations continue to be produced under greenhouse conditions for export to Europe and biotech blue petal roses for exports to Japan. The area planted in 2015 for both Dutch blue carnations and blue petal rose remains unchanged at 12 hectares. One blue petal rose in the Japanese retail market has an estimated value of about US$40-US$50 contributing significant revenues for smallholder growers of ornamental flowers. Biotech seeds are imported mostly from the United States and occasionally from South Africa, Argentina, and Australia.
On September 2015, the Constitutional Court
ruled in favor of mandatory labeling of GM organisms in response to a lawsuit attacking Consumer Law 1480, Article 24, which refers to labeling, but does not address GM labeling.
Biotech Potato in the Pipeline
A potato resistant to the Guatemalan moth is being developed at the Medellin’s Corporation for Biological Research (CIB). The biotech moth resistant potato is expected to be available to producers within three years. This technology could bring benefits in terms of protection against pests, minimize insecticide applications, saving in production costs and increased productivity. Other research institutes working on crop improvement through biotechnology include the International Center for Tropical Agriculture (CIAT) on cassava, rice and sugarcane; Cenicaña for sugarcane improvement; and the National University on maize, potato and rice improvement (FreshPlaza, 5 March 2015).
Colombia has not developed any biotechnology crops to date. There are several Colombian organizations conducting specific research projects. The Colombian sugar cane research center (CENICAÑA) is developing a sugar cane variety resistant to the yellow leaf virus. The International Center for Tropical Agriculture (CIAT) is researching biotech rice, cassava and grass. The Colombian Coffee Research Center (CENICAFE) is conducting biotech research on tobacco (nicotiana), the fungus Beaveria bassiana, and a coffee variety resistant to coffee borer (broca). The International Corporation for Biological Research (CIB) is investigating potatoes resistant to lepidopterous insects. Colombian universities and research institutes are working together to develop rice and potato biotechnology events. There is increasing interest by a group of companies and farmers to expedite the development of biotech events that enhance competitive benefits for
Colombia
Global Status of Commercialized Biotech/GM Crops: 2016
55
local crops that are sensitive to competition from imports. All varieties of events that are developed must go through the regulatory approval process whether intended as an ornamental, for human consumption and/or for animal feed.
Benefits from Biotech Crops in Colombia
Colombia is estimated to have enhanced farm income from biotech crops of US$153 million in the period 2002 to 2015 and the benefits for 2015 alone is estimated at US$24 million (Brookes and Barfoot, 2017, Forthcoming).
In summary, with the increasing sustained economic growth and the increase in the household income of the populace, feed demand will continue to grow primarily in the poultry sector, the preferred meat in the country. Colombia is a net importer of maize (white and yellow) with 95% for animal feed supply and 5% for human consumption. Local maize production goes to animal feed (10%) and for food processing (90%) which can only satisfy 30% of the total domestic consumption. The poultry industry uses up 67% of the animal feed available in Colombia, 23% goes to the livestock and swine and the remaining 10% for aquaculture and household pets. This will require planting or importing of more biotech maize in the future. The main impact of the biotech insect resistant cotton is significant improvement in yield and decrease in number of insecticide applications with important environmental and health implications.
hoNduRaS
Honduras commercialized biotech crops in 2002. In 2016, 31,000 hectares of biotech maize were planted, 15% higher than 27,000 hectares (2015) at 100% adoption rate. The 31,000 hectares was comprised of 800 hectares HT,
2,200 hectares IR and 28,000 hectares stacked IR/HT. The increased area of maize planting is due to favorable weather conditions and better market prices for biotech maize.
Honduras cultivates biotech crops for maize seed production and food/feed consumption. The country has approved eight events for food, feed, and cultivation: 7 maize events and 1 rice event. Honduras produces ‘stacked’ commercial events: VTPRO (MON89034 + MON88017) and MON89034 + NK603) and Herculex 1 (TC1507).
Honduras is the only country in Central America — and one of seven countries in Latin America that allows the commercial cultivation of biotech crops. Honduras’ production of GM maize seed is sold within the domestic market for agro-industry and is exported to Colombia. Honduras imports yellow maize and soybean meal to supply its poultry, livestock, shrimp, and tilapia industries. This can be minimized if the country plants its own biotech soybean.
Benefits from Biotech Maize in honduras
The experience of Honduras, a small country with very limited resources in implementing a successful biosafety program can serve as a useful model and learning experience for other small countries particularly those in the Central American region. Zamorano University in Honduras has activities in biotech crops, including a knowledge sharing initiative which should contribute to a better understanding of biotech crops and facilitate more informed decisions about biotech crops, their attributes and potential benefits.
It is estimated that Honduras has enhanced farm income from biotech maize by US$3 million in the period 2002 to 2015 and the benefits for 2015 alone is US$0.4 million (Brookes and Barfoot, 2017, Forthcoming).
Honduras

Global Status of Commercialized Biotech/GM Crops: 2016
56
Chile
Chile has been producing biotech seeds for export since commercialization began in 1996 under strict field controls for re-export outside the country. In 2016, the country grew 10,667 hectares of biotech crops comprised of 6,260 hectares IR/HT maize, 2,050 hectares HT soybean, and 2,357 hectares HT canola. In 2016 the area planted to biotech crops increased to 10,667 hectares, which was a 15% increase from the 9,306 hectares planted in 2015.
Fluctuations in the area of biotech crops in Chile depends on the annual demand for biotech seeds and on the relative net demand to Chile compared to other seed-producing countries. For instance, according to the USDA Agribiotechnology Annual for Chile (2016), the reduced planting of biotech crops in 2015 was believed to be due to the following factors:
a. Lower value of a barrel of oil which dragged down ethanol production and the demand for corn, so, less maize was planted and used;
b. China’s economic slowdown reduced its need for grain; and
c. The US’s record harvest from 2014 to 2016 left US maize seed manufacturers with extra stocks.
Chile is the fifth largest producer of biotech and non-biotech seeds in the world, and the US is the largest destination for its produced seeds (Appendix 2a). Multiplication of biotech seed for export was a significant business activity that was valued at approximately US$400 million in 2009, of which the value of biotech seed alone was at least US$200 million. The number of biotech seed crops multiplied in Chile is now more than 10 crop/trait combinations. The country has broad and diversified experience in successfully managing all aspects related to the growing of biotech crops for over 10 years. Biotech seeds produced in Chile are exported primarily to the USA and Canada.
Chile has 117,418 hectares of maize (FAOSTAT, 2016 retrieved) which could benefit significantly from biotechnology and substitute for some of the imports of biotech maize from Argentina. Chile also has some 50,000 hectares (FAOSTAT, 2016) of potatoes which could benefit from biotechnology. The most recent REDBIO regional meeting on biotechnology recognized an opportunity for Chile to grow biotech maize for domestic consumption. Chile could also be a viable producer of biotech sugar beets, maize and alfalfa, if allowed to commercialize.
Biotech Research in Chile
Several organizations in Chile have been pursuing the development of biotech crop products for several years: The Catholic University of Santiago is developing citrus species that are resistant to drought and tolerant to nitrogen deficiency, virus resistant potatoes, and Pinus radiata species that are resistant to shoot moth and is also tolerant to glyphosate. The National Institute for Agricultural Research (INIA) is developing grapes that are resistant to Botrytis, and in a joint program with the University of Santo Tomas they are developing stone fruits (nectarines and peaches) with improved quality and shelf life.
Chile
Crops area (hectares) Y/Y diff (%)2015 2016
IR/HT Maize 4,681 6,260 1.579 (34%)
HT Soybean 1,662 2,050 388 (23%)
HT Canola 2,963 2,357 –606 (–20%)
Total Biotech 9,306 10,667 3,361 (15%)
table 21. Biotech Crop Planting in Chile, 2016
Source: ISAAA, 2016
Global Status of Commercialized Biotech/GM Crops: 2016
57
Fundacion Chile provides technical and financial support for some of these projects.
Chilean Research Institutes are developing drought-tolerant Eucalyptus. The project aims to provide farmers and the forestry industry with plants and trees better adapted to the conditions of the arid interior regions of Chile. It is estimated that currently, 1.8 million hectares of land are not realizing their production potential due to the low availability of water (INIA, 2016).
Biotech grape resistant to gray mold and powdery mildew disease were developed by scientists at Universidad de Santiago, Chile and partners (Rubio et al. 2014). Two endochitinase genes and one N-acetyl-b-Dhexosaminidase gene from biocontrol agents related to Trichoderma spp were introduced into Thompson Seedless lines. Some 568 transgenic lines were initially tested in open fields for resistance to the two diseases and 19 lines were selected for consecutive field evaluations for four years (2007-2009). Plants from these lines were grafted onto rootstock Harmony and further characterized in the field. Molecular analysis (Southern blot, realtime PCR, ELISA and immunostrip) indicate the transgenic status of the selected line. Gray mold assays in Petri dishes were supplemented with juices of the transgenic lines revealed suppression of fungal growth.
Biofrutales, a consortium of research institutions including Fundacion Chile, INIA, Fedefruta, Univiveros and several universities bought the rights to the technology and will be conducting further evaluation for commercial release. The consortium also plans to develop biotech varieties of stone fruits (peaches and nectarines). The company has allocated US$3 billion between 2006-2011 to conduct various breeding programs for vines (61% of the budget), nectarine and cherry trees. Grapes are economically important crop in Chile
because of the wine industry. The consortium has also been awarded three 10-year projects in InnovaChile and Fondef with US$5 billion in project support (FreshPlaza, 20 May 2015).
CoSta RiCa
Costa Rica started planting small areas of biotech seeds in 1992 for export to other countries. The area planted to biotech crops will likely reach 226 hectares by the end of 2016, a 13% increase from 200 hectares in 2015. The 226 hectares will be comprised of 14.76 hectares biotech pineapple with high antioxidants, less than one hectare HT soybean, and 210 hectares IR cotton.
In 2009, Costa Rica was included for the first time in the global list of countries officially planting biotech crops, because similar to Chile, it planted commercial biotech crops exclusively for the export seed trade. The current laws in Costa Rica and Chile allow only commercialization of biotech crops designated for “seed” export. The biosafety law was promulgated in Costa Rica in 1998. The volume of biotech seed production in Costa Rica is small compared with Chile but has potential for growth in the future.
Since 2009, there have been 15 biotech events approved for feed use and cultivation for seed export: 13 for cotton and 2 for soybean. The events approved for seed production are Roundup Ready, Roundup Ready Flex, Bollgard, Bollgard II, WideStrike, Cry 1F, Bomoxinil, Liberty Link, Vip 3A and stacked IR cotton traits.
The country imports biotech maize and soybeans from the US for animal feed production and a small volume of cotton for processing. Biotech research conducted by Costa Rican scientists include the development of bananas with resistance to black Sigatoka, and herbicide tolerant rice. Some of the
Costa Rica

Global Status of Commercialized Biotech/GM Crops: 2016
58
products are already in the field trial stage, approved under biosafety regulations which conform to international standards, and are likely to be commercialized in the future.
futuRe PRoSPeCtS foR latiN aMeRiCa
Except for Chile and Costa Rica which continuously plant biotech crops for export, biotech crop countries in Latin America grew biotech crops for food, feed and processing. Brazil obtained the highest increase of 11% or 4.9 million hectares of biotech crops in 2016 compared to 2015. The IR/HT soybean Intacta™ has gained popularity among farmers because of savings in pesticide and no-till technology. Adoption rates of the three major biotech crops were almost optimum at an average of 93.4% in Brazil and Argentina. Total soybean and biotech plantings in Argentina and Bolivia were affected by severe drought, however in Paraguay, the marginal decrease was due to competition with maize planting to cater to the increasing demand of the expanding pork industry in the country. In Mexico, reduced soybean planting was due to conflicts resulting from negative propaganda for biotech crops. Biotech soybean and maize decreased in Uruguay due to lowered prices, higher production costs and positive policy developments for the grain and soybean sector in Argentina. Lowered cotton prices also negatively affected Argentina, Mexico, and Colombia.
The possible expansion of the pork and livestock industry in Brazil may push farmers to plant more maize in 2017. New products waiting to be commercialized which are expected to impact the Brazilian economy are the biotech eucalyptus and virus resistant bean. In Argentina, the development of drought tolerant soybean, which is now in testing stage, will allow for the utilization of marginal areas affected by drought. Also, adoption of a virus resistant potato will be beneficial to farmers in
increasing yield and reducing production costs. Area expansion in Paraguay and Colombia for total maize was observed due to the increasing expansion of the pork industry, which is likely to continue in the next few years with maize prices becoming relatively higher due to demand from Brazil and Chile. Biotech maize adoption may also increase consequently. Countries affected by low global cotton prices may rebound back as soon as prices become stable, similar to maize which has suffered low prices in the last two years. New biotech crops and traits that can withstand drought/stress will be a welcome respite from the losses of the past years.
aSia aNd the PaCifiC
There are eight countries in Asia and the Pacific that are planting and consuming biotech crops. These are India, Pakistan, and China which are planting more than 1 million hectares of biotech cotton and belong to the top 10 biotech countries, followed by Australia (planting biotech cotton and canola), Philippines (biotech maize), Myanmar (biotech cotton), Vietnam (biotech maize) and Bangladesh (biotech eggplant), in decreasing area of biotech crops.
auStRalia
Australia is one of the first six countries that commercialized biotech crops in 1996. In 2016, Australia ranks eleventh in the countries planting biotech crops with 852,000 hectares of biotech cotton and canola, a 29% increase from 658,000 hectares in 2015. This was comprised of 405,000 hectares cotton and 447,000 hectares canola. The adoption rate of biotech crops increased from 30% in 2015 to 36% in 2016 (Table 22).
Australia has approved a total of 119 biotech events for food, feed, and cultivation including alfalfa (3 events), Argentine canola (21), carnation (12), cotton (24), maize (27), potato
Future Prospects for Latin America

Global Status of Commercialized Biotech/GM Crops: 2016
59
(10), rice (1), rose (1), soybean (17), sugar beet (2), and wheat (1). In 2016, Australia granted food approvals for the following maize events: stacked HT MON87419 and MZHG0JG, stacked IR/HT MZIR098, increased ear biomass event MON87403, as well as insect resistant soybean MON87751. Seven canola events were granted food, feed, and cultivation approvals including stacked HT: HCN92 x MON88302 and HCN28 x MON88302; HT + PC – fertility restorer RF1 x MON88302, RF2 x MON88302 and MON88302 x RF3; and HT + PC – male sterility MS1 x MON88302 and MS8 x MON88302.
Biotech CottonBiotech cotton has been grown in Australia since 1996, and in 2016, 405,000 hectares biotech cotton out of the 413,000 total hectares were
planted at 98% adoption rate. There was an unprecedented increase of almost 90% (190,000 hectares) from 214,000 in 2015 to 405,000 hectares in 2016, in biotech cotton plantings as weather and water conditions improved in the cotton planting states. Stacked traits of IR/HT was at 97% and IR at 3%, with the introduction of Bollgard III/RR®Flex. This stacked event contains three different insect resistant genes combined with herbicide tolerance and was deployed in some areas in the late 2016-17 cotton season. Australian cotton growers were the first in the world to benefit from Bollgard lll/RR®Flex. Some 90% of Australian cotton is exported to China, Indonesia and Thailand.
Biotech CanolaFor the ninth consecutive year in 2016,
Australia
Crops area (Million hectares)
Y/Y diff (%) trait Percentage and (adoption Rate)
2015 2016 2015 2016Cotton
Total Crop Planted 0.214 0.413 0.20 (93%)HT 0.001 0.013 0.01 (120%) 0.05 3IR/HT 0.213 0.392 0.18 (84%) 99.5 97Total Biotech Crop Planted 0.214 0.405 0.19 (89%) (100%) (98%)
CanolaTotal Crop Planted 2.000 1.953 –0.05 (–2%)HT 0.444 0.447 <0.01 (0.68%) 100 100Total Biotech Crop Planted 0.444 0.447 <0.01 (0.68%) (22%) (23%)
total australiaTotal Crop Planted 2.214 2.366 0.152 (7%)HT 0.445 0.450 0.015 (3%) 68 54IR/HT 0.213 0.392 0.179 (84%) 32 46Total Biotech Crop Planted 0.658 0.852 0.194 (29%) (30%) (36%)
table 22. Biotech Crop hectarage in australia, 2016
Source: ISAAA, 2016

Global Status of Commercialized Biotech/GM Crops: 2016
60
Australia grew herbicide tolerant canola on 23% (447,725 hectares) of the total canola area of 1.95 million hectares. Herbicide tolerant canola was grown in three states: New South Wales (NSW), Victoria and Western Australia. According to the Australian Oilseeds Federation (2016), an estimated total of 1.95 million hectares of canola were grown in Australia (Table 23), a decline of 2% from 2015 (2 million hectares). Despite a decrease in the total canola hectarage, biotech canola adoption increased in 2016 to 23% (447,725 hectares) compared to 22% (436,534 hectares) in 2015.
Farmers in Western Australia grew 346,000 hectares (30% of total canola) of biotech canola, 46,582 hectares (16%) in Victoria, and 55,143 hectares (11%) in NSW. A 3% increase in the adoption rate was obtained in Victoria which elevated national adoption rate to 23%. There is a potential 1.5 million hectares in Australia that would be planted to biotech canola for the benefit of the farmers and consumers in the country (Table 23).
Biotech canola was planted by more than 1,000 farmers with more than 180 growers planting it for the first time. In recent research by Brookes and Barfoot (2016), since 2008, the average yield
gain from biotech canola technology has been 11%. This has resulted in an additional 226,000 tonnes of canola produced in the country.
other Biotech Crops in the Pipeline
Research is being conducted on other biotech crops, with field trials controlled by The Office of the Gene Technology Regulator (OGTR), including bananas, barley, canola, cotton, grapevines, Indian mustard, maize, papaya, perennial ryegrass, pineapple, safflower, sugarcane, tall fescue, torenia, wheat, and white clover.
impact of lifting the GM Crop Planting Moratorium in Western australia
The Parliament of Western Australia (WA) repealed the Genetically Modified Crops Free Areas Act 2003, which imposed a moratorium on the commercial cultivation of genetically modified/biotech crops (GM) in Western Australia. The Genetically Modified Crops Free Areas Repeal Act 2015 repealed the former 2003 Act, and consequently amended the Biosecurity and Agriculture Management Act 2007. Part 1 of
Australia
State total Canola (ha) Biotech Canola (ha) Biotech Canola (%) Non-biotech (ha)2015* 2016** 2015* 2016** 2015* 2016** 2016
NSW 490,000 499,294 51,870 55,143 11% 11% 444,151Victoria 370,000 289,973 47,137 46,582 13% 16% 243,391Western Australia
1,140,000 1,163,733 337,537 346,000 30% 30% 817,733
total 2,000,000 1,953,000 436,534 447,725 22% 23% 1,505,275
table 23. hectares of Canola Planted in australia, by State, 2015-2016
* Sourced from industry data, compiled by Australian Oilseeds Federation (2015)** Area estimate based on seed sold using a 2.0 kg/ha.From 2009 to 2014, seeding rate used in estimates was 2.5 kg/ha, but due to improved crop genetics, vigour and establishment over time, a lower seeding rate was used since 2015.
Global Status of Commercialized Biotech/GM Crops: 2016
61
the Act will take effect on the date of the Royal Assent, and the remainder of the Act will come into operation on the day after Royal Assent (CBU, 26 October 2016).
Western Australia has been classified as a GM crops free area zone, with two exemptions, one for GM cotton in the Ord River irrigation area and the other for GM canola. The repeal will mean GM food crops can be legally grown without the need for exemptions. WA farmers have had access to GM canola for several years now but each year they required an exemption to the Bill. Now the need for an exemption is gone. Thus, the passing of the Bill will give certainty to WA farmers and reduced red tape for investors and provide access to new opportunities and tools for grain growers to be innovative. This allows growers the choice to cultivate any GM crops which are approved by the Office of the Gene Technology Regulator. In addition, biotechnology companies will be more inclined to invest research dollars into new varieties which will become increasingly suited to the local environment that can encourage further adoption.
Similarly, the South Australian (SA) grain growers already petitioned the State Government to lift the moratorium prohibiting the planting of genetically modified crops in the area. The Grain Producers SA is a not for profit organization which represents all grain producers in South Australia. Their position is that growers should have greater freedom of choice to grow the crop varieties which best fit their farming systems to coincide with the basic free-market and right to farm principles. They believe that SA’s A$2.4 billion grain industry, which is denied the right to choose what is best for their own businesses, is not acceptable. Currently, it is estimated that GM crops would deliver a 7% yield increase for SA growers representing US$140 million extra income for the farmers.
Benefits of Biotech Crops in australia
Australia is estimated to have enhanced farm income from biotech crops by US$1 billion in the period 1996 to 2015 and the benefits for 2015 alone is estimated at US$73 million (Brookes and Barfoot 2017, Forthcoming).
In summary, biotech crop adoption in Australia increased from 30% in 2015 to 36% in 2016. Overall, there was an increase of 29% biotech crop hectarage from 658,000 hectares in 2015 to 852,000 hectares in 2016. This is mostly from biotech cotton, which had a significant increase of 89% due to the introduction of Bollgard III/RR® Flex. A slight decrease in planting was observed in biotech canola, however, adoption rates increased from 22% to 23%. With the lifting of the biotech crop planting moratorium in Western Australia, farmers who are planting some 1.5 million conventional canola may shift to biotech in subsequent years. This will also open doors to the development and adoption of other biotech crops and traits. It is noteworthy that the South Australian (SA) grain growers have already petitioned the State Government to lift a similar moratorium imposed to them. The growers believe that they should have greater freedom of choice to grow the crop varieties which best fit their farming systems, as well as coincide with the basic free-market and right to farm principles.
PhiliPPiNeS
The Philippines continues to be at the forefront of biotech research and commercialization in South East Asia and has a model for science-based and thorough regulatory policy in the region. The country ranks thirteenth in biotech crop commercialization for 2016 when 812,000 hectares of biotech maize have been planted, a 16% increase from the 702,000 hectares
Philippines

Global Status of Commercialized Biotech/GM Crops: 2016
62
planted in 2015 due to favorable weather conditions, local demand for livestock and low feed stocks. This was comprised of 133,000 hectares herbicide tolerant and 679,000 hectares of IR/HT maize – IR (Bt) maize has not been planted since 2013. Adoption rates also increased from 63% in 2015 to 65% in 2016 (Table 24). Biotech maize has been planted since 2003 and the country is gearing up for the possible commercialization of products of public-private sector collaborations such as Golden Rice, Bt eggplant, virus resistant papaya and Bt cotton.
The number of small resource-poor farmers, growing on average, two hectares of biotech maize in the Philippines in 2016 was estimated at 406,000. Since 2002, there have been 88 biotech crop event approvals for food, feed, and processing cultivation in the Philippines: alfalfa (2 events), rapeseed (2), cotton (8), maize (52), potato (8), rice (1), soybean (14), and sugar beet (1). Biotech maize is the only biotech crop commercialized in the Philippines. There were only 13 biotech maize events approved for cultivation in the Philippines since 2002, the last one approved in 2014.
Biotech Crops in the Pipeline Golden Rice (GR) is a biotech rice biofortified
with provitamin A beta-carotene that is being developed by the Philippine Rice Research Institute (PhilRice) and the International Rice Research Institute (IRRI). Golden Rice can be a potential sustainable complement to alleviate vitamin A deficiency (VAD), complementing other existing VAD interventions. IRRI reports that research, analysis and testing of beta carotene-enriched Golden Rice continues, in partnership with collaborative national research agencies in the Philippines, Indonesia, and Bangladesh. Confined field testing (CFT) was conducted at IRRI in 2015, and selected lines of the new event were tested in CFT on four sites across the Philippines. Data for compositional, biosafety and expression analyses was obtained in some selected sites, as well as for agronomic traits. Data generated from these CFTs will be used to obtain multi location trial permits and in preparing for food, feed and processing approval applications.
The fruit and shoot borer resistant Bt eggplant research is led by the Institute of Plant Breeding of the University of the Philippines at Los Baños (IPB-UPLB), and was also a royalty-free technology donated by the Maharashtra Hybrid Seed Company (Mahyco) through a sublicense agreement. The proponents have already completed field trials of promising hybrid varieties in the approved multi-location
Philippines
Crop area (Million hectares)
Y/Y diff (%) trait Percentage and (adoption Rate)
2015 2016 2015 2016Maize
Total Crop Planted 1.115 1.248 0.13 (12%)HT 0.055 0.133 0.08 (142%) 8 16IR/HT 0.647 0.679 0.03 (5%) 92 84Total Biotech Crop Planted 0.702 0.812 0.11 (16) (63%) (65%)
table 24. Biotech Maize hectarage in the Philippines, 2016
Source: ISAAA, 2016

Global Status of Commercialized Biotech/GM Crops: 2016
63
trial sites in Luzon and Mindanao in October 2012 which generated the data required for biosafety assessment by the Philippine regulatory agency. Field trials of isoline non-Bt hybrids and open-pollinated varieties were conducted in six trial sites in Luzon, Visayas and Mindanao for purposes of selecting candidate lines for variety registration to the National Seed Industry Council. Data generated from these trials clearly shows that Bt eggplant provides an environmentally benign alternative to the current excessive application of chemical insecticide in local eggplant production. In addition, higher marketable yield potential and lower percentage eggplant fruit and shoot borer (EFSB)-damaged fruits were obtained compared to the hybrid non-Bt check.
Biotech papaya with delayed ripening and papaya ring spot virus (PRSV) resistance, also being developed by IPB-UPLB, has already been tested in confined field trials in 2012. Another field trial is being planned soon to be conducted in a larger area pending release of regulatory approvals.
Bt cotton is being developed by the Philippine Fiber Development Administration (PFIDA, formerly the Cotton Development Authority). The technology, provided by Nath Biogene Ltd. and the Global Transgene Ltd. from India was tested for the first time in a confined field trial in 2010, and multi location field trials in 2012 and 2013. Data to complete regulatory dossiers was collected in 2015 for commercialization purposes.
the Bt eggplant Case in the Philippines
The USDA FAS GAIN Report on Agricultural Biotechnology Annual in the Philippines for 2016 provides a concise narrative on the Regulation of Biotech Crops in the Philippines with focus on the Bt eggplant case, as follows:
“In 2012, a lawsuit was filed to halt the commercialization of Bt eggplant. The case was elevated to the Supreme Court (SC) which ruled on December 8, 2015 that existing GE regulations as embodied in DA Administrative Order No. 8 (DA-AO 8) did not sufficiently cover the minimum requirements of the principles of risk assessment embodied in the National Biosafety Framework (NBF). The SC permanently enjoined the field testing of Bt eggplant (which had already been completed) and declared null and void DA-AO 8. Hence, it halted the processing of applications for contained use, field testing, propagation and commercialization, as well as the importation of GE products. Specifically, the SC pointed to shortcomings in DA-AO 8 pertaining to the following: (1) Public consultation; (2) Department of Environment and Natural Resources (DENR) involvement; and (3) Risk assessment standards and practices.
In response, experts from the DA, Science and Technology (DOST), DENR, Health (DOH), and Interior and Local Government (DILG), crafted a Joint Department Circular entitled Rules and Regulations for the Research and Development, Handling and Use, Transboundary Movement, Release into the Environment, and Management of Genetically-Modified Plant and Plant Products Derived from the Use of Modern Biotechnology. On March 8, 2016, after a series of consultations and several revisions, the DOST-DA-DENR-DOH-DILG JDC No. 1, Series of 2016 was approved, and took effect April 15, 2016. According to local experts, the JDC provides more consideration to socio-economic issues and environmental impacts in risk assessment procedures compared to DA-AO 8.
Philippines
Global Status of Commercialized Biotech/GM Crops: 2016
64
In general terms, the JDC indicates the responsibilities of DA, DENR, and the DOH in the conduct of risk assessment. Environmental risk assessment will be conducted by DENR while the DOH is responsible for environmental health impact and food safety assessment. The DILG’s role is mainly coordinating with the other departments in overseeing public consultations. The DOST remains as the lead agency for evaluation and monitoring regulated articles (i.e., approved GE events) intended for contained use, while the DA continues to take the lead in the evaluation and monitoring of regulated articles.
In a July 26, 2016 press briefing, the SC reversed its December 2015 decision which effectively halted the field testing, propagation, commercialization, and importation of GE products in the country. The full SC decision was issued on August 18, 2016, and confirmed that the JDC superseded the DA-AO 8.
While many local GE advocates hailed the SC reversal, some industry stakeholders are concerned that the JDC did not provide an extension or grace period for the renewal of expiring biosafety permits approved under DA-AO 8. All approved transformation events (TEs) under DA-AO 8 have to reapply under the JDC.
The DA Operations Manual outlines the procedural requirements in securing biosafety permits for field trials, commercial propagation, and for direct use as food, feed, or processing. The total number of processing days for applications is 85 days. Industry, however, has reported delays beyond the 85 day period. The affected commodities include corn
and soybeans, which are insufficiently produced and critical for the expanding livestock and poultry industries. The other JDC-pertinent departments have yet to finalize their procedures and issue corresponding guidelines.”
According to noted Filipino scientist and academician Dr. Emil Q. Javier, the “misfortune of SC decision turned out to be a blessing in disguise,” in an article published in the Manila Bulletin. Dr. Javier explained the four fortuitous, but albeit positive consequences associated with the misfortunate issuance of the SC decision. First, it heightened public awareness of the science and benefits of genetically modified organisms and products, noting also that GM corn and soybean have been globally cultivated, imported, and used for food and feed safely for 20 years. Second, a unanimous outcry was heard from Filipino scientists based in the Philippines and abroad explaining why the SC has erred big time in this matter, simultaneously realizing that the science community has to do a better job of promoting public information of the advances in science and technology. Third, the agribusiness corporations and small farmers, upon realizing the negative impact of the SC decision on local supply of corn and soybean for food and feed, food price hike, as well as environmental impact of using the conventional technology, came together to protest the SC ruling through various statements and press releases. Fourth, the five executive departments led by Department of Science and Technology (DOST) Secretary Mario G. Montejo moved expeditiously to draft, in a record time of three months, a Joint Departmental Circular (interdepartmental, JDC) to replace DA AO8 as required (CBU, 9 March 2016).
Benefits of Biotech Crops in the Philippines
The farm level economic benefit of planting
Philippines

Global Status of Commercialized Biotech/GM Crops: 2016
65
biotech maize in the Philippines in the period 2003 to 2015 is estimated to have reached US$642 million. For 2015 alone, the net national impact of biotech maize on farm income was estimated at US$82 million (Brookes and Barfoot, 2017, Forthcoming).
In summary, biotech maize commercialization in the Philippines temporarily declined in 2015 due to non-optimum weather conditions and low global prices. It quickly rebounded in 2016 with an adoption rate of 65%, an increase from 63% in 2015, and a 16% increased hectarage over 2015. Biotech crops acceptance in the country has been demonstrated by farmers, consumers, academia and the general public such that a Joint Departmental Circular (JDC) was quickly put together in record time of three months. Guidelines for approval and renewal of permits by each government departments were still not completed, which may affect entry of new biotech maize traits for commercialization. Future commercialization of Bt eggplant, Golden Rice, PRSV-R papaya and Bt cotton will be regulated under the new JDC. The government is putting forth a lot of efforts to capacitate the regulatory offices involved in the new JDC.
MYaNMaR
Myanmar maintained the adoption of insect resistant Bt cotton varieties, namely Ngwe chi-6 and Ngwe chi-9, on approximately 325,000 hectares, equivalent to an adoption rate of 93% of the 350,000 hectares of cotton grown in 2016 (Table 25). Bt cotton varieties Ngwe chi-6 and Ngwe chi-9 were developed by the Department of Industrial Crops Development (DICD) of the Ministry of Agriculture, Livestock and Irrigation (MOALI) and registered by Myanmar’s National Seed Committee (NSC) for commercial sale in Myanmar in 2010 and 2015, respectively. Approximately 460,000 small holder farmers (average of 0.7 hectare of cotton farm per farmer) planted the long staple Bt cotton variety
in the eleventh consecutive year of cultivation, 2006 to 2016. Both Bt cotton varieties “Ngwe chi-6” and “Ngwe chi-9” express cry1Ac gene and effectively controlled the infestation of Helicoverpa armigera, a major pest of cotton in Myanmar.
In 2016, Myanmar enacted “The PyidaungsuHluttaw Law No. 15, 2016” or “The New Plant Variety Protection Law 2016” on 20 January 2016 to protect intellectual property rights of breeders and secure investments in the seed sector (Table 26). The New Plant Variety Protection Law 2016 would come into force from the day of completion, one year after promulgation. The law aims to protect the rights of breeders of new plant varieties, develop plant breeding activities, encourage investments in and develop the breeding of new plant varieties in both public and private sectors, and assist agricultural sector development by producing and cultivating new improved varieties.
Myanmar
Year adoption of Bt
Cotton (ha)
total Cotton
(ha)
%adoption
2006-07 <500 300,000 <1%2007-08 8,300 368,000 2%2008-09 140,000 360,000 39%2009-10 270,000 360,000 75%2010-11 270,000 360,000 75%2011-12 283,000 358,000 79%2012-13 300,000 359,000 84%2013-14 305,000 360,000 85%2014-15 318,000 360,000 88%2015-16 325,000 350,000 93%2016-17 325,000 350,000 93%
table 25. adoption of Bt Cotton in Myanmar, 2006 to 2016
Source: Analyzed and compiled by ISAAA, 2016

Global Status of Commercialized Biotech/GM Crops: 2016
66
Myanmar is a member of the Convention of Biological Diversity (CBD) since 1994 and the World Trade Organisation (WTO) since 1995 and is bound by the WTO’s Trade Related Aspects of Intellectual Property Rights (TRIPs) agreement (Lwin Oo, 2016).
In the recent past, Myanmar enacted the Farmland Law in 2012 that allowed ‘land use rights’ to transfer, exchange, or lease their land. The Farmland Law had come into force, effective 31 August 2012 (President Office, 2012). Similarly, the Government introduced a new law the “Virgin and Fallow Land Law” in 2012 to increase arable land area by using virgin and fallow land. This will help meet the food production needs of a growing population, which is expected to increase from 59.13 million in 2009-10 to estimated 67.22 million in 2019-
2020. In order to promote the seed sector in the country, the Government has enacted Seed Law 2011 by the State Peace and Development Council (SPDC) of the Union of Myanmar on 7 January 2011, which came into force on 7 January 2013 (Shein, 2013).
The Seed Law 2011 set up a procedure for registration of a new variety of seed that needs to go through a process of three seasons of yield trials and two seasons of adaptability test followed by farmers’ field testing and approval by Technical Sub Committee (TSC) before registration by the National Seed Committee (NSC) in Myanmar. In recent years, the efforts were made by the Department of Agriculture (DOA) to promote public-private partnership in seed multiplication of open-pollinated varieties (OPV) and hybrids of rice, corn, cotton and
Myanmar
legislative system Scope of activities StatusNew Plant Variety Protection Law 2016
To protect plant breeders right Enacted on 20th January 2016Enforced on 20th January 2017
The Biosafety Law To regulate GM crops Draft prepared, Pending Enactment The Seed Law To maintain quality and supply of
seedsEnacted on 7th January 2011Enforced on 7th January 2013
The Farmland Law To allow a person with ‘land use rights’ to transfer, exchange, or lease his/her land
Enacted on 2012Enforced on 31st August 2013
The Virgin and Fallow Land Law
To promote the use of unused land
Enacted on 2012
The Fertilizer Law To manage the use of fertilizers Enacted and enforced on 1st December 2002
The Plant Pest Quarantine Law
To prevent quarantine pests entering into the country
Enacted and enforced in 1993
Formulation of the Pesticide Board
To regulate the use of pesticides Enforced on 25th February 1992
The Pesticide Law To regulate the use of pesticides Enacted on 11th May 1990
table 26. Policy and legislative Reform in Myanmar, 2016
Source: UNEP GEF, 2006; Lwin Oo, 2016; Shein, 2013; Shein & Myint, 2013; Aung and Thet, 2009; Compiled by ISAAA, 2016

Global Status of Commercialized Biotech/GM Crops: 2016
67
vegetable crops. In particular, the emphasis has been on enhancing collaboration with private seed companies to increase the availability of quality seeds by involving private companies such as CP Seeds Company for hybrid corn, Known You Seeds Company for melon and cucumber, Malar Myaing and other small seeds companies for vegetable seeds, Myat Min Seeds for rice and Bayer CropScience for hybrid rice and others. More recently, DuPont Pioneer has opened an office in Myanmar to use new technologies to modify seeds and set up a marketing network to provide high value and high yielding hybrid seeds of maize and rice to farmers in Myanmar (Myanmar Times, 2015).
In the past, the private sector faced a large challenge with respect to intellectual property protection of breeder seeds and regulatory system for genetically enhanced crops. By enacting the Plant Variety Protection Law 2016, which came into force on 20 January 2017, the private sector engagement in breeding of improved crop varieties of important crops such as rice, maize, sugarcane, cotton and vegetables will attract investment not only in establishing processing plants and distribution value chain but also in setting up of R&D and breeding station in different parts of the country. Table 2 shows the enactment of different laws to regulate and promote agriculture inputs including seeds, pesticides and fertilizer in Myanmar. Finally, Myanmar has to enact the draft Biosafety law to facilitate the introduction of improved seeds and biotechnology in the country. The Ministry of Agriculture, Livestock and Irrigation (MOALI) realized the shortcoming in the existing policy as well as rules and regulations and have made significant progress to create conducive environment for investment by multinational and national seed companies. Policy and legislative reforms in agriculture sector undertaken by the Government of
Myanmar were geared to attract foreign direct investments particularly in the seed industry development (Kyi, 2016). Notably, Myanmar has the potential to become the hybrid seed production center in the near future not only to cater to Asian Economic Community (AEC) but also to neighboring countries of the South Asian Association for Regional Cooperation (SAARC).
Benefits of Bt Cotton in Myanmar, 2010-2016
Brookes and Barfoot estimated that the farm income has enhanced due to the large scale adoption of Bt cotton varieties Ngwe chi-6 and Nagwe chi-9, provisionally estimated at US$308 million for the period 2006 to 2015 and the benefits for 2015 alone at US$47 million (Brookes and Barfoot, 2017, Forthcoming).
vietNaM
Vietnam commercialized its first biotech crop, maize, at a minimal hectarage of 3,500 hectares in 2015. In 2016, farmers adopted the technology fairly quickly with an estimated 10-fold increase to 35,000 hectares of stacked IR/HT varieties. Since 2015, 22 events approved for food, feed and cultivation: 14 events for maize and 8 events for soybean. For 2016 alone, 3 maize events were approved for food and feed including insect resistant event 5307 and MIR604, and stacked IR/HT TC1507. Four events were approved for cultivation since 2015 that includes: Bt11 x GA21, GA21, MON8904 and NK603.
As of December 2016, the Ministry of Agriculture and Rural Development (MARD) received 42 biotech event dossiers and has issued 18 certificates for use as food and feed events, all of which were for soybean and maize. The remaining 24 biotech events for soybean, maize, cotton, canola, sugar beet, and alfalfa are still under review.
Vietnam

Global Status of Commercialized Biotech/GM Crops: 2016
68
Field trials of new maize events were conducted in various locations in the country as a prerequisite for commercialization approval. A field trial for MON810 commenced on 17 March 2016 by Agricultural Genetics Institute of Vietnam and Pioneer Hi-bred Vietnam in Van Giang district, Hung Yen province. The Ministry of Agriculture and Rural Development approved the trials in January 2016 (CBU, 31 August 2016).
Another field trial was conducted by the Plant Protection Research Institute, in collaboration with Syngenta Vietnam Co. Ltd. for GM maize insect resistant MIR162 as well as stacked trait Bt11 x IR162 x GA21 in Son La starting 2 June 2016 (CBU, 31 August 2016).
Vietnam imports a number of biotech plant products including soybeans, soybean meal, soybean oil, maize and distillers dried grain, cotton, alfalfa and canola. These are utilized as feed for the country’s growing livestock and aquaculture sectors. The country has been dependent on imported biotech feed ingredients as domestic supplies are unable to fuel these sector’s growth. For example, Vietnam’s 2016 imports of maize increased to 2.9 MMT from 2.59 MMT in 2015 (USDA FAS GAIN Agribiotechnology 2016).
Biotech Regulation in vietnam
On 21 June 2010, Vietnam’s Prime Minister approved the Biosafety Decree 69/2010/ND-CP, replacing Vietnam’s 2005 Biosafety Regulation, its first ever such document. The Biosafety Decree provides the legal framework for the biosafety management of genetically engineered organisms, genetic specimens, and GM-derived products (with the exception of pharmaceutical products originating from GM). Although Decree 69 entered into force 10 August 2010, it was revised by Decree 108 in 2011 to make it compliant with the provisions of Vietnam’s Food Safety Law on the
management of food derived from agricultural biotechnology. Additionally, Decree 108 moved the responsibility of certification for food use from the Ministry of Health (MOH) to Ministry of Agriculture and Rural Development (MARD).
On 24 January 2014, MARD issued circular 2/2014/TT-BNNPTNT that promulgated the Approval Process of Issuing and Withdrawing Certification for Genetically Modified Plants for use as food and feed. The circular entered into force on 10 March 2014. At this point, companies submitted dossiers for different traits of food and feed approvals. Hence, MARD formed a committee consisting of 11 experts and scientists representing different Ministries including MARD for agriculture, MONRE (environment), MOH (health), MOIT (industry and trade), the Vietnam Academy of Sciences, the Vietnam Academy of Agricultural Sciences and Ho Chi Minh City’s Biotechnology Center, to review and evaluate the application dossiers. MONRE issues biosafety certificates for GM events that are already approved by MARD for use as food and feed.
Benefits of Biotech Crops in vietnam
A report on GM crops grown in southern Vietnam indicates that productivity has increased between 16.5% and 25% compared to non-GM crops (VN Express, 28 September 2016). This provides incentive for biotech maize farmers and future adopters. In summary, the need for an immediate source of livestock feeds where demand increases annually, and the government’s shift towards conversion of rice areas to maize paved the way for the commercialization of biotech maize in the country. Hence, from 3,500 hectares of biotech maize in 2015, a 10-fold increase to 35,000 hectares were planted in 2016. Various field trials of biotech maize are being conducted in prime maize areas of the country
Vietnam

Global Status of Commercialized Biotech/GM Crops: 2016
69
to evaluate biotech maize traits for possible commercialization. And, with the enabling policies of the government, other biotech crops and traits may gain approval for planting in the country, including biotech cotton and soybean.
BaNGladeSh
In the last three years, Bangladesh cautiously advanced the commercial planting of Bt brinjal/eggplant from two hectares planted by 20 farmers in 2014, the first year of commercial planting, to a remarkable 700 hectares planted by 2,500 farmers in 2016. Bt brinjal is the country’s first genetically modified crop that protects brinjal from the deadly fruit and shoot borer (FSB). The fruit and shoot borer (Leucinodes orbonalis) is one of the major insect-pests of brinjal, which causes losses of up to 70% in commercial plantings.
The winter season of 2016 was the turning point for large scale adoption of Bt brinjal in Bangladesh. Smallholder brinjal farmers who cultivate brinjal on approximately 50,000 hectares in summer, winter and spring seasons increased planting of Bt brinjal to 700 hectares in 2016, a 28-fold increase over 2015 (Table 27). Brinjal farmers in Bangladesh could choose from four Bt brinjal varieties popularly known as Bt Uttara, Bt Kazla, Bt Nayantara and Bt ISD-006 approved for commercial cultivation in four major brinjal growing regions: Gazipur, Jamalpur, Pabna and Rangpur.
The majority of farm-level plantings of Bt brinjal in 2014 and 2015 were part of the farm demonstrations closely monitored and executed by the Bangladesh Agricultural Research Institute (BARI) and the Department of Agricultural Extension (DAE) of the Government of Bangladesh. These farm demonstrations commenced in 2013-2014 starting with 20 farm demonstrations and have increased to 500 for 2016-2017 (Figure 7).
Farmers’ opinion of growing Bt brinjal based on data collected and analyzed during the field demonstrations in 2014 and 2015 by BARI and DAE concluded that farmers’ preference of growing Bt brinjal because:
– Farmers need not undertake sorting of infested/non-infested brinjal fruits as Bt brinjal varieties were free from infestation of the fruit and shoot borer;
– The cost of production of Bt brinjal was significantly lower due to almost no applications of insecticides for control of the fruit and shoot borer; and,
– Farmers obtained higher gross margin due to the bounty of additional fresh healthy brinjal fruits resulting in higher marketable fruits.
Thus, in response to the growing interest by smallholder farmers in Bt brinjal, the Bangladesh Agricultural Research Institute (BARI) produced breeder seeds of Bt brinjal varieties namely BARI Bt begun-1 (Bt Uttara); BARI Bt begun-2 (Bt Kajla); BARI Bt begun-3 (Bt Nayantara); BARI Bt begun-4 (Bt Iswardi or ISD006). In total, BARI produced 90 kg of Bt brinjal breeder seeds in 2014-15, 875 kg in 2015-16 and around 1,500 kg in 2016-17 (Figure 8).
In 2016, the Government of Bangladesh made
Bangladesh
Year adoption of Bt
brinjal (ha)
total brinjal area (ha)
Nos. of Bt
brinjal farmers
%adoption
2014 12 50,000 120 <12015 25 50,000 250 <12016 700 50,000 2,500 2
table 27. adoption of iR (Bt) Brinjal in Bangladesh, 2016
Source: Analyzed and compiled by ISAAA, 2016

Global Status of Commercialized Biotech/GM Crops: 2016
70
notable progress on R&D of GM crops and the regulatory framework and approval process of GM crops:
– Submission of application for commercial release of an additional three varieties of Bt brinjal namely BARI Bt begun-5 (Bt Dohazari); BARI Bt begun-6 (Bt Khatkhatia) and BARI Bt begun-7 (Bt Singnath)
– Field trials of two additional Bt brinjal varieties namely Bt brinjal variety BARI Bt begun Islampuri and BARI Bt begun Chega
– Submission of an application seeking approval for the commercial release of the late blight resistant LBR Potato variety BARI Potato-8 (Diamant) using single RB gene technology developed by the Tuber Crop Research Center of BARI
– Submission of application for import of double gene (cry1Ac and cry2Ab) Bollgard-II Bt cotton event MON15985 for conducting field trials in 2017 by BARI and the Cotton Development Board of Bangladesh and,
– Notification of the Guidelines for the Environmental Risk Assessment (ERA)
of Genetically Engineered Plants by the Bangladesh Ministry of Environment and Forests.
Bangladesh’s Seventh five Year Plan 2016-2020
Recognizing that the effects of climate change threaten food security and the agricultural economy of Bangladesh, the Government of Bangladesh laid greater emphasis on R&D in agriculture in the Seventh Five Year Plan 2016–2020 launched on 11 November 2015. In particular, a rise in sea levels and unusual weather patterns will affect crop production and food security, which ultimately causes malnutrition and poverty. The Government of Bangladesh Seventh Five Year Plan 2016-2020 is focused on crop improvement in the following areas:
– Research to improve on yield and quality;
– Development of High Yielding Varieties (HYV) having at least a 10% yield advantage over existing mega varieties;
– Development of hybrid and biotech/transgenic crop through strengthened
Bangladesh
figure 7. BaRi/dae field demonstration of iR (Bt) Brinjal in Bangladesh, 2014 to 2016
2013-14
20
108
250
500
2014-15 2015-16 2016-17
Number of farm demonstrations
figure 8. Bt Brinjal Breeder Seed Production by BaRi, 2014 to 2016
2014-15
90
875
1,500
2015-16 2016-17
Bt Brinjal Breeder Seeds (kg)
Source: BARI, 2016; Analyzed by ISAAA, 2016Source: BARI, 2016; Analyzed by ISAAA, 2016

Global Status of Commercialized Biotech/GM Crops: 2016
71
capacity and initiate basic research to support applied and adaptive research;
– Research on climate SMART agriculture, breeding and introduction of climate resilient varieties for saline and drought tolerant, heat & cold tolerant, submergence etc.;
– Development and refining of technologies that will bridge yield gaps; and,
– Upgrading the crop research facilities at the Agriculture Research Institutes (ARIs) including developing land, laboratories, training facility and infrastructure (GOB, 2015).
The Seventh Five Year Plan 2016-2020 set the roadmap for policy makers and researchers to develop biotic and abiotic stress tolerant crops including diseases, saline and drought-tolerant crops in order to mitigate negative effects of climate change on agriculture and food production. Bangladesh is projected to increase food production of rice from 34 million tons in 2015 to 37 million tons in 2021, wheat from 1.16 to 1.4 million tons in 2021, potato from 8.7 million to 10.3 million tons in 2021 and maize from 1.6 million tons to 1.85 million tons in 2021 (GOB, 2015). The five year plan 2016-2020 also emphasized the involvement of the private sector in the research and development of hybrid and HYV seed. Additionally, the 2016-2020 plan called for expansion of seed production activities through biotechnology and hybrid seed production. The Bangladesh Agricultural Research Institute (BARI) has devised a robust research plan and activities to expand the area of approved Bt brinjal varieties and develop new varieties of GM potato, GM cotton, GM rice and GM tomato.
Biotech crops in the pipeline
Late Blight Resistant PotatoPotato, an important crop in Bangladesh, is
grown on over half a million hectares producing 8.9 million tons of potato annually. The average potato yield in Bangladesh is about 19 tons per hectare, significantly lower than world average due to heavy infestation of late blight disease. Farmers in Bangladesh spend US$60.35 (Bangladeshi Takka 5,000) per hectare annually to apply 400-500 metric tons of fungicide to control late blight disease. In order to control late blight disease, BARI’s Tuber Crop Research Center in collaboration with ABSP-II has developed a late blight resistant (LBR) potato variety namely BARI Potato-8 popularly known as Diamant by introgressing RB gene sourced from Solanum bulbocastonum in 2007. BARI has conducted backcrossing, contained and confined multi-location field trials of LBR potato over the last several years (Table 28).
BARI has also carried out the food and feed safety studies including compositional, toxicological and environmental risk analysis as per the regulatory guidelines including Bangladesh Guidelines for Food Safety Assessment of GM Plant and the Guidelines for Environmental Risk Assessment of GM Plants. In December 2016, BARI prepared and submitted a biosafety dossier on LBR potato for its commercial release to the National Committee on Biosafety (NCB) of the Ministry of Environment and Forests (MOEF) in December 2016. Simultaneously, BARI’s Tuber Crop Research Center started a collaborative research project to develop a late blight resistant potato variety using multiple gene technology in collaboration with Michigan State University (MSU) in October 2015. It is expected that the National Committee on Biosafety of MOEF of the Government of Bangladesh will consider approval of the commercial release of the first generation LBR potato expressing RB gene sometime in 2017 (Ahmad, 2016).
Biotech RiceBRRI, in collaboration with the International Rice
Bangladesh

Global Status of Commercialized Biotech/GM Crops: 2016
72
Research Institute (IRRI), has developed and conducted field trials of provitamin-A enriched GR2-E Golden Rice event expressing beta-carotene in widely grown high-yielding boro-rice variety BRRI dhan-29 in 2016. Subsequently, BRRI has sought permission from the National Committee on Biosafety to conduct multi-location confined field trials at different regional stations in 2017. Another important rice project at the advanced stage of development is to develop a salt tolerant high yielding variety of rice that expresses pea DNA helicase gene developed by the Department of Biochemistry and Molecular Biology at Dhaka University (DU), Bangladesh. Similarly, BRRI has conducted a contained greenhouse trial of salt tolerant HYV rice expressing the pea DNA Helicase gene to impart tolerance to salinity.
Biotech CottonBangladesh is the second largest importer of cotton fiber and uses approximately 4 to 4.5 million bales of cotton to spin products for the textile sector. Domestic raw cotton production is abysmally low, with an annual production rate of 150,000 bales from a total cotton area of 40,000 hectares planted by 70,000 farmers.
Bangladesh can only meet 2-3% of the total raw cotton demand of the textile sector and hence relies heavily on imported raw cotton and fibers from India, USA and Uzbekistan. The Cotton Development Board (CDB) of the Ministry of Agriculture estimates that the demand for cotton fiber will increase by three-fold from 800,000 tons in 2014 to 2,500,000 tons by 2020 driven by the global demand for clothing and textiles manufactured in Bangladesh (Uddin, 2014). In order to increase the domestic supply of raw cotton, the Government of Bangladesh has made a commitment to increase cotton production by introducing new and improved varieties of cotton hybrids and genetically modified Bt cotton. Neighboring countries including India, China, Myanmar and Pakistan have already introduced Bt cotton and significantly increased cotton production in the last couple of years. In recent years, the Cotton Development Board has field tested single gene Bt cotton hybrid sourced from Chinese Hubei Seeds in 2015-16. However, the confined field trial of Bt cotton hybrid in 2015-16 hasn’t shown adequate protection against Helicoverpa armigera and delivered insignificant yield advantage over non-Bt cotton hybrid. In 2016-17, the Cotton Development Board of
Bangladesh
Year Nos. of lBR Potato Clones
lBR Potato trial locations Status
2008-09 >300 clones CFT 2 locations 87 hybrids 2009-10 87 hybrids CFT 2 locations Selection completed2010-11 10 clones Multi-location trial (MLT)
under CFT2 locations 8 hybrid clone
2011-122012-13
8 clones MLT under CFT 6 locations 6 hybrid clone
2013-14 6 clones MLT under CFT 6 locations 6 hybrid clone2014-15 6 clones Regulatory trial under CFT 6 locations 1 hybrid clone2015-16 1 clone Regulatory trial under CFT 6 locations Trial completed
table 28. Chronology of development of lBR Potato in Bangladesh, 2008 to 2016
Source: BARI 2016; Analyzed by ISAAA 2016

Global Status of Commercialized Biotech/GM Crops: 2016
73
Bangladesh sought import permit from the Ministry of Agriculture to import seeds of Bt cotton variety expressing two genes (cry1Ac and cry2Ab) Bollgard-II event MON15985 from Mahyco in India. It is expected that the Cotton Development Board will conduct a contained field trial of BG-II cotton hybrid at BARI facility in year 2017.
In summary, the large scale planting of IRE (Bt) brinjal has resulted in a substantial reduction in insecticide applications and lowered the cost of producing a more bountiful harvest of blemish-free brinjal fruits eagerly awaited by customers in the marketplace. Bt brinjal helped farmers save US$120.70 (Bangladeshi Taka 10,000) per hectare on pesticide applications for controlling FSB in 2014 and 2015. Experiments to-date showed that Bt brinjal increases yield by at least 30% and reduces the number of insecticide applications by a massive 70-90%, resulting in a net economic benefit of US$1,868 per hectare over non-Bt brinjal. Thus, it is estimated that at the national level, Bt brinjal has the capacity to generate a net additional economic benefit of US$200 million per year for around 150,000 brinjal growers in Bangladesh. Biotech late blight resistant potato, Golden Rice and insect resistant cotton are in the various stages of field testing for future introduction in the country to address economic and nutrient-deficiency problems.
future Prospects of Biotech Crops in asia and the Pacific:
Biotech crops planted in the eight biotech crop countries of Asia and the Pacific ranged from fiber (cotton), feed (maize and canola) and food (maize, eggplant). Adoption of these biotech crops varied in 2016: India and China’s biotech cotton planting were extremely affected by low global cotton prices, while Pakistan and Myanmar maintained their biotech cotton area. The area planted to biotech maize in the
Philippines and Vietnam increased due to high demand for livestock and poultry feeds, as well as favorable weather conditions. In Australia, favorable weather conditions after two years of drought permitted an increase in planting of biotech cotton and canola. In addition, farmers were provided BollgardIII/RR®Flex cotton for extreme insect pest protection with herbicide tolerance. Bangladesh increased its Bt eggplant planting to 700 hectares and more brinjal varieties with Bt gene are being field tested for future commercialization.
There are still huge hectarage potential for biotech maize in China, Vietnam, the Philippines, and Pakistan, as well as biotech cotton in Vietnam, Bangladesh, and the Philippines. In China, the food and manufacturing industry considers potato a fourth staple and has renewed interest in its research, development and production. The upcoming biotech potatoes with non-bruising, low acrylamide lowered reducing sugar and late blight resistant as well as beta-carotene enriched Golden Rice will help address malnutrition and hunger in the Asia Pacific region.
the euRoPeaN uNioN (eu 28)
Cultivation of biotech crops in the EU (28) has been limited to a few countries since 1998. In 2016, four countries – Spain, Portugal, Czechia and Slovakia – cultivated IR maize event MON810, the only biotech event approved in the EU. The total biotech crop area in the four countries was estimated at 136,363 hectares, a significant increase of 19,493 hectares or 17% from 116,870 (Table 29). Spain leads the four countries, planting 129,081 hectares, followed by Portugal (7,069 hectares), Slovakia (138 hectares), and Czechia at 75 hectares.
The EU has been importing biotech crops for local livestock and poultry industry. Since 1998, there are now 95 biotech events approved for
The European Union (EU 28)
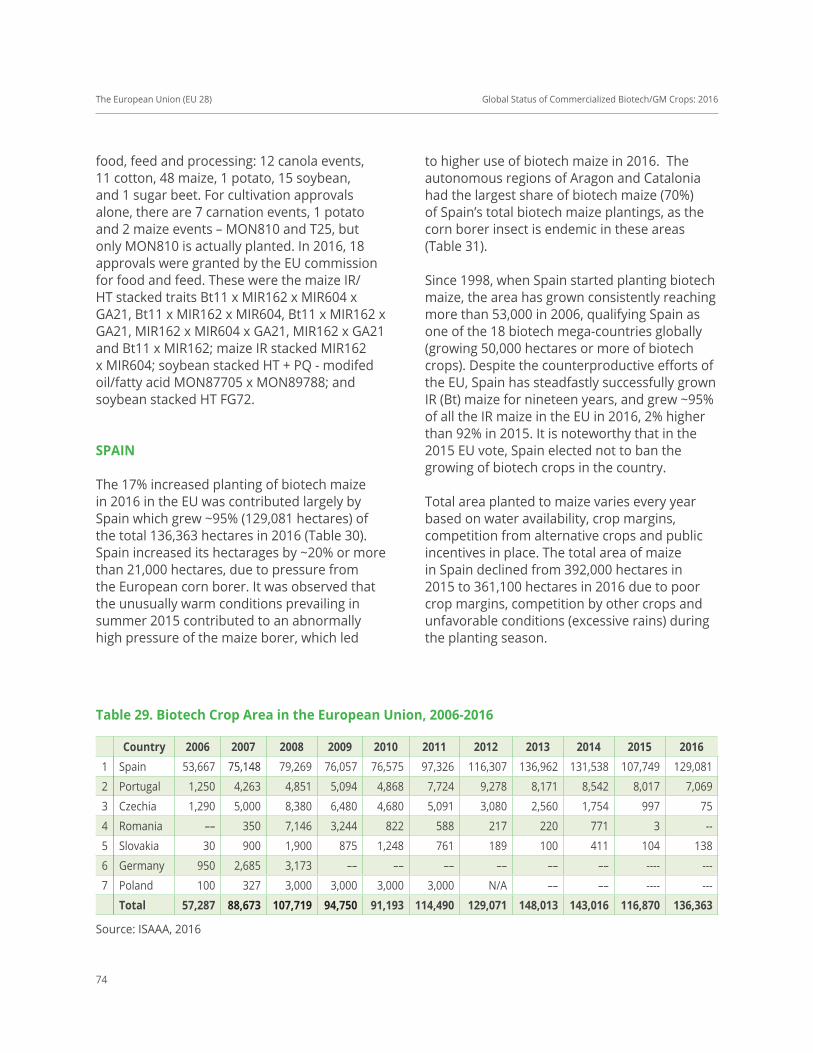
Global Status of Commercialized Biotech/GM Crops: 2016
74
The European Union (EU 28)
Country 2006 2007 2008 2009 2010 2011 2012 2013 2014 2015 20161 Spain 53,667 75,148 79,269 76,057 76,575 97,326 116,307 136,962 131,538 107,749 129,081
2 Portugal 1,250 4,263 4,851 5,094 4,868 7,724 9,278 8,171 8,542 8,017 7,069
3 Czechia 1,290 5,000 8,380 6,480 4,680 5,091 3,080 2,560 1,754 997 75
4 Romania –– 350 7,146 3,244 822 588 217 220 771 3 --
5 Slovakia 30 900 1,900 875 1,248 761 189 100 411 104 138
6 Germany 950 2,685 3,173 –– –– –– –– –– –– ---- ---
7 Poland 100 327 3,000 3,000 3,000 3,000 N/A –– –– ---- ---
total 57,287 88,673 107,719 94,750 91,193 114,490 129,071 148,013 143,016 116,870 136,363
table 29. Biotech Crop area in the european union, 2006-2016
Source: ISAAA, 2016
food, feed and processing: 12 canola events, 11 cotton, 48 maize, 1 potato, 15 soybean, and 1 sugar beet. For cultivation approvals alone, there are 7 carnation events, 1 potato and 2 maize events – MON810 and T25, but only MON810 is actually planted. In 2016, 18 approvals were granted by the EU commission for food and feed. These were the maize IR/HT stacked traits Bt11 x MIR162 x MIR604 x GA21, Bt11 x MIR162 x MIR604, Bt11 x MIR162 x GA21, MIR162 x MIR604 x GA21, MIR162 x GA21 and Bt11 x MIR162; maize IR stacked MIR162 x MIR604; soybean stacked HT + PQ - modifed oil/fatty acid MON87705 x MON89788; and soybean stacked HT FG72.
SPaiN
The 17% increased planting of biotech maize in 2016 in the EU was contributed largely by Spain which grew ~95% (129,081 hectares) of the total 136,363 hectares in 2016 (Table 30). Spain increased its hectarages by ~20% or more than 21,000 hectares, due to pressure from the European corn borer. It was observed that the unusually warm conditions prevailing in summer 2015 contributed to an abnormally high pressure of the maize borer, which led
to higher use of biotech maize in 2016. The autonomous regions of Aragon and Catalonia had the largest share of biotech maize (70%) of Spain’s total biotech maize plantings, as the corn borer insect is endemic in these areas (Table 31).
Since 1998, when Spain started planting biotech maize, the area has grown consistently reaching more than 53,000 in 2006, qualifying Spain as one of the 18 biotech mega-countries globally (growing 50,000 hectares or more of biotech crops). Despite the counterproductive efforts of the EU, Spain has steadfastly successfully grown IR (Bt) maize for nineteen years, and grew ~95% of all the IR maize in the EU in 2016, 2% higher than 92% in 2015. It is noteworthy that in the 2015 EU vote, Spain elected not to ban the growing of biotech crops in the country.
Total area planted to maize varies every year based on water availability, crop margins, competition from alternative crops and public incentives in place. The total area of maize in Spain declined from 392,000 hectares in 2015 to 361,100 hectares in 2016 due to poor crop margins, competition by other crops and unfavorable conditions (excessive rains) during the planting season.

Global Status of Commercialized Biotech/GM Crops: 2016
75
Spain
Countries area (Million hectares)
Y/Y diff (%) Percentage of total Biotech Crops (%)
2015 2016 2015 2016Spain 107,749 129,081 21,332 (20%) 92.2% 94.6Portugal 8,017 7,069 -948 (-12%) 6.9% 5.2Czechia 997 75 -922 (-92%) 0.85% 0.1%Slovakia 104 138 34 (33%) 0.1% 0.1%Romania 3 <0.01%
total 116,870 136,363 19,493 (17%)
table 30. Biotech Maize hectarage and adoption in 2015 and 2016
Source: ISAAA, 2016
Country 2012 2013 2014 2015 2016Aragon 41,669 54,451 54,041 42,612 46,546Catalonia 33,531 33,996 36,381 30,790 41,567Extremadura 15,952 16,979 13,815 9,827 15,039Navarra 5,801 7,013 7,264 6,621 8,066Castile-La Mancha 7,883 8,766 7,973 5,734 5,932Andalusia 10,362 12,862 10,692 11,471 10,919Others 1,109 2,895 1,371 695 1,011total 116,307 136,962 131,538 107,749 129,081
table 31. area of Biotech Maize by Region in Spain (hectares)
Source: ISAAA, 2016
Maize yield in Spain rose from 8.5 tonnes per hectare to 116.5 tonnes per hectare, allowing Spain to retain its status as the highest yielding producer in the EU. Adoption of GM maize in Spain is also enhanced by a relatively relaxed distribution chain without segregating GM and non-GM maize.
Spain continues to defend a science-based and pragmatic approach to agricultural biotechnology with regards to both cultivation and imports. Field trials are also allowed in Spain subject to prior notice and authorization.
Notifications to competent authorities for open field testing continue to decline steadily due to the unattractive investment environment for seed companies. Thus, all notifications for deliberate release have been withdrawn by the requester, and for the first time since 2003, no new field trials are being carried out in Spain.
MON810 is the only GM event approved for cultivation in the EU, so growth is limited to the size of the maize plantings in those areas were the European corn borer represents a problem. Approvals of new traits for cultivation could

Global Status of Commercialized Biotech/GM Crops: 2016
76
raise the interest for genetically modified crops in other regions of the country.
PoRtuGal
Biotech IR (Bt) maize planting in Portugal was reduced from 8,017 hectares in 2015 to 7,069 hectares in 2016, a 12% decrease (Table 29 and Table 30). Maize area in 2016 has been gradually declining since 2014, and so has biotech maize area (Table 32). Alentejo, the lead producer in the country occupying 47% of the total biotech maize in 2016 had reduced planting by 32% (1,596 hectares). This is due to a decline in total maize area, the tight crops margins of maize caused by its low market price in the country. In addition, water supply became a problem in Alentejo, the top maize producing region (USDA FAS GAIN in Agribiotechnology in Portugal, 2016).
Portugal allows for the cultivation of biotech crops, following all EU regulations while preserving farmers and consumer’s choice. The Government has traditionally followed a
science-based decision-making process but more recently, the country has moved towards a case-by-case approach. As with the other EU countries, Portugal is a net importer of grains and oilseeds as the domestic production is not sufficient to meet the livestock sector demand. Exports of biotech products are negligible, as the feed industry uses the products internally.
Portugal imports its raw materials for food and feed, and strongly supports plant biotechnology as a means of achieving higher competitiveness. Feed producers and livestock breeders actively voice out their opinions to ensure that they can compete equally and produce using the same technology as their main competitors. Annually, the country imports on average about 3 million MT of grains and about 875,000 MT of soybeans and 170,000 MT of soybean meal from Ukraine, US, Brazil and Argentina, as its domestic feed grain production is not large enough to meet livestock industry demand.
Further expansion of biotech maize plantings in Portugal is limited by a number of factors:
a. MON810 is the only biotech event
Portugal
Country 2011 2012 2013 2014 2015 2016 % of total Biotech (2016)
Total Maize 137,000 143,000 147,000 137,000 126,000 118,000Norte 209 165 85 78 60 100 1%Centro 758 774 853 933 1,013 1,485 21%Lisboa 2,294 2,322 2,215 2,074 2,002 2,138 30%Alentejo 4,460 5,796 5,041 5,457 4,942 3,346 47%Algarve – 13 8 0 0 0Açores 3 208 0 0 0 0total Biotech 7,724 9,278 8,202 8,542 8,017 7,069adoption Rate 5.6% 6.5% 5.6% 6.2% 6.4% 6.0%
table 32. area of Biotech Maize by Region in Portugal, 2011-2016 (hectares)
Source: ISAAA, 2016
Global Status of Commercialized Biotech/GM Crops: 2016
77
approved for cultivation in the EU, hence, the use of biotech maize is restricted to European corn-borer (ECB) affected areas. Approvals of new traits for cultivation could raise the interest for GM crops in other areas.
b. The use of maize for food purposes also limits GM maize expansion as food manufacturers continue to avoid the ‘contains GMOs’ wording in labels.
c. The impact of corn borer in final yields of maize intended for is smaller, hence, the use of GM maize is rather limited.
d. The small average farm size that prevails throughout the country also sets a barrier for GM maize crop expansion. In order to fulfill coexistence rules, smaller farmers need to come to agreements to increase GM areas. Bigger farms can implement coexistence with their farm.
The asynchronous approval of biotech events cultivated in the United States but not yet authorized for import to the EU-28 remains the main trade barrier. In addition, the limited allowance for adventitious presence for non-approved events continues to constrain traders, who carry out a no-risk policy in their purchases. On the other hand, the seed trade is affected by the zero tolerance of adventitious presence. The fact that the EU only allows cultivation of MON810, serves as a trade barrier for U.S. seed exports containing or with adventitious presence of other GM events.
SlovaKia
Slovakia grew its first commercial biotech crop, IR maize in 2006 when 30 hectares were grown for commercial production by several farmers. In 2016, the country planted 138 hectares of biotech IR maize, an increase of 34 hectares or 33% over 2015 (Table 29 and Table 30). The increase of IR maize hectarage in Slovakia in
2016 was attributed to corn borer infestation in the corn-growing areas of the country. It was estimated that from a third to a half of the maize areas in Slovakia was infested with European corn borer, hence IR maize offers significant benefits.
Since 2006, Slovakia has been increasing biotech maize plantings, reaching a peak 30-fold from 30 hectares to 900 hectares in 2007, and in 2008 it again increased by over 111% to 1,931 hectares. The decline in biotech maize planting in the succeeding years may be due to the government requirement for laborious reporting which is a significant disincentive for farmers seeking to plant IR maize for the benefits it offers.
Yield gains conferred by IR maize have been measured at 10 to 15%. The average gain per hectare from IR maize was estimated at US$45 to US$100 per hectare. Thus, at the national level, the income gain for farmers, assuming 100,000 hectares of IR maize, would be in the range of US$4.5 million to US$10 million annually. It is noteworthy that in the recent EU vote, Slovakia elected not to ban the growing of biotech crops in the country.
Slovakia maintains a scientific approach towards biotechnology and considers the use of biotech crops as a way to increase agricultural productivity and sustainability. The Slovak Ministry of Agriculture strictly regulates the use of biotechnology; nonetheless its scientific approach has supported the use of IR maize for biogas production and animal feed. Slovakia has been one of a few EU member states to allow the conduct of field trials of various bioengineered events.
As an EU member state, Slovakia can only grow maize with the MON810 event which has been approved by the EU for all of its 28 member countries. Slovakia grows maize for grain and silage. Data on total plantings of maize in 2016
Slovakia

Global Status of Commercialized Biotech/GM Crops: 2016
78
was not available when this Brief went to press, however, FAOSTAT (2016) reports a 216,816 total maize hectares harvested in 2014. There is thus, a huge potential for new insect resistant biotech maize with herbicide tolerance such as the various IR/HT stacked maize events. In addition, introduction of new biotech crops and traits that will limit the import of raw materials for feeds such as soybean would be beneficial to the livestock and poultry industries.
Benefits from Biotech Crops in Slovakia
It was estimated that from a third to a half of the 240,000 hectares of maize in Slovakia were infested with European corn borer with the most severe infestations were in the south of the country where most maize is grown. Yield gains conferred by IR maize have been measured at 10 to 15%. The average gain per hectare from IR maize is estimated at US$45 to US$100 per hectare. Thus, at the national level, the income gain for farmers, assuming 100,000 hectares of IR maize, would be in the range of US$4.5 million to US$10 million annually.
CzeCh RePuBliC
In Czech Republic, the area planted to biotech maize continued to decline. In 2016, only 75 hectares of biotech maize were planted, a decrease of 922 hectares from 997 hectares planted in 2015 (Table 29 and Table 30). Czech farmers have been growing biotech IR (Bt) maize since 2005 in increasing hectarages from 250 hectares that peaked in 2008 at 8,380 hectares. From then on, farmers were planting a decreasing area with the lowest in 2016 at 75 hectares due to the inconvenience of stringent reporting requirements for IR maize resulting in less incentive for farmers and all stakeholders seeking to capture the benefits offered by IR maize. A field trial in 2016 was conducted on an area slightly over 3 hectares, including buffer
zones. Maize is used in biogas production and in on-farm cattle feed, eliminating the need for commercial marketing of the product.
In 2010, Czech Government approved the cultivation of “Amflora” potatoes which produces a higher starch content for industrial applications. The cultivation of biotech potato Amflora stopped after BASF transferred its operations to the United States due to the hostile political climate towards GM crops in Europe.
The Czech Republic maintains a scientific approach towards biotechnology following the country’s legislation and administrative process for contained use of genetic engineering, as well as EU directives. Further slight legislative changes are foreseen in 2017 to make the current legislation more comprehensive. Czech scientists and farm groups are vocal in their support for more crop biotechnology and do not hesitate to publicly dispel myths spread by some non-governmental entities. Czech Ministries vote for new biotechnology events at the EU, both for import and for cultivation. Czechs supported the option for other member states to impose biotech cultivation bans, citing position of strict neutrality on such scientific issues and to support other members’ decisions, as they expect support for their own decisions to utilize the technology.
Czech farmers use the locally produced IR (Bt) maize for livestock feed and feedstock for biogas. The country imports GM crops and biotech soybean meal, a main protein source for feed mixes. In 2015, the soybean meal imports totaled 407,000 metric tons (MT) from Brazil, Malaysia and United States.
Benefits from Biotech Crops in Czechia
The Phytosanitary Service of the Government estimated that up to 90,000 hectares were
Slovakia

Global Status of Commercialized Biotech/GM Crops: 2016
79
infested with European corn borer (ECB), and that up to 30,000 hectares were being treated with insecticide to control ECB. In trials with IR maize, yield increases of 5 to 20% were being realized, which is equivalent to an increase of about US$100 per hectare. Based on 30,000 hectares of IR deployed, the income gain at the national level could be of the order of US$3 million per year.
Zdeňka Svobodová et al. (2015) conducted a study on the Risk Assessment of Genetically Engineered Maize Resistant to Diabrotica spp.: Influence on Above-Ground Arthropods in the Czech Republic. The following is the unedited abstract reproduced in its entirety.
“GM crops have significant potential for effective pest management while conserving beneficial natural enemies, including the diversity of generalist parasitoids and predators. However, implementation of any GM event in most European countries has been hindered by fears of unpredictable environmental damage. The mistrust might be overcome by research such as this study but educational programs for growers and policy makers are also required. The deployment of GM maize MON88017, expressing the Cry3Bb1 toxin is a promising strategy for controlling a new and dangerous pest that continues to spread in Europe inspite of insecticide treatments. The tolerance of current GM maize to the herbicide glyphosate provides an additional advantage for growers. Our analyses showed mostly similarity of abundance and diversity of above-ground arthropods in maize with the same genetic background, for both IR (MON88017) and non-IR (DK315) untreated or insecticide treated. Hybrids KIPOUS and PR38N86 showed some differences in species abundance
relative to the IR maize and its near-isogenic hybrid; this was probably due to the distinct hybrids’ characteristics. Since we did not detect any detrimental environmental effect of MON88017, this GM crop should be acceptable in the EU as the best alternative for curbing the spread of D. v. virgifera.”
Need for eu to Change Stance on Biotech Crops
In the EU (28), only four countries maintained biotech maize planting in 2016 excluding Romania. Farmers in Romania decided not to plant biotech crops in 2016 as complex traceability rules discouraged farmers. Feed manufacturers and livestock farmers prefer to avoid segregation in the warehouse and to reduce paperwork associated with adoption of biotech maize.
Biotech scientists and experts opine that the EU’s biotechnology stance is not addressing the needs of the region. Many think that the EU will not change its position any time soon since parliament is heavily influenced by environmentalist groups. The anti-biotech movement spent over US$10 billion globally fighting biotechnology while research and development spending by the public and private sectors was only US$8.6 billion in 2016 (Producers.com, 23 June 2016). The EU’s regulatory system is in gridlock and developers of biotech crops are facing three to five year delays in getting new varieties approved. Some traits have been in the system bucket for more than a decade. These regulatory delays are greatly reducing returns on investment for developers of biotech crops, which cost an average of US$136 million to develop and commercialize.
The introduction of an EU directive to shift GM approvals from the EU commission to the
Need for EU to Change Stance on Biotech Crops

Global Status of Commercialized Biotech/GM Crops: 2016
80
member states was immediately accepted by 19 of the 28 members who opted to ban GM crops in their countries. This ruling made the recent decision by France’s highest administrative court the Conseil d’Etat to overturn a 2014 French ban on the cultivation of the genetically modified maize MON810 for the third time, ineffective (Reuters, 15 April 2016). Thus, from a continent that supports one-third of the research 20 years ago when GM crops were commercialized, only 10% of the global agricultural research and development money is spent in the EU (Producers.com, 23 June 2016).
On top of this, the continent’s need for livestock and poultry feeds as well as for manufacturing have been increasing. In 2016/2017, EU farmers are expected to annually harvest 2.2 million metric tons of soybeans, but this is dwarfed by the 32 million metric tons of soybean the continent imports annually (Capital Press, 21 December 2016). EU also imports large quantities of maize (2.5 million tonnes), oilseed rape (2 million tonnes) and cotton (0.1 million tons) annually. It is estimated that the share of GM products in total imports is estimated at around 90% for soybeans, less than 25% for maize, and less than 20% for rapeseed (USDA FAS Gain Agribiotechnology EU 2016).
Ireland, the country most vocal for its non-GMO stance imports approximately three million tonnes of animal feed each year, with half of it coming from Argentina, Brazil, Canada, Ukraine and the USA, the top producers of biotech feeds. In 2014, over 1.2 million tonnes of GM maize products and soya were imported for animal feed.
Indeed as the global cultivation of GM crops expands, it is increasingly difficult for European importers to source non-biotech soybean products. It is thus high time for the EU to get its act together and do something fast before the system backfires.
The report Cultivating the Future was published by the Agricultural Biotechnology Council on 14 December 2016 to mark the 20th anniversary of the commercialization of biotech/GM crops. The report concluded that Europe is mired in a ‘shallow debate’ around GM technology while the rest of the world benefits from advances in farm technology. This debate is unsustainable and risks imposing a great cost on farms and on the environment. The series of essays, authored by leading plant scientists, academics, trade bodies and politicians, analyses numerous breakthroughs in plant technology and new approaches to food and farming over the past 20 years (Farmers Weekly, 2016).
united Kingdom’s exit (BRexit) from the eu Could open GM opportunities.
The United Kingdom’s (UK) exit from the European Union in the last quarter of 2016 may open doors for the entry and adoption of biotech crops in the country. The government’s agriculture minister George Eustice voiced enthusiasm on the possibility for future arrangements for GM crop regulations. The National Institute of Agriculture Botany (NIAB) said that critical issues such as market demand, the potential size of the market relative to the levels of investment required and the UK’s trading relationship with the EU must all be factored into any commercial decision to bring a GM crop to the market. Experts believe that Britain’s farmers need access to the latest developments in agricultural science and technology to compete on a global stage. In addition, Brexit presents an opportunity for the UK to develop a more enabling policy and regulatory environment to harness and exploit its world leadership in plant science, attracting private sector investment, promoting technology-based exports and international research collaboration, and supporting crop-based innovation on a global basis (CBU, 3 November 2016).
Need for EU to Change Stance on Biotech Crops

Global Status of Commercialized Biotech/GM Crops: 2016
81
Benefits of Biotech Crops
The EU (including Spain) is estimated to have enhanced farm income from biotech maize by US$275 million in the period 2006 to 2015 and the benefits for 2015 alone is US$21 million (Brookes and Barfoot, 2017, Forthcoming).
future Prospects of Biotech Crops in the eu
The trend in biotech crop planting in the four member countries of the EU manifests the prevailing issues and acceptance of biotech crops in the region. In Spain and Slovakia, increases in biotech maize planting were due to favorable farmers’ decision to plant insect resistant maize because of the devastating European corn borer infestation. In Portugal, in addition to the low market price of maize, a drought spell affected the highest maize producing state Alentejo. This resulted in a decline in total maize area and consequently the biotech maize area. In Czech Republic however, the continuing decline in biotech crop planting was due to the inconvenience of stringent reporting requirements for IR maize resulting in less incentive for farmers and all stakeholders seeking to capture the benefits offered by IR maize. This issue also affected Romania in 2016, which, similar to the other countries have opted to grow GM crops after the EU directive was issued back in 2015. Thus, for 2016, there was no biotech maize planting in Romania.
Any possible expansion of biotech crops in these countries includes the approval of new crops and traits that will address the recurring problem of corn borer infestation such as the various IR/HT maize technology. In addition, drought tolerant maize available in the US and a product similar to the biotech maize with drought and insect resistance from the WEMA Project, could benefit farmers in Portugal. Onerous reporting problems in Czechia and Romania may not be immediately resolved
because of political interplay. The current stance of the EU on biotech crops is not conducive to acceptance and adoption, which will not be beneficial to EU farmers and consumers and the environment.
afRiCa
By 2016, at least four countries have at some point in the past placed a GM crop in the market – Burkina Faso, Egypt, South Africa and Sudan. However, due to various political and technical setbacks, only South Africa and Sudan planted biotech crops in 2016. South Africa is one of the top ten countries planting more than 1 million hectares of biotech crops and was discussed in the beginning chapters. South Africa continued to lead the adoption of biotech crops on the African continent with increased plantings of biotech maize, soybean and cotton totaling 2.66 million hectares in 2016. This is a 16% increase from the reported biotech crop area of 2.29 million hectares in 2015. In Egypt, a ban on Bt maize was imposed over safety claims while the Burkina Faso Government put a temporary halt on Bt cotton plantings to address a short fiber length concern observed from the varieties farmers have grown over the last eight years.
SudaN
Sudan in Northern Africa approved its first biotech crop – insect resistant Bt cotton for commercial planting in 2012 with a single variety under the trade name Seeni 1. Continuous research over the last five years resulted in approval of two new IR hybrids in 2015, gradually increasing the hectarage from an initial modest launch of 20,000 hectares in 2012 to 120,600 (Table 33) hectares in 2016, a slight increase from the 2015 reported area of 120,000 hectares. The rate of adoption of biotech cotton remained at 98% and few farmers grew non-Bt cotton.
Sudan

Global Status of Commercialized Biotech/GM Crops: 2016
82
The two hybrids from India - Hindi 1 released for the irrigated region and Hindi 2 for rainfed areas have recorded an impressive yield of two-to-three times that of local varieties. Irrigated areas in six states and the private sector planted 81,800 hectares, two rainfed areas and the private sector at 27,000 hectares, and seed production in three irrigated areas and the private sector at 11,800 hectares, to total 120,600 hectares. It is noteworthy that planting and seed production by the private sector contributed to 31% of the total area. The private sector is earmarked to produce abundant seed for planting large areas in Gezira on contractual basis with the farmers in upcoming season.
Large-scale testing of the two varieties was conducted in an area of 3,041 hectares by a private company at the Abu Nama over two seasons with great success. A major milestone in 2016 was the signing of an Agreement between the Government of Sudan and China’s Minister for Agriculture to plant 500,000 hectares of cotton in the Gezira region in the 2017/18 season. This demonstrates strong political goodwill based on satisfaction with the IR cotton technology from demonstrated
benefits accrued by farmers and other stakeholders along the cotton sub-sector value chain.
Benefits of Biotech Cotton in Sudan
Sufficient protection from the IR cotton hybrids Hindi-1 and Hindi-2 against damage caused by the African and Egyptian bollworms has posted yields 2-3 times higher than that of local non-Bt varieties, and significantly higher than the released Bt variety Seeni1. The Bt cotton hybrids will further reduce the cost of production and maximize farmers’ returns. Besides, use of Bt technology has provided safe environment for propagation of natural enemies of cotton pests such as white fly, aphid and jassid, thus maintaining the population of these pests below the economic threshold for chemical applications. Other significant benefits include environmental and health gains from the reduction or negligible need for hazardous chemical applications for insect pest control in the cotton fields. A strong stewardship program and, sustainable seed production and distribution system need to be established to
Sudan
district/Stat irrigated Rainfed Seed Production totalGezira 10,600 4,700 15,300Rahad 15,100 5,400 20,500New Halfa 9,777 9,700Suki 8,800 900 9,700Sennar 5,900 5,900Blue Nile 9,600 9,600White Nile 1,700 1,700Gadarif 11,300 11,300Private Sector 300 6,100 800 36,900total 81,800 27,000 11,800 120,600
table 33. Commercial Production of iR Cotton in Sudan, 2016 (hectares)
Source: ISAAA, 2016

Global Status of Commercialized Biotech/GM Crops: 2016
83
ensure the surveillance and sustenance of long-term benefits from the technology.
Progress with Biotech Crops Research in other african Countries
At the dawn of the third decade of the commercialization of biotech crops, the impetus for research and regulatory support for biotech crops in Africa remained focused on food security. Modernization of the agricultural sector to make it more efficient, competitive and adaptive to changing climatic trends also dominated discussions at the policy level. Further, many governments prioritized biotech cotton as a strategically important crop to revive the once vibrant textile industries and tap employment opportunities for young people within the cotton sub-sector value chain. Youth unemployment is a burgeoning problem in a majority of the countries.
To meet growing aspirations, significant milestones in the biotechnology research and biosafety policy landscape were achieved in 2016. A total of 13 countries, up from 11 in 2015, either planted, actively evaluated field trials or transitioned to grant approvals for the general release of various biotech crops. Three levels of progress were observed:
• Three countries transitioned from conducting experimental research or confined field trials to granting approvals for environmental release. These were: Kenya (maize and cotton); Malawi (cotton) and Nigeria (cotton). This could lead to commercial planting in the next one or two years after varietal and national performance trials are completed. Supportive policies are essential to make this happen.
• Six countries conducted multi-location trials in preparation for general release approvals. They include Burkina Faso
and Ghana (for cowpea), Ethiopia and Swaziland (cotton), Nigeria (cowpea and sorghum), and Uganda (banana and maize).
• Two countries recorded first time approach and new crop trials under the Water Efficient Maize for Africa project. Tanzania planted its first ever confined field trial of drought tolerant maize while Mozambique granted its first ever approval for a trial of a stacked trait, an insect reistant and drought tolerant maize. In Kenya, a GM banana trial resistant to banana bacterial-Xanthomonas wilt (BXW) disease was planted. Two trials, one of ‘bunchy-top’ virus resistant banana and another for insect (Maruca) resistant Bt cowpea were initiated in Malawi. Nigeria granted approval for a stacked trait IR/HT maize for the first time in the country.
The Africa map captures these developments alongside the two countries - South Africa and Sudan that sustained commercial planting of biotech crops in 2016 (Figure 9). Burkina Faso suspended the growing of Bt cotton to address a concern about fibre length observed with the varieties that farmers have grown successfully for eight years. The Inter-Professional Cotton Association of Burkina (AICB) and the government reaffirmed their commitment to biotechnology and gave an assurance that the concern was not with the technology but the fiber length. Breeders and other stakeholders are working towards addressing this technical issue within the shortest time possible so as to reinstate the biotech cotton program in the country. A significant lesson from this challenge is the important role of technology developers and breeders to play in incorporating traits and qualities well adapted to local conditions and meet farmers and market needs.
In Eastern Africa, and for the very first time, Kenya’s National Biosafety Authority processed
Progress with Biotech Crops Research in Other African Countries
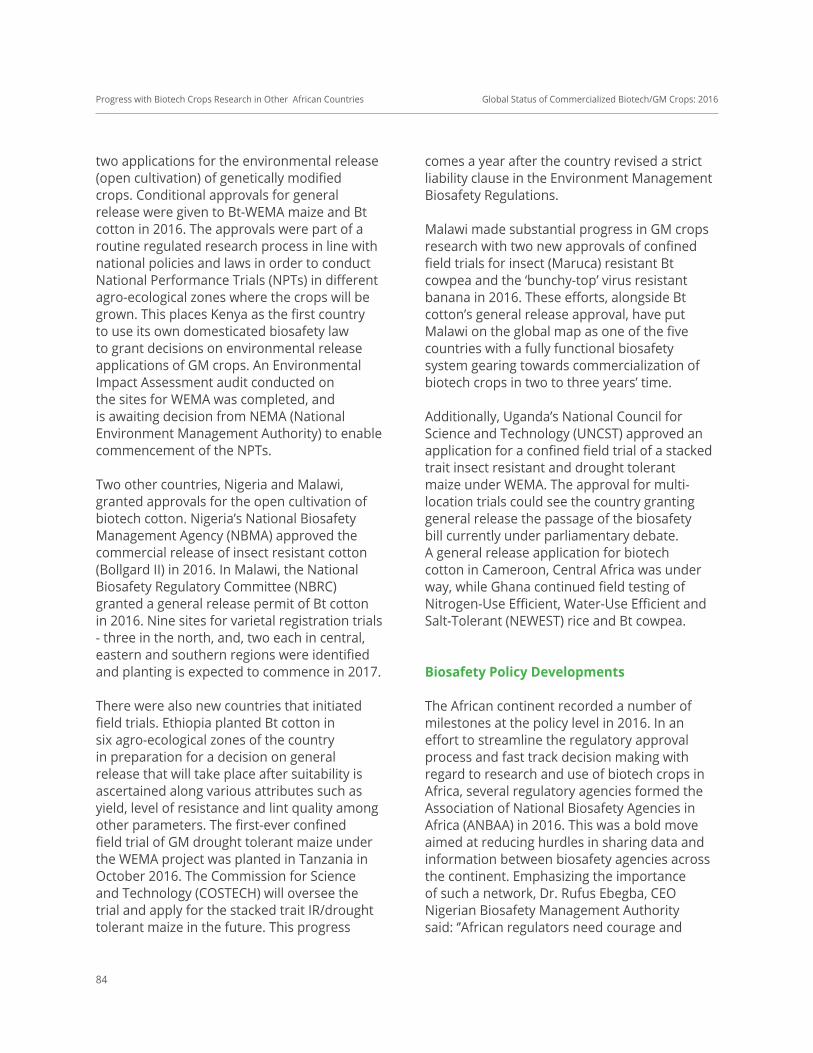
Global Status of Commercialized Biotech/GM Crops: 2016
84
two applications for the environmental release (open cultivation) of genetically modified crops. Conditional approvals for general release were given to Bt-WEMA maize and Bt cotton in 2016. The approvals were part of a routine regulated research process in line with national policies and laws in order to conduct National Performance Trials (NPTs) in different agro-ecological zones where the crops will be grown. This places Kenya as the first country to use its own domesticated biosafety law to grant decisions on environmental release applications of GM crops. An Environmental Impact Assessment audit conducted on the sites for WEMA was completed, and is awaiting decision from NEMA (National Environment Management Authority) to enable commencement of the NPTs.
Two other countries, Nigeria and Malawi, granted approvals for the open cultivation of biotech cotton. Nigeria’s National Biosafety Management Agency (NBMA) approved the commercial release of insect resistant cotton (Bollgard II) in 2016. In Malawi, the National Biosafety Regulatory Committee (NBRC) granted a general release permit of Bt cotton in 2016. Nine sites for varietal registration trials - three in the north, and, two each in central, eastern and southern regions were identified and planting is expected to commence in 2017.
There were also new countries that initiated field trials. Ethiopia planted Bt cotton in six agro-ecological zones of the country in preparation for a decision on general release that will take place after suitability is ascertained along various attributes such as yield, level of resistance and lint quality among other parameters. The first-ever confined field trial of GM drought tolerant maize under the WEMA project was planted in Tanzania in October 2016. The Commission for Science and Technology (COSTECH) will oversee the trial and apply for the stacked trait IR/drought tolerant maize in the future. This progress
comes a year after the country revised a strict liability clause in the Environment Management Biosafety Regulations.
Malawi made substantial progress in GM crops research with two new approvals of confined field trials for insect (Maruca) resistant Bt cowpea and the ‘bunchy-top’ virus resistant banana in 2016. These efforts, alongside Bt cotton’s general release approval, have put Malawi on the global map as one of the five countries with a fully functional biosafety system gearing towards commercialization of biotech crops in two to three years’ time.
Additionally, Uganda’s National Council for Science and Technology (UNCST) approved an application for a confined field trial of a stacked trait insect resistant and drought tolerant maize under WEMA. The approval for multi-location trials could see the country granting general release the passage of the biosafety bill currently under parliamentary debate. A general release application for biotech cotton in Cameroon, Central Africa was under way, while Ghana continued field testing of Nitrogen-Use Efficient, Water-Use Efficient and Salt-Tolerant (NEWEST) rice and Bt cowpea.
Biosafety Policy developments
The African continent recorded a number of milestones at the policy level in 2016. In an effort to streamline the regulatory approval process and fast track decision making with regard to research and use of biotech crops in Africa, several regulatory agencies formed the Association of National Biosafety Agencies in Africa (ANBAA) in 2016. This was a bold move aimed at reducing hurdles in sharing data and information between biosafety agencies across the continent. Emphasizing the importance of such a network, Dr. Rufus Ebegba, CEO Nigerian Biosafety Management Authority said: ‘’African regulators need courage and
Progress with Biotech Crops Research in Other African Countries
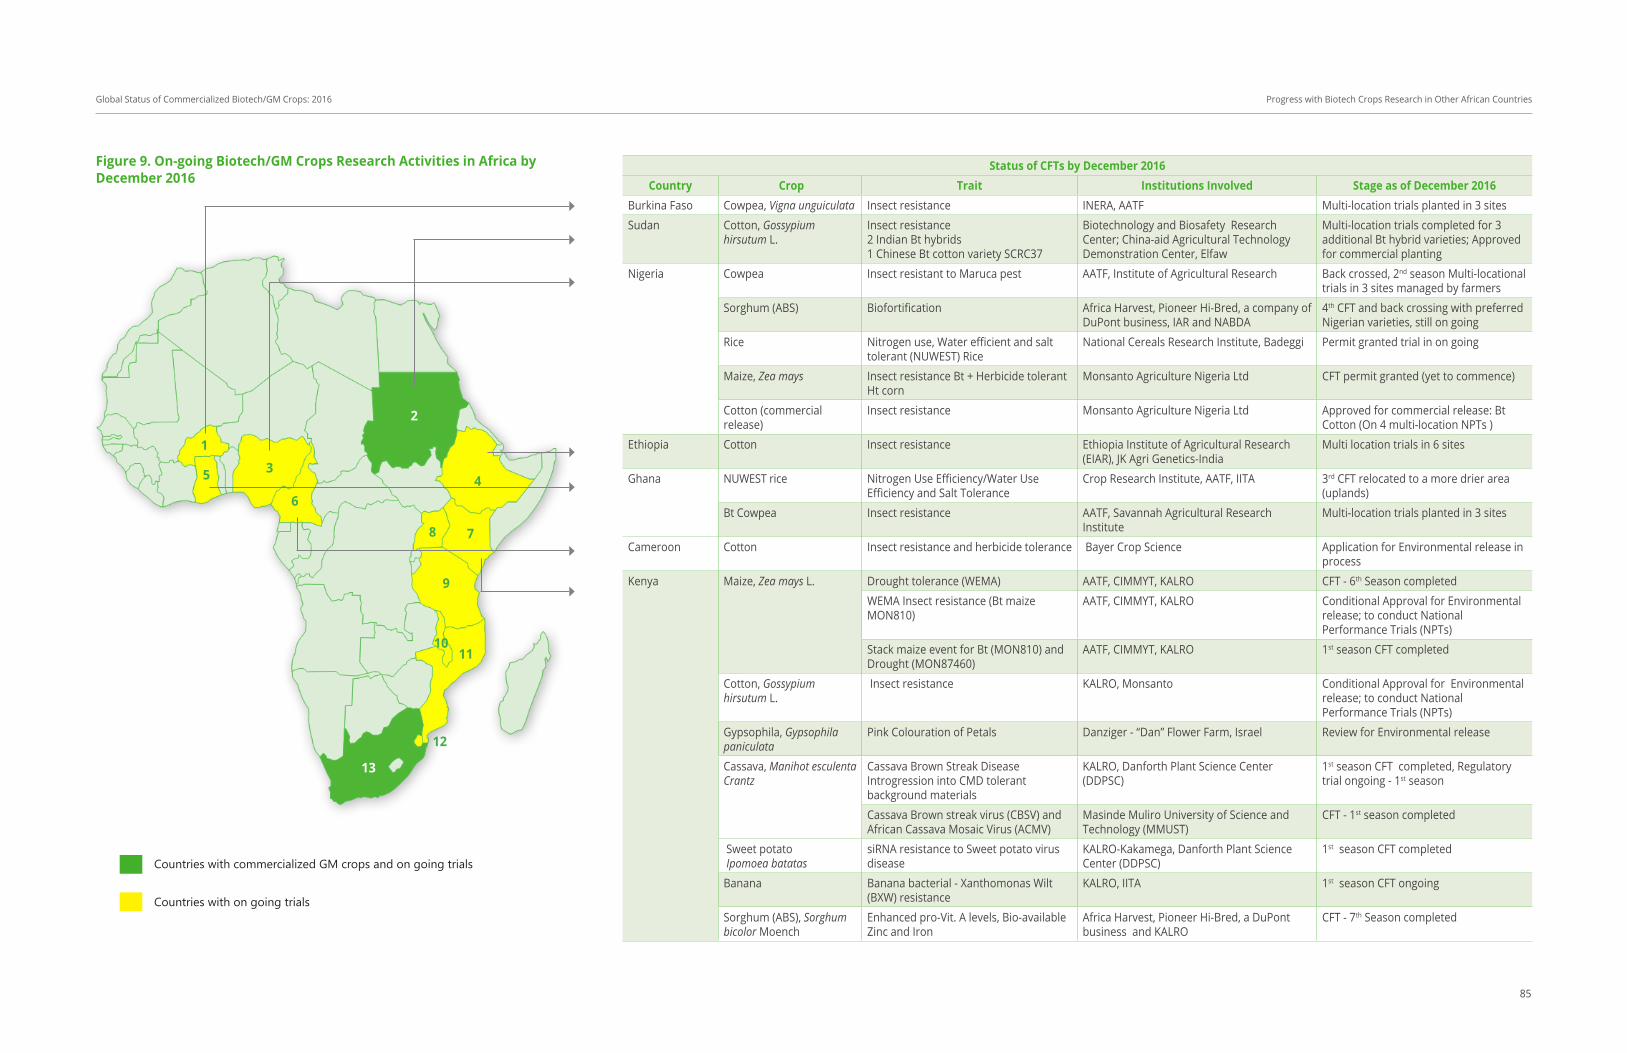
13
1
5 4
7
9
11
12
10
8
3
6
Status of CFTs by December 2016Country Crop Trait Institutions Involved Stage as of December 2016
Burkina Faso Cowpea, Vigna unguiculata Insect resistance INERA, AATF Multi-location trials planted in 3 sites
Sudan Cotton, Gossypium hirsutum L.
Insect resistance2 Indian Bt hybrids1 Chinese Bt cotton variety SCRC37
Biotechnology and Biosafety Research Center; China-aid Agricultural Technology Demonstration Center, Elfaw
Multi-location trials completed for 3 additional Bt hybrid varieties; Approved for commercial planting
Nigeria Cowpea Insect resistant to Maruca pest AATF, Institute of Agricultural Research Back crossed, 2nd season Multi-locational trials in 3 sites managed by farmers
Sorghum (ABS) Biofortification Africa Harvest, Pioneer Hi-Bred, a company of DuPont business, IAR and NABDA
4th CFT and back crossing with preferred Nigerian varieties, still on going
Rice Nitrogen use, Water efficient and salt tolerant (NUWEST) Rice
National Cereals Research Institute, Badeggi Permit granted trial in on going
Maize, Zea mays Insect resistance Bt + Herbicide tolerant Ht corn
Monsanto Agriculture Nigeria Ltd CFT permit granted (yet to commence)
Cotton (commercial release)
Insect resistance Monsanto Agriculture Nigeria Ltd Approved for commercial release: Bt Cotton (On 4 multi-location NPTs )
Ethiopia Cotton Insect resistance Ethiopia Institute of Agricultural Research (EIAR), JK Agri Genetics-India
Multi location trials in 6 sites
Ghana NUWEST rice Nitrogen Use Efficiency/Water Use Efficiency and Salt Tolerance
Crop Research Institute, AATF, IITA 3rd CFT relocated to a more drier area (uplands)
Bt Cowpea Insect resistance AATF, Savannah Agricultural Research Institute
Multi-location trials planted in 3 sites
Cameroon Cotton Insect resistance and herbicide tolerance Bayer Crop Science Application for Environmental release in process
Kenya Maize, Zea mays L. Drought tolerance (WEMA) AATF, CIMMYT, KALRO CFT - 6th Season completed
WEMA Insect resistance (Bt maize MON810)
AATF, CIMMYT, KALRO Conditional Approval for Environmental release; to conduct National Performance Trials (NPTs)
Stack maize event for Bt (MON810) and Drought (MON87460)
AATF, CIMMYT, KALRO 1st season CFT completed
Cotton, Gossypium hirsutum L.
Insect resistance KALRO, Monsanto Conditional Approval for Environmental release; to conduct National Performance Trials (NPTs)
Gypsophila, Gypsophila paniculata
Pink Colouration of Petals Danziger - “Dan” Flower Farm, Israel Review for Environmental release
Cassava, Manihot esculenta Crantz
Cassava Brown Streak DiseaseIntrogression into CMD tolerant background materials
KALRO, Danforth Plant Science Center (DDPSC)
1st season CFT completed, Regulatory trial ongoing - 1st season
Cassava Brown streak virus (CBSV) and African Cassava Mosaic Virus (ACMV)
Masinde Muliro University of Science and Technology (MMUST)
CFT - 1st season completed
Sweet potato Ipomoea batatas
siRNA resistance to Sweet potato virus disease
KALRO-Kakamega, Danforth Plant Science Center (DDPSC)
1st season CFT completed
Banana Banana bacterial - Xanthomonas Wilt (BXW) resistance
KALRO, IITA 1st season CFT ongoing
Sorghum (ABS), Sorghum bicolor Moench
Enhanced pro-Vit. A levels, Bio-available Zinc and Iron
Africa Harvest, Pioneer Hi-Bred, a DuPont business and KALRO
CFT - 7th Season completed
Figure 9. On-going Biotech/GM Crops Research Activities in Africa by December 2016
85
Countries with commercialized GM crops and on going trials
Countries with on going trials
2
Global Status of Commercialized Biotech/GM Crops: 2016 Progress with Biotech Crops Research in Other African Countries
13
1
5 4
7
9
11
12
10
8
3
6
Status of CFTs by December 2016Country Crop Trait Institutions Involved Stage as of December 2016
Uganda Maize, Zea mays l. Drought tolerance and Insect resistance stacked events
NARO, AATF, Monsanto, CIMMYT Multi-location Trial planted in July 2016
Banana, Musa spp. Banana bacterial - Xanthomonas Wilt (BXW) resistance
NARO, IITA On multi-location trial
Banana parasitic nematode resistance NARO, University of Leeds 2nd season CFT-planted in March 2016
Nutrition enhancement (Fe and Pro-vitamin A)
NARO, QUT (Queensland University of Technology)
In staggered planting systeming. Latest staggered planting done on-going
Cassava, Manihot esculenta Crantz
Cassava brown streak virus (CBSV) resistance
NARO, DDPSC CFTs-1st Trial crossing block planted
NEWEST Rice Nitrogen Use Efficiency/Water Use Efficiency
NARO, AATF, Arcadia Biosciences 3rd season CFT-harvested in August, construction of a rain out shelter on-going
Potato Disease resistance NARO, CIP CFT-4th Trial Planted in October, 2016
Tanzania Maize Drought tolerance AATF, Commission of Science and Technology (COSTECH)
1st season CFT planted in October
Malawi Cotton, Gossypium hirsutum
Insect resistance LUANAR, DARS, Monsanto, Quton General Release approvedVariety registration trials underway to be planted in 9 sites
Cowpea, Vigna unguiculata Insect resistance LUANAR, DARS, AATF 2nd season CFT planted
Banana Bunchytop virus resistance DARS, Queensland University of Technology CFT – 1st season trial planted in July 2016
Mozambique Maize Stack - Drought tolerance and Insect resistance
AATF, Instituto de Investigação Agrária de Moçambique (IIAM)
CFT approval granted
Swaziland Cotton Insect resistance Swaziland Cotton Board, JK Agri-Genetics CFTs approval granted
South Africa Cotton Insect resistance and Herbicide tolerance
Bayer Crop Science Trial permit granted
Maize Drought tolerance and insect resistance AATF, IAR Trials on-going
Insect resistance AATF, IAR Trials on-going
Figure 9. On-going Biotech/GM Crops Research Activities in Africa by December 2016
86
Countries with commercialized GM crops and on going trials
Countries with on going trials
2
Global Status of Commercialized Biotech/GM Crops: 2016 Progress with Biotech Crops Research in Other African Countries

Global Status of Commercialized Biotech/GM Crops: 2016
87
knowledge for effective biosafety regulation in Africa.’’ Another development was the issuance of guidelines for general release of Genetically Modified Organisms (GMOs) by the Ghana National Biosafety Authority. The guidelines are an indication of the country’s readiness to handle applications, review, and approve or reject GMOs either for experimentation, environmental release, placing on the market, import/export, and for the transit of GMOs.
technology demand
African farmers continued an unrelenting demand for the technology, urging their governments to remove hurdles that deny them access to biotech products. In Kenya, farmers from central Kenya expressed their support for the introduction of genetically modified maize. They called for the lifting of a four-year ban on GM food imports, asking the government to deliver modern biotechnology for their sake. Farmers cited high cost of inputs, drudgery and the surge in rural to urban migration as reasons why technologies that make agriculture competitive and attractive to youth should be expedited. Ugandan farmer leaders formed a grassroots forum – National Farmers’ Forum on Agricultural Biotechnology – to enhance their voices in demanding the technology. The forum has been instrumental in petitioning Parliament to fast-track passage of the Biosafety Bill. Similar demands were echoed in Nigeria where the Farmers Association of Nigeria (AFAN), reaffirmed its support for the introduction of agricultural biotechnology to reduce poverty. Commodity groups such as the Cowpea Association of Nigeria also accused the EU Parliament of attempting to deny Africans the benefit of agricultural biotechnology by passing the Heubuch report on the New Alliance for Food Security and
Nutrition, urging G7 members not to support GMO crops in Africa. The farmers asked the EU to stop undue interference with African agriculture and allow farmers to make their own choices on what tools to use in agriculture.
Students from various universities across the region also petitioned their governments to provide enabling environment for the technology. Similarly, the Nigeria Academy of Sciences (NAS) declared genetically-modified foods safe for consumption. The Academy’s outgoing President Professor Oyewale Tomori, said the country was ready for the products and that they were safe for both production and beneficial to the nation based on carefully-documented evidence from developed countries. The Academy noted that the technology, though new, and with expected fears and concerns, would be useful to the country because of its potential to boost the nation’s agriculture, which would resolve food insecurity.
Partnerships emerging in africa
A new trend emerging in the continent is the forging of south-south out to collaboration to diversify the range of technology providers with Asian tigers (India and China) reaching for such partnerships. A big gain in the year was endorsement of GMOs by the Nigerian Academy of Science (NAS), a reputable, professional body in science matters. The institution declared that GMOs are beneficial for crop improvement, as well as for improving the overall agricultural sector. Nigeria is Africa’s most populous nation and the government has been at the forefront in advocating for the technology.
Policy Pronouncements
A number of strong policy statements were made in support of the technology.
Policy Pronouncements
Global Status of Commercialized Biotech/GM Crops: 2016
88
Burkina Faso “Cotton is an important cash crop in Burkina Faso and Bt cotton has made a difference for our farmers. We must improve awareness on GM crops as the country is gearing towards adoption of more GM crops.” Honorable Henri Koubizara, Member of the Parliamentary Commission on Economic Development, Environment and Climate Change, Burkina Faso.
Ethiopia“I had never seen a GM crop before but what I would like to say is that when people speak about GM crops and the issue of GM, they associate it with some scary things, but after seeing the Bt cotton and other GM crops in India, I can confirm that those perceptions are not true.” Zekarias Erkola, State Minister for Cabinet Affairs, Office of the Prime Minister, Ethiopia.
Kenya “Agricultural biotechnology would make a difference for Kenyan farmers especially women who end up with health challenges from the old ways of farming. It would also encourage our youth to take up agriculture as an enterprise. Twenty years since commercialization began, no negative impact has been recorded in countries where GM crops have been planted. Kenya needs to join other countries benefitting from this technology,” Honorable Jennifer Murogocho, Member of County Assembly, Eastern Kenya.
Nigeria“Nigerians should not panic over the issue of GMOs. The National Biosafety Management Agency (NBMA), established in 2015, under the Federal Ministry of Environment is in charge and will ensure proper regulation of modern biotechnological activities and genetically modified organisms so as to protect the lives of Nigerians,” Minister for Environment, Honorable Amina Mohammed.
Tanzania “Scientific findings have revealed that biotechnology is not only useful in industrial production, human and animal health and environmental protection, but it also plays a huge role in economic growth and poverty eradication. Globalization has facilitated development of various technologies in the world and Tanzania being part of the world cannot survive devoid of biotechnology know-how as a driving force to agricultural development.” Dr. Florens Turuka, Permanent Secretary, Ministry of Agriculture, Livestock and Fisheries, Tanzania.
Uganda “I am an ally of scientists and I support biotechnology. We do not need to implore people to embrace science and technology; it’s the way to go. The world has been using biotech crops for over 20 years, but Uganda is lagging behind in making necessary steps to give farmers access to these improved crops. Ugandans should support biotechnology and other modern science in light of current challenges such as booming population, land scarcity and climate change,” State Minister for Agriculture, Honorable Christopher Kibazanga. In summary, despite the continent recording a drop to two biotech-growing countries – South Africa and Sudan – planted biotech crops in 2016 due to the temporary setback in Burkina Faso and Egypt, a new wave of acceptance is emerging. Three countries: Kenya, Malawi and Nigeria, transitioned from research to granting environmental release approvals, while five others – Ethiopia, Ghana, Nigeria, Swaziland and Uganda – made significant progress in moving towards completion of multi-location trials in readiness for considering commercial approval. Encouragingly, three of these crops – banana, cowpea and sorghum – are new and primarily for food security, with an implication of expanding the global biotech crop basket
Policy Pronouncements

Global Status of Commercialized Biotech/GM Crops: 2016
89
with more choices beyond the big four (cotton, soybean, cotton and canola). Another trend is the south-south collaboration and diversification of technology providers with a number of Asian companies partnering with several African research organizations to share technology and expertise. This is expected to boost confidence in decision-making and adoption of the technology due to similarities in geographical and socio-economic conditions in the two continents of Africa and Asia. The endorsement of GM foods by the reputable Nigeria Academy of Science is beneficial for crop improvement and improving the overall agricultural sector will also build courage among policy makers and end-users in making sound science-based decisions about the technology for Africa’s benefit.
diStRiButioN of BioteCh CRoPS, BY CRoP
In 2016, four biotech crops (soybean, maize, cotton and canola) comprised the most amount of hectares (Table 34). The adoption trend provided in Figure 10 shows the plateauing optimal rate for biotech soybean, an increase in biotech maize, and marginal increases in canola, while cotton still has a downward trend due to global low price.
Compared to 2015, there were increases in the hectarage of biotech maize, canola and alfalfa. Favorable weather and market prices, increased demand for biofuels and feedstocks, and the European corn borer infestation in Europe encouraged biotech maize planting. Cumulative small increases in biotech canola hectarage in the US, Canada and Australia contributed to the 1% increase of biotech canola planting. While, the introduction of HarvExtra™alfalfa in Canada and the increased alfalfa planting in the USA contributed to the 20% increase in biotech alfalfa planting. Decreases in areas planted to biotech soybean and cotton were mainly due to unfavorable
Distribution of Biotech Crops, by Crop
weather conditions (drought) and low global cotton prices, respectively.
Biotech soybean
Soybean occupied 50% (91.4 million hectares) of the global biotech crop hectarage, 1% below the 2015 area (Table 34). The 91.4 million hectares was comprised of 68 million hectares herbicide tolerant and 23.4 million hectares IR/HT (Intacta™) soybean – an 82% increase from 12.9 million hectares in 2015. IR/HT soybean has been deployed successfully in South American countries, the highest being in Brazil (20.25 million hectares), followed by Argentina and Paraguay, but a slight decrease in Uruguay due to lower global soybean prices, higher production costs and positive policy developments for the grain and soybean sector in Argentina (USDA FAS GAIN, Uruguay, 2016). Biotech soybean was planted in 11 countries and with decreasing hectarage they were Brazil (32.7 million hectares), USA (31.8), Argentina (18.7), Paraguay (3.2), Canada (2.1), Uruguay (1.2), Bolivia (1.2), and smaller hectarages in South Africa, Mexico, Chile and Costa Rica. Of the global hectarage of 117 million hectares (2014 data of FAOSTAT, 2017), 78% (91.4 million hectares) was biotech soybean in 2016 (Figure 11). In 2015, drought tolerant soybean was approved for commercialization in Argentina which increases the roster of biotech soybean varieties that will cater to the needs of farmers in marginalized and stressed conditions.
The increase in income benefits for farmers growing biotech soybean during the 20-year period 1996 to 2015 was US$52.4 billion and for 2015 alone, US$5.05 billion (Brookes and Barfoot, 2017, Forthcoming).
Biotech maize
Biotech maize occupied 60.6 million hectares

Global Status of Commercialized Biotech/GM Crops: 2016
90
Distribution of Biotech Crops, by Crop
figure 11. Global adoption Rates (%) for Principal Biotech Crops, 2016 (Million hectares)
Source: ISAAA, 2016
Conventional Biotech
78%Soybean
117
35
64%Cotton
33%Maize
24%Canola
20
40
60
80
100
120
140
160
180
200 185
36
Crops 2015 % 2016 % +/– %Soybean 92.1 51 91.4 50 -0.7 -1.0Maize 53.6 30 60.6 33 +7.0 +13.0Cotton 24.0 13 22.3 12 -1.7 -7.0Canola 8.5 5 8.6 5 +0.1 +1.0Alfalfa 1.0 <1 1.2 <1 +0.2 +20.0Sugar beet 0.5 <1 0.5 <1 0 0Papaya <1 <1 <1 <1 <1 <1Others <1 <1 <1 <1 <1 <1total 179.7 100 185.1 100 +5.4 +3.0
table 34. Global area of Biotech Crops, 2015 and 2016: by Crop (Million hectares)
Source: ISAAA, 2016
figure 10. Global area of Biotech Crops, 1996 to 2016: by Crop (Million hectares)
Source: ISAAA, 2016
10
20
30
40
50
60
70
80
90
100
1996 2002 2009 2016
Soybean CottonMaize Canola

Global Status of Commercialized Biotech/GM Crops: 2016
91
in 2016, 13% higher than the 2015 area. The increased hectarage was due to favorable market prices, demand for biofuel and animal feeds, as well as the increased European corn borer infestation in parts of Europe. The 60.6 million hectares comprised of 6 million hectares IR, 7 million hectares HT and 47.7 million hectares IR/HT. Biotech maize was planted in 16 countries, the top five countries include USA (30.1 million hectares), followed by Brazil (15.6), Argentina (4.7), South Africa (2.2), and Canada (1.5). Countries which planted less than one million hectares include Philippines, Paraguay, Spain, Colombia, Uruguay, Vietnam, Honduras, Portugal, Chile, Slovakia and Czech Republic. Romania opted not to plant biotech maize in 2016 due to onerous requirements for planting biotech maize in the country. An important feature of biotech maize is stacking, which is discussed in the sections on countries and traits. Of the global 185 million maize hectarage globally (2014 date, FAOSTAT, 2016), 26% or 47.7 million hectares were biotech maize in 2017 (Figure 11). As the economies of the more advanced developing countries in Asia and Latin America grow at much higher rates than North America and Europe, this will significantly increase demand for feed maize to meet higher meat consumption in diets, as people become wealthier and more prosperous with more surplus income to spend. In addition, the continuing beneficial adoption of drought tolerant maize in the US and by 2017 in Africa, will cause biotech maize adoption to increase as more countries facing drought stress due to climate change. Maize continued to be used for ethanol production in the US, and other countries in the Americas.
The increase in income benefits for farmers growing biotech maize during the 20 years (1996 to 2015) was US$57.1 billion and US$6.25 billion for 2015 alone (Brookes and Barfoot, 2017, Forthcoming).
Distribution of Biotech Crops, by Crop
Biotech cotton
The area planted to biotech upland cotton globally in 2016 was 22.3 million hectares down from 24.0 million hectares in 2015, a decrease of 7% (Table 34). 2016 is the second consecutive year with low global cotton prices that affected global cotton planting, including biotech cotton planting. A total of 14 countries grew biotech cotton in 2016 and four grew more than 1.0 million hectares. In descending order of hectarage, they were: India (10.8 million hectares), USA (3.7 million), Pakistan (2.9 million hectares) and China (2.8 million). Another 10 countries grew biotech cotton in 2016 including Brazil, Australia, Argentina, Myanmar, Sudan, Mexico, Paraguay, Colombia, South Africa, and Costa Rica. Burkina Faso, a cotton-growing country in Africa put a temporary halt on Bt cotton in 2016 to address a short fiber length issue observed from the varieties farmers grew over the last eight years. An 89% increase in cotton hectarage in Australia was due to the introduction of BollgardIII/RR Flex® cotton. This variety can be adopted by other countries once global cotton prices stabilize. Based on the latest FAOSTAT data of 2014 (2016), cotton was planted on 35 million hectares globally, 64% (22.3 million hectares) of which was biotech cotton (Figure 11).
The increase in income benefits for farmers growing biotech cotton during the 20 year period 1996 to 2015 was US$52 billion and US$3.4 billion for 2015 alone (Brookes and Barfoot, 2017, Forthcoming).
Biotech canola
The global area of biotech canola increased by 1% from 8.5 million hectares in 2015 to 8.6 million hectares in 2016. Marginal increases in biotech canola plantings in the USA, Canada, and Australia contributed to this increase to address global demand for edible oil. Chile

Global Status of Commercialized Biotech/GM Crops: 2016
92
grew biotech canola only for seeds. The global hectarage and prevalence of canola could increase significantly in the near term in response to the likely increased use of canola for vegetable oil and biodiesel. Less than 1% of the canola crop in Canada is used for biodiesel; this is expected to remain low at around 2% until new biodiesel plants come on stream. Of the global hectarage of 36 million hectares of canola grown in 2014 (the latest data, FAO 2016), 24%, or 8.6 million hectares were biotech canola grown in Canada, the USA, Australia and Chile (Figure 11).
The increase in income benefits for farmers growing biotech canola during the 19-year period 1996 to 2015 was US$5.5 billion and US$0.65 billion for 2015 alone (Brookes and Barfoot, 2017, Forthcoming).
Biotech alfalfa
Herbicide tolerant RR®alfalfa was first approved for commercialization in the US in 2005. In 2016, 1.2 million hectares of herbicide tolerant alfalfa and 21,000 hectares of HarvXtra™ alfalfa were planted in the US, while Canada planted ~1,000 hectares HarvXtra™ alfalfa. RR®alfalfa has not been planted in Canada. HarvXtra™ alfalfa has less lignin, higher digestibility, and claims to also offer a 15 to 20% increase in yield, and hence is likely to be in high demand by farmers. 2016, is the first year that this HarvXtra™ alfalfa event was planted on a commercial scale.
other biotech crops
Total hectarage of sugar beet in 2016 was similar to 2015 at ~480,000 hectares at 100% adoption. Biotech sugar beet is grown only in the USA and Canada.
Biotech sweet corn in the US is very conservatively estimated at a minimal nominal hectarage of
1,000 hectares of the sweet corn hectarage of an estimated 300,000 hectares; no adoption data is available but it is certain to be well above the token 1,000 hectare estimate reported in this Brief. Small areas of biotech virus resistant squash (1,000 hectares) and PRSV resistant papaya in Hawaii (1,000 hectares) continued to be grown in the US in 2016; the papaya industry in Hawaii was destroyed by PRSV and saved by PRSV-resistant papaya. China also grew a total of 8,550 hectares PRSV-R papaya in 2016 compared to 7,000 hectares in 2015, a 22% increase. A total of 543 hectares of Bt poplar were planted in China. In addition, a modest hectarages (400 acres or 160 hectares) of Innate™ Generation 1 biotech potato were planted for the first time in 2015 in the US which increased to 2,500 hectares in 2016, and has been sold in 35 states in the US. Bt eggplant was grown in 700 hectares in Bangladesh. SU Canola™, a product developed by Cibus (through gene editing) was commercialized for the first time on an estimated 10,000 acres or 4,000 hectares in the US in 2015, and increased to 8,094 hectares in 2016.
diStRiButioN of BioteCh CRoPS, BY tRait
During the 20 year period 1996 to 2016, herbicide tolerance has consistently been the dominant trait grown by farmers (Figure 12), but has declined through the years with the increasing prominence of stacked traits. In 2016, herbicide tolerance, deployed in soybean, maize, canola, cotton, sugar beet and alfalfa occupied 86.6 million hectares or 47% of the 185.1 million hectares of biotech crops planted by up to 17 to 18 million farmers globally (Table 35). Minimal increases in the area planted to herbicide tolerant crops were observed in the US, Canada, South Africa, Bolivia, Philippines, and Australia. Decreases in area planted to herbicide tolerant traits were observed however in Uruguay, Mexico, Chile, and Honduras.
Distribution of Biotech Crops, by Crop
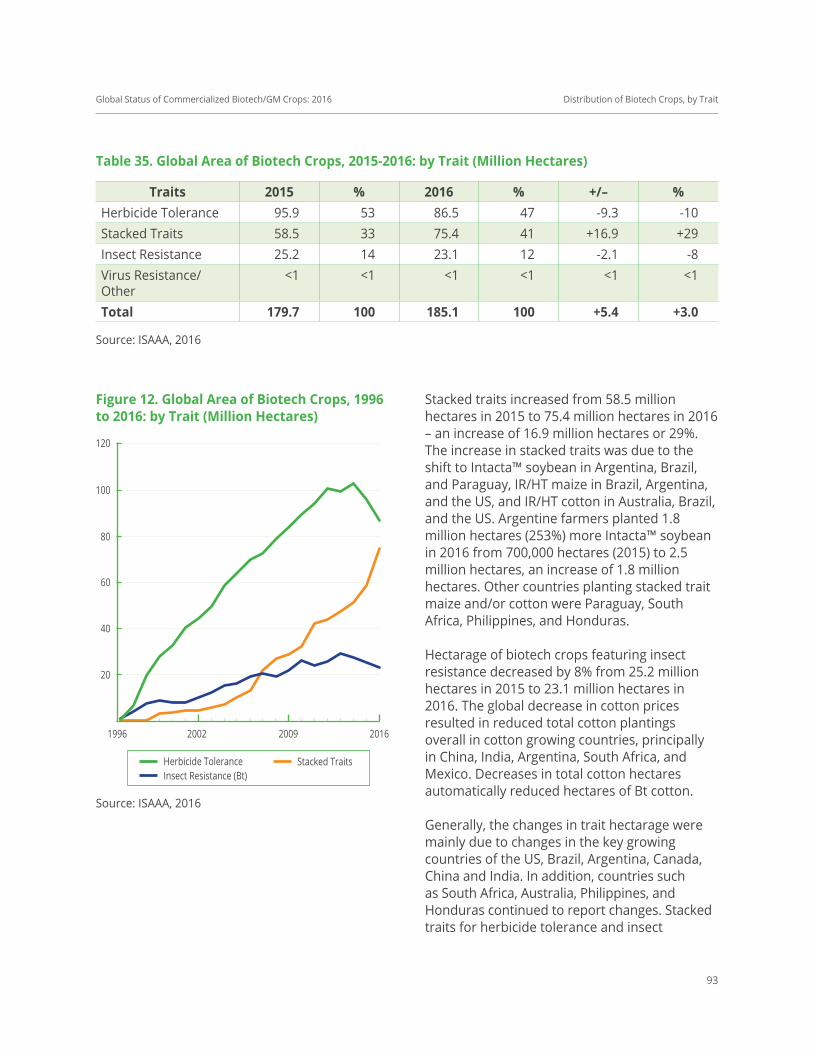
Global Status of Commercialized Biotech/GM Crops: 2016
93
Distribution of Biotech Crops, by Trait
figure 12. Global area of Biotech Crops, 1996 to 2016: by trait (Million hectares)
Source: ISAAA, 2016
Herbicide Tolerance Stacked TraitsInsect Resistance (Bt)
20
40
60
80
100
120
1996 2002 2009 2016
traits 2015 % 2016 % +/– %Herbicide Tolerance 95.9 53 86.5 47 -9.3 -10Stacked Traits 58.5 33 75.4 41 +16.9 +29Insect Resistance 25.2 14 23.1 12 -2.1 -8Virus Resistance/Other
<1 <1 <1 <1 <1 <1
total 179.7 100 185.1 100 +5.4 +3.0
table 35. Global area of Biotech Crops, 2015-2016: by trait (Million hectares)
Source: ISAAA, 2016
Stacked traits increased from 58.5 million hectares in 2015 to 75.4 million hectares in 2016 – an increase of 16.9 million hectares or 29%. The increase in stacked traits was due to the shift to Intacta™ soybean in Argentina, Brazil, and Paraguay, IR/HT maize in Brazil, Argentina, and the US, and IR/HT cotton in Australia, Brazil, and the US. Argentine farmers planted 1.8 million hectares (253%) more Intacta™ soybean in 2016 from 700,000 hectares (2015) to 2.5 million hectares, an increase of 1.8 million hectares. Other countries planting stacked trait maize and/or cotton were Paraguay, South Africa, Philippines, and Honduras.
Hectarage of biotech crops featuring insect resistance decreased by 8% from 25.2 million hectares in 2015 to 23.1 million hectares in 2016. The global decrease in cotton prices resulted in reduced total cotton plantings overall in cotton growing countries, principally in China, India, Argentina, South Africa, and Mexico. Decreases in total cotton hectares automatically reduced hectares of Bt cotton.
Generally, the changes in trait hectarage were mainly due to changes in the key growing countries of the US, Brazil, Argentina, Canada, China and India. In addition, countries such as South Africa, Australia, Philippines, and Honduras continued to report changes. Stacked traits for herbicide tolerance and insect
Global Status of Commercialized Biotech/GM Crops: 2016
94
resistance were deployed in cotton and soybean (IR/HT), maize (Bt/Bt/IR, Bt/HT, and Bt/Bt/HT) but not in sugar beet, canola, and alfalfa. The Bt/Bt/IR stack refers to different Bt or other IR genes that code for different insect resistant traits. For example, for maize, above ground pests and below ground pests and herbicide tolerance are all stacked in the same maize product.
In terms of year-over-year increases, the highest growth was notable for stacked traits at 29%, with consequent decreases in single trait herbicide tolerance at 10% and insect tolerance at 8% most of which was the net result of a mix of increase and decreases in many countries. The trend for increased use of stacks is expected to continue as country markets mature and more stacks are offered in new markets such as the BolgardIII/RR®flex cotton from Australia. This stacking trend will continue and intensify as more traits become available to farmers. Stacking is a very important feature of the technology with SmartStax™ comprising eight genes coding for three traits, launched in the US and Canada in 2010 as well as in Innate™ potato generation two which was approved for cultivation in 2015 in the USA and in Canada in 2016.
The deployment of stacked traits of different Bt genes and herbicide tolerance is becoming increasingly important and is most prevalent in the US and Brazil which had approximately 43% of the 75.4 million hectares “stacked traits” in 2016. The prediction of James (2015) that stacked traits in the US will be close or equal to that in Brazil was achieved in 2016. This is because of high adoption of IR/HT soybean. In 2015, the relative percentage of stacked traits in the US was predicted to be close or equal to that in Brazil in 2016 because of the emerging acceptance of the IR/HT soybean in the developing countries of Latin America.
In 2016, a total of 14 countries deployed stacked traits, they were: USA (32.1 million hectares),
Brazil (32.0 million hectares), Argentina (6.1), South Africa (1.3), Canada (1.2), and smaller hectarages in Paraguay, Philippines, Australia, Uruguay, Colombia, Chile, Vietnam, Honduras, and Mexico. These countries will derive significant benefits from deploying stacked products because productivity constraints at the farmer level are related to multiple biotic stresses, and not to single biotic stress. Distribution of economic benefits at the farm level by trait, for the first 20 years of commercialization of biotech crops (1996 to 2015) was as follows: all herbicide tolerant crops at US$68.8 billion and all insect resistant crops at US$98.6 billion, with the balance of US$0.3 billion for other minor biotech crops for a total of US$167.5. For 2015 alone, the benefits were: all herbicide tolerant crops US$6.43 billion, and all insect resistant crops US$8.96 billion plus a balance of US$0.01 billion for the minor biotech crops for a total of ~US$15.1 billion (Brookes and Barfoot, 2017, Forthcoming).
the GloBal value of the BioteCh CRoP MaRKet
Global value of the biotech seed market alone was uS$15.8 billion in 2016
In 2016, the global market value of biotech crops, estimated by Cropnosis was uS$15.8 billion (up by 3% from US$15.3 billion in 2015) (Table 36); this represents 22% of the US$73.5 billion global crop protection market in 2016, and 35% of the ~US$45 billion global commercial seed market (Appendix 3). The US$15.8 billion biotech crop market comprised: US$8.4 billion for biotech maize (equivalent to 54.8% of global biotech crop market, and an increase of 4% from 8.1 billion in 2015); US$5.5 billion for biotech soybean, up 2% from US$5.4 billion in 2015 and 32.6% of the global biotech crop market; US$1.3 billion for biotech cotton (8% of global), US$0.42 billion for biotech canola
Distribution of Biotech Crops, by Trait
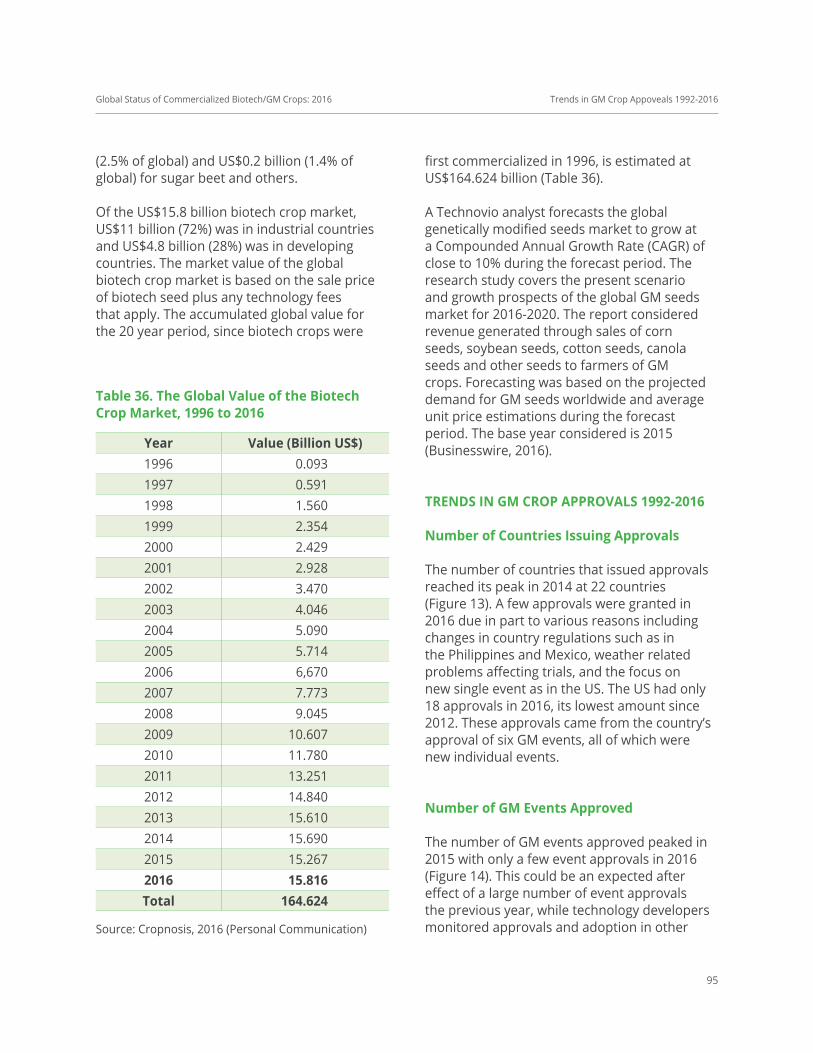
Global Status of Commercialized Biotech/GM Crops: 2016
95
Year value (Billion uS$)1996 0.0931997 0.5911998 1.5601999 2.3542000 2.4292001 2.9282002 3.4702003 4.0462004 5.0902005 5.7142006 6,6702007 7.7732008 9.0452009 10.6072010 11.7802011 13.2512012 14.8402013 15.6102014 15.6902015 15.2672016 15.816total 164.624
table 36. the Global value of the Biotech Crop Market, 1996 to 2016
Source: Cropnosis, 2016 (Personal Communication)
(2.5% of global) and US$0.2 billion (1.4% of global) for sugar beet and others.
Of the US$15.8 billion biotech crop market, US$11 billion (72%) was in industrial countries and US$4.8 billion (28%) was in developing countries. The market value of the global biotech crop market is based on the sale price of biotech seed plus any technology fees that apply. The accumulated global value for the 20 year period, since biotech crops were
first commercialized in 1996, is estimated at US$164.624 billion (Table 36).
A Technovio analyst forecasts the global genetically modified seeds market to grow at a Compounded Annual Growth Rate (CAGR) of close to 10% during the forecast period. The research study covers the present scenario and growth prospects of the global GM seeds market for 2016-2020. The report considered revenue generated through sales of corn seeds, soybean seeds, cotton seeds, canola seeds and other seeds to farmers of GM crops. Forecasting was based on the projected demand for GM seeds worldwide and average unit price estimations during the forecast period. The base year considered is 2015 (Businesswire, 2016).
tReNdS iN GM CRoP aPPRovalS 1992-2016
Number of Countries issuing approvals
The number of countries that issued approvals reached its peak in 2014 at 22 countries (Figure 13). A few approvals were granted in 2016 due in part to various reasons including changes in country regulations such as in the Philippines and Mexico, weather related problems affecting trials, and the focus on new single event as in the US. The US had only 18 approvals in 2016, its lowest amount since 2012. These approvals came from the country’s approval of six GM events, all of which were new individual events.
Number of GM events approved
The number of GM events approved peaked in 2015 with only a few event approvals in 2016 (Figure 14). This could be an expected after effect of a large number of event approvals the previous year, while technology developers monitored approvals and adoption in other
Trends in GM Crop Appoveals 1992-2016

Global Status of Commercialized Biotech/GM Crops: 2016
96
Trends in GM Crop Appoveals 1992-2016
figure 13. Number of Countries that issued approvals, 1992-2016
Source: ISAAA, 2016
Total number of countries Countries - Feed (Per Year)Countries - Food (Per Year) Countries - Cultivation (Per Year)
5
10
15
20
25
30
35
40
45
1992 1996 2001 2006 2011 2016
Year
Num
ber o
f Cou
ntrie
s
events approved, while events with more than one trait made up at least 43% (HT + PC, IR + DR, and HT + PQ) of the approved events. This trend will likely continue into the future since farmers demand more traits in an event, especially in maize. Maize still has the most number of events in the database. This is probably due to the number of single maize events which can be combined with other events to form the desired event.
GM approvals for 2016 The total food, feed and cultivation approvals for 2016 were 115, 87, and 49, respectively, for an over-all total of 251. These approvals are divided among 87 events from seven crops, and were granted by 16 countries (Table 37). The number of approvals for 2016 is lower than the previous two years (318 in 2015 and 302 in 2014). Argentina had the highest number of approvals which were mostly maize events.
Since 2007, the number of stacked events approved has dominated the single events approved. In 2016, the stacked events approved made up 82.6% of the total approved events. This is indicative of the increasing demand by farmers for events with more traits to further increase their profit.
From 1992 to 2016, 40 countries have given 1,777 food approvals, 1,238 feed approvals and 813 cultivation approvals, scattered among 477 events from 29 crops (ISAAA GM Approval Database).
BeNefitS of BioteCh/GeNetiCallY Modified CRoPS
Global bodies unite to address hunger and poverty reduction in the next 15 years
The United Nations Millennium Development
countries. Another reason for this could be the relatively slow release of new GM crops as technology developers put more focus in using new approaches and breeding methods in developing improved crops. In 2016, the majority of approved events were stacked or pyramided (Figure 14). This trend of stacked events outnumbering the single events started in 2008 and peaked this year. This is an indication that farmers are now more selective and choose biotech events/varieties with more traits to offer for cost reduction and better economic profit.
Another evidence of this is Figure 15, in which events with both herbicide tolerance and insect resistance comprised more than 25% of the
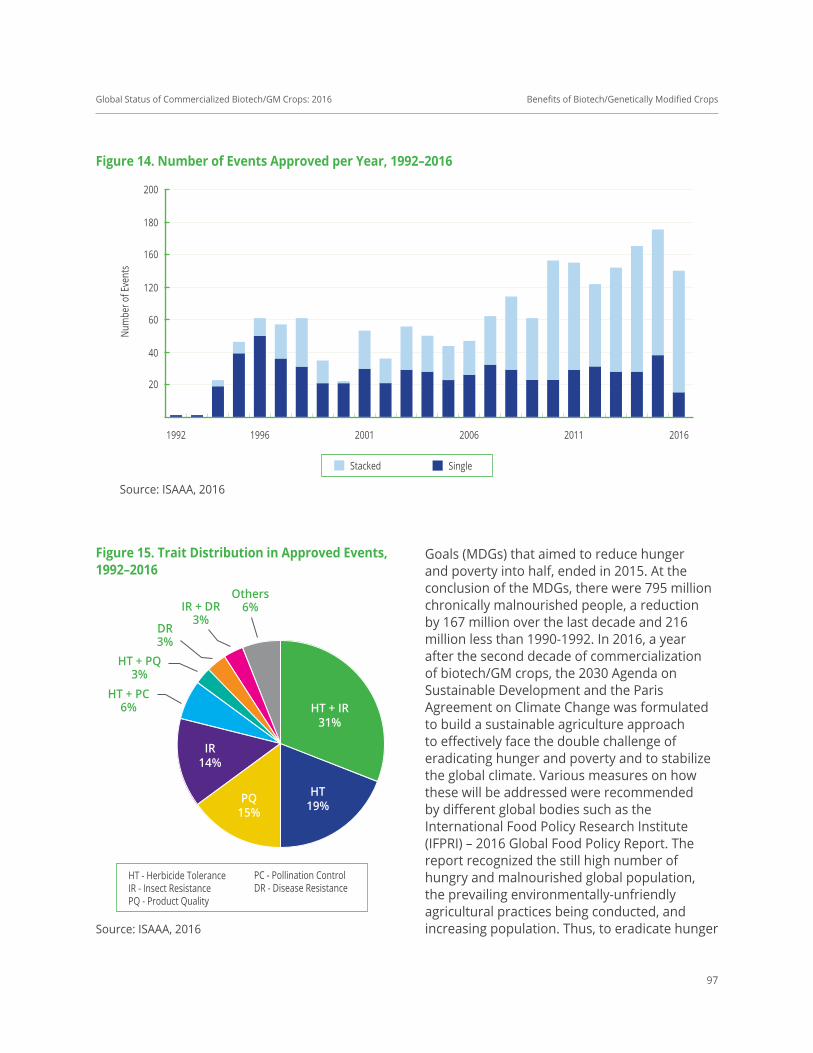
Global Status of Commercialized Biotech/GM Crops: 2016
97
figure 15. trait distribution in approved events, 1992–2016
HT + IR31%
HT19%PQ
15%
IR14%
HT + PC6%
HT + PQ3%
DR3%
IR + DR3%
Others6%
HT - Herbicide ToleranceIR - Insect ResistancePQ - Product Quality
PC - Pollination ControlDR - Disease Resistance
Source: ISAAA, 2016
figure 14. Number of events approved per Year, 1992–2016
Source: ISAAA, 2016
Stacked Single
20
40
60
120
160
180
200
Num
ber o
f Eve
nts
1992 1996 2001 201620112006
Benefits of Biotech/Genetically Modified Crops
Goals (MDGs) that aimed to reduce hunger and poverty into half, ended in 2015. At the conclusion of the MDGs, there were 795 million chronically malnourished people, a reduction by 167 million over the last decade and 216 million less than 1990-1992. In 2016, a year after the second decade of commercialization of biotech/GM crops, the 2030 Agenda on Sustainable Development and the Paris Agreement on Climate Change was formulated to build a sustainable agriculture approach to effectively face the double challenge of eradicating hunger and poverty and to stabilize the global climate. Various measures on how these will be addressed were recommended by different global bodies such as the International Food Policy Research Institute (IFPRI) – 2016 Global Food Policy Report. The report recognized the still high number of hungry and malnourished global population, the prevailing environmentally-unfriendly agricultural practices being conducted, and increasing population. Thus, to eradicate hunger

Global Status of Commercialized Biotech/GM Crops: 2016
98
and under nutrition in 15 years or less, by 2030 initiatives should be focused on the promotion and support of an innovative global food system that is efficient, inclusive, climate-smart, sustainable, nutrition- and health-driven, and business-friendly (IFPRI website, 2016).
The G20’s third global community forum of agriculture ministers from the world’s 20 major economies met with leaders of international organizations: United Nations’ Food and Agriculture Organization (FAO), World Food Program and the International Fund for Agricultural Development and discussed global agricultural development and cooperation. Global leaders reaffirmed that agriculture and rural development are crucial to global food security and poverty alleviation, and can contribute towards inclusive economic
growth, social stability and the sustainable use of natural resources. Science, technology and social innovations play important and leading roles in sustainable agricultural growth (CBU, 15 June 2016).
In a Forum for the Future of Agriculture in Brussels, the FAO Director General Jose Graziano da Silva called for new combinations of policies, programmes, partnerships and investments to achieve common goals and produce the most needed public goods. He also underscored the need to utilize a broad portfolio of tools and approaches, including agroecology and biotechnology to eradicate hunger, fight every form of malnutrition and achieve sustainable agriculture. These tools ought to serve the needs of family members, whose empowerment should be a central part
Benefits of Biotech/Genetically Modified Crops
Country food feed Cultivation total1 Argentina 14 14 14 422 Japan 13 11 11 353 Australia 13 10 10 334 Canada 7 7 7 215 South Korea 9 12 0 216 European Union 9 9 0 187 USA 6 6 6 188 Malaysia 8 8 0 169 Taiwan 11 0 0 11
10 Colombia 9 0 0 911 Brazil 1 4 1 612 South Africa 3 3 0 613 Vietnam 3 3 0 614 New Zealand 5 0 0 515 Singapore 3 0 0 316 Indonesia 1 0 0 1
total 115 87 49 251
table 37. approvals per Country for 2016
Source: ISAAA GM Approval Database
Global Status of Commercialized Biotech/GM Crops: 2016
99
of sustainable development interventions, as well as the 80% of the extreme poor and undernourished people that live in rural areas (CBU, 30 March 2016).
Biotechnology has been regarded as the fastest agricultural technology adopted by farmers in the last two decades. The area planted to biotech crops has increased, with continuous growth in year-to-year increments, to reach close to optimum adoption in the top five producing countries. The increase in the number of countries from six in 1996 to up to 30 countries in the 20 years of commercialization. It is expected that biotech crops will be adopted by more countries in the future.
Benefits to the environment, consumers and the food industry, and livestock and poultry industry from biotech crops have been documented in the last two decades. Since 1996, biotech crops have contributed to sustainability, helped mitigate the effects of climate change and helped to alleviate poverty and hunger. Essential data from the analysis of Brookes and Barfoot (2017, Forthcoming), with key messages are presented below to effectively convey the benefits of biotech crops and products.
Biotech crops increase productivity by 574 million tons and economic gain of smallholder farmers by uS$167.8 billion
For the last two decades (1996-2015), biotech crops and products have contributed to food, feed and fiber security, and self sufficiency through increased productivity and economic gain. In only two decades, biotech crops have contributed to the alleviation of poverty and hunger at an economic value of US$167.8 billion, an increase of 12% compared to the accumulative gains for 19 years (1996-2014) by US$150.3 billion. Production costs have been reduced by 28% and yield gains of 72% have
contributed to the US$167.8 in economic gains. For 2015 alone, the total benefits were US$15.4 billion, comprised of a 15% production cost and yield gains of 85% (Table 38).
Of the four major biotech crops, maize saw the highest increase at 35.6 million tons in the last two decades. In 2015 alone, soybean realized the highest gain at 1.7 million tones (Table 38).
Insect resistance and herbicide tolerant traits used in biotech crops have consistently delivered yield gains from reduced pest damage. Brookes and Barfoot (2016) reported that the average yield gains over the 1996-2014 period has been 13% for insect resistant maize and 17.3% for insect resistant cotton as compared to conventional systems. For insect resistant soybeans, farmers have achieved an average of 9.4% yield improvement. In addition, herbicide tolerant technology used in soybeans contributed to increased production by controlling weeds and providing higher yields. In Argentina, farmers use no-till technology allowing them to conveniently grow second crop soybeans after wheat in the same growing season.
Three staple crops: rice, wheat and potato have been improved to resist pests and diseases, increase yield and reduce wastage. These three biotech staple crops, once commercialized, have huge potential to be adopted in developing countries and play a big role in ensuring food security. This is a major challenge, given the projected need to increase world food production by 40% in the next 20 years and 70% by 2050.
Biotech crops conserve biodiversity and saved 174 million hectares of land
The rapid growth of human population as well as anthropogenic activities have a huge impact in the agricultural landscape. To provide food
Benefits of Biotech/Genetically Modified Crops

Global Status of Commercialized Biotech/GM Crops: 2016
100
and shelter to the burgeoning population, lowlands of tropical, subtropical and temperate regions have been stripped of more than half of their original vegetation, with the remaining natural habitats persisting only in relatively small patches. In many ways, agriculture has contributed to a loss of biodiversity, but with modern forms of agriculture, including genetic engineering, loss of biodiversity is slowed down. This is because existing crop varieties have been improved with new economic traits including yield and resistance to biotic and abiotic stresses so that the optimum amount of food can be produced in the same or smaller area of about 1.5 billion hectares, saving biodiversity in land areas and forest sanctuaries.
In the last two decades (1996-2015), the 574 million tons of productivity gained through biotechnology has saved 174 million hectares of land from being ploughed and cultivated (Table 39). This is an 11.5% increase from previous data for the last 19 years. For 2015 alone, with a slight reduction in productivity of 65.8 million
tons, there was a corresponding land saving of 19.4 million hectares.
Biotech crops reduce agriculture’s environmental footprint by 620 million kgs active ingredient
Before the commercialization of biotech crops, farmers used to endlessly rip up or till the soil to exhaust pernicious weeds that affect growth and yield of food crops. With the introduction of herbicides, farmers used a variety of pesticides, which of these at least 68% had high toxicity scores. Indiscriminate use of pesticides had a negative impact on the environment. In 2006, the majority of farmers had switched to the less toxic glyphosate with a.i. comprised of 85% of herbicide use, making it the most widely used and successful herbicide on the market to date.
Recent attention by critics of biotech crops to the seemingly increased glyphosate use has again stirred criticisms about the environmental
Benefits of Biotech/Genetically Modified Crops
1996-2014 1996-2015 2014 alone 2015 aloneeconomic BenefitsTotal (Billion, US$) 150.3 167.8 17.8 15.4
a. Reduced Production Cost** (billion US$, %)
52.6 (35%) 46.9 (28%) 2.7 (15%) 2.3 (15%)
b. Yield Gain (billion US$, %) 97.7 (65%) 120.9 (72%) 15.1 (85%) 13.1 (85%)Productivity (million tons)Total 514.7 574 75 65.8
a. Soybean 158.4 180.3 20.2 21.9b. Maize 322.4 358.0 50.8 40.3c. Cotton lint 24.7 25.2 2.9 2.2d. Canola 9.2 10.6 1.2 1.4
table 38. economic Gains and Productivity at the farm level*
** Less ploughing, fewer pesticide sprays and less labor* Brookes and Barfoot, 2017, Forthcoming

Global Status of Commercialized Biotech/GM Crops: 2016
101
Benefits of Biotech/Genetically Modified Crops
1996-2014 1996-2015 2014 alone 2015 aloneProductivity (Million Tons ) 514.7 574 75 65.8Area Saved (Million Hectares) 152 174 20.8 19.4
table 39. land Savings through Biotech Crops*
* Brookes and Barfoot, 2017, Forthcoming
safety of the herbicide. However, various scientific accounts in the past 40 years prove that it poses no threat to human health. In addition, the reported increase in volume of herbicide use in agricultural systems is a poor measure of environmental impact because glyphosate is less harmful to the environment than the herbicides it has replaced. The increase in amount is therefore inconsequential because the safety of consumers and the environment is the net effect of the change.
Contrary to biotech critics, reports by Brookes and Barfoot (2017, Forthcoming) revealed that by using biotech crops, environmental footprint from agriculture was reduced over the last two decades by 619 million kgs of active ingredient – a 6% increase from the savings incurred in the period 1996-2014 (Table 40). In 2015 alone, there was a slight decline (-7%) in the amount of pesticide applications compared to 2014, due to reduced planting of maize and cotton in 2015. In addition, with the prolonged use of the technology, the reduction of environmental impact quotient (EIQ) increases, protecting the agricultural environment of soil and water. EIQ is a numerical representation of the risks a pesticide poses for the environment, consumers and farm workers.
Biotech crops mitigate climate change with savings of 23.9 billion kgs of Co2
Conventional breeding is losing the battle against climate change. The rate at which
temperatures across the globe are increasing and the frequency of climate-change related stresses occur are outpacing the speed at which new adapted crop varieties are developed and deployed.
Biotech crops contribute to a reduction of greenhouse gases and help mitigate climate change by permanent savings in carbon dioxide emissions. This is achieved through reduced use of fossil-based fuels associated with fewer insecticide and herbicide applications and reduction in farm operations such as ploughing in no-till agriculture associated with the use of herbicide tolerant crops.
In 2015 alone, a total savings of 26.7 billion kgs of CO2 was realized – a slight reduction (1.1%) from 27 billion kgs in 2014 (Table 41). It is noteworthy that reduction due to ploughing/tilling contributes greatly to reduced CO2 emission. Tilling mechanically turns over and breaks up soil to prepare for planting. It incurs the use of fossil fuels and at the same time leaves soil vulnerable to erosion and contributes to increased pollution and sedimentation in streams and rivers and loss of land to desertification. According to the World Wildlife Foundation, half of the topsoil on the planet has been lost in the last 150 years. Less tilling results in less erosion, more water retention, and fewer greenhouse gas emissions due to fewer trips across the fields and lowered fuel costs as well as decreases machinery maintenance costs.

Global Status of Commercialized Biotech/GM Crops: 2016
102
Reduced CO2 emissions from biotech crops in 2015 can be equated to removal of ~12 million cars, similar to 2014.
Biotech crops help mitigate climate change-associated problems such as drought
With a changing climate, abiotic stresses such as drought, submergence and high temperatures will be experienced for the first time in many growing areas. Water is one of the critical factors in producing food, fuel and fiber, and preserving water is critical to sustainable
agriculture. The incidence of drought and its accompanying risks has been increasing worldwide since the 1970’s according to the US Environmental Protection Agency. By 2025, the United Nations estimates that 1.8 billion people will be living in countries or regions with absolute water scarcity, and two-thirds of the world population could be under stressful water conditions. Current biotech crops have been designed to address these problems:
a. Drought tolerant maize that has been commercialized since 2013 and planted on ~1.2 million hectares in the US in
Benefits of Biotech/Genetically Modified Crops
2014 alone 2015 aloneSavings in Co2 emissions due to reduced use of fossil-based fuels (Billion kgs)
a. Due to reduced insecticide and herbicide sprays 2.20 2.80b. Due to reduced ploughing 24.8 23.9
Total CO2 emissions 27.0 26.7Reduction in number of cars off the road (Million)
a. Due to reduced insecticide and herbicide sprays 0.97 1.25 b. Due to reduced ploughing 11 ~11 (10.6)
Total cars off the road 12 ~12 (11.9)
table 41. Savings on Co2 emissions equated with Number of Cars off the Road*
* Brookes and Barfoot, 2017, Forthcoming
1996-2014 1996-2015 2014 alone 2015 aloneReduction in pesticides (Million kgs active ingredient, a.i.)
583.5 619 40.4 37.4
Pesticides savings (%) 8.2% 8.1% 6.4% 6.1Reduction in (EIQ)** 18.5% 19% 17.6% 18.5
table 40. Reduction in Pesticides and environmental impact Quotient*
** Environmental Impact Quotient (EIQ) = a composite measure based on the various factors contributing to the environmental impact of an individual active ingredient.* Brookes and Barfoot, 2017, Forthcoming.

Global Status of Commercialized Biotech/GM Crops: 2016
103
2016, can reduce transpiration by 175% under stress conditions. This allows for better moisture retention to reduce drought conditions without additional irrigation.
b. The Water Efficient Maize for Africa project is developing drought tolerant and insect resistant maize for small holder farmers in Sub Saharan Africa, with selected commercialization in 2017 and full commercialization in 2018. Sugarcane in Indonesia and Argentina, and wheat in Australia are also being developed to be drought resistant.
c. No-tillage agriculture, enabled through the use of herbicide tolerant biotech crops, prevents soil erosion and has maintained cleaner waterways in 6,400 bodies of water, including an average of 128 lakes, streams and rivers per state in the US.
d. Development of nitrogen and nutrient-efficient biotech crops will help reduce run-offs into waterways and can boost yields of up to 15% more per acre.
Thus, biotech crops and technologies can preserve water and soil and are key to sustainable agriculture.
other studies on environmental benefits and safety of biotech crops
a. A 2014 meta-analysis of the impacts of GM crops published by Wilhelm Klümper and Matin Qaim found that on average, GM technology adoption has reduced chemical pesticide applications by 37%, increased crop yields by 22%, and increased farmer profits by 68%, offering proof that with GMOs what’s good for the environment can also be good for farmer’s bottom lines.
b. A Purdue University study to assess the economic and environmental value of GM crops revealed that replacing biotech maize,
soybean and cotton with conventionally-bred varieties worldwide would cause a price hike on food by 0.27 to 2.2%, and the equivalent of nearly a billion tons of CO2 released into the atmosphere (Tyner et al. 2016). If the global rate of biotech crop planting is patterned after the US, global greenhouse emissions would fall by 0.2 billion tons of CO2 and would allow 0.8 million hectares of cropland to be converted back to forests and pastures.
c. The halo effect is one immeasurable environmental effect of biotech crops, where organic and conventional farms adjacent to biotech farms benefit from fewer insects and other problems. Examples include: i.) the planting of conventional papaya in close proximity to biotech papaya has resulted in protection from pests and ringspot virus; ii.) Bt cotton in China has dramatically reduced the need to spray insecticides on non-Bt crops due to reduced bollworm incidence; and similarly, iii.)Bt maize plantings in Europe and the US benefited non-biotech maize farmers due to reduced insecticide applications.
Biotech crops are safe for humans
University of Wisconsin study concludes that biotech crops are safe
A survey covering 900 reports on studies of biotech crops impact on health was conducted by the Department of Life Sciences Communication at the University of Wisconsin (NBC News, 17 May 2016). The committee focused on concerns that biotech food consumption might lead to a higher incidence of specific health problems including cancer, obesity, gastrointestinal tract illnesses, kidney disease, and such disorders as autism, spectrum and allergies. The assessment of epidemiological data on the incidence of cancers and other human health problems over
Benefits of Biotech/Genetically Modified Crops

Global Status of Commercialized Biotech/GM Crops: 2016
104
time found no substantial evidence that foods from biotech crops were less safe than foods from non-biotech crops. The conclusions from the study are:
• There is no evidence of large-scale negative health effects on people from genetically modified foods.
• There is some evidence that crops genetically engineered to resist bugs have benefited people by reducing cases of insecticide poisoning.
• There are crops genetically engineered to benefit human health, such as those altered to produce more vitamin A, can reduce blindness and deaths due to vitamin A deficiency.
• Using insect-resistant or herbicide-resistant crops did not damage plant or insect diversity and in some cases increased the diversity of insects.
• Sometimes, the added genes do leak out to nearby plants - a process called gene flow, a natural phenomenon in agriculture - but there is no evidence it has caused harm.
• In general, farmers who use GM soybean, cotton, and maize make more money but it does depend on how bad pests are and allover farming practices.
• GM crops do reduce losses to pests. • If farmers use insect-resistant crops but
don’t take enough care, sometimes pest insects develop resistance, a natural occurence.
International scientific professional organizations attest to safety of biotech crops
The Genetic Literacy Project republished statements on the safety of biotech crops from 10 of the more prestigious international scientific organizations (2016). They are (with some modifications):
• the american Medical association
(Chicago). There is no scientific justification for special labelling of genetically modified foods. Bioengineered foods have been consumed for close to 20 years, and during that time, no overt consequences on human health have been reported and/or substantiated in the peer-reviewed literature.
• the american association for the advancement of Science (Washington D.C.). The science is quite clear: crop improvement by the modern molecular techniques of biotechnology is safe.
• the National academy of Sciences (Washington DC). Biotech crops are safe for human and animal consumption and have not increased the risk for any medical condition. There is no difference between traditional and biotech crops in terms of risks to human health, nor any negative effects on the environment from biotech crops.
• food Standards australia New zealand (Australia & New Zealand). “Gene technology has not been shown to introduce any new or altered hazards into the food supply, therefore the potential for long term risks associated with GM foods is considered to be no different to that for conventional foods already in the food supply.”
• the french academy of Science (France). All criticisms against GMOs can be largely rejected on strictly scientific criteria
• the Royal Society of Medicine (United Kingdom). “Foods derived from GM crops have been consumed by hundreds of millions of people across the world for more than 15 years, with
Benefits of Biotech/Genetically Modified Crops

Global Status of Commercialized Biotech/GM Crops: 2016
105
no reported ill effects (or legal cases related to human health), despite many of the consumers coming from that most litigious of countries, the USA.”
• the european Commission (Belgium). “The main conclusion to be drawn from the efforts of more than 130 research projects, covering a period of more than 25 years of research, and involving more than 500 independent research groups, is that biotechnology, and in particular GMOs, are no more risky than conventional plant breeding technologies.”
• the union of German academics of Sciences and humanities (Germany). “In consuming food derived from GM plants approved in the EU and in the USA, the risk is in no way higher than in the consumption of food from conventionally grown plants. On the contrary, in some cases food from GM plants appears to be superior in respect to health’
• Seven of the World’s academies of Sciences (Brazil, China, India, Mexico, the Third World Academy of Sciences, the Royal Society, and the National Academy of Sciences of the U.S.). “Foods can be produced through the use of GM technology that are more nutritious, stable in storage and in principle, health promoting— bringing benefits to consumers in both industrialized and developing nations.”
• World health organization (Switzerland) “No effects on human health have been shown as a result of the consumption of GM foods by the general population in the countries where they have been approved.”
Nobel Laureates support biotech crops
With all the scientific bodies supporting safety of biotech crops, it was no surprise that Sir Richard Roberts, a Nobel Laureate in physiology or medicine led 123 Nobel Laureates to voice support of biotech crops, its food and feed safety, positive environmental impact and benefits to biodiversity. The letter was presented during a press conference at the National Press Club, Washington D.C. on 30 June 2016. The scientists denounced Greenpeace for its continuous attempts to oppose modern plant breeding, specifically biotechnological innovations by misinterpreting risks, benefits and impacts, and supporting the criminal destruction of approved field trials and research projects. They also called upon governments to reject Greenpeace’s campaign against biotechnology and Golden Rice, and support measures to accelerate access of farmers to all the tools of biotechnology. The letter with all the signatures can be seen at http://supportprecisionagriculture.org/nobel-laureate-gmo-letter_rjr.html.
US National Academies finds biotech crops safe
Genetically engineered (GE) crops and conventionally bred crops have no difference in terms of causing risks to human health and the environment, according to the report, Genetically Engineered Crops: Experiences and Prospects released by the National Academies of Sciences, Engineering, and Medicine. The report is based on the results of an extensive study that was conducted by over 50 scientists for two years. The study includes data from 900 researches on biotech crops since it was commercialized in 1996.
The key points of the report include:
• Studies with animals and research on the chemical composition of GE
Benefits of Biotech/Genetically Modified Crops

Global Status of Commercialized Biotech/GM Crops: 2016
106
foods currently on the market reveal no differences that would implicate a higher risk to human health and safety than from eating their non-GE counterparts.
• The use of insect resistant or herbicide tolerant crops did not reduce the overall diversity of plant and insect life on farms, and sometimes insect resistant crops resulted in increased insect diversity.
• Commercially available biotech crops had favorable economic outcomes for farmers who adopted these crops.
• Insect resistant crops have had benefits to human health by reducing insecticide poisonings.
• Several GE crops are in development that are designed to benefit human health, such as rice with increased beta-carotene content to help prevent blindness and death caused by vitamin A deficiencies in some developing nations.
futuRe of BioteCh CRoPS: a GaMe ChaNGeR
third Generation Biotech Crops Cater to Consumers
The development and release of biotech crops follows a borderless trend in terms of crop/trait. This trend maybe considered as a strategy by food developers to gain acceptance of products. The first generation biotech crops catered to farmers and food producers to increase yield and resist biotic stresses. The second generation biotech crops includes stacking IR/HT traits and those traits that can help mitigate the effects of climate change. The third generation of biotech crops will include ones that will cater to consumers and the food and manufacturing industry.
First generation biotech crops with agronomic traits
The first generation of biotech crops predominantly included the input traits such as herbicide tolerance, disease and insect resistance. These were deployed in the four major biotech crops of soybean, cotton, maize and canola. Since 1996, there have been a number of single and stacked same trait events (IR/IR and HT/HT) that were commercialized with HT soybean, with IR cotton having the most number of events. From the time these crops were first planted, huge economic benefits have been derived by farmers, the highest being from insect resistant cotton at US$50.3 billion (Table 42). IR (Bt) cotton benefits farmers in India, USA, Pakistan, China, and Brazil which are the top 5 growing countries. The next crop/trait with the highest economic benefits is herbicide tolerant soybean at US$50.04 billion. Large hectarages of HT soybean were planted in Brazil, USA, Argentina, Paraguay and Canada, the top five countries.
Second generation biotech crops with stacked input traits
The second generation input traits include various stacks of IR/HT in soybean, maize, and cotton which result in reduced production costs and ease in farming. These traits were released towards the end of the first decade (1996-2005) and the beginning of the second decade (2006-2015). Benefits for stacked maize was US$12.5 billion and the stacked soybean US$2.4 billion (Table 42). Second generation crops also possess traits to address problems associated with climate change such as drought, salt intrusion and cold tolerances. Drought tolerant maize launched in 2013 in the US at 50,000 hectares and increased to ~1.2 million hectares in the US in 2016, can reduce transpiration by 175% under stress conditions.
Benefits of Biotech/Genetically Modified Crops

Global Status of Commercialized Biotech/GM Crops: 2016
107
Crops by trait No. of events approved**
duration of Planting
2015 Cumulative
Single traitsHT soybean 18 1996-2015 3,822 50.04HT maize 16 1997-2015 788 11,104HT cotton 13 1997-2015 117 1,773HT canola 8 1996-2015 655 5,480HT sugar beet 3 1996-2015 54 410.6IR maize 10 1996-2015 3,356 33,401IR cotton 18 1996-2015 3,267 50,275VR papaya 4 1999-2015 1.4 27.9VR squash 2 1999-2015 10.4 278.8
Stacked traitsIntacta™ soybean 1 2013-2015 1,227 2,405CRW maize 63 2003-2015 1,107 12,557
total 15,405 167,751
table 42. economic Benefits by trait/Crops (Million uS$), 2015*
Source: *Brookes and Barfoot, 2017 Forthcoming **ISAAA GM Approval Database, as of December 31, 2016
Third generation biotech crops for nutrition and product quality
It is noteworthy that human nutrition and well-being has become an essential component of the overall global food production strategy and was highlighted at the 2016 World Food Prize. World Food Prize winners Maria Andrade, Howarth Bouis, Jan Low and Robert Mwanga were awarded for their efforts to uplift the health and well-being of the global poor and malnourished population. Andrade, Low, and Mwanga of the International Potato Center (CIP) were recognized for their efforts in developing “the single most successful example of biofortification” which is the orange-fleshed sweet potato. Bouis was lauded for creating HarvestPlus, an organization that focuses on improving nutrition and public health through biofortification (CBU, 26 October 2016).
Likewise, third generation biotech crops are also geared towards improving nutritional quality.
The focus for third generation biotech crops is on developing output traits for improved product quality and composition such as modified oils (omega-3 fatty acids and high oleic acid in soybean), modified starch/sugar (potato), low-lignin (alfalfa), non-browning fruits (potatoes, apples) that are already available in the market; and increased beta-carotene, ferritin, and Vitamin E in major staple crops, which are in the advanced stages of development. Soybean has the most output traits to offer consumers with a high oleic acid event that reduces trans fats; low phytate soybean to reduce phosphorous levels in animal manure and improve mineral absorption by the human body; high omega-3 soybean for human health benefits; and high stearic acid soybean
Future of Biotech Crops: A Game Changer

Global Status of Commercialized Biotech/GM Crops: 2016
108
to improve food processing and reduce harmful fats.
The biotech Amflora potato with high amylose content was approved for planting in the EU in 2011 by Germany (two hectares) and Sweden (15 hectares), but was ceased due to unsupportive policies in the region. In 2014, a new biotech low-lignin alfalfa event KK179 was approved for cultivation in the US and in 2016 in Canada. The product, which has less lignin, has higher digestibility and offer a 15 to 20% increase in yield. The US planted 20,000 hectares and Canada ~1,000 hectares in 2016.
Currently, there are biotech crops developed and adopted by growers that can help reduce food waste and environmental impact. FAO stated that the world produces enough food to feed everyone on the planet, but nearly 800 million people around the world suffer from hunger because approximately 1.3 trillion tonnes of food per year is lost or wasted. In the US alone, the Environmental Protection Agency (EPA) estimates approximately 31% or 133 billion pounds of the US food supply is wasted annually, contributing to 18% of the total methane emission that comes from landfills. In addition, almost half of all the fruits and vegetables that are wasted each year because consumers prefer crops that always look fresh and unblemished. Through biotechnology, crops designed with non-browning and non-bruising traits becomes available and greatly eliminate losses due to wastage.
Innate™ Potato Generation 1Three varieties of biotech Innate™ potatoes – Russet Burbank, Ranger Russet and Atlantic have fewer black spots from bruising, stay white longer when cut or peeled, and have lower levels of naturally-occurring asparagine, resulting in less acrylamide when cooked at high temperatures. Innate™ potatoes are also less prone to pressure bruising during storage, resulting in less potato waste and potentially
millions of dollars in savings to growers every year. J.R. Simplot Co., the technology developer, used the techniques of modern biotechnology to accelerate the traditional breeding process and introduced new traits by triggering the potato’s own RNA interference (RNAi) pathway. The three Innate™ varieties were available in limited quantities (400 acres or 162 hectares) beginning in 2015 in the fresh whole and fresh-cut markets. The sustainability, higher quality and health benefits have significant value to growers and consumers. In 2016, this generation 1 potato was planted on 2,500 hectares in the US. In October 2016, two variants of the generation two event (with late blight resistance, low acrylamide potential, reduced black spot bruising, and lowered reducing sugar), Simplot’s Ranger Russet and Atlantic varieties, were given clearance by USDA for commercial planting sometime in 2017.
Non-Browning Biotech Arctic® Apples The non-browning apple varieties, Arctic®Golden, Arctic®Granny and Arctic®Fuji apples, developed by Okanagan Specialty Fruits Inc. (OSF), Canada were approved in the US in 2015, and in 2016 in Canada. Some 70,000 trees were planted on ~81 hectares in 2016 and harvests will be sold in the North American market in the beginning of 2017. The company plans to increase the area to cover 300,000 trees in 2017 and 500,000 trees in 2018. Harvested apples can supply over 30 million pounds per year.
New developments and Products in the Pipeline
According to Parisi et al (2016), the number of GM events at the commercial cultivation, pre-commercial or regulatory stages has more than doubled between 2008 and 2014. The roster of new approvals recorded in the ISAAA GM Approval Database (Trends in GM Approval section) shows the predominance of
Future of Biotech Crops: A Game Changer

Global Status of Commercialized Biotech/GM Crops: 2016
109
insect resistant and herbicide tolerant traits, as well as gene stacking in the four major crops. Industry biotech crops in the pipeline published by CropLife International (2016) listed more stacking of the IR/HT traits and some few specialty products for soybean and canola. Examples of biotech crops in the pipeline in some public sector research institutes (Table 43) are also geared towards yield and biomass improvement, disease resistance and improved nutrition and product quality. This indicates that both public and industry technology developers are addressing a broader and wider needs of both farmers and consumers.
BioteCh/GM CRoP ReGulatioN SuPPoRtive of iNNovatioN
the need for Biotech/GM Crop Regulation
With the mounting pressure of an increasing population, dwindling natural resources and problems brought upon by climate change, food producers need innovative technologies that will provide accessible, affordable, and stable supply of food, feed, and fiber for the global population. Innovative methods and techniques such as biotechnology include new strategies that can accelerate the development of improved crops with high yield, resistance to disease, pest and environmental stresses, and enhanced nutritional quality. Biotechnology has proven to contribute to these endeavors in the last two decades as described in this Brief. GM foods and products offer a range of benefits including reduced yield losses; decreased environmental degradation; nutritionally-enhanced foods; better use of land, water and fertilizer; reduced pollution and greenhouse gas emission; and reduced pesticide applications and diesel use for farm machinery.
Simultaneous to the advent of these technologies was the evolution of regulation that applies to the processes and products of
genetic modification. These regulations cover experiments in the laboratory, screen house, confined field trials and multi location field trials; market release; and processing. The controlled research and testing of promising crops has been undertaken scientifically and carefully following international standard procedures of food and environmental safety before release of all GM crops and products to the market. These safety testing trials and procedures require time and money, and delays in the completion of these procedures will jeopardize the benefits that the global community will derive from these technologies. Thus, these activities should be undertaken as a priority and not be ignored given the significant need to improve food security and prepare for the potential impacts of climate change, especially in developing nations.
The regulation of GM foods is both a public and a scientific issue, and scientists and policy makers have a duty to inform and engage the public on risks, benefits and ultimately on judgment of acceptability. However, reaching farmers and consumers to benefit from these technologies is hindered by regulatory barriers that are not necessarily based on science. There is thus a need to improve the regulatory capacity and efficiency of biosafety frameworks in many nations, more importantly in the developing countries, (by utilizing data transportability on risk assessments for example), so that farmers and consumers can have informed-choice of what to plant and consume based on yield, profitability, affordability, nutrition and safety.
absence of Regulation
Introduction of biotech crops in a country is motivated by farmers’ economic needs and the all important desire to make farming easier, problem-free from weeds, pests
Biotech/GM Crop Regulation Supportive of Innovation

Global Status of Commercialized Biotech/GM Crops: 2016
110
Country Crop trait developerAustralia Banana Fusarium wilt resistance Queensland University of
Technology Wheat Disease resistance, drought
tolerance, altered oil content and altered grain composition
Commonwealth Scientific and Industrial Resarch Organization (CSIRO)
New Zealand Ryegrass Better nutritional quality and energy system; high metabolizable energy
AgResearch, New Zealand
United Kingdom Wheat Yield and biomass Rothamstead Agricultural Research,
European Union Potato Maris Piper
Blight and nematode resistant, less bruising and less acrylamide
The Sainsbury Laboratory (TSL)
European Union Camelina Omega-3LC-PUFAS (Omega-3 long chain polyunsaturated fatty acids
Rothamstead Research
Malawi Bananas Bunchy top virus Byumbwe Research Station Uganda Potato
varieties Desiree and Victoria
Late blight resistance Kachwekano Zonal Agricultural Research and Development Institute
India Indian Mustard
Barnase-barstar system to induce heterosis
Delhi University South Campus
Chickpea Insect resistance with cry7Ac, Cry1Aabc
ICAR-Indian Institute of Pulses Research
Pigeonpea Insect resistance with cry7Ac, Cry1Aabc
ICAR-Indian Institute of Pulses Research
Sugarcane Drought tolerance with DREB gene
Sugarcane Research Institure, UP Council of Sugarcane (UPCSUR), Shahjahanpur
Philippines, Bangladesh
Rice ß-carotene IRRI, PhilRice, BARI
table 43. Crops and traits under field testing by the Public Sector in 2016
Compiled by: ISAAA, 2016
Biotech/GM Crop Regulation Supportive of Innovation

Global Status of Commercialized Biotech/GM Crops: 2016
111
and diseases, and to have excellent quality of produce. Some countries went through the back door introduction of biotech seeds before any regulatory framework was ever established (Sinebo and Maredia, 2016). More often, once farmers discovered the benefits of the biotech seeds, they themselves put pressure on the government to expedite the formulation of the regulatory framework so they could continue to enjoy the benefits of biotech crops.
If left unattended however, the lack of or insufficient regulation results in substandard or spurious biotech seeds and often times a mix of biotech and non-biotech seeds, which are sold to farmers at a lower cost. These seeds definitely lack the efficiency, performance and productivity of the biotech trait and results in farm losses (Sinebo and Maredia, 2016).
Thus, a workable process in regulating biotech/GM crops is essential and should be a product of the national government’s initiative with scientists, biosafety regulatory bodies, biotech companies and high level policy makers.
It has been recorded that opportunity cost is high when there is over and under regulation of GM crops (Smyth, 2017). The cost of lost opportunity to farmers and consumers should be considered in biosafety risk analysis and in decision-making.
food Safety Regulation
The food safety of biotech crops and products over the last two decades of biotech crop commercialization has been impeccable with not a single recorded health incident to consumers, poultry and livestock, and non-target organisms. A vast amount of literature abound in support of biotech crop safety and
international scientific bodies have attested to this (see section on Benefits of Biotech Crops). The World Health Organization (WHO), together with FAO convened several expert consultations on the evaluation of GM foods and provided technical advice to the Codex Alimentarius Commission which was organized into the Codex Guidelines on safety assessment of GM foods. WHO keeps due attention to the safety of GM foods from the view of public health protection, in close collaboration with FAO and other international bodies.
Despite the food safety track record of biotech crops, some governments and publics still hesitate to accept biotechnology. There are reasons other than food safety which affect public attitudes to GM foods, including consumer choice, control of the global seed market and food chain, and effects on small farmers. Such concerns affect the acceptance and uptake of the technology and should be acknowledged, understood and considered during dialogues about GM products and the development of policy.
Regulatory Barriers to GM Crops adoption
Cost and structure of regulationThe global adoption of biotech crops depends heavily on the cost and structure of national regulatory systems. Regulatory compliance is getting to be a costly process – in dollars and in time. Phillips McDougall (2011) reported that the discovery, development and authorization of a new biotech derived crop trait was estimated to cost US$136 million from 2008 to 2012 timeframe. This cost and timeline becomes a huge burden to small and medium technology developers and only a few large corporate companies are able to proceed using the technology and commercializing the product (Phillips, 2014). Consequently, there becomes a misleading and wrong perception of an inherent link between GM and the large companies.
Biotech/GM Crop Regulation Supportive of Innovation

Global Status of Commercialized Biotech/GM Crops: 2016
112
Stringent and inefficient regulationEfficiency of the regulatory process is essential for the continuous adoption of biotech crops that will benefit all stakeholders. Both public and private sector developers rely on an efficient, predictable, and rigorous but non-onerous science-based regulatory process as a crucial part in the development strategy. Products of research and development contribute to solutions to address food and agriculture challenges, and delays in commercialization of these products will hinder the timely delivery of these solutions to farmers and consumers. Consequently, it will retard growth and progress of the food and manufacturing industries locally and globally. And eventually, it creates uncertainty for public and private investors in agricultural research and development, jeopardizing further investment in agricultural innovation.
Inclusion of socio-economic considerationsThe inclusion of socio-economic considerations (SEC) in the regulatory systems for GM crops may constitute an additional burden to the approval process. Assessment data of socio-economic considerations may include items such as farmers’ rights; cultural, spiritual, and ethical aspects; land tenure; labor and employment; rural-urban migration; impacts on consumer choice; and impacts on market access. Inclusion of these SEC in the regulatory process complicates and increases the time of assessment of a GM product. In developed countries, this will entail a two-year delay in the approval process which is equivalent to a return on investment (ROI) rate of 20% of a new crop variety (Smyth, 2017). Completion of the SECs parameters in developing countries is relatively more difficult given conditions where there is lack of capability to undertake and analyze the required regulatory assessments. SEC requirements in the regulatory process
would therefore hinder agricultural research and development, commercialization of GM products, and consequently, negatively impact on efforts to enhance food security globally (Smyth, 2017).
Asynchronous approvals and low level presenceThe growing trade disruptions brought by asynchronous approvals and lack of non-zero thresholds on low level presence in GM crops hinder trade among GM crop planting and importing countries. Following the Cartagena Protocol on Biosafety, countries allow entry of only approved biotech events, and follow a threshold for unapproved events. Some countries have stringent or long process of approvals that cause problems if imported products contain unapproved events, especially in a stacked event. The report and analysis by the Council for Agricultural Science and Technology (CAST, 2016) on the Impact of asynchronous approvals for biotech crops on agricultural sustainability, trade and innovation indicate that there are large volumes of trade worth billions of dollars at risk. Thorough research is needed to evaluate the global cost of asynchronous approvals and low level presence (LLP), the impacts of asynchrony on innovation and crop improvements, and the decision-making process of biotech developers, in both the public and private sectors. Timely research, and possibly, an international dialogue on trade, would inform policymaking and improve the design of policy instruments.
It is therefore imperative that a functional biosafety regulatory system should ideally balance the needs of farmers to access and utilize GM technology with regulatory measures that ensures adequate safety to the environment and human health. Furthermore, there is evidence that indicates the risks and immense losses from opportunity costs by the global community
Biotech/GM Crop Regulation Supportive of Innovation

Global Status of Commercialized Biotech/GM Crops: 2016
113
Conclusion and Closing Comments
if GM technology is not used for food security and environmental safety. This aspect should be considered in building regulatory systems. Built-in review mechanisms should also take into account new evidences and secondary benefits and costs to allow for greater flexibility and appropriate decision- making. It is important to remember that lower food costs, higher farmer incomes and new research and innovation could be realized with a more streamlined and timely approval process.
CoNCluSioN aNd CloSiNG CoMMeNtS
The year 2016 was momentous since for the first time, Nobel Laureates released a statement in support of biotechnology and condemned critics in their critical stance against the technology and Golden Rice. The UN FAO, IFPRI, the G20 countries and other like-minded bodies, guided by 2030 Agenda for Sustainable Agriculture committed to eradicate hunger and nutrition in 15 years or less. More importantly, the US National Academies of Sciences, Engineering, and Medicine published a study of 900 research studies on biotech crops since 1996 and found that genetically modified crops and conventionally-bred crops have no difference in terms of probable risks to human health and the environment. Biotech crops now have an unblemished record of safe use and consumption for over 20 years. Future generations can benefit more from wide choices of biotech crops with improved traits for high yield and nutrition that are ideally safe for consumption and the environment.
At the beginning of the third decade of commercialization of biotech/GM crops in 2016, 26 countries grew 185.1 million hectares of biotech crops predominantly with agronomic traits in the four major biotech crops of soybean, maize, cotton, and canola. The accumulated hectarage (planted since
1996) surged to a record 2.1 billion hectares or 5.3 billion acres. Of the total number of 26 countries planting biotech crops, 19 were developing countries and 7 industrial countries. The increase between 2015 and 2016 of 3%, is equivalent to 5.4 million hectares or 13.3 million acres. Developing countries grew 54% of the global biotech hectares compared to 46% for industrial countries. Soybean occupied 50% (91.4 million hectares) of the global biotech crop hectarage, 1% below the 2015 area. Herbicide tolerance has consistently been the dominant trait with 47% of the global hectarage, but is slowly declining over the years with the increasing prominence of the stacked traits. Stacked traits increased from 58.5 million hectares in 2015 to 75.4 million hectares in 2016 – an increase of 16.9 million hectares or 41%. Based on the total global crop hectarage, 78% of soybean, 64% of cotton, 26% of maize and 24% of canola were biotech crops in 2016.
The latest data for 1996 to 2015 showed that biotech crops contributed to Food Security, Sustainability and Climate Change by: increasing crop production valued at US$167.8 billion; providing a better environment, by saving 619 million kg a.i. of pesticides in 1996-2015; in 2015 alone reducing CO2 emissions by 26.7 billion kg, equivalent to taking ~12 million cars off the road for one year; conserving biodiversity in the period 1996-2015 by saving 174 million hectares of land (Brookes and Barfoot, 2017); and helping alleviate poverty for up to 16.5 million small farmers, and their families totaling >65 million people, who are some of the poorest people in the world. Biotech crops can increase productivity and income significantly and hence, can serve as an engine of rural economic growth that can contribute to the alleviation of poverty for the world’s small and resource-poor farmers. Biotech crops can contribute to a “sustainable intensification” strategy favored by many Academies of

Global Status of Commercialized Biotech/GM Crops: 2016
114
Science worldwide, which allows productivity/production to be increased only on the current 1.5 billion hectares of global crop land, thereby saving forests and biodiversity. Biotech crops are essential but are not a panacea and adherence to good farming practices, such as rotations and resistance management for insects, pathogens and weeds, are a must for biotech crops just as they are for conventional crops.
A total of US$167.8 billion was gained by countries planting biotech crops from 1996 to 2015. The highest gain was obtained by USA (US$72.9 billion), Argentina (US$21.1 billion), India (US$19.6 billion, China (US$18.6 billion), Brazil (US$16.4 billion), and Canada (US$7.3 billion). For 2015 alone, six countries gained the most economically from biotech crops in 2015; they were US (US$6.9 billion), India (US$1.3 billion), China (US$1 billion), Argentina (US$1.5 billion), Brazil (US$2.5 billion), and Canada (US$0.9 billion). Overall, US$15.4 billion, with global economic benefits was US$7.5 for developing and US$7.9 billion for industrial countries.
In 2016, the global market value of biotech crops, estimated by Cropnosis, was US$15.8 billion, representing 22% of the US$73.5 billion global crop protection market in 2016, and 35% of the ~US$45 billion global commercial seed market.
The global hectarage of biotech crops increased from 179.7 million hectares to 185.1 million hectares, a 3% increase equivalent to 5.4 million hectares in 2016. Predictions made by James, C. (2015) that the slight decline in biotech crop area in 2015 due to the low global commodity price would immediately reverse once crop prices revert to higher levels was achieved – this is contrary to propaganda from critics that biotech crops is failing farmers. Fluctuations in biotech crop hectarage of this order (both increases and
decreases ) are influenced by several factors. In 2016, these factors were: acceptance and commercialization of new products in the USA, Brazil and Australia; increasing demand for pork and livestock feeds in Brazil; needs for livestock and poultry feeds in Vietnam; favorable weather conditions and improved market price for maize in the Philippines and Honduras; need to address corn borer infestation in Spain and Slovakia; the government’s strategic plan to harness biotechnology and improve the economy in Canada; the lifting of the GM ban in West Australia; and consumers demand for more clean and healthy brinjal in Bangladesh. Biotech crops hectarage in Myanmar and Pakistan did not change, as in some small countries.
A few countries had decreased biotech crop plantings due to global low cotton prices such as in Argentina, Uruguay and Mexico, and high cotton reserve stocks particularly in China; low profitability in soybean and competition with maize in Paraguay and Uruguay; environmental stress (drought/submergence) in soybean planting in South Africa, Argentina and Bolivia; negative biotech perceptions in China as well as onerous reporting requirements in Czech Republic.
First and second generation biotech crops with insect resistance and herbicide tolerance have contributed immense economic benefits, safe and accessible food for farmers and consumers, and safety to the environment. Taking into consideration the nutritional and aesthetic needs of consumers, new biotech crops and traits were developed, adding more options for food producers including non-browning Arctic® apples, the Innate™ potato series, Golden Rice, omega 3 and high oleic acid soybeans, and lysine–enriched maize.
Finally, biotech crops are here to stay and will continue benefiting the burgeoning population
Conclusion and Closing Comments

Global Status of Commercialized Biotech/GM Crops: 2016
115
with new biotech crops and traits to cater to the needs of farmers and consumers alike. Even after 21 years of successful commercialization of biotech crops, some challenges remain, including:
• First, the regulatory barriers that limit scientific innovation and restrict technology development that would have benefited farmers and consumers.
• Second, the growing trade disruptions brought by asynchronous approvals and thresholds on low level presence (LLP) in GM crop trading countries.
• Third, the need for continuous dialogue among all stakeholders for the expeditious understanding and appreciation of biotechnology, emphasizing benefits and safety. Innovative communication modalities using social media and other forms of venue should be tapped and utilized effectively and immediately.
Overcoming these challenges is a daunting task that requires a cooperative partnership among the North and the South, East and West, and public and private sector. Only through partnerships can we be assured that nutritious and sufficient food will be readily available on the table, stable supply of feed for our poultry and livestock, and accessible clothing and shelter for everyone. Dr. Clive James, founder and emeritus chair of ISAAA, has painstakingly authored the 20 annual reports ensuring the ISAAA Brief the most credible source of information on biotech crops in the last two decades. He has been a great advocate of the technology and biotech products following the footsteps of his great mentor and colleague the late Nobel Peace Laureate Norman Borlaug,
who was also the founding patron of ISAAA. The 2016 ISAAA Brief continues this tradition of providing an up-to-date report on biotech products through information gathered through an expansive global network of biotechnology information centers and other partners.
Conclusion and Closing Comments

Global Status of Commercialized Biotech/GM Crops: 2016
116
Acknowledgments
aCKNoWledGMeNtS
ISAAA would like to acknowledge and extend its appreciation to the legion of colleagues, too numerous to name, who provided the data on adoption of commercialized biotech crops from the public and private sectors in industrial and developing countries. Without their collaboration, this publication would not be possible.
Special accolades goes to Dr. Clive James, founder and emeritus chair of ISAAA who has laid the foundation, authored the 20 annual reports (1996 to 2015) and institutionalized the ISAAA Brief, making it the most credible source of information on biotech crops in the last two decades.
Very special thanks to Dr. Paul S. Teng, Chair of ISAAA’s Board of Trustees for his valuable support to this publication, and Dr. Randy A. Hautea, ISAAA Global Coordinator and Director of the ISAAA SEAsiaCenter and his staff for always providing excellent and expeditious assistance in the preparation of the manuscript.
Well-deserved acknowledgment to Dr. Rhodora R. Aldemita for being the overall person-in-charge of developing this annual report, from coordinating with partners and collecting the relevant information, collating, verifying, and analyzing the data, writing most of the chapters, editing and proofreading the documents, expediting the preparation of the manuscript up to its publication, launch, and distribution.
Special thanks to:
Mr. Bhagirath Choudhary for preparing four country chapters: India, Pakistan, Bangladesh and Myanmar;
Dr. Margaret Karembu for contributing the chapter on Africa;
Dr. Wynand J. van der Walt for preparing the South Africa chapter;
ISAAA staff: Clement Dionglay for formatting all texts, tables, and figures, editing, and for overseeing the printing; Ian Mari E. Reaño for compiling data on GM crops regulatory approvals; and for the assistance of Kristine Grace N. Tome, Eric John F. Azucena, Zabrina J. Bugnosen, Mario DC Generoso, Panfilo de Guzman, and Domino del Prado.
ISAAA takes full responsibility for the views expressed in this publication and for any errors of omission or misinterpretation.

Global Status of Commercialized Biotech/GM Crops: 2016
117
RefeReNCeS
AG Online, 2016. Argentina to import cattle from Uruguay. http://www.qtagonline.com/argentinas-to-import-cattle-from-uruguay/.
AgProfessional. July 2015. Federal judge ruled against Hawaii county’s ban on GMO crops. http://www.agprofessional.com/news/federal-judge-ruled-against-hawaii-county%E2%80%99s-ban-gmo-crops.
Ahmad, R. 2016. Second GM crop ready for release, Daily Star, 6 January 2017.
Ali, S., 2015. Status of Agricultural Biotechnology Research and Development in Pakistan, Pakistan Agricultural Research Council (PARC) in presentation at 3rd Annual South Asia Biosafety Conference, BRAC Centre Inn, Dhaka, Bangladesh, 19-20 Sept, 2015.
Aung PP and KM Thet 2009. Biosafety and Biotechnology Status in Myanmar, Regional Biosafety Workshop, Asian Bionet, 30 November – 4 December 2009, Bangkok, Thailand.
Blaize, D, MV Venugopalan, AR Raju. 2014. Introduction of Bt cotton hybrids in India: Did it change the agronomy?, Indian Journal of Agronomy, 59 (1), pp. 1-20, March 2014.
Bloomberg Markets, 2016. Americans are buying gene-edited food that’s not labelled GMO. https://www.bloomberg.com/news/articles/2016-07-14/gene-edited-canola-oil-arrives-without-gmo-style-shopper-outrage.
Business Wire. 30 August 2016. Global genetically modified seeds market to witness growth through 2020 due to rise in adoption of bio-fuels: Reports Technovio. http://www.businesswire.com/news/home/20160830005089/en/Global-Genetically-Modified-Seeds-Market-Witness-Growth.
Business Wire. 30 August 2010. Origin Agritech Limited Reports Third Quarter Financial Results for Three Months Ended June 30, 2010. http://www.originseed.com.cn/en/news/view.php?pid=22&id=677.
Business Wire. 22 September 2010. Origin Agritech reaches worldwide agreement for Bt gene. http://www.marketwatch.com/story/origin-agritech-limited-reaches-worldwide-agreement-
for-bt-gene-2010-09-22.
CAB, 2016. Minutes of the Second Meeting of Cotton Advisory Board held in 2016 for the cotton season 2016-17, Cotton Advisory Board, the Office of the Textile Commissioner, Ministry of Textile, Government of India, 2016.
Capital Press. 21 December 2016. In Europe, GMOs rejected by consumers, embraced by farmers. http://www.capitalpress.com/Nation_World/Nation/20161221/in-europe-gmos-rejected-by-consumers-embraced-by-farmers.
Crop Biotech Update (CBU). http://www.isaaa.org/kc/cropbiotechupdate/default.asp
FFTC Agricultural Platform, 2017. Potatoes: The fourth staple food of China. http://ap.fftc.agnet.org/ap_db.php?id=739
Farmers Weekly. 2016. ‘Shallow’ debate in Europe risks food security. http://www.fwi.co.uk/arable/shallow-gm-technology-debate-in-europe-risks-food-security.htm
Freshplaza. 5 March 2015. Colombia develops research on GM potatoes. http://www.freshplaza.com/article/136209/Colombia-develops-research-on-GM-potatoes.
Freshplaza. 20 May 2015. Transgenic varieties of table grape developed in Chile. http://www.freshplaza.com/article/140082/Transgenic-varieties-of-table-grape-developed-in-Chile.
Financial Times. 21 December 2016. China province bans GMO crops for five years. https://www.ft.com/content/a221fb5e-c750-11e6-8f29-9445cac8966f.
Financial Times, 27 October 2016. How soya wealth is changing the Bolivia’s Santa Cruz Province. https://www.ft.com/content/d9b4953a-50d3-11e5-b029-b9d50a74fd14.
Food Safety News. 2013. USDA seps up citrus greening fight as GMO fix looks promising. http://www.foodsafetynews.com/2013/12/usda-steps-up-citrus-greening-fight-that-ultimately-may-require-a-gmo-fix/#.VmUF-bh97IU.
GAIN 2016. Pakistan- Cotton and products update, GAIN report number : PK1628, USDA Foreign Agriculture Service, 30 November 2016.
GOB, 2015. Seventh Five Year Plan FY2016-FY2020: Accelerating Growth, Empowering Citizens,
References
Global Status of Commercialized Biotech/GM Crops: 2016
118
Planning Commission, Government of the People’s Republic of Bangladesh, 11 November 2015
GMO Answers, 2016. How GMOs help us reduce food waste and its environmental impact. http://www.forbes.com/sites/gmoanswers/2016/11/18/gmos-help-reduce-food-waste/#37e8b13d6546.
Genetic Literacy. 2016. International science organization on crop biotechnology safety. https://www.geneticliteracyproject.org/2013/08/27/glp-infographic-international-science-organizations-on-crop-biotechnology-safety/
Germination. 6 July 2016. SU CanolaTM trait has been approved for commercialization. http://www/germination.ca/new-canola-expected-2012
Gunier, RB. A Bradman, KG Harley, K Kogut and B Eskenazi. 2016. Prenatal residential proximity to agricultural pesticide use and IQ in 7-year-old children. http://ehp.niehs.nih.gov/ehp504/#tab2.
Hawaii Tribune Herald, 2016. GMO ban rejected again: Court sides with farmers; country law remains valid. http://hawaiitribune-herald.com/news/local-news/gmo-ban-rejected-again-court-sides-farmers-county-law-remains-invalid.
Hutchison WD, EC Burkness, PD Mitchell, RD Moon, TW Leslie, SJ Fleisher, M Abrahamson, KL Hamilton, KL Steffey. ME Gray, RL Hellmich, LV Kaster. TE Hunt, RJ Wright, K Pecinovsky, TL Rabaey, BR Flood and ES Raun. 2010. Areawide suppression of European corn borer with Bt maize reaps savings to non-Bt maize growers. Science 330(6001): 222-225. http://www.sciencemag.org/content/330/6001/222.
IFPRI, 2016. The State of Food and Agriculture: Climate change, agriculture, and food security. http://www.fao.org/3/a-i6030e.pdf.
Idaho Stateman. 31 October 2016. Simplot GMO potatoes are OK says US Agriculture Department http://www.idahostatesman.com/news/business/article111660387.html.
Intrexon, 2016. First ever commercial harvest of Okanagan Specialty Fruits’ ArcticR Golden Apples Completed. http://investors.dna.com/2016-10-03-First-Ever-Commercial-Harvest-of-Okanagan-Specialty-Fruits-Arctic-Golden-Apples-Completed.
ICAC, 2016. Statement of the 75th Plenary Meeting
“Emerging Dynamics in Cotton: Enhancing Sustainability in the Cotton Value Chain, International Cotton Advisory Committee (ICAC), 3 November 2016, Pakistan.
INIA, 2016. Instituto de Investigaciones Agropeuarias, Ministerio de Agricultura, Chile. http://www.inia.cl/.
James, C. 2015. 20th Anniversary (1996to 2015) of the Global Commercialization of Biotech Crops and Biotech Crop Highlights in 2015. ISAAA Brief 51. ISAAA, Ithaca, NY, USA. http://www.isaaa.org.
J.R.Simplot website, 2016. http://www.simplot.com/plant_sciences/.
Kouser, S. Abedullah, M Qaim. 2016. Bt cotton and employment effects for female agricultural laborers in Pakistan, New Biotechnology, Volume 34, 25 January 2017, Pages 40–46, 2016. https://www.ncbi.nlm.nih.gov/pubmed/?term=Abedullah%5BAuthor%5D&cauthor=true&cauthor_uid=27184619.
Kyi, T. 2016. Overview of Agriculture Policy in Myanmar, FFTC Agricultural Policy Articles, FFTC, 26 April 2016.
Lwin Oo, T. 2016. Current Situation of PVP in Myanmar, 9th EAPVP Forum Meeting in Vietnam, 6 September 2016.
MAFF, 2011. Ministry of Agriculture, Forestry and Fisheries. http://www.caa.go.jp/jas/hyoji/pdf/kijun_03.pdf
MOEF, 2010. Decision on commercialization of IR brinjal, Minister’s report, Minister of State for Environment and Forest (MOEF), Government of India dated 9th Feb 2010.
MOEF&CC, 2016. Minutes of GEAC meeting 126, 127, 128, 129, 130 and 131, the Genetic Engineering Appraisal Committee, the Ministry of Environment, Forests and Climate Change, 2016.
MOEF&CC, 2016a. Assessment of Food and Environmental Safety (AFES), the Ministry of Environment, Forests and Climate Change, 2016.
MOEF&CC, 2016b. Note inviting Comments on Safety Assessment Report of Sub-Committee on GE Mustard, the Ministry of Environment, Forests and Climate Change, 5 Sept 2016.
Ma, X, M Smale, DJ Spielman, P Zambrano, H Nazla and F Zaidi. 2016. Varietal integrity, damage
References

Global Status of Commercialized Biotech/GM Crops: 2016
119
abatement, and productivity: Evidence from the cultivation of Bt cotton in Pakistan, IFPRI discussion paper, 2016. http://www.ifpri.org/publication/varietal-integrity-damage-abatement-and-productivity-evidence-cultivation-bt-cotton
McDougall, P. 2011. The cost and time involved in the discovery, development and authorisation of a new plant biotechnology derived trait. https://croplife.org/wp-content/uploads/2014/04/Getting-a-Biotech-Crop-to-Market-Phillips-McDougall-Study.pdf
Medellin-Azuara, J, D MacEwan, R E Howitt, DA Sumner, and JR Lund. 2016. Economic Impacts of the 2016 California Drought for Agriculture. Center for Watershed Sciences, UD Davis, University of California Agricultural Issues Center. https://watershed.ucdavis.edu/files/Executive_Summary_Drought_Report.pdf.
Monsanto Canada. 29 March 2016. Forage Genetics to sell HarvXtra alfalfa with Roundup Ready technology in Eastern Canada in 2016. http://www.monsanto.ca/newsviews/Pages/SU-2016-03-29.aspx
Myanmar Times, 2015. US agricultural giant ramps up in Myanmar, Myanmar Times, 27 October 2015.
Myanmar Times, 2016. Magwe University tests genetically modified groundnuts. http://www.mmtimes.com/index.php/business/19747-magwe-university-tests-genetically-modified-groundnuts.html.
Muhammad, P. 2016. Cotton crop: Ministry proposes strict monitoring of Bt varieties, the Express Tribune, 15 May 2016.
NBC News. 21 October 2016. USDA approves genetically engineered potatoes. http://www.nbcnews.com/health/health-news/gm-potatoes-get-usda-ok-n675856.
NBC News. 17 May 2016. Genetically modified crops are safe, report says. http://www.nbcnews.com/health/health-news/genetically-modified-crops-are-safe-report-says-n575436
Phillips, PWB. 2014. Economic consequences of regulations of GM Crops. https://www.geneticliteracyproject.org/2014/12/11/economic-consequences-of-regulations-of-gm-crops/.
Phys.org. 31 October 2016. US approves two types of genetically-engineered potatoes. https://phys.org/news/2016-10-genetically-potatoes.html
Phys.org, 19 January 2016. New genetically-engineered American chestnut will help restore the decimated, iconic tree. https://phys.org/news/2016-01-genetically-american-chestnut-decimated-iconic.html.
President Office. 2012. Enforcement of Farmland Law designated Notification No. 62/2012, Notification No. 62/2012, President Office, Republic of the Union of Myanmar, 2012.
Producer.com. 23 June 2016. Biotech, a tough sell in Europe: European governments heavily influenced by environmental groups approved to GM foods. http://www.producer.com/2016/06/biotech-a-tough-sell-in-europe/
Reuters. 15 April 2016. French court hands symbolic win to GMO maize supporters. http://www.reuters.com/article/us-france-gmo-court-idUSKCNOXC1HZ.
SABC, 2016. SABC’s Important Slides on Mustard Farming, Edible Oil and GE Mustard, South Asia Biotechnology Centre (SABC), October 2016.
SAGARPA. 2016. http://www.gob.mx/sagarpa
Shahid, AA, S BAno, S Khalid, TR Samiullah, KS Bajwa, and MA Ali. 2016. Biosafety assessment of transgenic Bt cotton on model animals, Journal of Advancements in Life Sciences –International Quarterly Journal of Biological Sciences, Vol. 3, No. 3, pp. 97-108, May 2016.
Shein, UHA. 2013. Seed Industry Development in Myanmar, Developing Viable Seed Industries in Cambodia, Lao PDR, Myanmar and Vietnam, Asian Development Bank Institute (ADBI), Asian Development Bank (ADB), Mekong Institute, Khon Kaen, Thailand, 11-15 December 2012.
Shein UHA, and UK Myint. 2013. Supply Chain Development in Myanmar, Asian Development Bank Institute (ADBI), Asian Development Bank (ADB), 2013.
Sher, F., 2016. National Assembly body approves ‘Plant Breeders’ Rights Bill, 2016’, Business Recorder, 10 August 2016.
Sinebo, W and K Maredia. 2016. Innovative farmers and regulatory gatekeepers: Genetically modified crops regulation and adoption in developing
References
Global Status of Commercialized Biotech/GM Crops: 2016
120
countries. http://www.tandfonline.com/doi/full/10.1080/21645698.2016.1151989
Smyth, SJ. 2017. Genetically modified crops, regulatory delays, and international trade. Food and Energy Security. http://onlinelibrary.wiley.com/doi/10.1002/fes3.100/full
The Gazette of Pakistan, 2015. An Act to ament the Seed Act1976, Act No. VII of 2015, No. F. 9(6)/201s-Legis, Senate Secretariat, The Gazette of Pakistan, 29 July 2015.
The North American Farmers. 2016. Drought and drought and its effects on arming and Agriculture http://northamericanfarmer.com/articles/drought.aspx.
Trigo, EJ. 2011. Quince Años de Cultivos Genéticamente Modificados en la Agricultura Argentina. (Fifteen Years of GM Crops in Argentine Agriculture). http://www.argenbio.org/adc/uploads/15_anos_Estudio_de_cultivos_GM_en_Argentina.pdf. English news release at http://www.argenbio.org/index.php?action=notas¬e=5884.
Trigo, EJ. 2016. Veinte Años de Cultivos Genéticamente Modificados en la Agricultura Argentina. http://argenbio.org/index.php?action=novedades¬e=747
UF News, 2016. UF creates trees with enhanced resistance to citrus greening. http://news.ufl.edu/articles/2015/11/uf-creates-trees-with-enhanced-resistance-to-greening.php.
UNEP GEF. 2006. National Biosafety Framework Myanmar, Ministry of Agriculture and Irrigation, Department of Agricultural Planning, Development of Biosafety Framework Project Myanmar, Nov 2006.
USDA FAS GAIN Reports for 2016. https://gain.fas.usda.gov/Recent%20GAIN%20Publications/Forms/AllItems.aspx.
USDA, 2016. Bangladesh Agricultural Biotechnology Annual 2016, GAIN Report Number: BG6010, the United State Department of Agriculture (USDA), 21 November 2016.
USDA NASS. 2015. US Crop Acreage June 30, 2016. http://usda.mannlib.cornell.edu/usda/current/Acre/Acre-06-30-2016.pdf
US Drought Monitor. November 2016. http://www.droughtmonitor.unl.edu.
Undercurrent News. 28 July 2016. AquaBounty conducting field trials of GM salmon in Argentina, Brazil. https://www.undercurrentnews.com/2016/07/28/aquabounty-conducting-field-trials-of-gm-salmon-in-argentina-brazil/
VN Express. 28 September 2016. Vietnamese farmers sow the seed of GM crops. http://e/vnexpress.net/news/business/vietnamese-farmers-sow-the-seed-of-gm-crops-34755.html
Valor Soja. 6 October 2015. Se aprobó un evento de soja tolerante a sequía desarrollado por investigadores argentinos: el Estado comenzará a cobrar regalías. http://www.valorsoja.com/2015/10/06/se-aprobo-un-evento-de-soja-tolerante-a-sequia-desarrollado-por-investigadores-argentinos-el-estado-comenzara-a-cobrar-regalias/#.
Verdeca. 6 October 2015. Arcadia Biosciences receives final regulatory approval for stress tolerant soybeans in Argentina through Verdeca Joint Venture. http://www.verdeca.com/news/press/arcadia-biosciences-receives-final-regulatory-approval-stress-tolerant-soybeans-argentina.
Wu, K-M, Y-H Lu, H-Q Feng, Y Jiang and Z Z Jian. 2008. Suppression of cotton bollworm in multiple crops in China in areas with Bt toxin-containing cotton. Science. 321: 1676-1678.
Yorkton This Week. 2016. Agriculture This Week-Chinese company efforst may open doors. http://www.yorktonthisweek.com/agriculture/agriculture-this-week-chinese-company-efforts-may-open-doors-1.5303718.
Zdeňka S, OS Habuštová, WD Hutchison, HM Hussein, and F Sehnal. 2015. Risk assessment of genetically engineered maize resistant Todiabrotica spp.: Influence on above-ground arthropods in the Czech Republic. http://journals.plos.org/plosone/article?id=10.1371/journal.pone.0130656.
Zhang, C, R Hu, J Huang, X Huang, G Shi, Y Li, Y Yin, Z Chen. 2016. Health effect of agricultural pesticide use in China: implications for the development of GM crops. Nature Reviews. http://www.nature.com/articles/srep34918
References

Global Status of Commercialized Biotech/GM Crops: 2016
121
uS$M herbicides insecticides fungicides others Biotech totalNorth America 7,250 1,868 1,417 575 11,008 22,118West Europe 3,537 1,342 3,667 680 9 9,236East Europe 3,398 680 803 149 4 5,034Japan 1,342 1,268 971 115 0 3,696Australia 1,384 405 230 65 29 2,113industrial Countries
16,910 5,564 7,088 1,584 11,050 42,197
Latin America 5,614 3,507 3,704 572 3,129 16,526Rest of Far East 2,263 2,496 2,389 184 366 7,699Rest of World 1,286 1,685 803 111 590 4,474developing Countries
9,163 7,689 6,896 867 4,084 28,699
total 26,074 13,253 13,984 2,451 15,134 70,896
appendix 1. Global Crop Protection Market, 2015
Source: Cropnosis Agrochemical Service, 2016
Appendices

Global Status of Commercialized Biotech/GM Crops: 2016
122
export Country field Crops vegetable Crops total*
1 France 1,408 436 1,860
2 Netherlands 1,361 358 1,808
3 USA 981 581 1,632
4 Germany 665 79 778
5 Chile 324 125 464
6 Hungary 416 18 435
7 Denmark 310 63 376
8 Italy 206 128 336
9 Romania 331 1 332
10 Canada 298 5 303
11 Argentina 284 17 301
12 China 176 77 262
13 Belgium 240 3 245
14 Austria 232 2 234
15 Spain 167 59 226
16 United Kingdom 159 28 197
17 Others 290 1,811 2,158
total* 7,848 3,791 11,947
export Country field Crops vegetable Crops total*
1 United States 832 383 1,286
2 France 704 154 867
3 Netherlands 345 436 836
4 Germany 619 88 726
5 Italy 289 193 492
6 Spain 252 238 491
7 Russian Federation 366 75 447
8 Mexico 120 265 386
9 United Kingdom 235 76 328
10 China 134 152 297
11 Ukraine 265 27 292
12 Poland 213 56 272
13 Japan 106 121 248
14 Belgium 205 37 244
15 Canada 142 85 242
16 Turkey 179 21 203
17 Others 2,207 1,243 3,497
total* 7,213 3,650 11,154
appendix 2a. Seed exports (foB) of Selected Countries, 2014 (with over 100 Million uS$ Market)
appendix 2b. Seed imports (foB) of Selected Countries, 2014 (with over 100 Million uS$ Market)
*Also includes values on flower seed exports
*Also includes values on flower seed exportsSource: International Seed Federation, 2014 http://www.worldseed.org/resources/seed-statistics/
Appendices

Global Status of Commercialized Biotech/GM Crops: 2016
123
Appendices
Country value (uSd million) Country value (uSd million)USA 12,000 Morocco 140 China 9,950 Switzerland 140 France 2,800 Bulgaria 120 Brazil 2,625 Chile 120 Canada 2,120 Nigeria 120 India 2,000 Serbia 120 Japan 1,350 Slovakia 110 Germany 1,170 New Zealand 100 Argentina 990 Uruguay 96 Italy 767 Ireland 80 Turkey 750 Paraguay 80 Spain 660 Portugal 80 Netherlands 590 Algeria 70 Russian Federation 500 Kenya 60 United Kingdom 450 Iran 55 South Africa 428 Israel 50 Australia 400 Tunisia 45 Republic of Korea 400 Bolivia 40 Mexico 350 Colombia 40 Czech Republic 305 Slovenia 40 Hungary 300 Peru 30 China, Taiwan 300 Zimbabwe 30 Poland 280 Malawi 26 Sweden 250 Libya 25 Romania 220 Saudi Arabia 20 Denmark 218 Zambia 20 Greece 200 Philippines 18 Belgium 185 Ecuador 15 Finland 160 Tanzania 15 Austria 145 Uganda 10 Egypt 140 Dominican Republic 7
appendix 3. estimated value of the domestic Seed Market in Selected Countries for the year 2012 (updated June 2013).
Total USD 44,925 million
The commercial world seed market is assessed at approximately 45 billion dollars
Source: http://www.worldseed.org/isf/seed_statistics.html

Global Status of Commercialized Biotech/GM Crops: 2016
124
Country arable land (Million ha) Population (Million) arable land/CapitaBangladesh 7.7 156.2 0.05Cambodia 4.1 15.9 0.26China 102.6 1,373.5 0.07India 157.6 1,266.9 0.12Indonesia 23.6 258.3 0.09Laos 1.4 7.0 0.20Malaysia 1 30.9 0.03Myanmar 10.4 56.9 0.18Nepal 2.1 29.0 0.07North Korea 2.3 25.1 0.09Pakistan 21.6 201.9 0.11Philippines 5.4 102.6 0.05Sri Lanka 1.4 22.2 0.06Thailand 15.8 68.2 0.23Timor-Leste 0.2 1.3 0.12Vietnam 6.5 95.3 0.07Reference CountriesArgentina 38.3 43.9 0.87Australia 46.1 22.9 2.01Brazil 75.2 205.8 0.37Japan 4.4 126.7 0.03South Africa 12.1 54.3 0.22South Korea 1.5 50.9 0.03USA 155.5 323.9 0.48
appendix 4. arable land Per Capita of Selected Countries in asia, 2016
Source: The World Factbook, updated Jan 12, 2017
Appendices
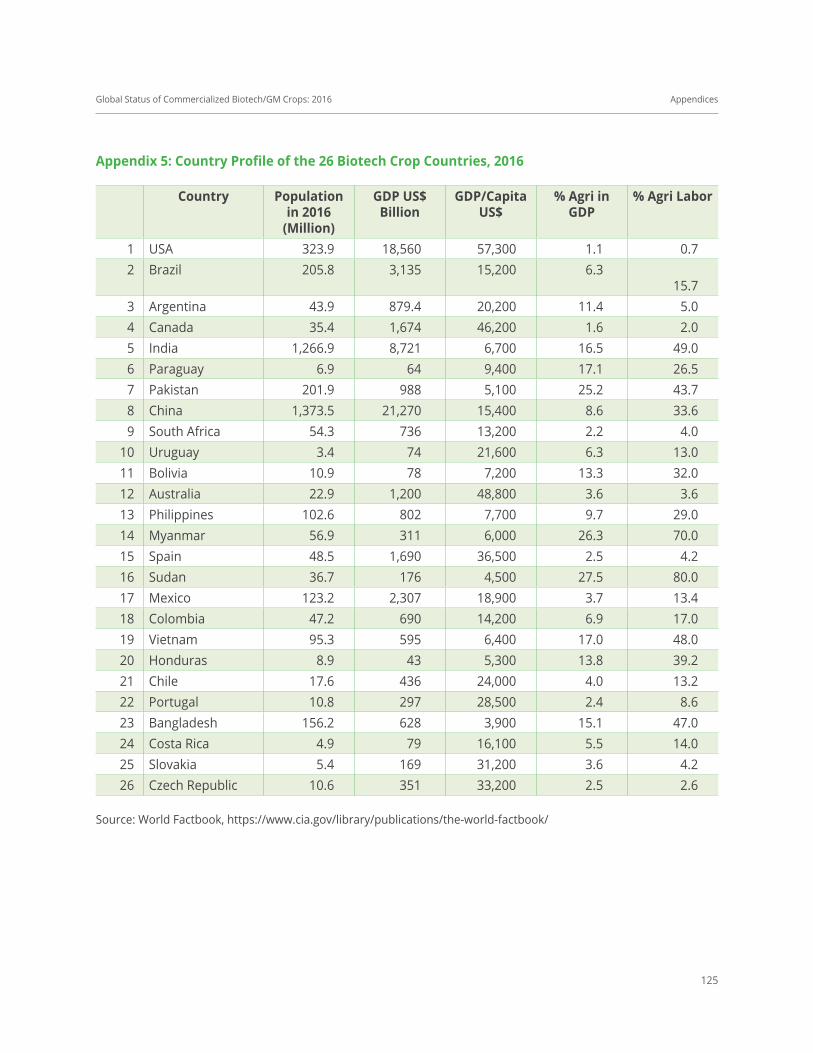
Global Status of Commercialized Biotech/GM Crops: 2016
125
Country Population in 2016
(Million)
GdP uS$ Billion
GdP/Capita uS$
% agri in GdP
% agri labor
1 USA 323.9 18,560 57,300 1.1 0.72 Brazil 205.8 3,135 15,200 6.3
15.73 Argentina 43.9 879.4 20,200 11.4 5.04 Canada 35.4 1,674 46,200 1.6 2.05 India 1,266.9 8,721 6,700 16.5 49.06 Paraguay 6.9 64 9,400 17.1 26.57 Pakistan 201.9 988 5,100 25.2 43.78 China 1,373.5 21,270 15,400 8.6 33.69 South Africa 54.3 736 13,200 2.2 4.0
10 Uruguay 3.4 74 21,600 6.3 13.011 Bolivia 10.9 78 7,200 13.3 32.012 Australia 22.9 1,200 48,800 3.6 3.613 Philippines 102.6 802 7,700 9.7 29.014 Myanmar 56.9 311 6,000 26.3 70.015 Spain 48.5 1,690 36,500 2.5 4.216 Sudan 36.7 176 4,500 27.5 80.017 Mexico 123.2 2,307 18,900 3.7 13.418 Colombia 47.2 690 14,200 6.9 17.019 Vietnam 95.3 595 6,400 17.0 48.020 Honduras 8.9 43 5,300 13.8 39.221 Chile 17.6 436 24,000 4.0 13.222 Portugal 10.8 297 28,500 2.4 8.623 Bangladesh 156.2 628 3,900 15.1 47.024 Costa Rica 4.9 79 16,100 5.5 14.025 Slovakia 5.4 169 31,200 3.6 4.226 Czech Republic 10.6 351 33,200 2.5 2.6
appendix 5: Country Profile of the 26 Biotech Crop Countries, 2016
Source: World Factbook, https://www.cia.gov/library/publications/the-world-factbook/
Appendices


978-1-892456-66-4