is u.s. multinational intra-firm dividend policy … u.s. multinational intra-firm dividend policy...
TRANSCRIPT

Is U.S. Multinational Intra-Firm Dividend Policy Influenced by Capital Market Incentives?
Jennifer L. Blouin The University of Pennsylvania
Linda K. Krull
University of Oregon
Leslie A. Robinson Tuck School of Business at Dartmouth
December 2009
ABSTRACT
This study finds evidence to suggest that public-company reporting by U.S. multinational corporations (MNCs) creates disincentives to repatriate foreign earnings. Firms that operate under both U.S. international tax laws and accounting rules potentially face two costs when they repatriate foreign earnings: an actual cash tax liability and a reduction in reported accounting earnings. Using a confidential dataset of financial and operating characteristics of the foreign affiliates of MNCs combined with public company data over a six year period, we find evidence that capital market incentives have a negative effect on the amount of foreign earnings repatriated by MNCs. This is the first empirical study of actual dividend payments to show that financial reporting is an important non-tax factor in repatriation decisions of multinational firms. ______________________________________________________________________________ The statistical analysis of firm-level data on U.S. multinational companies was conducted at the Bureau of Economic Analysis, Department of Commerce under arrangements that maintain legal confidentiality requirements. The views expressed are those of the authors and do not reflect official positions of the U.S. Department of Commerce. The authors thank Rosanne Altshuler, Fritz Foley, Matthew Slaughter, Ray Mataloni and Bill Zeile for helpful suggestions regarding BEA data. The authors thank David Guenther, Michelle Hanlon, Lillian Mills, Richard Sansing, Joel Slemrod, and participants at the 2009 UNC/KPMG Tax Research Symposium and 2009 JATA conference, and workshop participants at University of California - Davis, Stanford University, Temple University, University of Texas, Yale University and Wharton for helpful comments. Jennifer Blouin appreciates the financial support from the Terker Research Fellowship awarded by the Rodney L. White Center for Financial Research.

1
1. Introduction
The U.S. tax system plays a role in the ability of U.S. multinational corporations (MNCs) to
compete in the global marketplace. Various opponents of tax policy in the U.S. argue that the
international tax system has a negative effect on the competitiveness of U.S. firms and creates
incentives for multinational firms to park foreign affiliate profits overseas. In a June 2007
speech, Treasury Assistant Secretary for Tax Policy, Eric Solomon, calls our current tax system
“a blend of full inclusion and territorial systems”, whereby MNCs can defer U.S. tax on earnings
of foreign affiliates until the earnings are distributed (“repatriated”) to the U.S. parent. As of
2002, MNCs held an estimated $639 billion of undistributed earnings abroad (Brumbaugh
[2003]). As a result, there is enormous interest in the role of the U.S. tax system in cultivating
these large pools of undistributed foreign earnings.
Adding to this interest, the corporate response to the American Jobs Creation Act of 2004
(“AJCA”), which temporarily reduced the tax rate on certain eligible repatriations of foreign
earnings, was unexpectedly high. Empirical research documents that a one percent decrease in
the tax rate on repatriations increases repatriations by one percent (Hines and Hubbard [1990]).
Given that the AJCA temporarily reduced the maximum tax rate on repatriations from 35 percent
to 5.25 percent, Altshuler and Grubert [2006] note that the tax rate reduction alone cannot
explain the observed six fold increase in repatriations in response to the legislation. The authors
conjecture that prior literature has underestimated the efficiency losses caused by the U.S.
system of taxing foreign earnings. The documented pool of large amounts of undistributed
earnings coupled with the overwhelming corporate response to the AJCA provides the impetus
for our analysis.

2
In this study, we bring a financial reporting perspective into an international tax context to
examine the role of a non-tax factor, capital market pressure, in the repatriation decisions of
multinational firms. Our objective is to provide a multidisciplinary approach to studying
repatriation decisions that will help researchers and policy makers better estimate the efficiency
losses created by the U.S. tax and financial reporting systems. Specifically, we investigate
whether capital market incentives to increase earnings explain cross-sectional variation in
repatriation behavior.
Tax law dictates the amount and timing of MNCs’ cash payments for any U.S. tax due upon
repatriation (“repatriation tax”). A MNC pays a repatriation tax on foreign earnings when the
earnings are remitted as a dividend to the U.S. parent. The amount of tax due is the dividend
grossed-up for foreign taxes paid times the U.S. statutory tax rate minus the foreign tax credit.
Generally, the foreign tax credit equals the amount of foreign taxes paid on the foreign earnings
up to the amount of the U.S. tax liability. Thus, if the foreign tax rate is greater than the U.S. tax
rate, the MNC owes no incremental U.S. tax on repatriated earnings. Further, if a MNC
repatriates earnings from more than one country, it can use credits generated from high tax
affiliates to offset U.S. taxes on repatriations from low tax affiliates. Therefore, the residual or
incremental U.S. tax liability due upon repatriation can be thought of as the difference between
the U.S. tax rate and the average foreign tax rate paid on repatriated foreign earnings.
Accounting rules dictate the amount and timing of MNCs’ expense recognition of
repatriation taxes in accounting earnings. The general rule under Statement of Financial
Accounting Standard 109 (SFAS 109), Accounting for Income Taxes, is to recognize an expense
for the repatriation tax liability on foreign earnings in the same accounting period the earnings
are generated. Because MNCs do not pay the repatriation tax until they repatriate the earnings to
3
the U.S., this accounting treatment often requires them to recognize an estimate of the
repatriation tax expense in the financial statements long before they pay the taxes. Due to the
potentially permanent nature of foreign investment, Accounting Principles Board Opinion No. 23
(APB 23), Accounting for Income Taxes – Special Areas, and SFAS 109 allow MNCs to defer
recognizing the repatriation tax expense until repatriation if they designate the earnings as
indefinitely reinvested abroad (hereafter referred to as “permanently reinvested earnings” or
“PRE”). However, when the MNC eventually repatriates the earnings, it must recognize the tax
expense with no corresponding income on which it is paying tax because it recognized that
income in a prior accounting period.
While all firms have incentives to delay a cash tax payment, firms that face capital market
pressure also have incentives to delay financial statement recognition of a tax expense to increase
current earnings. This incentive raises the possibility that financial reporting plays a role in the
repatriation decision. In fact, recent survey evidence supports this conjecture. Executive survey
responses about repatriation decisions show that recognition of the accounting tax expense
matters as much as the cash flow effect of the tax payment when deciding whether to repatriate
foreign earnings (Graham et al. [2009]). We explore this issue by studying the actual repatriation
behavior of U.S.-based multinational firms.
To investigate the effect of capital market incentives on repatriations of foreign earnings, we
model U.S. MNCs’ annual dividend repatriations from foreign affiliates as a function of the
amount of tax on repatriations, a measure of capital market pressure to increase earnings, and
other economic determinants of repatriations consistent with related literature. Of particular
interest in our study is the interaction between the amount of tax on repatriations and our
measures of capital market pressure which allow us to test whether firms’ repatriations are more

4
sensitive to the amount of tax on the repatriation (hereafter, the tax cost of repatriation) when
that tax creates a financial reporting cost in addition to a cash outflow.
We use two measures of capital market pressure to identify firms for which the financial
reporting cost of repatriation matters more: firm ownership and the extent of tax expense deferral
under APB 23. Empirical accounting literature suggests that private firms are less sensitive to
capital market pressures than public firms (Cloyd et al. [1996], Penno and Simon [1986],
Wolfson [1993]). Thus, we expect firm ownership to explain cross-sectional variation in firms’
repatriation behavior. Second, among public firms, we investigate whether the amount that firms
repatriate is related to the amount of permanently reinvested earnings under APB 23. All else
equal, firms that have deferred more repatriation tax expense under APB 23 face higher financial
reporting costs of repatriation.1
Our sample includes 479 public and 98 private U.S.-based multinationals from 1999 through
2004. After controlling for investment opportunities, size, financing constraints, and country
specific factors, we find that public firms are more sensitive to the tax cost of repatriation than
private firms, and that public firms with high amounts of foreign earnings designated as
permanently reinvested under APB 23 are more sensitive to the tax cost of repatriating than other
public firms. Based on these results, we estimate that financial reporting concerns decrease
annual repatriations by about $6.5 billion.
We triangulate our results using three additional analyses. First, we examine repatriation
behavior by fiscal quarter and find that firms facing capital market pressure are more sensitive to
the tax cost of repatriating during the fourth quarter than other firms. Second, we extend Foley et
1 One limitation of the APB 23 proxy for financial reporting costs is that it may not completely disentangle the financial reporting cost from the cash tax cost. To rule out this possibility, we perform numerous sensitivity and robustness tests and continue to find results consistent with our hypotheses.

5
al. [2007] to show that the effect of taxes on the accumulation of foreign cash in public
companies is exacerbated by financial reporting costs. Third, we estimate a regression of
repatriation behavior on separate measures of the cash tax cost and the financial reporting cost of
repatriation for public firms and find that both costs are negatively related to repatriations. Each
of these analyses supports our main finding that capital market pressure plays a role in the
repatriation decisions of multinational firms.
This study makes two contributions to the literature. First, this study informs the broader
policy debate over reforms to our international tax system. Understanding non-tax factors that
affect repatriation behavior can aid our understanding of the responsiveness of repatriations to
changes in the tax system. Our evidence suggests that financial reporting is an important factor in
the decision to repatriate foreign subsidiary earnings. Further, our evidence that capital market
pressure deters repatriation is consistent with the build-up of undistributed foreign earnings, as
well as the surge in repatriations under the AJCA.
The notion that financial reporting costs play a role in repatriations has been recognized for a
number of years. For example, Scholes et al. (2000) note that the financial reporting for U.S
taxes on repatriations under APB 23 is a cost that accompanies the decision to reinvest versus
repatriate. However, the issue received little attention in academic literature until the AJCA
generated new interest in the topic. In concurrent work, Shackelford et al. (2009) theoretically
model the effect of taxes and Generally Accepted Accounting Principles on real decisions of
firms and note that APB 23 is an example of an area where such forces have potential
importance. In another concurrent study Graham et al. [2009] provide survey evidence that the
recognition of financial accounting tax expense is an important determinant of repatriation. Our

6
study adds to this literature by empirically estimating the effect of financial reporting costs on
repatriations.2
Second, this paper informs standard setters considering the merits of allowing deferral under
APB 23. The repeal of APB 23 was considered as part of the IASB and FASB short-term
convergence project on income taxes. The Global Oversight Committee of the Financial
Executives Institute claims that the adoption of a non U.S. accounting standard for undistributed
earnings would have been “a disaster for U.S. companies” because U.S. tax and accounting
structures are fundamentally different from European structures. The group successfully lobbied
the European Roundtable to have the issue of APB 23 rescission removed from the convergence
project.3 Since we find that cash balances abroad are higher for firms relatively more sensitive to
the financial reporting cost of repatriation, our results suggest that APB 23 impedes capital
mobility thereby hurting the efficiency of MNC capital allocation. In addition, while IFRS is
meant to increase consistency in global financial reporting, APB 23 creates a setting where U.S.
MNCs have an unrecognized deferred tax liability associated with foreign earnings, but firms
based in countries with territorial systems do not. Our study suggests that APB 23 not only
decreases consistency in financial reporting across countries, but also creates incentives for U.S.
MNCs to leave earnings abroad.
Section 2 provides a background and develops our hypotheses. Section 3 describes our data.
Section 4 describes our empirical specification. Section 5 discusses our main results and Section
6 provides results from additional analyses. Section 7 concludes.
2 Our evidence is consistent with the surge in repatriations under the AJCA because firms could avoid recognizing a large portion of the unrecognized deferred tax liability by repatriating during the tax holiday. Thus, the potential to reduce financial accounting tax expense provided an additional incentive to repatriate. A detailed investigation of the effect of financial reporting costs on repatriations under the AJCA is beyond the scope of this paper. 3 See http://www.thefreelibrary.com/Technical+committee+profile:+Global+Oversight+Committee+(GOC).-a0130779987

7
2. Background and Hypotheses
Of interest in our study is how tax law and accounting rules interact to influence repatriation
decisions. Therefore, to motivate our hypotheses, we first describe the tax and accounting rules
that govern the repatriation of foreign earnings.
2.1 REPATRIATION AND TAX LAW
In the following discussion, we assume that a U.S.-based MNC has a foreign affiliate that
generates positive earnings and faces an additional tax liability upon repatriation of those
earnings to the U.S., i.e. the foreign affiliate faces a foreign tax rate lower than the U.S. rate. The
taxation of repatriation, discussed here, and its interaction with financial accounting, discussed in
the next section, is outlined in Figure 1.
From a tax perspective, the MNC has two choices with differing effects on the current period
cash outflow for taxes on foreign earnings. It can reinvest the earnings abroad or repatriate them
to the United States. When the MNC reinvests the foreign earnings abroad (as in scenarios II
and III in Figure 1) the total current period taxes paid on foreign earnings consists only of
foreign taxes; the repatriation tax cost is zero. Thus, payment of the repatriation tax is deferred to
a future period. Alternatively, when the MNC repatriates foreign earnings (as in scenarios I, IV,
and V in Figure 1), the total current period taxes paid on foreign earnings consists of both foreign
and U.S. taxes, with the U.S. tax component representing the repatriation tax. Note that tax law -
not financial reporting rules - determines when the repatriation tax is paid.
Previous work on repatriation decisions in the economics and finance literatures concludes
that taxes are a significant determinant of repatriation. Seminal theoretical work shows that when
after-tax returns and tax rates are constant, the tax cost of repatriation does not affect the
repatriation decision because all foreign earnings will eventually be taxed at the U.S. tax rate

8
(Hartman [1985]). However, subsequent empirical evidence suggests that repatriations are
decreasing in the tax cost of repatriation (Hines and Hubbard [1990], Altshuler and Newlon
[1993], Grubert [1998], Desai et al. [2001], Altshuler and Grubert [2003], Foley et al. [2007]).
Altshuler et al. [1995] reconcile theoretical work with the empirical evidence by distinguishing
between permanent and transitory changes in tax rates. The authors point out that dividend
repatriations are negatively related to the transitory tax price of repatriation but are not related to
the permanent tax price of repatriation.
Desai et al. [2007] find that non-tax factors, such as domestic financing needs and agency
problems inside firms, also shape MNC repatriation policy. Altshuler and Grubert [2003] study
several investment-repatriation strategies and find that firms can achieve the equivalent of
repatriation (i.e., getting cash to the parent) without incurring the repatriation tax cost, with the
caveat that these strategies are not costless. A factor not considered by existing estimates of the
effect of taxes on repatriations is the related financial reporting cost created by capital market
incentives to increase earnings and the accounting for taxes on repatriation.
2.2 REPATRIATION AND ACCOUNTING RULES
The rules governing accounting for U.S. income taxes on foreign subsidiary earnings under
APB 23 and SFAS 109 provide a U.S. MNC two choices with differing effects on the MNC’s
financial accounting earnings. When a MNC has a sufficiently long reinvestment-horizon on
foreign earnings, it can designate the earnings as permanently reinvested under APB 23 and
avoid recognizing the tax cost of repatriation as an expense in the financial statements until those
earnings are repatriated (scenario III in Figure 1). Thus, recognition of any repatriation tax
liability is deferred to a future period. Alternatively, when the MNC intends to repatriate foreign
earnings in the foreseeable future, it recognizes or accrues the actual or expected repatriation tax

9
as an expense in the period when it generates the related foreign earnings (scenario II in Figure
1). Note that accounting rules – not tax laws - determine when the repatriation tax is recognized
as an expense in the financial statements.
Empirically, MNCs make extensive use of the PRE designation as evidenced by the $420
billion of PRE reported in the financial statements of the S&P 500 at the end of 2002 (Bear
Sterns and Company [2005]). Krull [2004] finds that MNCs increase amounts designated as PRE
to maximize reported after-tax earnings and meet earnings benchmarks. However, the study does
not address whether the expense recognition affects actual repatriation decisions of MNCs. We
address that question by studying the interaction of accounting rules and tax law.
2.3 INTERACTION BETWEEN TAX AND ACCOUNTING
Tax law, which determines when the repatriation tax is paid, and accounting rules, which
determine when the repatriation tax is recognized as an expense, interact in important ways that
allow us to develop testable hypotheses. In Figure 1, a key tax consequence of the decision to
repatriate foreign earnings (I versus II & III) is payment of the repatriation tax. However, the key
accounting consequence of the use of the PRE designation (II versus III) is deferral of the
recognition of the expected repatriation tax in after-tax accounting earnings. Thus, accounting
expense deferral can be thought of as an additional benefit to tax expense deferral for firms that
do not repatriate because after-tax financial accounting earnings increase when firms designate
foreign subsidiary earnings as permanently reinvested. This benefit is apparent in Figure 1 by
observing that under Scenario III (relative to II) firms that do not repatriate enjoy the absence of
a repatriation tax and report the highest after-tax earnings.
Conversely, once a firm designates foreign earnings as PRE, recognition of the U.S. tax
expense upon repatriation in a subsequent accounting period will have a more material negative

10
effect on earnings relative to current recognition because the repatriation tax expense is
recognized in a later period than the corresponding foreign income. Thus, accounting expense
recognition is an additional cost to repatriation because after-tax financial accounting earnings
decrease when firms repatriate earnings that were previously designated as permanently
reinvested. This cost is apparent in Figure 1 by observing that under Scenario IV firms that
repatriate current and prior earnings previously designated as PRE pay the U.S. repatriation tax
and report the lowest after-tax earnings.
2.4 HYPOTHESES
Prior literature finds evidence that tax costs are a significant determinant of repatriation
behavior; specifically high tax costs decrease repatriations. To examine whether high financial
reporting costs also decrease repatriations, we must empirically disentangle the cash flow effect
of the tax cost of repatriation from the financial reporting effect because the two effects are of
the same dollar magnitude and often occur together. In order to disentangle the tax cost from the
financial reporting cost, we identify factors across which the financial reporting costs vary while
holding the tax cost constant. That is, we conjecture that the effect of the tax cost of repatriations
documented in prior literature differs depending on the existence of financial reporting costs
created by capital market pressure. We use two measures of capital market pressure and
hypothesize that in the presence of these pressures, the tax cost matters more.4
First, we use firm ownership type – public versus private – because this measure exhibits the
two conditions needed to disentangle the tax cost from the financial reporting cost: 1) both public
and private firms are subject to the same tax laws and the same economic incentives to minimize
4 Since the magnitude of the financial reporting cost is a direct consequence of the magnitude of the tax cost, it is difficult conceptually to think of the financial reporting cost as a separate cost. Thus, we hypothesize an interaction effect, whereby firms are more sensitive to the tax cost of repatriation in the presence of a financial reporting cost.

11
tax costs, and 2) financial reporting incentives vary across public and private firms because of
the difference in the constituents to which the two groups report.
The first condition requires not only that public and private firms are subject to the same tax
laws, but that they also attribute the same value to tax savings. Although public and private firms
are subject to the same tax laws, existing studies find evidence that private firms are more
aggressive tax planners that public firms (Beatty and Harris [1999], and Mikhail [1999]). In
addition, Hanlon et al. [2007] link private ownership to greater proposed income tax deficiencies
with the IRS than public ownership. While these results suggest that private firms value tax
savings more than public firms, they also suggest that our empirical tests are biased against
finding results.5
The second condition requires that public firm managers face stronger incentives to manage
accounting earnings than private firm managers. The managers of public firms have private
information, report to current and potential investors, and are evaluated on their performance
based on the information they provide. Therefore, managers typically have incentives to report
higher earnings to increase both the value of the firm and their compensation (Cloyd et al.
[1996]; Penno and Simon [1986]).6 In contrast, private firms have high levels of insider
5 In contrast to these studies, Graham et al. [2009] report survey results suggesting that public firms rank cash tax deferral as more important in the reinvest versus repatriate decision than private firms. However, this result is based on a univariate comparison between public and private firms that does not control for the many other factors that affect the repatriation decision. We control for these other factors, such as size, growth, leverage, cost of capital, cash and country level factors, in our multivariate empirical tests and discuss these controls in more detail in Section 4 of the paper. Additionally, Graham et al. [2009] report that firms with lower ETRs rank cash tax deferral higher than other firms. The private firms in our sample have lower ETRs (mean = 0.27) relative to the public firms (mean = 0.33) consistent with studies that find that private firms are more tax aggressive then public firms. 6 Note that our analysis presumes that there is variation in the extent to which public and private firm managers focus on after-tax earnings. Data on private company compensation is extremely difficult to obtain. However, survey evidence shows that private firms use significantly less equity in their compensation contracts than public firms (See PricewaterhouseCoopers 2007 Trendsetter Barometer report “Private companies can compete with public companies for executive talent”). Since investors have been shown to fixate on income (see Hand [1990]), less equity compensation suggests that private firm managers may be relatively less focused on net income. In addition, the bulk of private company executive compensation comes from base salary (74%) rather than other variable pay that may be a function of bottom line earnings. Moreover, the 2007 Financial Executives Compensation Survey

12
ownership, encounter less information asymmetry between managers and investors, and
therefore have relatively less incentive to increase earnings (Beatty and Harris [1999]). Using
survey evidence, Penno and Simon [1986] find that public firms are more likely to use income
increasing accounting methods and Cloyd et al. [1996] find that public firms are less likely to use
financial accounting methods that conform to income decreasing tax choices because conformity
imposes higher nontax costs on mangers of public firms. Consistent with these survey results,
Badertscher et al. [2009] shows that private (public) firms engage in more conforming (non-
conforming) tax planning. In addition, Givoly et al. [2009] examine a broad sample of U.S.
firms and find evidence that earnings management is more pronounced in public firms.7 Finally,
Graham et al. [2009] report survey results suggesting that public firms are more concerned with
the financial accounting effect of repatriations than private firms. This leads to our first
hypothesis:
H1: Ceteris paribus, public firms are more sensitive to the tax cost of repatriating than private firms.
Our second measure of the financial reporting cost of repatriation uses the designation of
earnings as permanently reinvested under APB 23. The tax laws and incentives to avoid taxes are
the same regardless of whether a firm designates earnings as PRE. However, the financial
(FEI Survey) details that 71% of private company CFO’s are evaluated on a metric OTHER than net income after taxes (e.g., EBIT, EBITDA etc). Finally, the FEI Survey reports that after-tax performance metrics are used 78% more often than pre-tax performance metrics for public firm manager compensation; whereas after-tax performance are only used 23% more often than pre-tax performance metrics in private firm manager compensation. 7 An extensive literature examines the effect of firm ownership on earnings quality. However, data constraints require many of these studies to rely on narrow samples that make their results difficult to generalize to our setting. For example, Beatty and Harris [1999] and Beatty et al. [2002] use samples of bank holding companies. Each of these studies find evidence that public firms are more likely than private firms to manage earnings. In contrast, Burgstahler et al. [2006] uses samples of firms based in the European Union and finds that private firms exhibit higher levels of earnings management than public firms. We draw from the recent work of Badertscher et al. [2009] and Givoly et al. [2009] in developing our hypotheses because they examine earnings management in a broad sample of U.S. firms, and therefore, their objective and sample is most closely related to ours.

13
reporting costs of repatriation differ depending on the firm’s use of PRE. In our discussion of
Figure 1, we show that firms that do not use the PRE designation will face a lower financial
reporting cost to repatriation because these firms recognized the expected U.S. repatriation tax in
the period when the foreign earnings were generated. Firms that have designated undistributed
foreign earnings as PRE are more likely to incur a financial reporting cost when repatriating than
other firms. Furthermore, firms that have designated all of their undistributed foreign earnings as
PRE cannot avoid tax expense recognition in their financial statements by repatriating non-PRE.
Because we cannot determine whether firms repatriate PRE or non-PRE, we test for differences
in repatriations for firms that report high versus low levels of PRE. This test focuses on public
firms because we can only observe PRE disclosures from SEC filings of public firms. Hence, we
test the following hypothesis:
H2: Ceteris paribus, public firms with high amounts of permanently reinvested earnings under APB 23 are more sensitive to the tax cost of repatriating than other public firms.
3. Data
Examining whether repatriation behavior of MNCs is affected by financial reporting rules
necessitates measuring repatriation activity, the tax cost of repatriation, and capital market
pressure to increase earnings. To construct these measures, we combine firm-level data from two
sources. First, we obtain information on repatriations and the tax cost of repatriating for MNCs
from the results of two surveys conducted by the Bureau of Economic Analysis (BEA). Second,
we determine ownership type for each firm in our sample and hand collect PRE data from the

14
public firms’ SEC filings.8 By combining these two datasets, we can identify MNCs in the BEA
data that face varying degrees of capital market pressure.
We construct measures of repatriation activity and the tax cost of repatriation using two BEA
Surveys of U.S. Direct Investment Abroad.9 These surveys provide data on the financial and
operating characteristics of U.S. MNCs operating abroad. A U.S. MNC is the combination of a
single U.S. entity with direct investment abroad, called the U.S. parent, and at least one foreign
business enterprise, called a foreign affiliate. The BEA requires U.S. MNCs to complete survey
forms that cover both domestic and foreign operations. The information captured by each survey
varies by year, affiliate size, and the U.S. parent’s percentage ownership in the affiliate. As a
result of confidentiality assurances and penalties for noncompliance, the BEA believes that
coverage of these surveys is close to complete and levels of accuracy are high.
The first survey, the Quarterly Balance of Payments Survey of U.S. Direct Investment
Abroad, captures direct transactions between the domestic and foreign operations of U.S. MNCs
and limited information on foreign affiliates. From this survey, we collect quarterly net income
and the dollar amount of annual and quarterly dividends that foreign affiliates pay directly to the
U.S parent. The second survey, the Annual (Benchmark) Survey of U.S. Direct Investment
Abroad, captures more extensive financial and operating data for both directly and indirectly
owned affiliates of U.S. MNCs and allows us to compute firm-level control variables.10
8 We identify public companies in the BEA data by matching with Compustat on company name and verifying private ownership using the Lexis Nexus Corporate Affiliations database. 9 See http://www.bea.gov/surveys/diadurv.htm for online versions of each survey. The quarterly survey is Form BE-577, the annual survey is form BE-11, and the benchmark survey is form BE-10. The BEA defines U.S. direct investment abroad as direct or indirect ownership or control by a single U.S. legal entity of at least ten percent of the voting securities of an incorporated foreign business enterprise or the equivalent interest in an unincorporated foreign business enterprise. 10 The BEA collects survey responses on a fiscal year basis, which it defines as the financial reporting year end. Additionally, the survey instructions require that U.S. MNCs report financial and operating data using U.S. Generally Accepted Accounting Principles.

15
To construct our sample, we create a balanced panel of U.S. parents appearing in the BEA
data for six consecutive years from 1999 through 2004. Our panel of U.S. parents includes all
U.S. MNCs with at least one affiliate reporting in each of those six years.11 Because we examine
the effect of financial reporting on repatriation decisions, we aggregate affiliate-level data at the
parent level and eliminate intercompany transactions.
Table 1, Panel A describes our BEA sample and the results of matching our sample of U.S.
parents to Compustat firms. A total of 4,840 U.S. parent firms (57,164 affiliates) appear at least
once in the BEA data from 1999 and 2004. Due to the size thresholds for reporting each year,
only 805 parents (33,196 affiliates) have at least one affiliate reporting in every year during our
sample period. We further restrict the sample by eliminating ADRs and foreign incorporated
parents that are not likely to be constrained by either U.S. tax policy or U.S. accounting policy
when paying dividends to U.S. entities. We also eliminate banks and insurance companies
because they are likely to have more opportunities to avoid repatriation taxes by redeploying
capital around the world, and they face different incentives than other firms because they are
regulated. In addition, we are unable to compute many of our regression variables for these
firms because the BEA collects fundamentally different data for bank affiliates than for other
affilites. Finally, we eliminate pass-through entities (e.g., partnerships, LLCs and REITS) since
they are typically not subject to corporate income taxes. Our final sample consists of 577 U.S.
parent firms (25,459 affiliates); 479 parents (23,669 affiliates) are public and 98 parents (1,790
affiliates) are private.
11 This restriction limits our sample size. In addition, to reduce the reporting burden for MNCs, the BEA only requires an affiliate to fill out the survey in a given year if it meets the size threshold for that year. The affiliate size threshold is $7 million in 1999, $30 million in 2000-2003, and $10 million in 2004. The BEA uses reported data to estimate universe totals when surveys cover only larger affiliates or when only certain affiliates provide information on particular survey forms. However, we use only reported data in our analyses which further limits our sample size to firms with at least one affiliate that meets the size threshold in each year. Additional information on the BEA data can be found in Mataloni [2003].

16
Table 1, Panel B provides a comparison of our BEA sample to a sample of Compustat firms
with evidence (in Compustat) of foreign activity. There are a total of 10,858 U.S. incorporated
firms appearing at least once in Compustat from 1999 through 2004. When we restrict the
Compustat sample to firms that report total assets for six consecutive years and foreign pre-tax
income for at least one year, we are left with 1,537 firms. Of those 1,537 firms, 1,058 do not
appear in the BEA data because the size of their foreign operations fell under the BEA reporting
thresholds for all or some sample years.12 Interestingly, 76 firms appear in the BEA data that
could not be identified as having foreign activity from Compustat alone. Table 1 Panel C
suggests that broad industry representation is present in our sample, with a heavy emphasis on
textiles, manufacturing, and retail. Public and private firms locate their activities in similar
jurisdictions as evidenced in Table 1, Panels D and E.
4. Research Design
Prior literature finds evidence that high tax costs are associated with lower repatriations. Our
hypotheses suggest that firms are more sensitive to the tax cost of the repatriation in the presence
of capital market incentives. We test H1 and H2 by empirically modeling annual repatriations as
a function of the tax cost of repatriation, a proxy for capital market pressure, an interaction term,
and economic incentives to repatriate as follows:
Repatriations = β0 + β1RepCost + β2Capital Market Pressure + β3Capital Market Pressure × RepCost
+∑βkControlsk + ∑ βtYeart + ∑ βjIndustryj + ε (1)
Where:
Repatriations = Annual repatriations scaled by firm sales
12 We compare the size of the 1,058 firms without BEA data to the firms in our sample and find that the median foreign income for this group of firms is only $1.5 million whereas the median for the firms in our sample is $56.3 million.

17
RepCost = An estimate of the U.S. tax the firm would owe if it repatriated all unremitted foreign earnings, computed as the U.S. statutory rate (35 percent) minus Affiliate Creditable Tax Rate.13 Capital Market Pressure = An indicator variable equal to 1 for firms that face relatively high capital market pressure to increase earnings and zero otherwise. We use two proxies for capital market pressure. Public, equals 1 for public firms, zero otherwise. HighPre equals 1 for public firms with PRE that equals or exceeds total assets in low tax affiliates (i.e., affiliates with Affiliate Creditable Tax Rate equal to 30 percent or less) and zero otherwise.14
See Figure 2 for definitions of all other variables.
We estimate Equation (1) using a tobit procedure because our dependent variable is left-
censored at zero.15 RepCost measures the amount of tax on repatriations (i.e. the tax cost of
repatriations). Consistent with existing literature, we expect a negative coefficient on RepCost.
Consistent with H1 and H2, our focus is on the interaction between RepCost and Capital Market
Pressure. We expect that firms facing both capital market pressure to report higher earnings and
a cash tax cost to repatriating will be more sensitive to the tax cost of repatriating than firms that
face only a cash tax cost. Because public firms face more capital market pressure to increase
earnings than private firms,H1 predicts that public firms will be more sensitive to the tax cost of
13 We calculate Affiliate Creditable Tax Rate by aggregating affiliate-level foreign taxes and pre-tax income as of the date the affiliate is first included in the BEA Surveys or 1982, whichever comes first. We then subtract repatriations to estimate foreign taxes and undistributed pre-tax foreign earnings in each year. The affiliate tax rate is foreign taxes divided by undistributed pre-tax foreign earnings. We believe that the difference between the U.S. statutory rate and Affiliate Creditable Tax Rate is a better approximation of the incremental taxes due upon repatriation than an average of the affiliates’ current period foreign tax rates since Affiliate Creditable Tax Rate is estimated in a manner similar to the U.S. foreign tax credit computation under Section 902 of the Internal Revenue Code. 14 We obtain PRE from SEC 10-K filings. We use assets as a deflator for PRE to identify firms with large amounts of PRE because assets is a stock variable which is more comparable to the cumulative nature of PRE than sales. We use assets in low tax affiliates because we want to estimate the extent to which the firm must recognize a tax expense on repatriations. Thus, we assume that all PRE is in low tax affiliates. To the extent that firms have PRE in high tax affiliates we overestimate the financial reporting cost, which creates a conservative bias in our results. 15 The BEA data only allow us to observe annual capital contributions from U.S. parents to foreign affiliates in 1999 and 2004 while we observe distributions from foreign affiliates to U.S. parents for all years in our sample. Using data for distributions but not contributions creates a concern that our data is left-censored at zero because non-repatriating affiliates receive capital contributions (i.e.., negative distributions).

18
repatriation than private firms. Therefore, all else equal, we expect a negative coefficient on
Public × RepCost.
H2 predicts that public firms with significant amounts of permanently reinvested earnings are
more sensitive to the tax cost of repatriations than other public firms. While the dollar amount of
the repatriation tax is the same for cash taxes and the tax expense on the financial statements, the
timing of the two effects differs. HighPre measures this timing difference. Firms that can
repatriate foreign earnings not designated as PRE can repatriate without recognizing a tax
expense on the financial statements. Firms with high amounts of PRE have less ability to
repatriate without recognizing a tax expense on the financial statements. For these firms, the
financial reporting cost occurs at the same time as the cash tax cost. Thus, the repatriation tax has
a more negative effect on repatriation decisions for firms with high amounts of PRE. We include
HighPre and HighPre × RepCost to capture the incremental effect of the PRE designation on
public firms’ sensitivity to the tax cost of repatriating. Consistent with H2, we expect a negative
coefficient on HighPre × RepCost.
In addition to our variables of interest, we include controls for other factors that influence
repatriation decisions. First, we include controls for investment opportunities abroad and in the
U.S. (Foreign Growth and U.S Growth, respectively). Following La Porta et al. [2002] and Desai
et al. [2004] we proxy for investment opportunities by computing a three-year historical sales
growth rate for all U.S. owned affiliates in each country-industry.16 Hartman [1985] argues that
firms will repatriate when the after-tax foreign rate of return on investment opportunities in the
foreign subsidiary decline below those available elsewhere. Consistent with this theoretical
16 As these authors point out, traditional measures such as market-to-book ratios or Tobin’s Q are not feasible in a multinational setting. The affiliates themselves do not have observable market values, and the market-to-book ratios of publicly-traded foreign-owned firms are not good proxies for investment opportunities of U.S. owned affiliates.

19
result, we expect repatriations to be negatively related to foreign opportunities and positively
related to domestic opportunities.
Equation (1) also includes controls for size of foreign operations, agency costs, financing
constraints, and costs of financing. To control for the size of foreign operations, we include Size,
the log of undistributed pre-tax foreign earnings. We expect a positive coefficient on this
variable because firms with more foreign earnings have more funds available to repatriate. We
include U.S. Leverage and Foreign Leverage to control for firms’ debt service needs and capital
structure. Firms may be more reluctant to repatriate if they have high foreign debt service
suggesting a negative association between Foreign Leverage and repatriations. We do not make
a sign prediction on U.S. Leverage because there are two opposing forces regarding its relation to
repatriations. First, U.S Leverage may be positively associated with repatriations if firms
distribute funds to service domestic debt. Alternatively, U.S. Leverage may be negatively
associated with repatriations because firms may have borrowed domestically against the
undistributed foreign earnings.
We include U.S. Interest to control for the domestic cost of borrowing. We anticipate that
firms with a higher cost of borrowing in the U.S. have higher dividend repatriations. We include
Foreign Interest to control for the foreign cost of borrowing. We expect that firms with a higher
cost of borrowing abroad have lower dividend repatriations. We include Foreign Cash to proxy
for the potential agency costs of excess cash and anticipate that firms with more cash abroad
have higher dividend repatriations.17 %Foreign Sales is our proxy for the opportunity for
multinational tax planning via investment. As discussed in Altshuler and Grubert [2003], firms
with greater overseas activity have more opportunities to defer repatriation taxes through
17 The BEA surveys do not capture domestic cash balances in all years during our sample period, which prohibits us from including a control for domestic cash holdings.

20
intercompany transfers.18 Thus, we expect a positive coefficient on %Foreign Sales. We include
U.S. Loss to control for differing tax incentives for firms with domestic losses. Power and
Silverstein [2007] find that firms are less likely to repatriate earnings when the domestic parent
has a loss because repatriations convert domestic net operating losses (NOLs) with a 20-year
carry forward period into foreign tax credits (FTCs) with only a five-year carry forward
period.19,20 Finally, we include four measures to control for country-level factors that affect
repatriations. We first determine each of the country-level measures at the affiliate level, and
then we calculate the parent-level score as the average of the affiliate scores. Mandatory
Dividend equals one if the country requires dividends to be paid to shareholders, and zero
otherwise (La Porta et al. [1998]). Corruption is an index taking values from one through 10,
with 10 representing the lowest level of corruption (La Porta et al. [1998]). Corruption may
increase the cost of doing business such that more capital must remain in the country;
alternatively corruption may increase repatriations to reduce the probability of expropriation or
theft. Infrastructure is an index taking values of one through ten, with ten representing the best
infrastructure (La Porta et al. [1999]). All else equal, the less developed a country’s
infrastructure, the more capital the company likely needs to invest in its operations. Finally,
Capital Control is equal to one if the country restricts a firm’s ability to take funds out of the
country, and zero otherwise (International Monetary Fund [2006]). 18 Altshuler and Grubert [2003] also discuss that tiered subsidiary structures can reduce the incremental tax burden of repatriations. When we include a measure of a firm’s indirect subsidiary activity in Equation (1), its coefficient is insignificant and our inferences are unaltered. 19 Power and Silverstein also point out that i) FTC usage is generally more restrictive than NOL usage because of the basket system, and ii) NOLs can be used to offset the tax liability on U.S. source income whereas FTCs can only offset the tax liability on foreign source income. This flexibility makes NOL carry forwards more valuable than FTC carry forwards. 20 The American Jobs Creation Act (AJCA) of 2004 extended the carry forward period available for FTCs from five years to ten years. Any excess FTCs that are available to be carried forward to tax years ending after October 22, 2004 are available for the extended carry forward period. The five-year carry forward period was in effect for most of our sample period. Additionally, the ten-year period is still substantially less than the 20-year carry forward period available for NOLs.

21
5. Results
5.1 BEA DESCRIPTIVE STATISTICS
Table 2 provides descriptive statistics for our BEA sample of 577 firms from 1999 through
2004. From this balanced panel we eliminate 285 firm-years for which we do not have all
required regression variables for our multivariate analyses resulting in 3,177 firm-years. As we
conduct our analysis using the affiliated group (i.e., the domestic U.S. parent plus reporting
foreign affiliates), we report all statistics at the parent level, unless otherwise noted. We show
statistics separately for private firms, low PRE public firms (HighPre = 0), and high PRE public
firms (HighPre = 1). We winsorize all continuous measures at the top and bottom one percent
and all tax rate measures to fall between zero and 100 percent. Finally, due to confidentiality
restrictions, medians reported in the table (Median5) represent the mean of the five middle
observations.
Panel A reports descriptive statistics for our regression variables. Repatriations is
significantly greater for high PRE firms than for both low PRE public and private firms. This
result is interesting for two reasons. First, we expect public firms to repatriate less than private
firms because private firms are likely to have more limited access to capital than public firms.
Consistent with private firms being aggressive tax planners, private firms have a lower RepCost
(10.26 percent) than public firms (low PRE=11.30 percent, high PRE=11.52 percent).
Second, high PRE firms should be those with the greatest investment opportunities abroad,
consistent with the longer investment horizon required to designate earnings as permanently
reinvested. Although statistically different, the mean of our proxy for domestic investment
opportunities (U.S. Growth) is of comparable economic magnitude across public and private

22
firms consistent with the similar industry representation between private and public samples
documented in Table 1, Panel C. Foreign investment opportunities (Foreign Growth) are
significantly lower for private firms (7.07 percent) than low PRE and high PRE public firms
(11.62 percent and 20.90 percent, respectively). Note that the foreign investment opportunities
are the highest for high PRE public firms consistent with PRE signaling reinvestment into
profitable overseas activities.
Measures of domestic and foreign leverage (U.S. Leverage and Foreign Leverage,
respectively) suggest that private firms use more foreign debt relative to low PRE and high PRE
public firms (2.16 versus 1.79 and 1.25, respectively), while low PRE and high PRE public firms
use more domestic debt relative to private firms (0.73 and 1.37 versus 0.60, respectively).
Interestingly, there is no statistically significant difference in domestic or foreign interest rates –
yet public firms use more domestic debt - suggesting that public firms use more domestic debt
because foreign earnings are trapped abroad consistent with our hypotheses above. Public and
private firms have equal realizations of negative pre-tax income in their domestic operations
(U.S. Loss equals approximately 18 percent for both types of firms).
Panel B reports descriptive statistics for tax rate measures used in existing research.
Consistent with our estimate of the tax cost of repatriating, RepCost, the private sample appears
to face higher income tax burdens abroad. DFH Tax Rate, the median of all affiliate tax rates for
all U.S. affiliates operating in a country-year as described in Desai et al. [2001], is 27.50 percent
for private firms but only 25.91 percent and 25.54 percent for low PRE public and high PRE
public firms, respectively. The fact that public firms have lower current incomes taxes is
consistent with Graham et al.’s (2009) survey evidence that the benefits of income tax expense
deferral is of primary importance in foreign direct investment location decisions of public

23
companies. Consistent with private firms facing higher income tax burdens and a lower
expected tax cost of repatriation, our measure of the Affiliate Creditable Tax Rate is higher for
private firms than for both sub-samples of public firms. Finally, the current period foreign
income taxes paid over foreign pre-tax income (Current FTR) is highest for high PRE firms
(28.95 percent). We interpret this result as suggesting that the undistributed earnings of high PRE
firms are from prior years, that is, a non-trivial proportion of the undistributed earnings were
likely generated before our sample period.
Panel C reports general descriptive statics for the BEA data. The mean return on sales, Prof,
is 3.89 percent for private firms and 3.34 percent for low PRE and 1.21 percent for high PRE
firms suggesting that private firms are more profitable than public firms. Public firms are much
larger than private firms in terms of number of affiliates and total sales. Affiliates is the number
of affiliates in the group and is larger for public firms than private firms. Private firms have 9.08
affiliates on average, whereas low PRE (high PRE) public firms have 22.71 (28.58) affiliates on
average. Mean Domestic (Foreign) Sales are $1.88 billion ($775 million) for private firms and
$6.12 billion ($3.12 billion) for low PRE public firms. High PRE public firms’ mean Domestic
(Foreign) Sales of $5 billion ($3.38 billion) are similar to the low PRE public sample. We
control for these differences in our regression analysis by including Size and %Foreign Sales in
the empirical model. In Panel A, Size is significantly higher for public firms than private firms.
Although of similar magnitude, high PRE public firms have a greater proportion of their sales
overseas (%Foreign Sales = 35.77 percent) than low PRE public (29.82 percent) and private
(28.38 percent) firms.
24
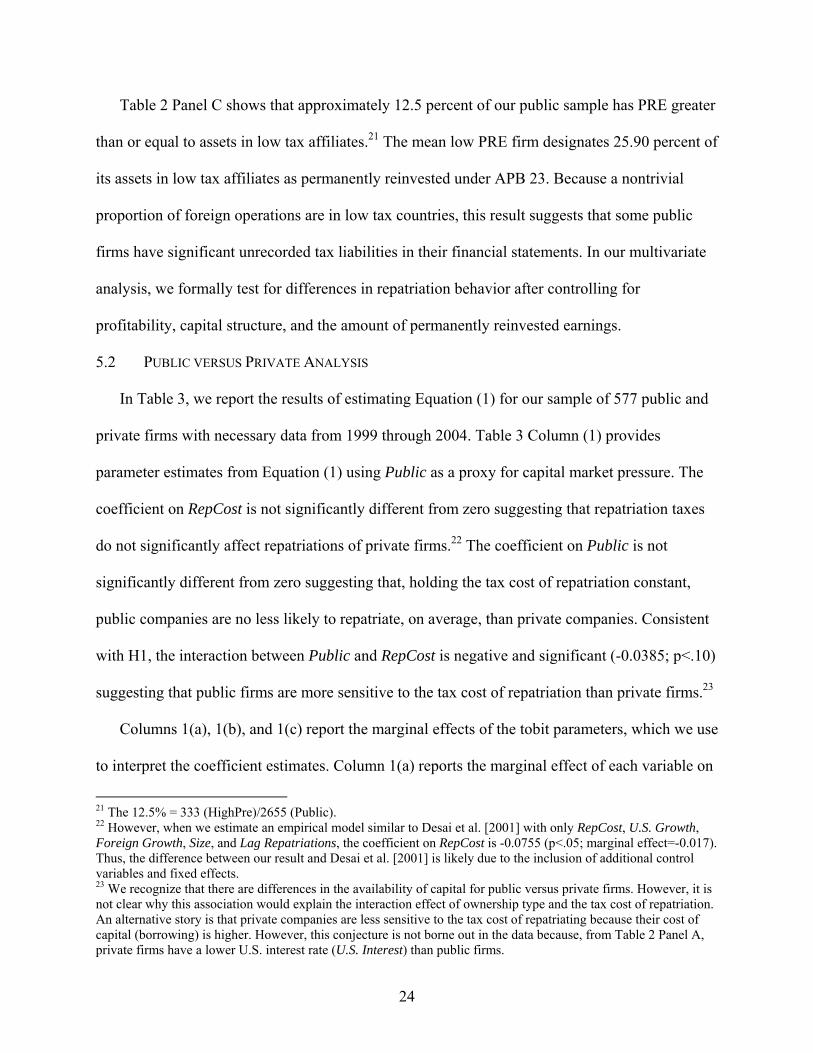
Table 2 Panel C shows that approximately 12.5 percent of our public sample has PRE greater
than or equal to assets in low tax affiliates.21 The mean low PRE firm designates 25.90 percent of
its assets in low tax affiliates as permanently reinvested under APB 23. Because a nontrivial
proportion of foreign operations are in low tax countries, this result suggests that some public
firms have significant unrecorded tax liabilities in their financial statements. In our multivariate
analysis, we formally test for differences in repatriation behavior after controlling for
profitability, capital structure, and the amount of permanently reinvested earnings.
5.2 PUBLIC VERSUS PRIVATE ANALYSIS
In Table 3, we report the results of estimating Equation (1) for our sample of 577 public and
private firms with necessary data from 1999 through 2004. Table 3 Column (1) provides
parameter estimates from Equation (1) using Public as a proxy for capital market pressure. The
coefficient on RepCost is not significantly different from zero suggesting that repatriation taxes
do not significantly affect repatriations of private firms.22 The coefficient on Public is not
significantly different from zero suggesting that, holding the tax cost of repatriation constant,
public companies are no less likely to repatriate, on average, than private companies. Consistent
with H1, the interaction between Public and RepCost is negative and significant (-0.0385; p<.10)
suggesting that public firms are more sensitive to the tax cost of repatriation than private firms.23
Columns 1(a), 1(b), and 1(c) report the marginal effects of the tobit parameters, which we use
to interpret the coefficient estimates. Column 1(a) reports the marginal effect of each variable on
21 The 12.5% = 333 (HighPre)/2655 (Public). 22 However, when we estimate an empirical model similar to Desai et al. [2001] with only RepCost, U.S. Growth, Foreign Growth, Size, and Lag Repatriations, the coefficient on RepCost is -0.0755 (p<.05; marginal effect=-0.017). Thus, the difference between our result and Desai et al. [2001] is likely due to the inclusion of additional control variables and fixed effects. 23 We recognize that there are differences in the availability of capital for public versus private firms. However, it is not clear why this association would explain the interaction effect of ownership type and the tax cost of repatriation. An alternative story is that private companies are less sensitive to the tax cost of repatriating because their cost of capital (borrowing) is higher. However, this conjecture is not borne out in the data because, from Table 2 Panel A, private firms have a lower U.S. interest rate (U.S. Interest) than public firms.

25
the unconditional expected value of Repatriations. We calculate the marginal effect of Public ×
RepCost using Ai and Norton [2003] and McDonald and Moffitt [1980].24 The marginal effect of
Public x RepCost on the unconditional expected value of Repatriations is -0.015. This estimate
suggests that the change in Repatriations when RepCost changes from zero to the sample mean
of 0.1115 is 1.5 percent of sales less for a public firm than for a private firm. Mean worldwide
sales (Domestic Sales + Foreign Sales) for our full sample is $8.07 billion. Therefore, the
average public firm repatriates $13.5 million (-0.015 × 0.1115 × $8,070=$13.5) less per year
than the average private firm. For our 479 public firms, this figure amounts to $6.5 billion in
repatriations per year.
Of the financing and capital structure control variables, only U.S. Leverage is significant; the
positive coefficient suggests that firms repatriate foreign earnings to service high levels of
domestic debt. Size, Lag Repatriations, %ForeignSales, U.S Loss, and Mandatory Dividend are
significant in the expected direction. We interpret the positive coefficient on %ForeignSales as
suggesting that firms with a large multinational presence have a greater ability to mitigate
repatriation taxes, leading to greater repatriations.
5.3 PUBLIC ONLY ANALYSIS
In Table 3 Column (2), we report the results of estimating Equation (1) for our sample of 479
public firms. In Column (2) we use HighPre and HighPre × RepCost to test for the effect of
capital market pressure on repatriations. Consistent with H2, the coefficient on HighPre ×
RepCost is negative and significant (-0.0540; p<.01).25 This result suggests that public firms with
24 See the Appendix for a detailed discussion of this calculation. 25 The results in Tables 3 are similar when we define HighPre as equal to one if the ratio of PRE to total assets in low tax countries is greater than or equal to 0.60. Results are also similar if we define HighPre as equal to one if the ratio of PRE to unremitted foreign earnings in low tax affiliates is greater or equal to one. However, when we define HighPre as equal to one if the ratio of PRE to unremitted foreign earnings in low tax affiliates is greater or equal to 0.80, the coefficient on HighPre*RepCost is negative but insignificant. Finally, the results in Table 3 are similar when we include p_age, the number of years the parent appears in the BEA data, as a control for the age of the

26
large amounts of unrecorded deferred tax liabilities on foreign earnings are more sensitive to the
tax cost of repatriating than other public firms. In Columns (2a), (2b), and (2c) we report the
marginal effects. The marginal effect of HighPre × RepCost on the unconditional expected value
of Repatriations is -0.0191. Mean worldwide sales (Domestic Sales + Foreign Sales) for our
public sample is $9.135 billion. Thus, the change in Repatriations when RepCost changes from
zero to the sample mean of 0.1133 is 1.91 percent of sales or $19.8 million (-0.0191 × 0.1133 ×
$9,135 = $19.8) less for a high PRE public firm than for a low PRE public firm. This figure
amounts to $6.6 billion per year for our 333 high PRE firms.
In summary, we interpret our results as follows. First, public companies are more likely to
value the ability to defer recognition of tax expense on undistributed foreign earnings. Therefore,
public firms are less likely to repatriate when the tax cost of repatriating is high. Second, public
companies with high amounts of PRE are particularly sensitive to the tax cost of repatriating
because they are likely to have significant unrecorded tax liabilities and little or no flexibility to
repatriate non-PRE foreign earnings. This lack of flexibility further deters repatriation of foreign
earnings for public firms that face a high tax cost of repatriation.26
5.4 ALTERNATIVE SPECIFICATION
In Table 4 we estimate Equation (1) replacing the dependent variable with repatriations
from low tax affiliates divided by worldwide sales (Low Repatriations). We also replace Size
parent (Public x RepCost coefficient -0.0368 p-value = 0.10; HighPre x RepCost coefficient -0.0504 p-value < 0.001). 26 This lack of flexibility could also be interpreted as a lack of ability to repatriate if high PRE firms are heavily invested in operating assets abroad. We formally rule out this explanation in Section 6.2 by showing that the high PRE firms hold more cash abroad. We note here that high PRE firms appear to hold a non-trivial portion of their assets in tax havens. Specifically, when we compare the top five countries in terms of the number affiliates between high PRE and low PRE public firms, we find no difference in the location choices (i.e., UK, Canada, Germany, Netherlands, and France). However, when we compare the top five countries in terms of total assets, we find that the list for low PRE firms looks similar to the previous list (i.e., UK, Canada, Netherlands, Germany, and Japan). However, for high PRE firms, all five countries on the list include tax havens following Hines and Rice [1994] (i.e., Bermuda, Netherlands, Ireland, Luxembourg, and Switzerland).

27
with Low Size (log of undistributed pre-tax earnings in low tax affiliates) and Lag Repatriations
with Lag Low Repatriations (lagged repatriation from low tax affiliates), and we add a control
for contemporaneous repatriations from high tax affiliates (High Repatriations). This
specification allows us to test whether the decrease in repatriations for firms with high capital
market pressures can be attributed to low tax affiliates that are more likely to generate a tax cost
from repatriating. Since repatriations from high tax affiliates typically do not create a tax cost,
we anticipate that capital market pressure deters repatriations from low tax affiliates. This
specification also allows us to avoid complications associated with interpreting the interaction
terms in Table 3 (see Ai and Norton [2003]).
In Column (1) the coefficient on Public tests whether, after controlling for the tax cost of
repatriating and repatriations from high tax affiliates, public firms repatriate less from low tax
affiliates than private firms. The coefficient on Public is -0.0528 (p<.05) consistent with H1 and
the results in Table 3. The coefficient on RepCost is negative and significant, consistent with
existing literature. In Column (2), the coefficient on HighPre tests whether public firms with
significant unrecognized deferred tax liabilities on foreign earnings repatriate less than other
public firms. The coefficient on HighPre is -0.0358 (p<.05) consistent with H2 and the results in
Table 3. In untabulated results, we repeat these tests using High Repatriations in place of Low
Repatriations as the dependent variable and instead use controls for High Size, Lag High
Repatriations, and contemporaneous dividends from low tax affiliates (Low Repatriations). The
coefficients on Public and HighPre are not significantly different from zero (p=0.794 and
p=0.285, respectively), further suggesting that capital market incentives deter repatriation from
low tax affiliates.

28
6. Supplemental Analyses
6.1 QUARTERLY REPATRIATION
To further associate our results with financial reporting incentives, we examine the timing of
repatriations for public and private firms throughout the year. If public firms’ repatriation
decisions are associated with the need to manage investor perceptions of firm performance in
addition to the need for cash, then it is possible that public firms’ repatriation patterns throughout
the year differ from private firms. As the fiscal year progresses, firms have more information
about actual annual earnings. Therefore, we expect that public firms are more likely to make
repatriation decisions in the fourth quarter so they can weigh the need for cash with the need to
meet earnings goals. However, the direction of the effect of the tax cost of repatriations on these
decisions is unclear. Public firms may be less sensitive to the tax cost of repatriations in the
fourth quarter when earnings uncertainty is reduced. Conversely, they may be more sensitive to
the tax cost of repatriations in later quarters as they adjust repatriations to meet reporting goals.
Table 5 provides univariate statistics for quarterly repatriation activity of private and public
firms. The Repatriation Indicator is the percentage of parent firms that repatriate earnings from
at least one subsidiary during the quarter. This percentage is lower for public firms in every
quarter, suggesting that public companies repatriate less often than private companies. However,
this finding could also stem from the fact that public parents have more than double the number
of affiliates than private parents (see Affiliates in Table 2). When we scale repatriation activity by
sales, these differences are largely diminished. Nonetheless, Repatriations does reveal a general
pattern of more public company repatriations in the second half of the year and less in the first
half of the year relative to private companies. This result is consistent with public firms being

29
more willing to repatriate later in the fiscal year when there is some reduced uncertainty about
accounting earnings for the period.
When we consider repatriations from high and low tax affiliates separately, the univariate
statistics suggest that public companies repatriate less frequently from low tax affiliates relative
to private companies. Again, continuous measures – High Repatriations and Low Repatriations –
reveal a general pattern of steady increases in public company repatriations throughout the year
from both high tax and low tax affiliates. In Table 5, Panel B, we report the proportion of
repatriations occurring in the fourth quarter (Q4RepPct). This measure suggests that public firms
repatriate more in the fourth quarter than private firms (14.04 and 15.53 versus 10.51 percent,
respectively). While the univariate results broadly suggest that public companies repatriate less
often than private companies and that public company repatriation activity appears to steadily
increase throughout the year, we are interested in the difference between private and public
company repatriation behavior and thus use a multivariate analysis to do a more robust
comparison.
Table 6 presents multivariate results of estimating the following empirical model that
investigates the effect of capital market pressure on quarterly repatriation activity:
Q4RepPct = β0 + β1RepCost+ β2Capital Market Pressure + β3Capital Market Pressure × RepCost + β4QTRProf + β5Size + ΣβtYeart + ΣβjIndustry + ε (2)
Q4RepPct equals repatriations during the fourth quarter divided by total repatriations during
the year. QTR Prof is fourth quarter foreign net income scaled by one fourth of annual foreign
sales. We expect that the effect of repatriation taxes on fourth quarter repatriations is different for
firms with relatively high capital market pressure. Therefore, we expect significant coefficients
on the interaction of RepCost with our proxies for capital market pressure - Public and HighPre.

30
In Column (1) we investigate whether a higher proportion of public firm repatriations occur
in the fourth quarter relative to private firms. In Column (1a) we report marginal effects. We find
that the coefficient on Public × RepCost is negative and significant (-1.1206; p<.01). This result
suggests that public firms repatriate less in the fourth quarter relative to private firms as the tax
cost of repatriating increases. We interpret this result as evidence that as public companies near
the close of their fiscal year and have a better assessment of annual earnings, they look for ways
to increase reported earnings. By avoiding repatriations from low tax countries public firms can
avoid recognition of tax expense.
In Columns (2) and (2a) of Table 6, we present the results of estimating Equation (2) and the
marginal effects using HighPre as a proxy for capital market pressure. In Column (2) the
coefficient on HighPre is insignificant suggesting that firms with large unrecorded tax liabilities
do not time repatriations differently than other public firms. The coefficient on HighPre ×
RepCost is negative and significant (-0.8963, p<0.05) suggesting that, as the tax cost of
repatriation increases, HighPre public firms have fewer fourth quarter repatriations relative to
other public firms. Overall, these results suggest that firms with high capital market pressure
consider the tax cost of repatriations when timing their repatriations, providing additional
support for our hypothesis that capital market pressures affect repatriation decisions.
6.2 FOREIGN CASH HOLDINGS
Next, we evaluate the association between unrecorded deferred tax liabilities and foreign
cash holdings for the public firms in our sample. Although we conjecture that capital market
pressures lead to predictable differences between repatriations of high PRE and low PRE firms,
our results could still be attributable to varying investment opportunities. A public firm that
designates earnings as PRE is declaring its intention to reinvest foreign earnings abroad

31
indefinitely, and may, as a result of investment opportunities, be more sensitive to the tax cost of
repatriating. To control for this possibility, we include measures of foreign and domestic
investment in our main empirical tests. To further rule out the possibility that our results are
confounded by differences in investment opportunities, we follow Foley et al. [2007], to
investigate the effect of HighPre on foreign cash holdings.
Generally, we expect that firms will repatriate when investment opportunities in the U.S.
dominate those abroad and reinvest when foreign investment opportunities dominate those in the
U.S. (Hartman [1985]). Foley et al. [2007] find that the tax cost of repatriating helps explain the
build-up of cash abroad and, more specifically, in affiliates located in low tax jurisdictions. If a
MNC designates foreign earnings as PRE because of investment opportunities, then HighPre
will have either a negative or insignificant effect on the association between the tax cost of
repatriation and foreign cash holdings because new investment is not reflected in the cash
account. However, to the extent that public companies designate foreign earnings as PRE
because of the financial reporting costs of repatriation, we expect that these costs will result in
more cash held abroad, i.e. these costs will exacerbate the positive relation between the tax cost
of repatriating and foreign cash holdings.
To investigate this conjecture we estimate the following empirical model using ordinary least
squares (OLS) estimation:27
LN(Cash/Net Assets) = β0 + β1RepCost + β2HighPre + β3HighPre × RepCost +∑βkControlsk + ∑ βtYeart + ∑ βjIndustryj + ε (3)
LN(Cash/Net Assets) is the natural log of foreign cash holdings divided by non-cash foreign
assets consistent with Foley et al. [2007]. We report the results of estimating Equation (3) for our
27 We use OLS to be consistent with Foley et al. (2007) and because it is not feasible that cash balances are negative, making tobit inappropriate.

32
sample of public firms in Table 7. We expect and find that the coefficient on HighPre × RepCost
is positive and significant. This result is consistent with the view that undistributed foreign
earnings are trapped abroad for firms with high financial reporting costs of repatriating and helps
rule out the possibility that the results in Table 3 stem from higher investment opportunities
abroad for HighPre firms.
6.3 ALTERNATIVE PROXY FOR CAPITAL MARKET PRESSURE
In our main tests, we use HighPRE as a proxy for firms that have high financial reporting
costs of repatriation because firms with high amounts of PRE have less ability to repatriate
without recognizing a tax expense in the financial statements than firms with low amounts of or
no PRE. An alternative explanation for our results is that PRE is higher for firms that have
earnings in low tax jurisdictions and thus are trying to avoid the cash tax cost. If this is the case,
then HighPRE not only measures financial reporting costs, but also captures some of cash tax
effect. To rule out this explanation we develop an alternative proxy for financial reporting costs
that relies on the effect of repatriations on the firm’s effective tax rate. Specifically, if a firm
repatriates current earnings and prior earnings previously designated as PRE (Column IV of
Figure 1) it recognizes a higher tax expense as a result of the repatriation than if it repatriates
current earnings and prior earnings not previously designated as PRE (Column V of Figure 1).
Further, if the firm repatriates current earnings and prior earnings previously designated as PRE,
it experiences a large increase in its effective tax rate because it is recognizing U.S. tax expense
on current period foreign earnings and on foreign earnings recognized in an earlier accounting
period. Thus, as an alternative measure of the financial reporting cost of repatriation, we
calculate ETRhit as the tax expense recognized in the financial statements if all PRE were

33
repatriated divided by earnings before taxes.28 This variable measures the decrease in the
effective tax rate the firm would experience if it repatriated all foreign earnings designated as
PRE.
We report the results of estimating Equation (1) measuring Capital Market Pressure with
ETRhit in Table 8. ETRhit has the advantage that it measures the financial reporting cost of
repatriating relative to pre-tax earnings and that it is a separate measure from the tax cost of
repatriating eliminating the need for the interaction with RepCost. Therefore, the coefficient on
ETRhit measures the financial reporting cost of repatriating on repatriations, after controlling for
the tax cost of repatriating. The results in Table 8 suggest that repatriations are negatively related
to both the tax cost of repatriating (z=-2.01) and the financial reporting cost of repatriating (z=-
2.90). These results provide additional support for our hypothesis that financial reporting costs
deter repatriations.
7. Conclusion
U.S. international tax policy plays a role in the ability of U.S. multinationals (MNCs) to
compete in the global marketplace and various opponents of current tax policy argue that it
creates incentives for U.S. firms to park foreign subsidiary profits in low tax countries, thereby
reducing domestic investment. These incentives arise because MNCs incur a tax liability upon
repatriation of foreign subsidiary earnings generally equal to the difference between the U.S. tax
rate and the average foreign tax rate paid on the repatriated earnings. A factor that has received
28 Since we do not know the affiliates where the PRE is located we have to estimate the tax credit the firm would generate if it repatriated all of its PRE. Specifically, ETRhit is defined as the estimated incremental tax due upon repatriation (PRE*0.35 less [(PRE/UFE in low tax affiliates)*accumulated taxes paid in low-tax affiliates]) over pre-tax book income (Compustat PI).

34
little attention in the empirical literature on repatriation behavior is that financial reporting can
also affect repatriation decisions.
Accounting policy generally allows firms to delay recognizing the repatriation tax expense in
the period in which the earnings are generated by designating them as permanently reinvested
earnings (PRE) under APB 23. Instead, the firm recognizes the expense in the period that it
repatriates those earnings or it no longer considers them permanently reinvested. Firms under
capital market pressure to report higher earnings have an incentive to delay repatriation to avoid
recognizing the tax expense in the financial statements. In this paper, we find that the capital
market incentive to report higher earnings to shareholders is a factor that affects repatriation
behavior. Specifically, we find that public firms, which face capital market pressures to increase
earnings, are more sensitive to the tax cost of repatriation than private firms. Further, we find
that public firms that have high amounts of PRE, and therefore a high financial reporting cost of
repatriating, are more sensitive to the tax cost of repatriating than other public firms. These
findings are relevant for both tax policy makers and accounting standard setters because they
suggest that the current accounting for U.S. taxes on foreign subsidiary earnings affects
repatriation. Our findings also suggest that financial reporting costs help explain the large surge
in repatriations under the AJCA because the financial reporting cost, along with the cash tax
cost, was temporarily reduced.

35
APPENDIX
Many studies use logits, probits, and/or tobits to test their hypotheses. Because these are all nonlinear models, interpreting the coefficient estimates requires calculating their marginal effects. Statistical software easily calculates these marginal effects. However, Ai and Norton [2003] show that traditional statistical software incorrectly estimates the marginal effects of interaction terms in these models. They develop detailed equations of the correct calculation of the marginal effect of interaction terms in logit and probit models, and make the stata program for these estimates available online. Although they note that tobits have the same problem as logits and probits, they do not formally develop equations or programs for these estimates. Our review of the literature suggests that many studies either do not attempt to properly estimate the marginal effects for interaction terms from tobits or apply Ai and Norton’s method incorrectly to the tobit. In this Appendix, we provide our estimates of the marginal effects of the interaction terms as well as our Stata code to help researchers apply these estimates properly.
To estimate the marginal effect of our interaction terms, we follow McDonald and Moffitt [1980] and their decomposition of the tobit coefficients into the effect conditional on being uncensored and the effect on the probability of being uncensored. McDonald and Moffitt show that the marginal effect of a non-interacted variable on the unconditional expected value (or the total marginal effect) is:
TME = ∂Ey/∂X1 = F(z)β1, (A1) where, y is the dependent variable, X1 is the independent variable of interest, and z=Xβ/σ. Because we want to estimate the marginal effect of the interaction between X1 and X2, where X1 is a continuous variable and X2 is a dichotomous variable, we want ∂Ey/∂X1∂X2. This estimate requires taking the difference between A1 evaluated with X1 equal to the mean and X2 equal to one and A1 evaluated with X1 equal to the mean and X2 equal to zero.29 Therefore we define: xb1= β0+β1* +β2*1+β3* *1, and xb0= β0+β1* +β2*0+β3* *0. The total marginal effect of the interaction term is: TMEint=F(xb1/σ)*(β1+β3) – F(xb0/σ)*(β1)
McDonald and Moffitt decompose the total marginal effect into the marginal effect on the probability of being uncensored and the marginal effect conditional on being uncensored. They show that the marginal effect on the probability of being uncensored for a non-interacted variable is:
PU = ∂F(z)/∂X1 = f(z)β1/σ. (A2)
29 For simplicity, we show equations using only one continuous variable (e.g. the tax costs of repatriating) and one dichotomous variable (e.g. Public). We include all control variables in Equation (1) by setting them equal to their mean in the definitions of xb1 and xb0.
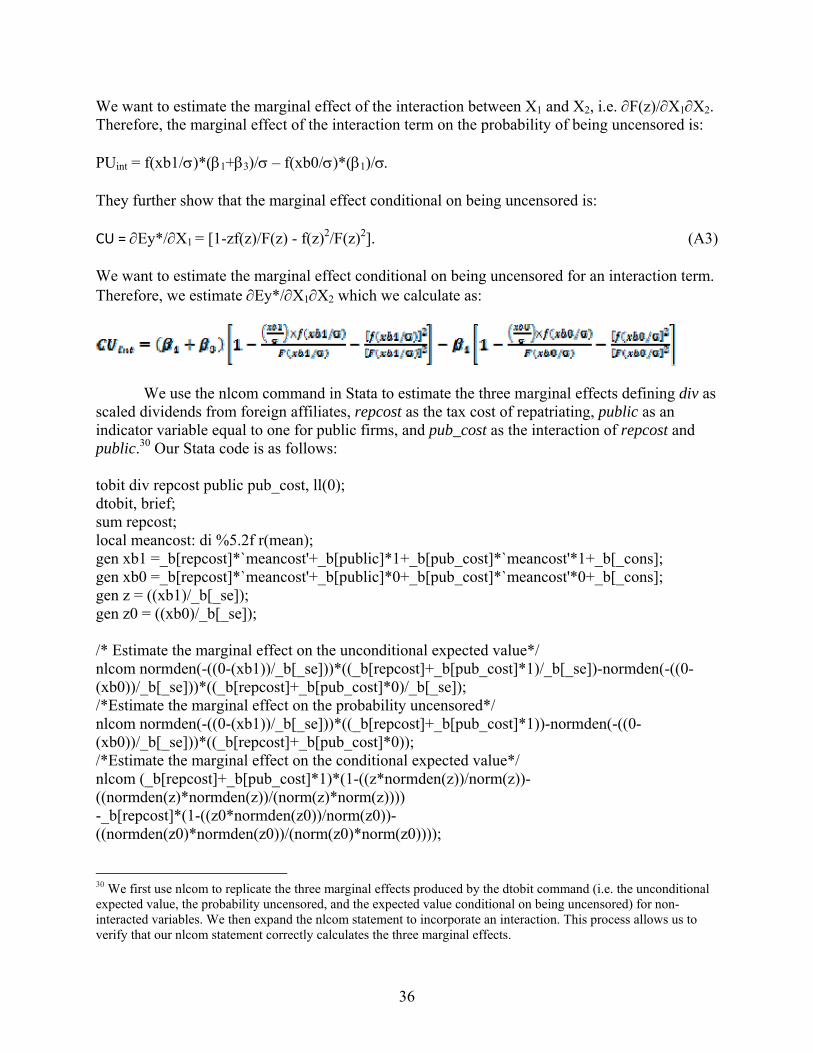
36
We want to estimate the marginal effect of the interaction between X1 and X2, i.e. ∂F(z)/∂X1∂X2. Therefore, the marginal effect of the interaction term on the probability of being uncensored is: PUint = f(xb1/σ)*(β1+β3)/σ – f(xb0/σ)*(β1)/σ. They further show that the marginal effect conditional on being uncensored is: CU = ∂Ey*/∂X1 = [1-zf(z)/F(z) - f(z)2/F(z)2]. (A3) We want to estimate the marginal effect conditional on being uncensored for an interaction term. Therefore, we estimate ∂Ey*/∂X1∂X2 which we calculate as:
We use the nlcom command in Stata to estimate the three marginal effects defining div as
scaled dividends from foreign affiliates, repcost as the tax cost of repatriating, public as an indicator variable equal to one for public firms, and pub_cost as the interaction of repcost and public.30 Our Stata code is as follows:
tobit div repcost public pub_cost, ll(0); dtobit, brief; sum repcost; local meancost: di %5.2f r(mean); gen xb1 =_b[repcost]*`meancost'+_b[public]*1+_b[pub_cost]*`meancost'*1+_b[_cons]; gen xb0 =_b[repcost]*`meancost'+_b[public]*0+_b[pub_cost]*`meancost'*0+_b[_cons]; gen z = ((xb1)/_b[_se]); gen z0 = ((xb0)/_b[_se]); /* Estimate the marginal effect on the unconditional expected value*/ nlcom normden(-((0-(xb1))/_b[_se]))*((_b[repcost]+_b[pub_cost]*1)/_b[_se])-normden(-((0-(xb0))/_b[_se]))*((_b[repcost]+_b[pub_cost]*0)/_b[_se]); /*Estimate the marginal effect on the probability uncensored*/ nlcom normden(-((0-(xb1))/_b[_se]))*((_b[repcost]+_b[pub_cost]*1))-normden(-((0-(xb0))/_b[_se]))*((_b[repcost]+_b[pub_cost]*0)); /*Estimate the marginal effect on the conditional expected value*/ nlcom (_b[repcost]+_b[pub_cost]*1)*(1-((z*normden(z))/norm(z))-((normden(z)*normden(z))/(norm(z)*norm(z)))) -_b[repcost]*(1-((z0*normden(z0))/norm(z0))-((normden(z0)*normden(z0))/(norm(z0)*norm(z0))));
30 We first use nlcom to replicate the three marginal effects produced by the dtobit command (i.e. the unconditional expected value, the probability uncensored, and the expected value conditional on being uncensored) for non-interacted variables. We then expand the nlcom statement to incorporate an interaction. This process allows us to verify that our nlcom statement correctly calculates the three marginal effects.
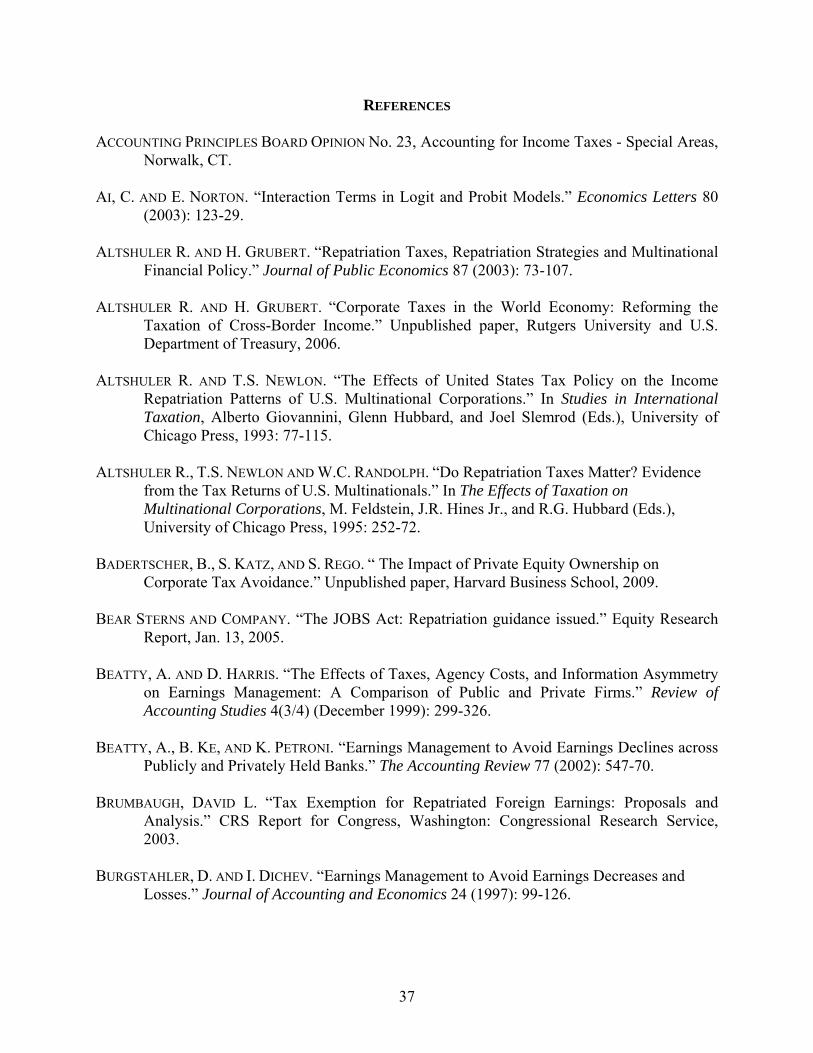
37
REFERENCES ACCOUNTING PRINCIPLES BOARD OPINION No. 23, Accounting for Income Taxes - Special Areas,
Norwalk, CT. AI, C. AND E. NORTON. “Interaction Terms in Logit and Probit Models.” Economics Letters 80
(2003): 123-29. ALTSHULER R. AND H. GRUBERT. “Repatriation Taxes, Repatriation Strategies and Multinational
Financial Policy.” Journal of Public Economics 87 (2003): 73-107. ALTSHULER R. AND H. GRUBERT. “Corporate Taxes in the World Economy: Reforming the
Taxation of Cross-Border Income.” Unpublished paper, Rutgers University and U.S. Department of Treasury, 2006.
ALTSHULER R. AND T.S. NEWLON. “The Effects of United States Tax Policy on the Income
Repatriation Patterns of U.S. Multinational Corporations.” In Studies in International Taxation, Alberto Giovannini, Glenn Hubbard, and Joel Slemrod (Eds.), University of Chicago Press, 1993: 77-115.
ALTSHULER R., T.S. NEWLON AND W.C. RANDOLPH. “Do Repatriation Taxes Matter? Evidence
from the Tax Returns of U.S. Multinationals.” In The Effects of Taxation on Multinational Corporations, M. Feldstein, J.R. Hines Jr., and R.G. Hubbard (Eds.), University of Chicago Press, 1995: 252-72.
BADERTSCHER, B., S. KATZ, AND S. REGO. “ The Impact of Private Equity Ownership on
Corporate Tax Avoidance.” Unpublished paper, Harvard Business School, 2009. BEAR STERNS AND COMPANY. “The JOBS Act: Repatriation guidance issued.” Equity Research
Report, Jan. 13, 2005. BEATTY, A. AND D. HARRIS. “The Effects of Taxes, Agency Costs, and Information Asymmetry
on Earnings Management: A Comparison of Public and Private Firms.” Review of Accounting Studies 4(3/4) (December 1999): 299-326.
BEATTY, A., B. KE, AND K. PETRONI. “Earnings Management to Avoid Earnings Declines across
Publicly and Privately Held Banks.” The Accounting Review 77 (2002): 547-70. BRUMBAUGH, DAVID L. “Tax Exemption for Repatriated Foreign Earnings: Proposals and
Analysis.” CRS Report for Congress, Washington: Congressional Research Service, 2003.
BURGSTAHLER, D. AND I. DICHEV. “Earnings Management to Avoid Earnings Decreases and
Losses.” Journal of Accounting and Economics 24 (1997): 99-126.

38
BURGSTAHLER, D., L. HAIL, AND C. LEUZ. “The Importance of Reporting Incentives: Earnings Management in European Private and Public Firms.” The Accounting Review 81 (2006): 983-1016.
CLOYD, C.B., J. PRATT, AND T. STOCK. “The Use of Financial Accounting Choice to Support
Aggressive Tax Positions: Public and Private Firms. Journal of Accounting Research 34 (1996): 23-43.
DESAI, M., C.F. FOLEY AND J.R. HINES. “Repatriation Taxes and Dividend Distortions. National Tax Journal; 54 (2001): 829-851.
DESAI, M., C.F. FOLEY AND J.R. HINES. “A Multinational Perspective on Capital Structure
Choice and Internal Capital Markets.” Journal of Finance; 59 (2004): 2451-88. DESAI, M., C.F. FOLEY AND J.R. HINES. “Dividend Policy Inside the Multinational Firm.
Financial Management 36 (2007): 5-26. FINANCIAL ACCOUNTING STANDARDS BOARD, Statement No. 109, Accounting for Income Taxes,
Norwalk, CT. FINANCIAL EXECUTIVE INSTITUTE, “2007 Financial Executives Compensation Survey”. 2007. FOLEY, C.F., J. HARTZELL, S. TITMAN AND G. TWITE. “Why Do Firms Hold So Much Cash? A
Tax-Based Explanation.” Journal of Financial Economics 86 (2007): 579-607. GIVOLY, D., C. HAYN, AND S. KATZ. “Does Public Ownership of Equity Improve Earnings
Quality?” The Accounting Review, forthcoming.
GRAHAM, J., M. HANLON, AND T. SHEVLIN. “The Effect of Financial Reporting on the Location, Reinvestment, and Repatriation Decisions of Multinational Companies” Unpublished paper, Duke University, 2009.
GRUBERT, H. “Taxes and the Division of Foreign Operating Income Among Royalties, Interest,
Dividends and Retained Earnings.” Journal of Public Economics 68 (1998): 269-90. HAND, J. R. M. “A Test of the Extended Functional Fixation Hypothesis.” The Accounting
Review 64 (1990): 740-763. HANLON, M., L. MILLS, AND J. SLEMROD. “An Empirical Examination of Corporate Tax
Noncompliance.” In Taxing Corporate Income in the 21st Century, A. Auerbach, J.R. Hines Jr. and J. Slemrod (Eds.), Cambridge University Press, 2007: 171-210.
HARTMAN, D.G. “Tax policy and foreign direct investment.” Journal of Public Economics 26
(1985): 107-21.

39
HINES, J.R. AND R.G. HUBBARD. “Coming Home to America: Dividend Repatriations by U.S. Multinationals.” In Taxation in the Global Economy, A. Razin and J. Slemrod (Eds.), University of Chicago Press, 1990: 161-200.
HINES, J.R. AND E.M. RICE. “Fiscal Paradise: Foreign Tax Havens and American Business.”
Quarterly Journal of Economics, 109 (1994): 149-82. INTERNATIONAL MONETARY FUND (IMF). Annual Report on Exchange Agreements and
Exchange Restrictions, Library of Congress, 2006. KRULL, L. “Permanently Reinvested Earnings, Taxes, and Earnings Management.” The
Accounting Review 79(2004): 745-67. LA PORTA, R., F. LOPEZ-DE-SILANES, A. SHLEIFER, AND R. VISHNY. “Law and Finance.” Journal
of Political Economy 106 (1998): 1113-56. LA PORTA, R., F. LOPEZ-DE-SILANES, A. SHLEIFER, AND R. VISHNY. ”The Quality of
Government.” Journal of Law, Economics, and Organization 15 (1999): 222-79. LA PORTA, R., F. LOPEZ-DE-SILANES, A. SHLEIFER, AND R. VISHNY. “Investor Protection and
Corporate Valuation.” Journal of Finance 57 (2002): 1147-71. MATALONI, R. “U.S. Multinational Companies: Operations in 2001.” Survey of Current Business
2003: 85-105. MCDONALD, J. AND R. MOFFITT. “The Uses of Tobit Analysis.” The Review of Economics and
Statistics (1980): 318-21. MIKHAIL, M. “Coordination of Earnings, Regulatory Capital and Taxes in Private and Public
Companies.” Unpublished paper, Arizona State University, 1999. MILLS, L. AND K. NEWBERRY. “The Influence of Tax and Nontax Costs on Book-Tax Reporting
Differences: Public and Private Firms.” Journal of the American Taxation Association 23(2001): 1-19.
PENNO, M. AND D.T. SIMON. “Accounting Choices: Public versus Private Firms”. Journal of
Business, Finance and Accounting 13 (1986): 561-68. POWER, L. AND G. SILVERSTEIN. “The Foreign Source Income Repatriation Patterns of U.S.
Parents in Worldwide Loss.” National Tax Journal 60 (2007): 537-49. PRICEWATERHOUSECOOPERS. “Private Companies Can Compete with Public Companies for
Executive Talent.” 2007 Trendsetter Barometer Report. SCHOLES, M., M. WOLFSON, M. ERICKSON, E. MAYDEW AND T. SHEVLIN. Taxes and Business
Strategy: A Planning Approach 2nd ed. Upper Saddle River, NJ: Prentice Hall, 2002.

40
SHACKELFORD, D., J. SLEMROD, AND J. SALLEE. “Financial Reporting, Tax and Real Decisions:
A Unifying Framework.” Unpublished paper, University of North Carolina – Chapel Hill, 2009.
SOLOMON, E. Keynote speech, “New OECD International Tax Initiatives: Looking Ahead.”
Conference, June 5, 2007. WOLFSON, M. “The Effects of Ownership and Control on Tax and Financial Reporting Policy.”
Economic Notes 22 (1993): 318-32.
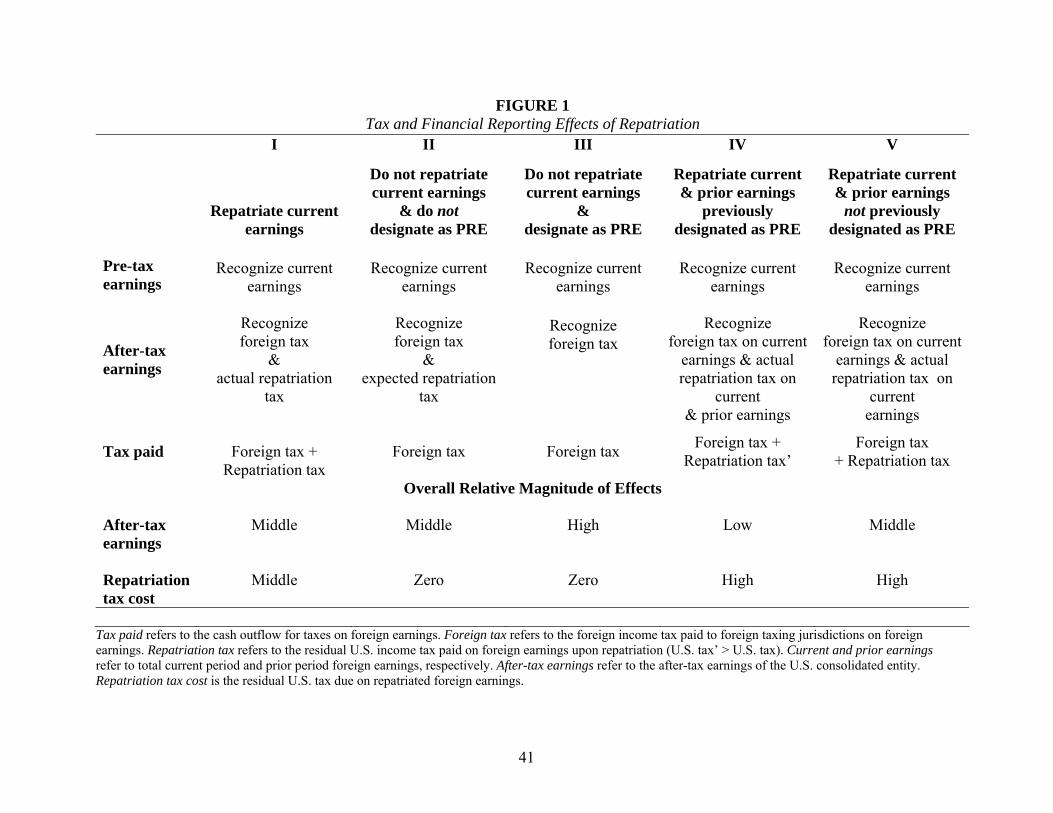
41
FIGURE 1 Tax and Financial Reporting Effects of Repatriation
I II III IV V
Repatriate current earnings
Do not repatriate current earnings
& do not designate as PRE
Do not repatriate current earnings
& designate as PRE
Repatriate current & prior earnings
previously designated as PRE
Repatriate current & prior earnings
not previously designated as PRE
Pre-tax earnings
Recognize current earnings
Recognize current earnings
Recognize current earnings
Recognize current earnings
Recognize current earnings
After-tax earnings
Recognize foreign tax
& actual repatriation
tax
Recognize foreign tax
& expected repatriation
tax
Recognize foreign tax
Recognize
foreign tax on current earnings & actual repatriation tax on
current & prior earnings
Recognize
foreign tax on current earnings & actual
repatriation tax on current
earnings
Tax paid
Foreign tax + Repatriation tax
Foreign tax Foreign tax Foreign tax + Repatriation tax’
Foreign tax + Repatriation tax
Overall Relative Magnitude of Effects After-tax earnings
Middle
Middle
High
Low
Middle
Repatriation tax cost
Middle
Zero
Zero
High
High
Tax paid refers to the cash outflow for taxes on foreign earnings. Foreign tax refers to the foreign income tax paid to foreign taxing jurisdictions on foreign earnings. Repatriation tax refers to the residual U.S. income tax paid on foreign earnings upon repatriation (U.S. tax’ > U.S. tax). Current and prior earnings refer to total current period and prior period foreign earnings, respectively. After-tax earnings refer to the after-tax earnings of the U.S. consolidated entity. Repatriation tax cost is the residual U.S. tax due on repatriated foreign earnings.

42
FIGURE 2 Regression Variables
Variable Name Definition and Source (BEA unless otherwise noted) Dependent Variables Repatriations Current year repatriations from foreign affiliates scaled by current
year worldwide sales Low (High) Repatriations Current year repatriations from low (high) tax affiliates. Low
(high) tax affiliates are those where Affiliate Creditable Tax Rate is less than (greater than) 30 percent scaled by worldwide sales. Affiliate Creditable Tax Rate equals the aggregate foreign taxes paid on undistributed foreign earnings from the year the affiliate first enters the BEA sample or 1982, whichever is later, to the current year divided by undistributed pre-tax foreign earnings aggregated over the same period.
Variables of Interest Capital Market Pressure H1: Public H2: HighPre
Equals 1 if publicly-traded equity, 0 otherwise Equals 1 if the ratio of permanently reinvested earnings divided by total assets of low tax affiliates ≥ 1, 0 otherwise
RepCost An estimated of the U.S. tax the firm would owe if it repatriated all unremitted foreign earnings, computed as the U.S. statutory rate (35 percent) minus Affiliate Creditable Tax Rate. We estimate unremitted foreign earnings as the cumulative amount of foreign earnings minus dividends paid from the year the affiliate first enters the BEA sample or 1982, whichever is later.
Firm-Level Control Variables
Foreign Growth 3-yr historical foreign sales growth by country, industry, weighted by affiliate assets in country, industry
U.S. Growth 3-yr historical domestic sales growth by industry Size Natural logarithm of undistributed pre-tax foreign earnings Low (High) Size
Natural logarithm of undistributed pre-tax foreign earnings in low (high) tax affiliates
Lag Repatriations Lagged Low (High) Repatriations
Prior year repatriations scaled by prior year worldwide sales Prior year repatriations from low (high) tax affiliates scaled by prior year worldwide sales

43
FIGURE 2 CONT’D Regression Variables
U.S. Leverage Ratio of domestic short-term and long-term debt to domestic
equity Foreign Leverage Ratio of foreign short-term and long-term debt to foreign equity U.S. Interest Domestic interest paid divided by domestic short-term and long-
term debt Foreign Interest Foreign interest paid divided by foreign short-term and long-term
debt Foreign Cash Foreign cash scaled by current year worldwide sales %Foreign Sales Ratio of foreign sales to worldwide sales U.S. Loss An indicator variable equal to 1 if the parent reports a current
period domestic pre-tax loss, 0 otherwise Mandatory Dividend Country-level indicator variable equal to 1 if the country requires
that dividends are paid to shareholders, 0 otherwise - weighted by the number of affiliates in each type of country (La Porta et al. [1998]). Available at: http://www.economics.harvard.edu/faculty/shleifer/dataset)
Corruption Country-level variable ranging from 1 to 10 indicating high and low corruption, respectively, weighted by the number of affiliates in each type of country (La Porta et al. [1999]). Available at: http://www.economics.harvard.edu/faculty/shleifer/dataset).
Infrastructure Country-level variable ranging from 1 to 10 indicating low and high quality infrastructure, respectively, weighted by the number of affiliates in each type of country (La Porta et al. [1999]). Available at: http://www.economics.harvard.edu/faculty/shleifer/dataset)
Capital Control Country-level indicator variable equal to 1 if the country restricts firms’ ability to take funds out of the country, 0 otherwise, weighted by the number of affiliates in each type of country (IMF [2006]).
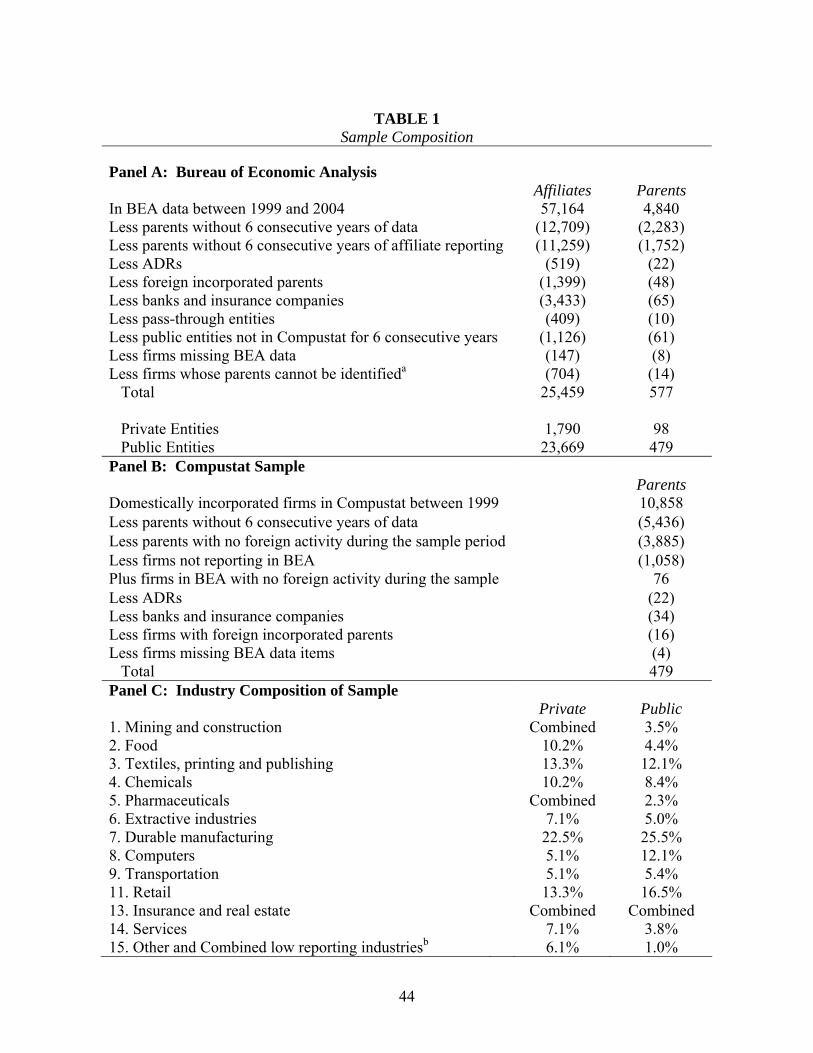
44
TABLE 1 Sample Composition
Panel A: Bureau of Economic Analysis
Affiliates Parents In BEA data between 1999 and 2004 57,164 4,840 Less parents without 6 consecutive years of data (12,709) (2,283) Less parents without 6 consecutive years of affiliate reporting (11,259) (1,752) Less ADRs (519) (22) Less foreign incorporated parents (1,399) (48) Less banks and insurance companies (3,433) (65) Less pass-through entities (409) (10) Less public entities not in Compustat for 6 consecutive years (1,126) (61) Less firms missing BEA data (147) (8) Less firms whose parents cannot be identifieda (704) (14) Total 25,459 577 Private Entities 1,790 98 Public Entities 23,669 479 Panel B: Compustat Sample Parents Domestically incorporated firms in Compustat between 1999 10,858 Less parents without 6 consecutive years of data (5,436) Less parents with no foreign activity during the sample period (3,885) Less firms not reporting in BEA (1,058) Plus firms in BEA with no foreign activity during the sample 76 Less ADRs (22) Less banks and insurance companies (34) Less firms with foreign incorporated parents (16) Less firms missing BEA data items (4) Total 479 Panel C: Industry Composition of Sample Private Public 1. Mining and construction Combined 3.5% 2. Food 10.2% 4.4% 3. Textiles, printing and publishing 13.3% 12.1% 4. Chemicals 10.2% 8.4% 5. Pharmaceuticals Combined 2.3% 6. Extractive industries 7.1% 5.0% 7. Durable manufacturing 22.5% 25.5% 8. Computers 5.1% 12.1% 9. Transportation 5.1% 5.4% 11. Retail 13.3% 16.5% 13. Insurance and real estate Combined Combined 14. Services 7.1% 3.8% 15. Other and Combined low reporting industriesb 6.1% 1.0%

45
TABLE 1 CONT’D
Panel D: Country Composition By Region Private Public
% of Affiliates % of Assets % of Affiliates % of Assets North America 13.26% 11.29% 6.43% 8.89% Central and South America 15.35% 20.85% 16.02% 14.13%
Europe 46.99% 56.00% 51.44% 59.79% Africa 1.85% 0.40% 2.97% 1.42% Middle East 1.33% 0.88% 1.43% 0.96% Asia 21.22% 10.59% 21.71% 14.82% Panel E: Top Countries Private Public
% of Affiliates % of Assets % of Affiliates % of Assets 1 UK UK UK UK 2 Canada Canada Canada Netherlands 3 Netherlands UK Caribbean Germany Canada 4 Germany Netherlands Netherlands Germany 5 Mexico Germany France Bermuda 6 France France Mexico Luxembourg 7 Japan Bermuda Japan Japan 8 Australia Switzerland Australia Ireland 9 Belgium Australia Italy Switzerland 10 Singapore Brazil Spain Belgium
a Includes four mutual companies, four firms that changed status during the sample period (i.e., public to private, foreign ownership to domestic ownership, etc.) and six firms whose parents we could not identify as domestic or foreign owned. b Any industries with less than five observations are combined with the “Other” category

46
TABLE 2 Descriptive Statistics
Private Firms N = 522
Low PRE Public Firms N = 2,322
High PRE Public Firms N = 333
Panel A: Regression Variables Variable Mean Med5 Std. Dev. Mean Med5 Std. Dev. Mean Med5 Std. Dev.
Repatriations (%) 0.83*** 0.00 2.35 0.71* 0.00 1.86 0.92 0.00 1.98 High Repatriations (%) 0.18*,### 0.00 0.72 0.30*** 0.00 0.86 0.27 0.00 0.79 Low Repatriations (%) 0.36### 0.00 1.04 0.16 0.00 0.62 0.26 0.00 0.67 RepCost (%) 10.26*,### 6.97 10.51 11.30 10.09 10.20 11.52 10.52 10.10 Foreign Growth (%) 7.07***,### 4.74 17.78 11.62*** 4.47 31.71 20.90 4.10 46.76 U.S. Growth (%) 4.73## 3.52 5.55 5.46 4.21 5.91 4.92 3.50 5.33 Size 11.70***,### 11.64 1.66 13.07*** 12.94 2.00 14.06 13.84 1.95 High Size 7.69***,### 10.38 5.33 10.22*** 11.67 4.93 12.26 12.73 3.58 Low Size 9.07***,### 10.92 4.85 11.19*** 12.40 4.64 12.87 13.24 3.43 U.S. Leverage (%) 0.60*** 0.32 1.64 0.73*** 0.38 1.84 1.37 0.42 3.74 Foreign Leverage (%) 2.16***,## 0.83 4.13 1.79*** 0.94 2.99 1.25 0.69 2.41 U.S. Interest (%) 7.46 5.34 12.11 8.05 5.46 12.05 7.83 6.02 10.32 Foreign Interest (%) 4.31# 3.63 6.20 5.16 3.23 10.35 4.85 3.00 9.63 Foreign Cash (%) 2.22***,### 0.92 4.00 3.32*** 1.38 5.63 4.86 2.14 9.63 %Foreign Sales (%) 28.38*** 24.32 20.09 29.82*** 27.60 19.76 35.77 33.20 19.27 U.S. Loss (%) 19.16 0.00 39.39 18.13 0.00 38.54 19.22 0.00 39.46 Mandatory Dividend 1.04***,### 0.00 3.49 1.84 0.00 4.03 1.81 0.14 2.52 Corruption 67.78# 70.56 26.17 65.94 67.57 19.87 66.35 66.62 13.90 Infrastructure 56.64# 58.46 23.71 54.82 56.43 18.16 55.07 55.41 13.82 Capital Control 4.71 0.00 11.77 5.34 0.00 10.67 5.21 0.00 7.60 Panel B: Comparable Tax Rate Estimates DFH Tax Rate (%) 27.50***,### 28.01 7.18 25.91 26.41 6.44 25.54 25.45 5.14 Current FTR (%) 24.60*** 20.43 21.94 25.92** 22.98 22.78 28.95 26.92 21.84 Affiliate Creditable Tax Rate (%)
29.53***,# 27.90 18.61 27.92 24.91 18.24 26.25 24.39 14.97
TABLE 2 CONT’D

47
Private Firms N = 522
Low PRE Public Firms N = 2,322
High PRE Public Firms N = 333
Panel C: BEA Descriptive Data Variable Mean Med5 Std. Dev. Mean Med5 Std. Dev. Mean Med5 Std.
Dev. Prof (%) 3.89*** 2.59 8.47 3.34*** 3.36 11.14 1.21 2.18 12.85Domestic Sales 1,878.21***,### 588.30 4,959.04 6,124.54 1,850.70 15,392.47 5,001.21 1,698.51 9,236 Foreign Sales 775.33***,### 151.44 2,865.00 3,118.92 528.33 12,588.02 3,381.00 683.13 7,988 Affiliates 9.08***,### 3.00 24.17 22.71** 8.00 49.01 28.58 13.00 38.16High Affiliates 2.15***,### 1.00 4.51 5.72*** 2.00 11.13 7.79 2.33 9.46Affiliates Indirectly-Owned (%)
11.48***,### 0.00 21.11 19.79*** 4.26 25.45 38.14 37.78 31.21
PRE/Low Affiliate Assets (%)
N/A N/A N/A 25.90*** 8.74 32.35 100.00 100.00 0.00
Affiliate RepDum (%) 14.66***,### 0.00 26.16 11.54 0.00 19.81 10.28 0.19 16.10Parent RepDum (%) 37.93***,### 0.00 48.57 45.05 0.00 49.76 49.55 16.67 50.07
This table reports firm attributes using data reported on the Bureau of Economic Analysis Survey Form 10, Form 11 and Form 577 from 1999 to 2004. See Section 3 for BEA Survey details. Private firms are parent-affiliate groups whose parents are privately owned as described in the Lexis Nexis Corporate Affiliations database. Public firms are parent-affiliate groups whose parents are listed on a U.S. stock exchange. Low PRE public firms are those where the ratio of PRE/Low Affiliate Assets < 1 (i.e., HighPre = 0). High PRE public firms are those where the ratio of PRE/Low Affiliate Assets ≥ 1 (i.e., HighPre = 1). Med5 or Median5 represents the average of the five median observations. We report all statistics at the parent level. DFH Tax Rate is the median of all affiliate tax rates for all U.S. affiliates operating in a country-year as described in Desai, Foley and Hines [2001]. Current FTR is current period foreign income taxes paid over foreign pre-tax income (i.e., foreign net income + foreign income taxes) for all affiliates in a group. Affiliate Creditable Tax Rate is the U.S. parent’s creditable taxes upon repatriation estimated as the average of the affiliates’ creditable tax rates. The affiliate’s creditable tax rates equal aggregate foreign taxes paid on undistributed foreign earnings from the year the affiliate first enters the BEA sample or 1982, whichever is later, to the current year divided by undistributed pre-tax foreign earnings aggregated over the same period. Prof is the profit margin for the aggregate parent-affiliate group (i.e., domestic net income + foreign net income/domestic sales + foreign sales). Domestic (Foreign) Sales are total domestic (foreign) sales (in millions). Affiliates is the total number of affiliates in a parent-affiliate group. High Affiliates is the total number of affiliates in a parent-affiliate group with a foreign tax credit rate of greater than or equal to 30% using Affiliate Creditable Tax Rate. Affiliates Indirectly-Owned is the ratio of affiliates whose direct ownership is less than 50 percent to the total number of affiliates with a parent-affiliate group. PRE/Low Affiliate Assets is the ratio of permanently reinvested earnings reported in the 10-K (not applicable to private sample) to total assets in low tax affiliates. Affiliate RepDum is the proportion of affiliates in a group that pay a dividend to the U.S. parent. Parent RepDum is the proportion of parents that repatriate from at least one of their foreign affiliates. All other variables are defined in Figure 2. *, **, *** (#, ##, ###) represents significant differences between the high PRE (low PRE) public firms at the 10%, 5% and 1% two-tailed level, respectively.
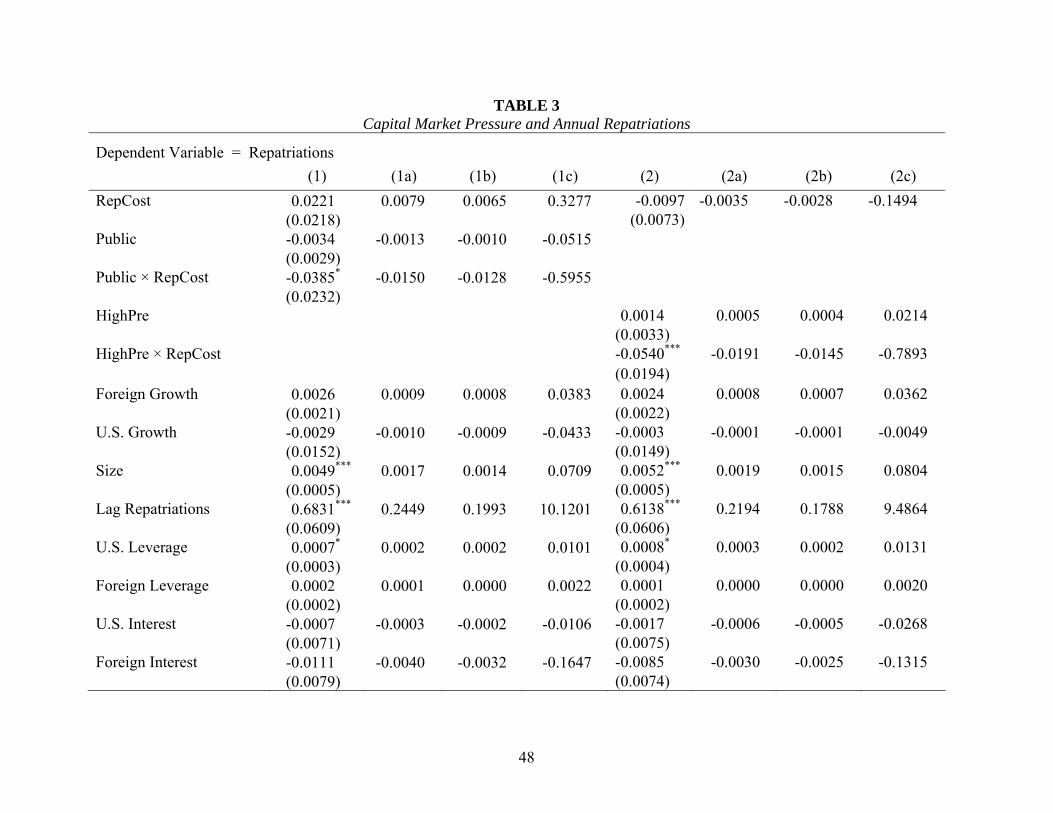
48
TABLE 3 Capital Market Pressure and Annual Repatriations
Dependent Variable = Repatriations (1) (1a) (1b) (1c) (2) (2a) (2b) (2c)
RepCost 0.0221 0.0079 0.0065 0.3277 -0.0097 -0.0035 -0.0028 -0.1494 (0.0218) (0.0073) Public -0.0034 -0.0013 -0.0010 -0.0515 (0.0029) Public × RepCost -0.0385* -0.0150 -0.0128 -0.5955 (0.0232) HighPre 0.0014 0.0005 0.0004 0.0214 (0.0033) HighPre × RepCost -0.0540*** -0.0191 -0.0145 -0.7893 (0.0194) Foreign Growth 0.0026 0.0009 0.0008 0.0383 0.0024 0.0008 0.0007 0.0362 (0.0021) (0.0022) U.S. Growth -0.0029 -0.0010 -0.0009 -0.0433 -0.0003 -0.0001 -0.0001 -0.0049 (0.0152) (0.0149) Size 0.0049*** 0.0017 0.0014 0.0709 0.0052*** 0.0019 0.0015 0.0804 (0.0005) (0.0005) Lag Repatriations 0.6831*** 0.2449 0.1993 10.1201 0.6138*** 0.2194 0.1788 9.4864 (0.0609) (0.0606) U.S. Leverage 0.0007* 0.0002 0.0002 0.0101 0.0008* 0.0003 0.0002 0.0131 (0.0003) (0.0004) Foreign Leverage 0.0002 0.0001 0.0000 0.0022 0.0001 0.0000 0.0000 0.0020 (0.0002) (0.0002) U.S. Interest -0.0007 -0.0003 -0.0002 -0.0106 -0.0017 -0.0006 -0.0005 -0.0268 (0.0071) (0.0075) Foreign Interest -0.0111 -0.0040 -0.0032 -0.1647 -0.0085 -0.0030 -0.0025 -0.1315 (0.0079) (0.0074)

49
TABLE 3 CONT’D
(1) (1a) (1b) (1c) (2) (2a) (2b) (2c) Foreign Cash -0.0067 -0.0024 -0.0020 -0.0998 -0.0121 -0.0043 -0.0035 -0.1871 (0.0143) (0.0113) %Foreign Sales 0.0162*** 0.0058 0.0047 0.2395 0.0137*** 0.0049 0.0040 0.2122 (0.0048) (0.0052) U.S. Loss -0.0037** -0.0013 -0.0011 -0.0538 -0.0043*** -0.0015 -0.0012 -0.0652 (0.0016) (0.0017) Mandatory Dividend 0.0381** 0.0136 0.0111 0.5640 0.0421*** 0.0150 0.0123 0.6505 (0.0181) (0.0193) Corruption -0.0006 -0.0002 -0.0002 -0.0083 -0.0088 -0.0032 -0.0026 -0.1364 (0.0111) (0.0107) Infrastructure -0.0058 -0.0021 -0.0017 -0.0870 0.0069 0.0025 0.0020 0.1072 (0.0126) (0.0114) Capital Control -0.0133 -0.0048 -0.0039 -0.1966 -0.0098 -0.0035 -0.0028 -0.1511 (0.0093) (0.0103) Intercept -0.0668*** -0.0239 -0.0195 -0.9896 -0.0759*** -0.0271 -0.0221 -1.1728 (0.0078) (0.0084) Scale 0.0252*** 0.0241*** (0.0015) (0.0015) Year Fixed Effects Yes Yes Industry Fixed Effects Yes Yes Log Likelihood 2461.09 2198.42 N 3,177 2,655 *, **, *** significant at the 10%, 5% and 1% two-tailed level, respectively. Robust standard errors are reported in parentheses. Columns (1) and (2) report coefficients from the tobit estimation. Columns (1a) and (2a) report the marginal effect of each variable on the unconditional expected value of Repatriations. Columns (1b) and (2b) report the marginal effect of each variable on the expected value of Repatriations conditional on being uncensored. Columns (1c) and (2c) report the marginal effect of each variable on the probability uncensored. See the Appendix for more details on these calculations. See Figure 2 for variable definitions.
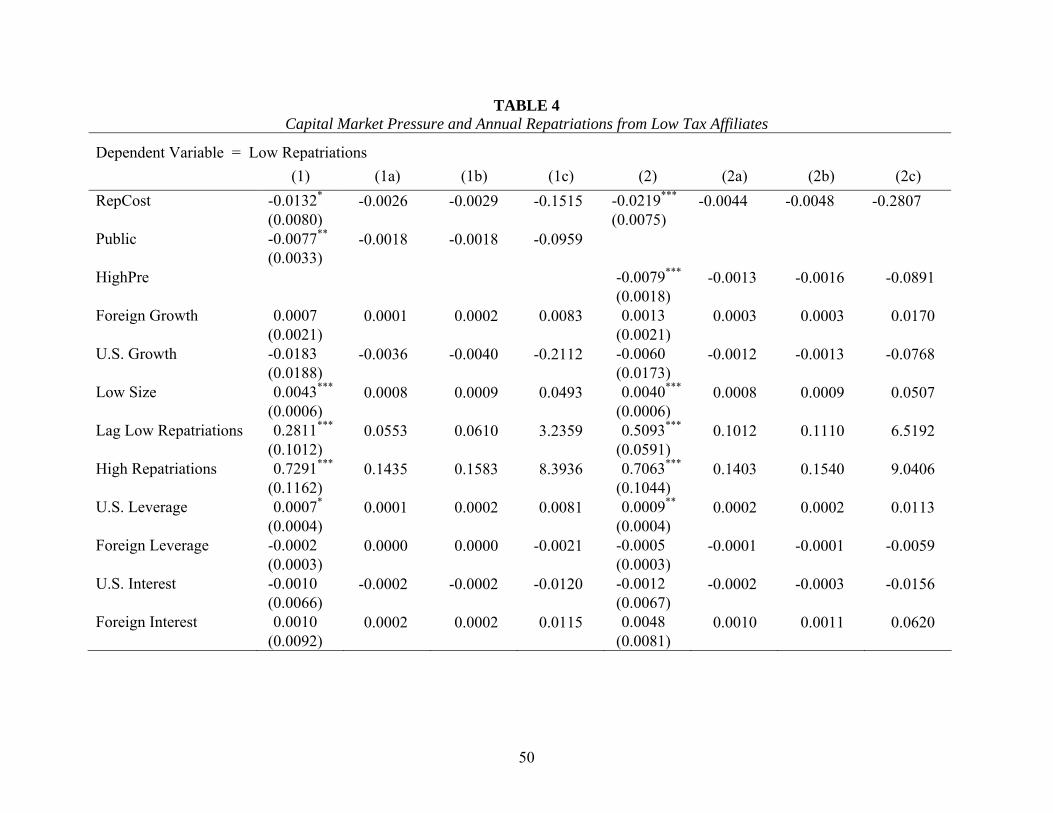
50
TABLE 4 Capital Market Pressure and Annual Repatriations from Low Tax Affiliates
Dependent Variable = Low Repatriations (1) (1a) (1b) (1c) (2) (2a) (2b) (2c)
RepCost -0.0132* -0.0026 -0.0029 -0.1515 -0.0219*** -0.0044 -0.0048 -0.2807 (0.0080) (0.0075) Public -0.0077** -0.0018 -0.0018 -0.0959 (0.0033) HighPre -0.0079*** -0.0013 -0.0016 -0.0891 (0.0018) Foreign Growth 0.0007 0.0001 0.0002 0.0083 0.0013 0.0003 0.0003 0.0170 (0.0021) (0.0021) U.S. Growth -0.0183 -0.0036 -0.0040 -0.2112 -0.0060 -0.0012 -0.0013 -0.0768 (0.0188) (0.0173) Low Size 0.0043*** 0.0008 0.0009 0.0493 0.0040*** 0.0008 0.0009 0.0507 (0.0006) (0.0006) Lag Low Repatriations 0.2811*** 0.0553 0.0610 3.2359 0.5093*** 0.1012 0.1110 6.5192 (0.1012) (0.0591) High Repatriations 0.7291*** 0.1435 0.1583 8.3936 0.7063*** 0.1403 0.1540 9.0406 (0.1162) (0.1044) U.S. Leverage 0.0007* 0.0001 0.0002 0.0081 0.0009** 0.0002 0.0002 0.0113 (0.0004) (0.0004) Foreign Leverage -0.0002 0.0000 0.0000 -0.0021 -0.0005 -0.0001 -0.0001 -0.0059 (0.0003) (0.0003) U.S. Interest -0.0010 -0.0002 -0.0002 -0.0120 -0.0012 -0.0002 -0.0003 -0.0156 (0.0066) (0.0067) Foreign Interest 0.0010 0.0002 0.0002 0.0115 0.0048 0.0010 0.0011 0.0620 (0.0092) (0.0081)
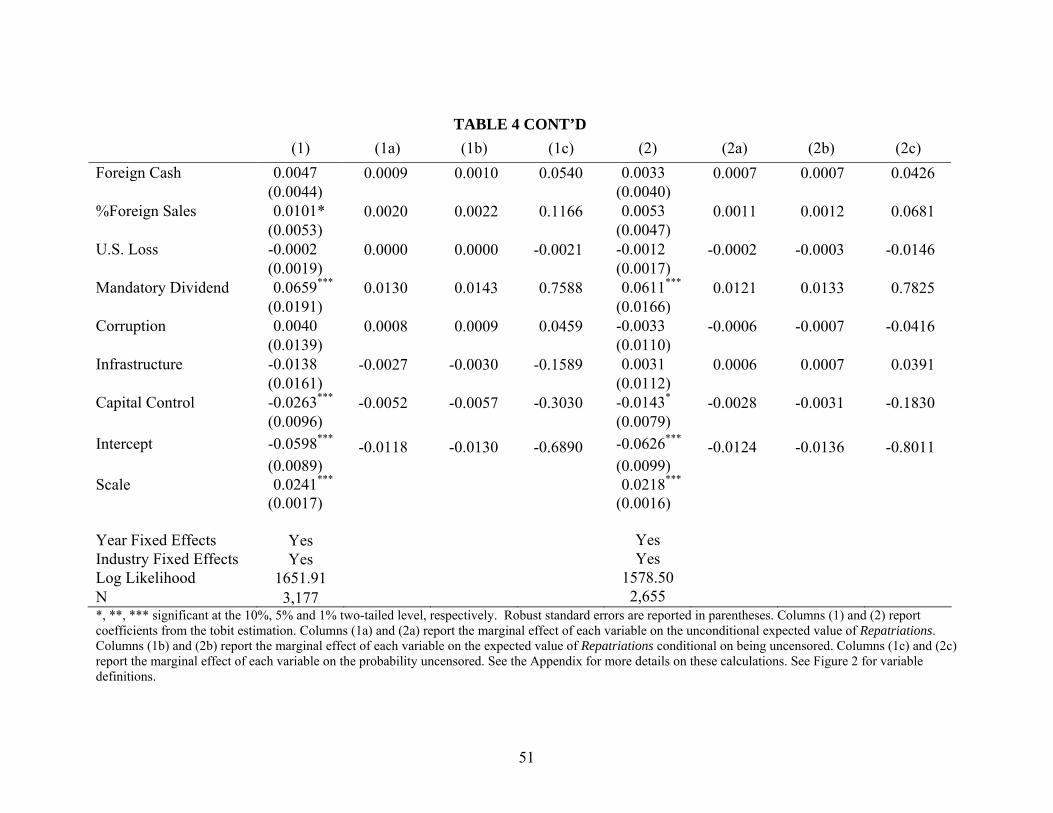
51
TABLE 4 CONT’D
(1) (1a) (1b) (1c) (2) (2a) (2b) (2c) Foreign Cash 0.0047 0.0009 0.0010 0.0540 0.0033 0.0007 0.0007 0.0426 (0.0044) (0.0040) %Foreign Sales 0.0101* 0.0020 0.0022 0.1166 0.0053 0.0011 0.0012 0.0681 (0.0053) (0.0047) U.S. Loss -0.0002 0.0000 0.0000 -0.0021 -0.0012 -0.0002 -0.0003 -0.0146 (0.0019) (0.0017) Mandatory Dividend 0.0659*** 0.0130 0.0143 0.7588 0.0611*** 0.0121 0.0133 0.7825 (0.0191) (0.0166) Corruption 0.0040 0.0008 0.0009 0.0459 -0.0033 -0.0006 -0.0007 -0.0416 (0.0139) (0.0110) Infrastructure -0.0138 -0.0027 -0.0030 -0.1589 0.0031 0.0006 0.0007 0.0391 (0.0161) (0.0112) Capital Control -0.0263*** -0.0052 -0.0057 -0.3030 -0.0143* -0.0028 -0.0031 -0.1830 (0.0096) (0.0079) Intercept -0.0598*** -0.0118 -0.0130 -0.6890 -0.0626*** -0.0124 -0.0136 -0.8011 (0.0089) (0.0099) Scale 0.0241*** 0.0218*** (0.0017) (0.0016) Year Fixed Effects Yes Yes Industry Fixed Effects Yes Yes Log Likelihood 1651.91 1578.50 N 3,177 2,655 *, **, *** significant at the 10%, 5% and 1% two-tailed level, respectively. Robust standard errors are reported in parentheses. Columns (1) and (2) report coefficients from the tobit estimation. Columns (1a) and (2a) report the marginal effect of each variable on the unconditional expected value of Repatriations. Columns (1b) and (2b) report the marginal effect of each variable on the expected value of Repatriations conditional on being uncensored. Columns (1c) and (2c) report the marginal effect of each variable on the probability uncensored. See the Appendix for more details on these calculations. See Figure 2 for variable definitions.

52
TABLE 5 Descriptive Statistics for Quarterly Repatriations
Panel A: Univariate Analysis of Public versus Private Quarterly Repatriation Behavior Repatriation
Indicator Repatriations QTR Prof High
Repatriations Low
Repatriations Private Firms N=522 QTR1 6.18**,### 0.15## 7.97*** 0.04** 0.08 QTR2 7.03**,### 0.17## 9.13***,## 0.04** 0.11**.### QTR3 5.16 0.13 9.37*** 0.02**,# 0.10 QTR4 7.64**,### 0.20* 8.84*** 0.03***,## 0.15 Public/Low PRE Firms N=2,322 QTR1 4.19 0.11 6.13*** 0.03*** 0.07 QTR2 4.47 0.12 6.61*** 0.04*** 0.07 QTR3 4.69 0.12* 7.78*** 0.03*** 0.08 QTR4 5.17 0.20*** 6.87*** 0.04*** 0.14 Public/High PRE Firms N=333 QTR1 3.83 0.14 0.93 0.07 0.05 QTR2 4.05 0.13 -0.71 0.06 0.06 QTR3 4.46 0.17 1.10 0.07 0.07 QTR4 4.87 0.30 -0.64 0.09 0.17 Panel B: Descriptive Statistics for Q4RepPct Mean Median5 Std. Dev. Private Firms N=522 10.51%***,### 0.00% 25.38% Public/Low PRE Firms N=2,322 14.04% 0.00% 27.44% Public/High PRE Firms N=333 15.53% 0.00% 27.56% This table reports descriptive data for quarterly repatriations using data reported on the Bureau of Economic Analysis Survey Form 577 from 1999 to 2004. See Section 3 of the paper for BEA Survey details. We report statistics of the affiliated group (i.e., the U.S. parent and foreign affiliates). Repatriation Indicator is equal to 1 if an affiliate repatriates foreign earnings during the quarter; zero otherwise. QTR Prof is foreign quarterly net income scaled by one fourth of foreign annual sales. Q4RepPct is defined as the ratio of repatriations in the fourth quarter to the sum of repatriations in all four quarters. See Figure 2 for definitions of all other variables. *, **, *** (#, ##, ###) represents significant differences between the high PRE(low PRE) public firms at the 10%, 5% and 1% two-tailed level, respectively.

53
TABLE 6 Capital Market Pressure and the Timing of Repatriations Across Quarters
Dependent Variable = Q4RepPct (1) (1a) (2) (2a)
RepCost 0.5991 0.1587 -0.4168** -0.1111 (0.4620) (0.2023) Public -0.0328 -0.0089 (0.0809)
Public × RepCost -1.1206*** -0.3889 (0.5056)
HighPre 0.0363 0.0100 (0.0693) HighPre × RepCost -0.8963** -0.2560 (0.4713) QTR Prof 0.0802 0.0212 0.0916 0.0244 (0.0508) (0.0578) Size 0.1444*** 0.0383 0.1476*** 0.0394 (0.0097) (0.0103) Intercept -1.9567*** -0.5185 -2.0314*** -0.5419 (0.1700) (0.1858)
Scale 0.5131*** 0.4858*** (0.0214) (0.0219) Year Fixed Effects Yes Yes Industry Fixed Effects Yes Yes Log Likelihood -1580.74 -1289.92 N 3,177 2,655 *, **, *** significant at the 10%, 5% and 1% two-tailed level, respectively. Robust standard errors are reported in parentheses. The dependent variable, Q4RepPct, equals the ratio of repatriations in the fourth quarter to the sum of repatriations in all four quarters. QTR Prof is foreign quarterly net income scaled by one fourth of foreign annual sales. See Figure 2 for definitions of all other variables. Columns (1) and (2) report coefficients from the tobit estimation. Columns (1a) and (2a) report the marginal effect of each variable on the unconditional expected value of Repatriations. See the Appendix for more details on these calculations.
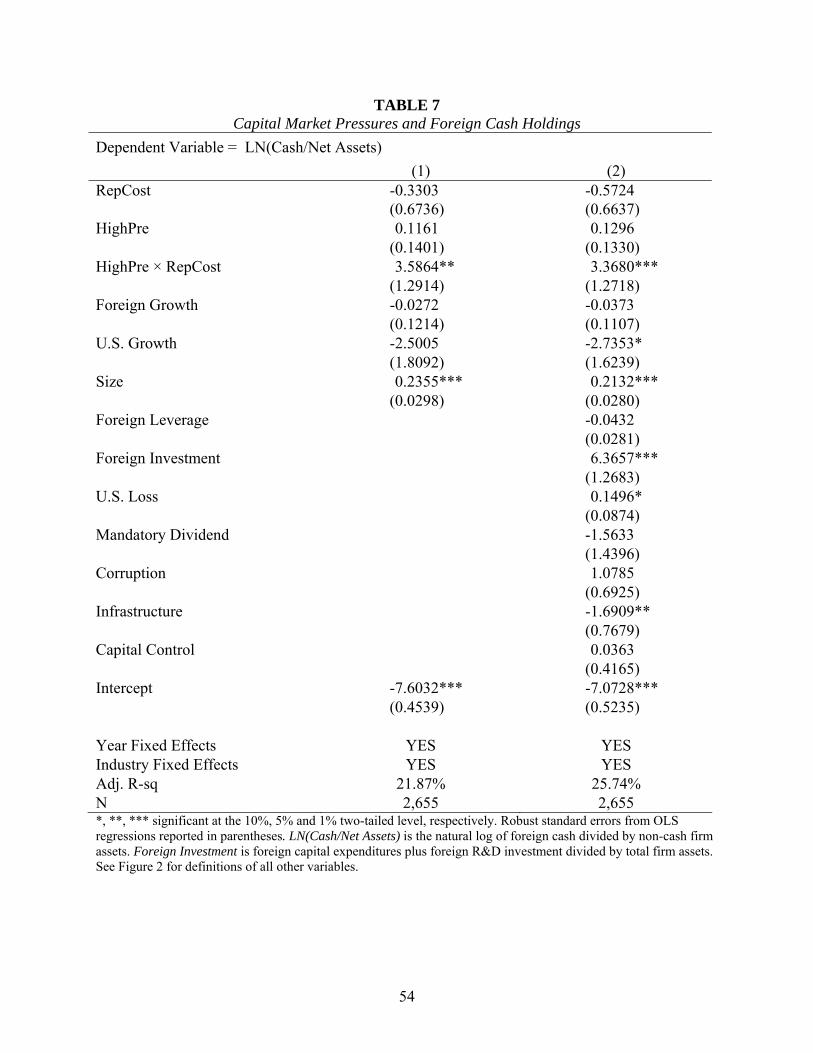
54
TABLE 7 Capital Market Pressures and Foreign Cash Holdings
Dependent Variable = LN(Cash/Net Assets) (1) (2) RepCost -0.3303 -0.5724 (0.6736) (0.6637) HighPre 0.1161 0.1296
(0.1401) (0.1330) HighPre × RepCost 3.5864** 3.3680***
(1.2914) (1.2718) Foreign Growth -0.0272 -0.0373
(0.1214) (0.1107) U.S. Growth -2.5005 -2.7353*
(1.8092) (1.6239) Size 0.2355*** 0.2132***
(0.0298) (0.0280) Foreign Leverage -0.0432
(0.0281) Foreign Investment 6.3657***
(1.2683) U.S. Loss 0.1496*
(0.0874) Mandatory Dividend -1.5633
(1.4396) Corruption 1.0785
(0.6925) Infrastructure -1.6909**
(0.7679) Capital Control 0.0363
(0.4165) Intercept -7.6032*** -7.0728***
(0.4539) (0.5235)
Year Fixed Effects YES YES Industry Fixed Effects YES YES Adj. R-sq 21.87% 25.74% N 2,655 2,655 *, **, *** significant at the 10%, 5% and 1% two-tailed level, respectively. Robust standard errors from OLS regressions reported in parentheses. LN(Cash/Net Assets) is the natural log of foreign cash divided by non-cash firm assets. Foreign Investment is foreign capital expenditures plus foreign R&D investment divided by total firm assets. See Figure 2 for definitions of all other variables.

55
TABLE 8 Alternate Proxy for Capital Market Pressure
Dependent Variable = Repatriations (1) (1a) (2) (2a) RepCost -0.0241*** -0.0087 -0.0140** -0.0050 (0.0070) (0.0070) ETRHit -0.0026*** -0.0009 -0.0028*** -0.0010
(0.0010) (0.0010) PreDum 0.0025 0.0009 0.0020 0.0007
(0.0016) (0.0016) Foreign Growth 0.0228*** 0.0082 0.0017 0.0006
(0.0060) (0.0022) U.S. Growth -0.0029 -0.0010 0.0012 0.0004
(0.0032) (0.0150) Size 0.0055*** 0.0020 0.0050*** 0.0018
(0.0005) (0.0005) Lag Repatriations 0.6186*** 0.2218 0.6173*** 0.2204 (0.0626) (0.0596) U.S. Leverage 0.0008*** 0.0003 (0.0004) Foreign Leverage 0.0001 0.0004
(0.0002) U.S. Interest -0.0007 -0.0003
(0.0077) Foreign Interest -0.0080 -0.0029 (0.0077) Foreign Cash -0.0128 -0.0046 (0.0147) %Foreign Sales 0.0145*** 0.0052 (0.0053) U.S. Loss -0.0041** -0.0014
(0.0017) Mandatory Dividend 0.0428** 0.0153
(0.0191) Corruption -0.0105 -0.0037
(0.0108) Infrastructure 0.0090 0.0032
(0.0.0114) Capital Control -0.0097 -0.0034
(0.0105) Intercept -0.0781*** -0.0280 -0.0755*** -0.0270 (0.0078) (0.0084)

56
TABLE 8 CONT’D
(1) (1a) (2) (2a)
Scale 0.0241*** 0.0242***
(0.0005) (0.0015) Year Fixed Effects YES YES Industry Fixed Effects YES YES Log Likelihood 2193.22 2195.46 N 2,655 2,655 *, **, *** significant at the 10%, 5% and 1% two-tailed level, respectively. Robust standard errors from OLS regressions reported in parentheses. Columns (1a) and (2a) report the marginal effect of ach variable on the unconditional expected value of Repatriations. ETRHit is the estimated impact on the firm’s ETR if all PRE was repatriated. It is defined as the estimated incremental tax due upon repatriation (PRE*0.35 less [(PRE/UFE in low tax affiliates)*accumulated taxes paid in low-tax affiliates]) over pre-tax book income (Compustat PI). See Figure 2 for definitions of all other variables.