is there a visual dominance in political communication ... · communication in the process of...
TRANSCRIPT

Journal of Communication ISSN 0021-9916
ORIGINAL ARTICLE
Is There a Visual Dominance in PoliticalCommunication? How Verbal, Visual,and Vocal Communication Shape Viewers’Impressions of Political CandidatesFriederike Nagel1, Marcus Maurer2, & Carsten Reinemann3
1 Institut fuer Publizistik, Johannes Gutenberg-Universitaet, Mainz, Germany2 Institut fuer Kommunikationswissenschaft, Friedrich-Schiller-Universitaet, Jena, Germany3 Institut fuer Kommunikationswissenschaft und Medienforschung, Ludwig-Maximilians-Universitaet,Muenchen, Germany
On the basis of a televised debate in the 2005 German national election, this study comparesthe influence of verbal, visual, and vocal communication on viewers’ immediate impressionsof political candidates by using an innovative research design. A second-by-second contentanalysis of 17 verbal, visual, and vocal message elements is combined with a second-by-second analysis of viewers’ immediate impressions using continuous response measurement(CRM). Findings show that viewers’ immediate impressions are mainly influenced byverbal communication, especially the issues discussed and the argumentative structure used.In contrast to that, the effect of nonverbal communication is far smaller. The causes andimplications of these findings are discussed.
doi:10.1111/j.1460-2466.2012.01670.x
Politicians, consultants, and journalists share the assumption that it is mainly thenonverbal elements of communication that influence audiences’ perceptions ofpolitical leaders. This notion was driven by John F. Kennedy’s debate victory over apale and unshaved Richard Nixon in 1960 and by Mehrabian and Ferris’ (1967) often-cited rule that 55% of impression formation is based on visual cues, 38% on vocal cues,and only 7% on the verbally transmitted content of a message. On the other hand,the number of empirical studies investigating the role of nonverbal communicationin impression formation during the last decades is very small. Consequently, thereis not much empirical evidence for a visual dominance in political communication.Therefore, the aim of this study is to investigate the role of verbal, visual, and vocalcommunication in the process of political impression formation. First, a model offactors influencing viewers’ impressions of political candidates is developed. Second,
Corresponding author: Marcus Maurer; e-mail: [email protected]
Journal of Communication 62 (2012) 833–850 © 2012 International Communication Association 833

Visual Dominance in Political Communication F. Nagel et al.
this model is tested in the context of the televised debate in the 2005 German nationalelection with an innovative research design.
Impact of verbal, visual, and vocal communication on impression formation
Generally, audiovisual messages combine a verbal, a visual, and a vocal channel of com-munication. In each channel various individual message elements are conveyed. Hence,we can assume that a channel of communication shapes impressions in case it conveysmessage elements that shape impressions. Theories from political science, communi-cation science, psychology, and linguistics suggest that three categories of message ele-ments influence voters’ impressions of political candidates: verbal, vocal, and visual.
Verbal communicationThe issues speakers talk about represent one basic category in the analysis of thepersuasive impact. Issue ownership theory suggests a close link between politicalparties and certain issues (Petrocik, Benoit, & Hansen, 2004). Therefore, issuescan be viewed as shortcuts used by the audience for evaluating a candidate. Onthe one hand, candidates might leave better impressions when talking about issuesowned by their parties. On the other hand, and more simple, candidates might leavebetter impressions just because they talk about issues on which they agree with themajority of their audience. Moreover, it might be important which concrete subjectsthe candidates address when they talk about a certain issue, that is, their personalexperience with it or respective policy plans.
A second category of verbal communication is argumentative strategy. Its ele-ments are object and tone, which in their combination constitute different types ofpolitical statements. Usually, office-holders prefer acclaims (i.e., speaking positivelyabout oneself) over attacks (i.e., speaking negatively about the opponent), whereaschallengers attack more frequently (Benoit, 2007). Regarding the effect of tone, thenegativity effect proposes that negative information is weighted disproportionatelyhigh when compared to equidistantly valenced positive information (Kellermann,1989). This suggests that attacks should be especially successful. However, empiricalstudies show that attacks polarize the audience and, therefore, do not necessarilylead to better impressions on the aggregate level (Reinemann & Maurer, 2005). Inaddition, the context of acclaims and attacks might make a difference. Here, studieshave shown that announcing own plans, in general, may be more effective thancalling for the action of others (Reinemann & Maurer, 2005).
A final category is the use of rhetoric. The use of evidence (numbers, historicalfacts, etc.) has been found to persuade the audience by highlighting the speaker’scredibility (Reinard, 1988). However, too frequent use of evidence might lead tonegative perceptions of the speaker because he is perceived as a ”small mindedtechnocrat” (Levasseur & Dean, 1996, p. 138). Also emotional appeals have beenshown to enhance the persuasive power of a message. This holds true for negativeemotions like fear as well as for positive emotions like pride (Nabi, 2002). Another
834 Journal of Communication 62 (2012) 833–850 © 2012 International Communication Association
F. Nagel et al. Visual Dominance in Political Communication
rhetorical strategy is the use of commonplaces. Politicians speaking vaguely about theirown plans generate almost unanimous support as the recipients usually assimilatevague positions to their own opinions (Williams, 1980; Reinemann & Maurer, 2005).Finally, on the level of language construction various classical rhetorical elements canexert an influence on the audience, mainly by enhancing the perceptions of a speaker’scompetence. This has been shown, for example, for rhetorical questions (Zillmann,1972), parallelisms (Hosman, 2002), and metaphors (Sopory & Dillard, 2002).
On the basis of these considerations, we hypothesize that viewers’ impressions ofpolitical candidates are positively affected when they talk about issues linked to theirparty (H1); by talking about own plans (H2); by attacks on the opponent (H3); by theuse of evidence (H4); emotional appeals (H5); commonplaces (H6); and rhetoricalelements like metaphors, rhetorical questions, and parallelisms (H7).
Visual communicationOut of the several forms of dynamic elements of visual communication gaze, smile,and gestures seem to be especially important in impression formation and persuasion.Gaze can be regarded as supporting persuasion because it communicates empathy,closeness, or trustworthiness (Burgoon, Dunbar, & Segrin, 2002). However, gazecan also communicate dominance (Thayer, 1969) and therefore reduce perceivedsympathy. Smiles are generally regarded as positive. They convey sympathy andtrust and smiling speakers are often even perceived as persuasive (Imada & Hakel,1977). Gestures communicate self-assurance and dominance (Burgoon et al., 2002).Generally, speakers that use gestures are perceived as more persuasive (Mehrabian &Williams, 1969). We hypothesize that viewers’ impressions of political candidates arepositively affected by direct gaze (H8), smile (H9), and gestures (H10).
Vocal communicationFinally, vocal communication can stimulate attributions or associations amonglisteners (Areni & Sparks, 2005). Pitch indicates whether a voice is perceived as highor low. Voices with low pitches are often perceived as more credible (Gelinas-Chebat &Chebat, 1992; Gregory & Gallagher, 2002). Intensity describes the speaker’s volume. Acalm conversation usually occurs on a sound level around 60 decibel (db); loud calling75 db. Studies show that both high and low intensity can increase persuasiveness(Gelinas-Chebat & Chebat, 1992; Gelinas-Chebat, Chebat, & Vaninsky, 1996). Afinal factor is speech rate. Generally, a speech rate slightly above the average (4.4–5.9syllables per second) leads to more favorable impressions—especially regardingtrustworthiness and competence (Apple, Streeter, & Krauss, 1979). We thereforehypothesize that viewers’ impressions of political candidates are positively affectedby lower pitches (H11), higher volume (H12), and a faster speech rate (H13).
Comparing the impact of verbal, visual, and vocal communication
Thus far, we discussed which message elements might affect viewers’ impressionsof political candidates. Another important question regards the importance of
Journal of Communication 62 (2012) 833–850 © 2012 International Communication Association 835

Visual Dominance in Political Communication F. Nagel et al.
the different communication channels. Theories from at least three fields of researchsuggest that visual communication may be most important: First, according to thefindings of neuroscience, the brain perceives, stores, and processes verbal and visualinformation mainly on distinct routes and with distinct mechanisms. When a visualand an auditory stimulus occur at the same time, the visual elements dominate percep-tion (Van Damme, Crombez, & Spence, 2009). Visual information is processed muchquicker than verbal: While it takes about half a second (500 milliseconds) to translatesensing (hearing, smelling, touch) into conscious awareness of these stimuli (Libet,1991), faces are identified as faces after 47 milliseconds (Grabe & Bucy, 2009, p. 13)and known faces are recognized after 170 milliseconds (Fiske & Taylor, 2008, p. 72).This high-speed information processing can be explained with the processing routevisual information takes: It is sent directly from the thalamus to the amygdala, theoriginator of affective reactions, without passing through consciousness (Barry, 2005).
Second, Paivio’s Dual Coding Theory (DCT) is often cited to support theprepotency of visuals. The DCT explains why visual information is generally betterremembered and retrieved than verbal. According to the theory, visual informationis stored in two systems—the visual system and the verbal system—whereas verbalinformation is stored in the verbal system only (Paivio, 2007). Nevertheless, DCTcannot serve to explain the impact of visual information in political candidates’ publicspeeches because it explains processing and retrieval of verbal and visual informationwith congruent semantic content only. However, in political speeches this assumptiondoes not apply because usually there is no semantic connection between what is seen(speakers) and what is heard (statements).
Third, according to Dual-Process-Models of information processing the relativeimportance of the various types of cues depends on the conditions under whichrecipients receive messages. For example, the Elaboration Likelihood Model (ELM)assumes that recipients use different routes of information processing. Recipients whoare highly involved with the issues discussed use systematic information processing.It is analytic, exhaustive, requires much processing capacity and often relies on theverbal semantic content of a message. Recipients with low involvement rather useheuristic information processing. It relies on schemes, rules (heuristics), cues, andinferences, requires less processing capacity and relies on nonverbal (visual) elementsto a greater extent. This suggests that verbal information will be more important underhigh-involvement conditions, whereas visual information will be more important inlow-involvement situations (Petty, Cacioppo, & Schumann, 1983).
Three experimental research designs have been used in order to compare therelative impact of verbal and nonverbal communication in impression formation.In the first type, a group of viewers are shown a short silent video clip of apolitician’s speech (video-only version). Afterward, viewers are asked to indicatetheir impressions of the candidate. The fact that viewers form impressions only onthe basis of short bits of visual information, then, is regarded as an indication of strongeffects of visual communication (Frey, 1999). Studies of the second type comparethe impressions of subjects exposed to a politician’s public speech in an audiovisual
836 Journal of Communication 62 (2012) 833–850 © 2012 International Communication Association

F. Nagel et al. Visual Dominance in Political Communication
versus an audio-only version. In this case, differences in impressions can clearly betraced back to the lack of visual signals. Such differences have been found in severalstudies on televised debates and political talk-shows, for example, in the United States(McKinnon, Tedesco, & Kaid, 1993; Druckman, 2003) and Germany (Holtz-Bacha,Roessler, & Lessinger, 2005; Haumer & Donsbach, 2009). While both types of studiesgive a clear hint that visual information is important, they do not tell whether it isdominant when verbal and visual information is presented simultaneously.
Therefore, studies of the third type compare the impressions of subjects exposedto a politician’s public speech in an audiovisual versus an audio-only versus a video-only version. These studies provide useful information about the relative effects ofverbal and visual communication by comparing the differences arising from the lackof verbal versus visual signals compared to the full audiovisual version. Investigatinga Dole versus Mondale debate with such a design, Krauss, Apple, Morency, Wenzel,and Winton (1981) found that semantic content was more important than visualinformation. In their study on a Reagan versus Mondale debate, Patterson, Churchill,Burger, and Powell (1992) came to the same conclusion for Mondale but not forReagan. In contrast, in a study by Sullivan and Masters (1988) mainly visual elementscaused opinion changes about politicians. Finally, in a recent study on a Germanregional televised debate using continuous response measurement (CRM), Maurer(2009) found that viewer’s impressions were guided by visual information only inthe first 30 seconds. Later, there was a clear dominance of verbal information.
All in all, several theoretical approaches suggest that impression formation isoften dominated by visual communication. However, empirical research does notyield a clear picture. This discrepancy may be caused by two shortcomings ofexperimental research designs. First, they separate verbal and visual communicationin an artificial way. For example, respondents watching an audio-only versionof a politician’s speech may also perceive the verbal content differently whencompared to respondents watching an audiovisual version. Second, the impactof vocal communication can hardly be separated from the impact of semanticcontent except by using an artificial content-filtered speech version. As a result, therelative impact of vocal communication remains unclear. Consequently, we pose thefollowing research question (RQ1): Which channel of audio-visual messages (verbal,visual, or vocal) affects viewers’ impressions of political candidates most?
Method
Generally, this study aims at analyzing the relative impact of different messageelements and communication channels on viewers’ impressions of political candidatesin a natural setting. Therefore, a new and innovative research design is applied. Itcombines a second-by-second content analysis of the televised debate in the 2005German National Election with a second-by-second CRM-analysis. The 2005 televiseddebate between Gerhard Schroeder (Social Democratic Party, incumbent) and AngelaMerkel (Christian Democratic Party, challenger) was broadcast on 4th September
Journal of Communication 62 (2012) 833–850 © 2012 International Communication Association 837

Visual Dominance in Political Communication F. Nagel et al.
(2 weeks before the election) by the four major German TV channels. While there wasno studio audience, about 21 million (more than a fourth of the German population)watched the debate on television. Four journalists alternately asked questions tothe candidates. Discussions between candidates were not allowed. Candidates werestanding behind small desks. The debate was clearly dominated by one cameraperspective: In about 80% of the debate time only the speaking candidate was visible.Extreme close-ups were not allowed. Due to the length of the format (about 90minutes) we expected a variety of message elements to appear in sufficient frequencyto analyze their impact statistically.
Design and proceduresViewers’ immediate impressions during the debate were measured using CRManalysis. The relevance of debate viewers’ immediate impressions has been proven inseveral studies showing that these reactions strongly influence postdebate opinions(Reinemann & Maurer, 2005). For the CRM study, 72 participants were recruitedusing newspaper articles in the local press. Subjects were offered 25 EUR for theirparticipation. As more subjects applied than seats were available, they were selectedusing quota sampling (political predispositions, educational levels, gender, and age).On the day of the debate, subjects were introduced into the operating of the CRMhandhelds and practiced their usage with a politically neutral program. They receivedan oral and a written instruction asking them to continuously give their impressionsof the debate that might be caused by verbal, visual, or vocal message elements. Thehandheld’s scale ranged from ‘‘1’’ to ‘‘7,’’ with ‘‘4’’ indicating the neutral middle.Sliding the control dial towards ‘‘1’’ indicated a good impression of Schroeder or abad impression of Merkel. The more a respondent shifted the slide control towards‘‘1,’’ the stronger was his/her good impression of Schroeder/bad impression ofMerkel. Vice versa, sliding the control dial towards ‘‘7’’ indicated a good impressionof Merkel or a bad impression of Schroeder (for a validation of these measures seeMaier, Maurer, Reinemann, & Faas, 2007). During the debate a computer collectedthe handhelds’ data in every second (5.600 data points).
Debate content was analyzed using a second-by-second quantitative contentanalysis. The analysis included 17 verbal, visual, and vocal message elements: theissue a candidate was speaking about, the subject, the object of reference, the tone, thecontext, the use of evidence, emotional appeals, commonplaces, metaphors, rhetoricalquestions and parallelisms (verbal communication), direction of gaze, smile, gestures(visual communication), intensity, pitch, and speech rate (vocal communication). Inaddition, the candidate speaking and the candidate visible were coded. Most verbaland visual message elements were coded on a nominal scale and, for further analysis,transformed into 50 dummy variables. In each case, the coding of a message elementstarted in the first second the appearance of the message element became obvious. Forexample, in a statement like ‘‘We have to reduce unemployment’’ the issue employmentmarket was coded beginning with the word ‘‘unemployment’’ and retained until thespeaker switched to another issue. Argumentative strategies (acclaims, attacks, and
838 Journal of Communication 62 (2012) 833–850 © 2012 International Communication Association
F. Nagel et al. Visual Dominance in Political Communication
their opposites) were later modeled as interactions between objects of reference andtone. The analysis was done by five trained coders using a time-coded video versionof the debate. Intercoder reliability (Krippendorff’s α for nominal variables) rangedbetween .77 (tone) and .98 (speaker). Two elements of vocal communication (pitchand intensity) were collected computer-aided using the phonetics-program PRAAT.This software determines the relevant values for each hundredth of a second. A thirdelement, speech rate, was coded manually based on the timecode and the transcriptof the debate (syllables per second). As both analyses produce enormous amountsof data which have to be aggregated manually, vocal communication was analyzedin approximately 25% of the debate (1,253 seconds) only. To make sure all messageelements appear, we chose parts of the debate with a high density of message elements.
Statistical analysisStudies combining content analysis and CRM in order to uncover debate effectsusually use a quite simple research design: In the first step, CRM is analyzed withrespect to most striking parts of the debate (peaks). In the second step, only themessage elements used during peaks are under examination. When certain messageelements regularly appear during peaks, it is assumed that the peaks are caused bythose message elements (e.g., Reinemann & Maurer, 2005). This approach may bemisleading because those message elements may appear to the same extent duringordinary parts of the debate not under examination. Therefore, in this study a newkind of statistical analysis is used for the first time in order to combine contentanalysis and CRM data in a more sophisticated way. The dependent variable of theanalysis is the average immediate impression of the 72 viewers during each secondof the debate. Independent variables are the 17 verbal, visual, and vocal messageelements coded in content analysis and later recoded into 50 dummy variables.Consequently, the data at hand is a set of time series. Therefore, two transformationswere inevitable in order to prepare for analyzing the impact of the debate. First, wehad to take into account the possibility that reactions of viewers’ as measured by CRMcould be delayed in comparison to our stimulus. Such delays could be caused, forexample, by time-lags between impression formation and manual operations of thehandheld device or by technical features of the CRM system. As this issue has not yetbeen addressed by communication scholars (but see Schubert, 2004 for latencies inemotional reactions to music), we tried to identify the lag empirically. Therefore, welagged the responses to every one of the 50 independent variables in various intervalsfrom 1 to 25 seconds and determined the correlations (η2) between the dependentand the independent variables. All in all, correlations were strongest for the 4-secondinterval. This held true for verbal as well as visual and vocal message elements. Wecross-checked this finding with a qualitative analysis of those parts of the debatewith the strongest changes in viewers’ impressions. In fact, the analysis showed thatsomething remarkable happened on the screen in most cases 4 to 5 seconds prior tosignificant reactions of viewers. Therefore, we lagged the mean impressions with 4seconds in comparison to the content data.
Journal of Communication 62 (2012) 833–850 © 2012 International Communication Association 839

Visual Dominance in Political Communication F. Nagel et al.
The second issue is the autoregression of sequential values in time series data.Autoregression means that a value in the time series is highly correlated with theprevious value. Usually, time series data are ARIMA-transformed and all systematicinternal dependencies removed. Once this is done, mainly changes from one valueto another (δ-values) are left over. While this is appropriate when data has beencollected on a weekly or daily basis, we believe that viewers’ impressions measuredin one second result from message features of more than one previous second. Inorder to avoid the ARIMA-transformation and correct for autoregression, we createdweighted rolling sums as independent variables. These sums do not represent messageelements of just 1 second but the total amount of elements in several consecutiveseconds. In order to find out the best fitting interval, we calculated time series analysesfor the 50 independent variables in various intervals from 2 to 10 seconds. In thiscase, the interval with the strongest interdependence was the 3-second interval. Asin the case of time lags, no systematic differences between verbal, visual, and vocalmessage elements occurred. We cross-checked this finding with viewers’ averagedialing frequency which was slightly above 3 seconds when excluding the parts of thedebate in which only journalists spoke. Finally, we assumed that a message element’simpact in the first and the last second of the 3-second interval might be slightlylower. This assumption theoretically conforms to a combined puls/block model intime series analysis (Box, Jenkins, & Reinsel, 2008, p. 453). Consequently, the firstand last second were weighted with .5. Therefore, we multiplied each second’s valuewith the second’s weight (.5 in t−2, 1 in t−1 and .5 in t0) and summed up the results.The first 2 seconds of each turn were excluded from the analysis to avoid overlaps ofeffects caused by the creation of the weighted rolling sums.
Then, we calculated multiple OLS regressions between the weighted rolling sumsof debate content (independent variables) and the immediate average impressions ofall viewers (dependent variable). The regressions were calculated for both candidatesseparately. In order to secure the correct attribution of effects to candidates, weanalyzed only intervals in which only the speaking candidate was visible (Schroeder:n = 1,799 seconds; Merkel: n = 1,769 seconds). First, the relative impact of the indi-vidual message elements was determined. As all elements were measured on the samescale, standardization was not mandatory. Second, we analyzed the relative impactof each communication channel by entering them blockwise into the regressionmodel. The more additional variance a block explains (adjusted R2), the higher itsimportance for viewers’ immediate impressions.
As the analysis of vocal communication is based on a smaller part of thedebate, not all message elements were present in the smaller section. Therefore, wedecided to conduct the analysis for the ‘‘entire’’ debate first using verbal and visualcommunication only. Based on the smaller part of the debate we then conductedthe same analysis including the vocal features. As the results for verbal and visualcommunication are similar in both analyses but not all message elements are coveredin the smaller sample, we report the additional results for vocal communication hereonly.
840 Journal of Communication 62 (2012) 833–850 © 2012 International Communication Association

F. Nagel et al. Visual Dominance in Political Communication
Results
Message elements in the debateVerbal communicationSchroeder talked most about taxes and duties (15%), foreign affairs (12%), andsocial policy (11%); Merkel covered mainly taxes and duties (15%), employmentmarket (12%), and foreign affairs (9%). Main subjects discussed were the candidates’political programs. Remarkably, the candidates switched roles in the debate: Merkel,formally in the challenger’s role, spent much more time talking about her own camp(36% of her speaking time) and less about the government (13%). Schroeder usedonly 24% of his time to talk about himself and his party and nearly as much time totalk about the political opponent (19%). Both candidates preferred negative (26%)compared to positive (19%) tone. Combining tone and reference object, Merkel usedacclaims in 20% and attacks in 12% of her speaking time, while Schroeder usedacclaims in 11% and attacks in 8%. The candidates’ use of rhetorical means differed,too: Schroeder used more evidence (17 vs. 11%) and classical rhetorical elements(10 vs. 6%) than Merkel. Moreover, he used more positive emotional appeals thanMerkel (10 vs. 5%). Besides that, Merkel was vague more often than Schroeder andused considerably more commonplaces (19 vs. 8%). Both candidates used negativeemotional appeals in 12% of their speaking time.
Visual communicationMerkel used more direct gazes than Schroeder (8 vs. 4% of the visual presence time)while Schroeder used more gestures (45 vs. 30%); nevertheless the quality of gestureswas structurally comparable (3/5 closed, 2/5 open). Both candidates did not try towin the audience through extensive smiling: Merkel smiled in 7% of the seconds,Schroeder in 5%.
Vocal communicationIn the subset of the debate analyzed, Schroeder’s voice ranged around 115 Hertz.Merkel spoke with a mean frequency of 219 Hz—slightly lower than female voicesusually are. Intensity was comparable for both candidates (Merkel: 65.5 db; Schroeder63.7 db) and ranged slightly above the intensity of a usual conversation. Schroedertalked at a rate of 4.7 syllables per second, Merkel slightly faster (5.4 syllables persecond).
Impact of individual message elementsAs explained, the impact of each message element on viewers’ impressions of thecandidates was analyzed using OLS-regressions. For Schroeder, the (hypothetical)baseline impression (all message effects occur in their base-variation) was favorable(constant: 3.62). The baseline impression for Merkel was slightly below the neutralmiddle (3.99). By using the various message elements, candidates could eitherimprove or alloy these impressions. In this case, the unstandardized b coefficientscan simply be interpreted as differences in means.1
Journal of Communication 62 (2012) 833–850 © 2012 International Communication Association 841

Visual Dominance in Political Communication F. Nagel et al.
Impressions of both candidates were mainly shaped by talking about certain policyissues. Schroeder was perceived most positively when he spoke about ‘‘other policyissues,’’ especially when criticizing U.S. President Bush’s crisis-management afterhurricane Katrina (.37), discussing future coalitions (.23), and the economy (.13).Merkel was most successful when she spoke about completely different issues: energyand environmental policy (.29), family and gender policy (.28), national debt (.26),taxes and duties, and foreign affairs policy (both .22). Compared to this, addressingdifferent subjects did not have such a strong impact. For incumbent Schroeder bothtalking about his own personality and about the current state on certain policy fieldshad a negative impact—while for Merkel talking about both led to positive reactions.
Statements with a negative tone improved impressions of Schroeder onlyslightly (.06). An ambivalent tone deteriorated the impression of both candidates(Schroeder −.04; Merkel −.09) and positive statements showed no effect on eithercandidate. Although candidates had switched roles in the debate, viewers’ preferredargumentation schemes which were congruent with the traditional roles: Ratingswere most favorable when officeholder Schroeder acclaimed his achievements (.08)and challenger Merkel attacked the government (.13). When she used acclaim strate-gies, impressions were predominantly negative (−.06). Commonplaces improvedaudience’s impression of Merkel (.05), while worsening impressions of Schroeder(−.07). Both candidates impressed the audience positively when they used positiveemotional appeals (Schroeder .11; Merkel .08) while negative appeals had no effect.Using evidence was successful only for Schroeder (.08) and harmed Merkel (−.07).
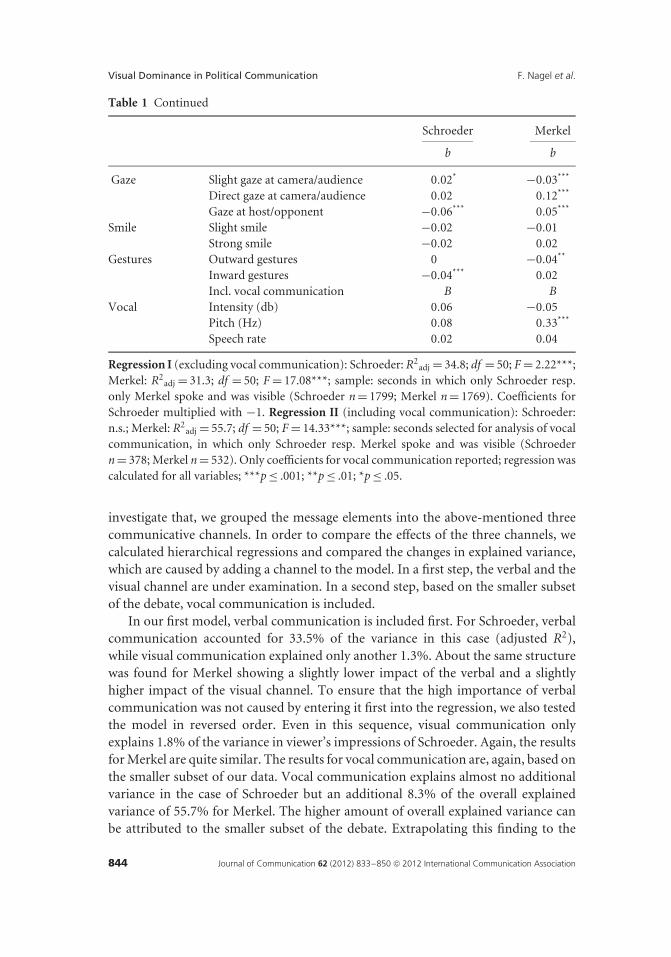
In contrast to the verbal elements, visual elements had only small effects on viewer’simpressions. For Schroeder, minimal positive effects occurred with indirect gazes(.02); direct gazes were neither positive nor negative. Slightly negative impressionsof Schroeder occurred with gazes to the conversational partner (−.06) and inwardgestures (−.04). Merkel’s visual behavior was much more successful: She improvedimpressions through direct gazes (.12) and gazes to the conversational partner (.05).Indirect gazes (−.03) and outward gestures (−.04) had a minimal negative effectwhile smiles showed no consistent effect for both candidates.
As described, the analysis of vocal communication is based on only a subset of thedebate. Therefore, the results cannot be directly compared to the above-mentioned.2
Most vocal features did not show significant effects. Neither intensity nor speechrate influenced viewers’ impressions of the candidates. Only Merkel’s pitch hada significant effect: When Merkel spoke with a higher frequency, her impressionimproved. Potentially, due to her low mean frequency of 219 Hz, even speaking at ahigher frequency did not sound shrill but nicely and helped Merkel to improve herimpression (Table 1).
Relative impact of verbal, visual, and vocal communicationEven in a natural setting, when numerous message elements appear simultaneouslyverbal, visual, and vocal elements seem to have an impact on viewers’ impressionsof candidates. But which of the three channels has the strongest impact? In order to
842 Journal of Communication 62 (2012) 833–850 © 2012 International Communication Association

F. Nagel et al. Visual Dominance in Political Communication
Table 1 Impact of Message Elements on Viewers’ Impressions of the Candidates
Schroeder Merkel
b bConstant 3.62 3.99
Issue Foreign affairs −0.03 0.22***
Social/welfare/health policy −0.01 0.05*
Family and women’s policy 0.01 0.28***
Energy and environment 0.07*** 0.29***
Economy 0.13*** 0.03Science and research policy 0.09*** 0.04National debt 0.07** 0.26***
Future coalitions 0.23*** 0.05Taxes and duties policy 0.04 0.22***
Employment market 0.05* 0.14***
Other policy issues 0.37*** 0.05No policy issue 0.03 0.10***
Subject Personality −0.10*** 0.11***
Issue competence −0.06* 0Political program −0.10*** 0.04State of a political area −0.10*** 0.06*
Others −0.10*** −0.04Object Government −0.07*** 0.01
Opposition −0.02 0.02Population −0.01 −0.02State of a political area −0.09*** 0.10***
Other reference object −0.02 0.06Tone Positive tone 0.02 −0.01
Negative tone 0.06*** 0.01Ambivalent tone −0.04* −0.09***
Context Announcement of action: Concrete 0.03 0.03Announcement: General goal −0.02 0.08***
Announcement: Commonplace −0.19*** 0Call for action 0.12*** 0.19*
Review of track record −0.03* −0.01Object × Tone Positive × government 0.08*** 0.01
Negative × government 0.04 0.13***
Positive × opposition 0.11 −0.06*
Negative × opposition 0.03 −0.02Rhetorics Evidence 0.08*** −0.07***
Negative emotional appeal −0.01 −0.03Positive emotional appeal 0.11*** 0.08***
Classical rhetorical element −0.01 −0.06***
Commonplace −0.07*** 0.05***
Journal of Communication 62 (2012) 833–850 © 2012 International Communication Association 843
Visual Dominance in Political Communication F. Nagel et al.
Table 1 Continued
Schroeder Merkel
b b
Gaze Slight gaze at camera/audience 0.02* −0.03***
Direct gaze at camera/audience 0.02 0.12***
Gaze at host/opponent −0.06*** 0.05***
Smile Slight smile −0.02 −0.01Strong smile −0.02 0.02
Gestures Outward gestures 0 −0.04**
Inward gestures −0.04*** 0.02Incl. vocal communication B B
Vocal Intensity (db) 0.06 −0.05Pitch (Hz) 0.08 0.33***
Speech rate 0.02 0.04
Regression I (excluding vocal communication): Schroeder: R2adj = 34.8; df = 50; F = 2.22***;
Merkel: R2adj = 31.3; df = 50; F = 17.08***; sample: seconds in which only Schroeder resp.
only Merkel spoke and was visible (Schroeder n = 1799; Merkel n = 1769). Coefficients forSchroeder multiplied with −1. Regression II (including vocal communication): Schroeder:n.s.; Merkel: R2
adj = 55.7; df = 50; F = 14.33***; sample: seconds selected for analysis of vocalcommunication, in which only Schroeder resp. Merkel spoke and was visible (Schroedern = 378; Merkel n = 532). Only coefficients for vocal communication reported; regression wascalculated for all variables; ***p ≤ .001; **p ≤ .01; *p ≤ .05.
investigate that, we grouped the message elements into the above-mentioned threecommunicative channels. In order to compare the effects of the three channels, wecalculated hierarchical regressions and compared the changes in explained variance,which are caused by adding a channel to the model. In a first step, the verbal and thevisual channel are under examination. In a second step, based on the smaller subsetof the debate, vocal communication is included.
In our first model, verbal communication is included first. For Schroeder, verbalcommunication accounted for 33.5% of the variance in this case (adjusted R2),while visual communication explained only another 1.3%. About the same structurewas found for Merkel showing a slightly lower impact of the verbal and a slightlyhigher impact of the visual channel. To ensure that the high importance of verbalcommunication was not caused by entering it first into the regression, we also testedthe model in reversed order. Even in this sequence, visual communication onlyexplains 1.8% of the variance in viewer’s impressions of Schroeder. Again, the resultsfor Merkel are quite similar. The results for vocal communication are, again, based onthe smaller subset of our data. Vocal communication explains almost no additionalvariance in the case of Schroeder but an additional 8.3% of the overall explainedvariance of 55.7% for Merkel. The higher amount of overall explained variance canbe attributed to the smaller subset of the debate. Extrapolating this finding to the
844 Journal of Communication 62 (2012) 833–850 © 2012 International Communication Association

F. Nagel et al. Visual Dominance in Political Communication
Table 2 Impact of Communication Channels on Viewers’ Impressions of the Candidates
Schroeder Merkel
R2adj in % R2
adj R2adj Change R2
adj R2adj Change
Regression IVerbal communication 33.5 28.5+ Visual communication 34.8 1.3 31.3 2.8Regression II+ Vocal communication n.a. (0.1) n.a. (4.7)
Regression I: sample: seconds in which only Schroeder resp. only Merkel spoke and was visible(Schroeder n = 1799; Merkel n = 1769). Regression II: sample: seconds selected for analysisof vocal communication, in which only Merkel spoke and was visible (n = 532); change inR2
adj originally 8.3% (F change 31.29), here extrapolated on base 31.3% explained variance;no significant effects for Schroeder.***p < .001.
overall explained variance of 31.3% for Merkel,3 we can assume that vocal elementsaccount for approximately 4.7% of variance in the entire debate (Table 2).4
Discussion
This study investigated the relevance of verbal, visual, and vocal communicationin shaping television viewers’ impressions of political candidates by using a uniqueand innovative research design. By combining a quantitative content analysis ofthe televised debate in the 2005 German National Election and a CRM analysis ofthe immediate impressions of 72 debate viewers, the impact of 17 single messageelements in their natural co-occurrence could be specified. Moreover, the impact ofverbal, visual, and vocal communication could be compared.
Looking at the effects of individual message elements, our study confirms resultsfrom experimental research in several fields of social science: First, we find a strongconnection between choosing certain issues to speak about and creating a positiveimpression (H1). This effect was highly party-specific. While this seems to supportissue ownership theory, a closer look shows that it was not always the issuestraditionally ‘‘owned’’ by a candidate that left the best impression. Second, we findeffects of argumentative structures which were highly role-specific. Both candidatesreceived the best evaluations when they argued according to their actual roles(Schroeder/incumbent: acclaim; Merkel/challenger: attacks) (H2–H3). Moreover,challenger Merkel succeeded when talking about the state of the country, whilethe opposite held true for incumbent Schroeder. This finding should be typical forelections in which most voters are not satisfied with the state of the country. Third,we found effects of certain rhetorical strategies. Some of them held true for bothcandidates. This was especially the case for positive emotional appeals (H5). Othersturned out to be candidate-specific. While the use of evidence had positive effects in the
Journal of Communication 62 (2012) 833–850 © 2012 International Communication Association 845

Visual Dominance in Political Communication F. Nagel et al.
case of Schroeder but negative in the case of Merkel (H4), the use of commonplaceshad just the opposite effects (H6). Obviously, also the personality of a candidateinfluences the effects of certain message elements. Fourth, we found effects of visualcommunication. Especially gazing directly into the camera improved impressionsof Merkel while it had no effect on impressions of Schroeder (H8). Finally, we alsofound effects of a vocal message element. Merkel left a more positive impressionwhen she spoke with a higher frequency (H11). On the other hand, several messageelements which had been shown to be influential in experimental research do notshow effects in our study—maybe because they are overshadowed by other factorsor simply used too seldom to have an effect.
Indeed, the most striking finding of our study is that for both of the candidates,verbal message elements had by far the strongest impact on viewers’ impressions.In the case of Merkel, even vocal communication was more important than visuals.While this finding contradicts the assumption of many practitioners in the field ofpolitical communication, it is in line with the findings of most experimental studiesusing a three-group design (audiovisual vs. video-only vs. audio-only version) inorder to compare the effects of verbal and visual communication.
How can this verbal dominance be explained? First of all, for most viewerswatching a televised debate rather is a high involvement situation. In Germany, therewas only one debate watched by millions of potential voters that do not follow politicalmedia coverage on a regular basis. Therefore, many listened carefully to candidates’statements in order to get helpful information for their voting decisions. This alsoheld true for most participants of our study. Following the dual-process models ofcommunication, high involvement leads viewers to focus on verbal communicationelements. Additionally, one could argue that the high-involvement situation has alsobeen created by our study design. Because people had been introduced to watch thedebate and had to indicate their impressions by using the dials they might have beeneven more involved. Moreover, CRM is a kind of continuous survey and, therefore,may be subject to social desirability effects. Following that argument, respondentsmight have concentrated on verbal message elements because they wanted to looklike rational voters who base their impressions on verbal information. While debateviewing generally may lead to a higher involvement, we do not think that our designcaused additional effects: Compared to other kinds of surveys CRM is a ratherunconscious method producing spontaneous reactions instead of reflected answers.Moreover, experimental research shows that respondents using CRM dials do notclearly differ in their reactions compared to respondents watching the same programwithout using CRM dials (Reinemann & Maurer, 2009).
Second, the marginal role of visual communication might be due to the factthat visual behavior was not completely visible. Because there were no close-ups,viewers could not see candidates’ facial expressions in detail. Due to the cameraangles used even their gestures were partly invisible. This, of course, holds true formany politicians’ appearances in television. Third, we might have failed to include allelements of visual communication relevant for impression formation. Although we
846 Journal of Communication 62 (2012) 833–850 © 2012 International Communication Association

F. Nagel et al. Visual Dominance in Political Communication
think that we included the most relevant dynamic elements, we are aware of the factthat we did not include static elements, especially physical attractiveness. Therefore,it is possible that the general appearance of a candidate influences the baselineimpressions, an effect that we are not able to show because of the dynamic focusof our research design. Taken together, we might underestimate the effects of visualcommunication in this study. But given the clear dominance of verbal communicationapparent here, we do not think that we have to revise our argumentation in general.
Finally, an important issue is whether these findings can be generalized. The firstquestion is whether they can be generalized to other German debates. We believe thatthis is the case. For both candidates we found comparable results for the importanceof the channels—although their behaviors differed quantitatively. Universal and role-specific effects described above will likely be found in other debates, too. The secondquestion is whether these findings can be generalized to debates in other countries.Thus far, we cannot be sure about this, because visual communication may be ofdifferent importance in different cultures. Therefore, we think more comparativestudies on these effects are needed. The final question is whether these findings canbe generalized to other debate formats and other formats than debates. This is themost crucial question, because when debate formats are more flexible, structuralfindings might change, too. Discussions with more participants or different cameraperspectives might enlarge the spectrum of verbal and visible message elements.And when candidates appear only briefly in TV news, visual information might beof greater importance, because viewers may not be able to understand the verbalmessage immediately and, therefore, rely on easily understandable visual messageelements. Consequently, it is rather unlikely that the importance of the verbal, visual,and vocal channel of communication is identical across different media formats andsituations.
Taken together, there still are many open questions. They concern, for example, therole of respondent characteristics for the relative impact of the three communicationchannels and methodological issues like the specification of time lags and spans inthe statistical analyses. However, we believe that the research design we introducedhere offers great opportunities for future studies in media effects research.
Notes
1 Coefficients for Schroeder are reported with reverse leading signs.2 Overall the regressions of verbal and visual communication with either the entire debate or
the subset revealed comparable bs. Therefore, we decided to report only the additional bs(standardized) for vocal communication.
3 Rule of proportion: 8.3/55.7 = 14.9%; 14.9% of 31.3 = 4.7.4 As it is well known that partisanship influences the perception of political candidates (e.g.,
Reinemann & Maurer, 2005), we also calculated models for supporters of both candidatesand undecided voters separately. We found that in all subgroups verbal communicationhas by far the strongest influence on viewers’ perceptions. More in detail, we found onlyone remarkable difference: For viewers supporting one of the candidates, visual
Journal of Communication 62 (2012) 833–850 © 2012 International Communication Association 847
Visual Dominance in Political Communication F. Nagel et al.
communication is slightly more important for the perception of the opposing candidatethan for the perception of the own candidate. For undecided voters, visual communicationplays a smaller role than for the supporters of both candidates. Taken together, theseresults suggest that while partisanship clearly influences the direction of candidateperception it does not seem to influence the criteria of candidate perception.
References
Apple, W., Streeter, L. A., & Krauss, R. M. (1979). Effects of pitch and speech rate on personalattributions. Journal of Personality and Social Psychology, 37(5), 715–727. doi:10.1037/0022-3514.37.5.715
Areni, C., & Sparks, J. R. (2005). Language power and persuasion. Psychology & Marketing,22(6), 507–525. doi: 10.1002/mar.20071
Barry, A. M. (2005). Perception theory. In K. L. Smith, S. Moriarty, G. Barbatsis & K. Kenney(Eds.), Handbook of visual communication: Theory, methods, and media (pp. 45–62).Mahwah, NJ: Routledge.
Benoit, W. L. (2007). Communication in political campaigns. London, England: Praeger.Box, G. E. P., Jenkins, G. M., & Reinsel, G. C. (2008). Time series analysis: Forecasting and
control (Vol. 4). Hoboken, NJ: Wiley.Burgoon, J. K., Dunbar, N. E., & Segrin, C. (2002). Nonverbal influence. In P. Dillard & M.
Pfau (Eds.), The persuasion handbook: Developments in theory and practice (pp. 445–473).Thousand Oaks, CA: Sage.
Druckman, J. N. (2003). The power of television images: The first Kennedy-Nixon debaterevisited. Journal of Politics, 65(2), 559–571. doi: 10.1111/1468-2508.t01-1-00015
Fiske, S. T., & Taylor, S. E. (2008). Social cognition: From brains to culture. Boston, MA:McGraw-Hill.
Frey, S. (1999). Die Macht des Bildes. Der Einfluß der nonverbalen Kommunikation auf Kulturund Politik. Bern, Switzerland: Huber.
Gelinas-Chebat, C., Chebat, J.-C., & Vaninsky, A. (1996). Voice and advertising: Effects ofintonation and intensity of voice on source credibility, attitudes toward the advertisedservice and the intent to buy. Perceptual and Motor Skills, 83, 243–262. doi:10.2466/PMS.83.5.243-262
Gelinas-Chebat, C., & Chebat, J.-C. (1992). Effect of two voice characteristics on the attitudestoward advertising messages. The Journal of Social Psychology, 132(4), 447–459. doi:10.1080/00224545.1992.9924724
Grabe, M. E., & Bucy, E. P. (2009). Image bite politics: News and the visual framing of elections.Oxford, England: Oxford University Press.
Gregory, S.W., & Gallagher, T.J. (2002). Spectral analysis of candidates’ nonverbal vocalcommunication: Predicting U.S. presidential election outcomes. Social PsychologyQuarterly, 65(3), 298–308.
Haumer, F., & Donsbach, W. (2009). The rivalry of nonverbal cues on the perception ofpoliticians by television viewers. Journal of Broadcasting & Electronic Media, 53, 262–279.doi: 10.1080/08838150902907918
Holtz-Bacha, C., Roessler, P., & Lessinger, E.-M. (2005). Do pictures make a difference? Themyth of the two debate audiences. In P. Roessler & F. Krotz (Eds.), Mythen derMediengesellschaft: The media society and its myths (pp. 303–319). Konstanz, Germany:UVK.
848 Journal of Communication 62 (2012) 833–850 © 2012 International Communication Association

F. Nagel et al. Visual Dominance in Political Communication
Hosman, L. A. (2002). Language and persuasion. In P. Dillard & M. Pfau (Eds.), Thepersuasion handbook: Developments in theory and practice (pp. 371–390). Thousand Oaks,CA: Sage.
Imada, A. S., & Hakel, M. D. (1977). Influence of nonverbal communication and raterproximity on impressions and decisions in simulated employment interviews. Journal ofApplied Psychology, 62(3), 295–300. doi: 10.1037/0021-9010.62.3.295
Kellermann, K. (1989). The negativity effect in interaction: It’s all your point of view. HumanCommunication Research, 16(2), 147–183. doi: 10.1111/j.1468-2958.1989.tb00208.x
Krauss, R. M., Apple, W., Morency, N., Wenzel, C., & Winton, W. (1981). Verbal, vocal, andvisible factors in judgements of another’s affect. Journal of Personality and SocialPsychology, 40(2), 312–320. doi: 10.1037/0022-3514.40.2.312
Levasseur, D., & Dean, K. W. (1996). The use of evidence in presidential debates: A study ofevidence levels and types from 1960 to 1988. Argumentation and Advocacy, 32(3),129–142.
Libet, B. (1991). Concious vs. neural time. Nature, 352(6330), 27–28. doi: 10.1038/352027a0Maier, J., Maurer, M., Reinemann, C., & Faas, T. (2007). Reliability and validity of real-time
response measurement. International Journal of Public Opinion Research, 19, 53–73. doi:10.1093/ijpor/edl002
Maurer, M. (2009). Sagen Bilder mehr als tausend Worte? Die Relevanz verbaler undvisueller Informationen fur die Urteilsbildung uber Personen im Fernsehen. Medien &Kommunikationswissenschaft, 57, 198–216.
McKinnon, L. M., Tedesco, J. C., & Kaid, L. L. (1993). The third 1992 presidential debate:Channel effects. Argumentation and Advocacy, 30, 106–118.
Mehrabian, A., & Ferris, S. R. (1967). Inference of attitudes from nonverbal communicationin two channels. Journal of Consulting Psychology, 31(3), 248–252. doi: 10.1037/h0024648
Mehrabian, A., & Williams, M. (1969). Nonverbal concomitants of perceived and intendedpersuasiveness. Journal of Personality and Social Psychology, 13(1), 37–58. doi:10.1037/h0027993
Nabi, R. L. (2002). Discrete emotions and persuasion. In P. Dillard & M. Pfau (Eds.), Thepersuasion handbook (pp. 289–308). Thousand Oaks, CA: Sage.
Paivio, A. (2007). Mind and its evolution: A dual coding theoretical approach. Mahwah, NJ:Psychology Press.
Patterson, M. L., Churchill, M. E., Burger, G. K., & Powell, J. L. (1992). Verbal and nonverbalmodality effects on impressions of political candidates: Analysis from the 1984Presidential Debates. Communication Monographs, 59(3), 231–242. doi:10.1080/03637759209376267
Petrocik, J. R., Benoit, W. L., & Hansen, G. J. (2004). Issue ownership and presidentialcampaigning 1952–2000. Political Science Quarterly, 118(4), 599–626.
Petty, R. E., Cacioppo, J. T., & Schumann, D. (1983). Central and peripheral routes toadvertising effectiveness: The moderating role of involvement. Journal of ConsumerResearch, 10(2), 135–146.
Reinard, J. C. (1988). The empirical study of the persuasive effects of evidence: The statusafter fifty years of research. Human Communication Research, 15(1), 3–59. doi:10.1111/j.1468-2958.1988.tb00170.x
Reinemann, C., & Maurer, M. (2005). Unifying or polarizing? Short-term effects andpost-debate consequences of different rhetorical strategies in televised political debates.Journal of Communication, 55, 775–794. doi: 10.1111/j.1460-2466.2005.tb03022.x
Journal of Communication 62 (2012) 833–850 © 2012 International Communication Association 849

Visual Dominance in Political Communication F. Nagel et al.
Reinemann, C., & Maurer, M. (2009). Is RTR biased towards verbal message components?An experimental test of the external validity of RTR-measurements. In J. Maier, M.Maier, M. Maurer, C. Reinemann & V. Meyer, RTR-measurement in the social sciences(pp. 27–44). Frankfurt, Germany: Peter Lang.
Schubert, E. (2004). Modeling perceived emotion with continuous musical features. MusicPerception, 21(4), 561–585. doi: 10.1525/mp.2004.21.4.561
Sopory, P., & Dillard, J. P. (2002). The persuasive effects of metaphor: A meta-analysis.Human Communication Research, 28(3), 382–419. doi:10.1111/j.1468-2958.2002.tb00813.x
Sullivan, D. G., & Masters, R. D. (1988). ‘‘Happy warriors’’: Leaders’ facial displays, viewers’emotions, and political support. American Journal of Political Science, 32(2), 345–368.
Thayer, S. (1969). The effect of interpersonal looking duration on dominance judgements.Journal of Social Psychology, 79, 285–286.
Van Damme, S., Crombez, G., & Spence, C. (2009). Is visual dominance modulated by thethreat value of visual and auditory stimuli? Experimental Brain Research, 193, 197–204.doi: 10.1007/s00221-008-1608-1
Williams, M. L. (1980). The effect of deliberate vagueness on receiver recall and agreement.Central States Speech Journal, 31, 30–41.
Zillmann, D. (1972). Rhetorical elicitation of agreement in persuasion. Journal of Personalityand Social Psychology, 21, 159–165. doi: 10.1037/h0032316
850 Journal of Communication 62 (2012) 833–850 © 2012 International Communication Association