is the major genetic basis of heterosis in rice as ... · which the planted acreage of hybrid rice...
TRANSCRIPT
Copyright 0 1995 by the Genetics Society of America
Dominance Is the Major Genetic Basis of Heterosis in Rice as Revealed by QTL Analysis Using Molecular Markers
Jinhua Xiao,* Jiming Longping Yuant and Steven D. Tanksley"
"Department of Plant Breeding and BiometT, Cornell University, Zthaca, New York, 14853 and tHunan Hybrid Rice Research Center, Changsha, Hunan 410125, People's Republic of China
Manuscript received December 12, 1994 Accepted for publication March 3, 1995
ABSTRACT A set of 194 F7 lines derived from a subspecific rice cross showing strong F1 heterosis was backcrossed
to the two parents. The materials (388 BCIF7 lines, 194 F8 lines, two parents, F,) were phenotyped for 12 quantitative traits. A total of 37 significant QTLs (LOD z 2.0) was detected through 141 RFLP markers in the BCIF7 populations. Twenty-seven (73%) quantitative trait loci (QTLs) were detected in only one of the BC1F7 populations. In 82% of these cases, the heterozygotes were superior to the respective homozygotes. The remaining 10 (27%) QTLs were detected in both BCIF7 populations, and the heterozygote had a phenotype falling between those of the two homozygotes and in no instances were the heterozygotes found to be superior to both homozygotes. These results suggest that dominance complementation is the major genetic basis of heterosis in rice. This conclusion was strengthened by the finding that there was no correlation between most traits and overall genome heterozygosity and that there were some recombinant inbred lines in the FH population having phenotypic values superior to the F, for all of the traits evaluated-a result not expected if overdominance was a major contributor to heterosis. Digenic epistasis was not evident.
H ETEROSIS, or hybrid vigor, is a term used to de- scribe the phenomenon in which the perfor-
mance of an F, , generated by crossing of two genetically different individuals, is superior to that of the better parent. Heterosis is a widely documented phenomenon in diploid organisms that undergo sexual reproduction. It was first observed in animals more than 1400 years ago (JI 1979) and later in plants from the experiments of hybridists in the 19th century (DARWIN 1876; ALLARD 1960).
The genetic basis of heterosis has been debated for more than 80 years and is still not resolved. Two major hypotheses have been promulgated to explain this phe- nomenon: the dominance hypothesis and the overdom- inance hypothesis. The dominance hypothesis, pro- posed by DAVENPORT in 1908, BRUCE (1910), and KEEBLE and PELLEW (1910), and later elaborated by JONES in 1917, supposes that heterosis is due to cancel- ing of deleterious recessives contributed by one parent, by dominant alleles contributed by the other parent in the heterozygous F 1 . The overdominance hypothesis, proposed by SHULL (1908) and EAST (1908), assumes that the heterozygous combination of the alleles at a single locus is superior to either of the homozygous combinations of the alleles at that locus. In the past, geneticists have found it difficult to resolve experimen- tally the dominance us. overdominance controversy.
Corresponding author: Steven D. Tanksley, Department of Plant Breeding & Biometry, 252 Emerson Hall, Cornell University, Ithaca, NY 148531902. E-mail: [email protected]
Genetics 140: 745-754 (,JIIIW, 1995)
The recent advent of molecular linkage maps has made it possible to detect and individually analyze the loci underlying heterosis. Using molecular markers, STUBER et al. (1992) were able to detect quantitative trait loci (QTLs) contributing to hybrid vigor in maize. Their results showed that the heterozygotes of most QTLs detected for grain yield had higher phenotypic values than those of either respective homozygotes, sug- gesting that overdominance is the principal factor con- trolling heterosis in this open-pollinated crop species.
Heterosis is the foundation of the great success of hybrid rice in China. From 1976, during which hybrid seeds were first released to rice farmers, to 1991 during which the planted acreage of hybrid rice accounted for 55% of total planted area of paddy rice in China, the cumulative increased grain yield from planting hybrid rice amounted to more than 200 million tons (YUAN 1992). It has been demonstrated empirically that hybrid rice varieties have 15-20% yield advantage over the best conventional inbred varieties using similar cultivation conditions (YUAN 1992). Encouraged by China's success in hybrid rice, the International Rice Research Institute (IRRI) resumed its research on hybrid rice in 1979, and scientists in India, Indonesia, the Philippines, South Korea, Japan, Malaysia, Thailand, USA, Brazil, Mexico and Vietnam have launched hybrid rice breeding pro- grams, and India released its first commercial hybrids last year.
Currently, the highest yielding hybrids in rice involve crosses between the two cultivated subspecies of rice (indica and japonica). The goal of the study reported
746 J. Xiao et al.
9024 (Indica)
X
1 LH422
(Japonica)
9 t
F, 194 plants were randomly chosen
0 t : 5 consecutive selfing generations
0 t
(as male) 9024 X F7 X LH422 (as male)
194 BCIF7 194 Fs 194 BClF, (to 9024) l i e s inbred lines (to LH422) lines
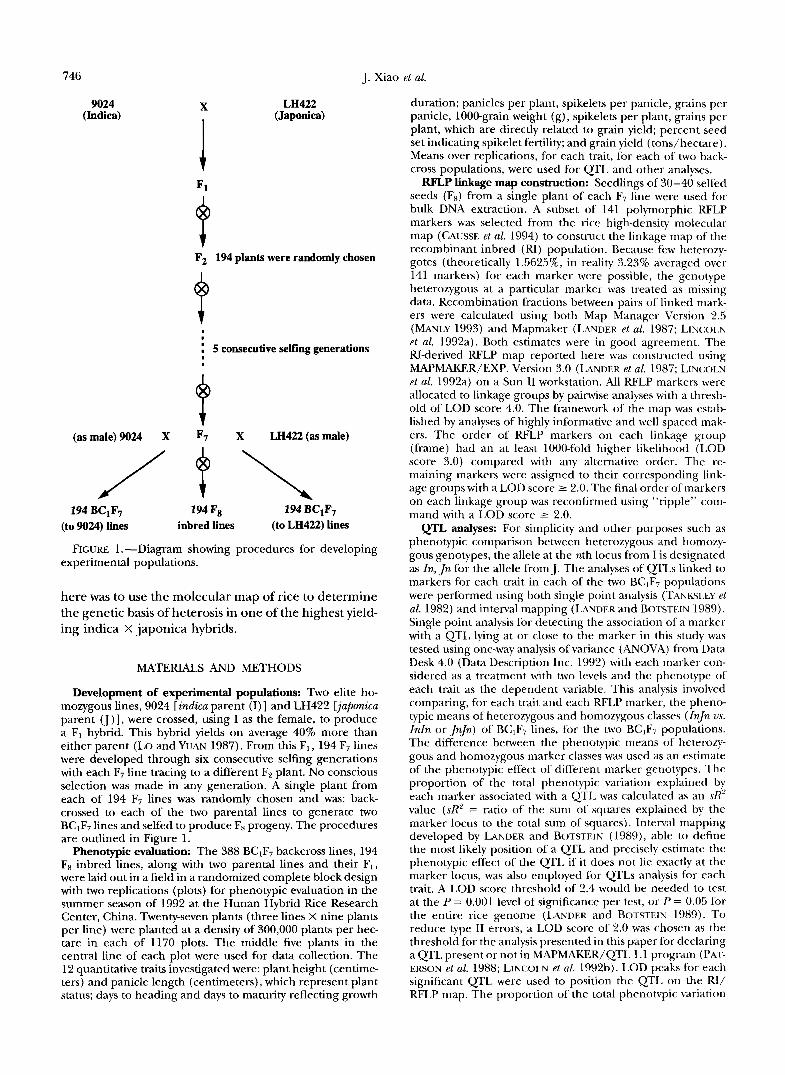
FIGURE 1 .-Diagram showing procedures for developing experimental populations.
here was to use the molecular map of rice to determine the genetic basis of heterosis in one of the highest yield- ing indica X japonica hybrids.
MATERIALS AND METHODS
Development of experimental populations: Two elite ho- mozygous lines, 9024 [indica parent (I)] and LH422 [juponica parent (J)], were crossed, using I as the female, to produce a F, hybrid. This hybrid yields on average 40% more than either parent (LO and YUAN 1987). From this F1, 194 F7 lines were developed through six consecutive selfing generations with each F7 line tracing to a different F2 plant. No conscious selection was made in any generation. A single plant from each of 194 F7 lines was randomly chosen and was: back- crossed to each of the two parental lines to generate two BCIF7 lines and selfed to produce F8 progeny. The procedures are outlined in Figure 1.
Phenotypic evaluation: The 388 BCIF7 backcross lines, 194 Fx inbred lines, along with two parental lines and their F1, were laid out in a field in a randomized complete block design with two replications (plots) for phenotypic evaluation in the summer season of 1992 at the Hunan Hybrid Rice Research Center, China. Twenty-seven plants (three lines X nine plants per line) were planted at a density of 300,000 plants per hec- tare in each of 1170 plots. The middle five plants in the central line of each plot were used for data collection. The 12 quantitative traits investigated were: plant height (centime- ters) and panicle length (centimeters), which represent plant status; days to heading and days to maturity reflecting growth
duration; panicles per plant, spikelets per panicle, grains per panicle, 1000-grain weight (g), spikelets per plant, grains per plant, which are directly related to grain yield; percent seed set indicating spikelet fertility; and grain yield (tons/hectare). Means over replications, for each trait, for each of two back- cross populations, were used for QTL and other analyses.
RFLP l i i a g e map construction: Seedlings of 30-40 selfed seeds (F,) from a single plant of each F7 line were used for bulk DNA extraction. A subset of 141 polymorphic RFLP markers was selected from the rice high-density molecular map (CAUSSE et al. 1994) to construct the linkage map of the recombinant inbred (RI) population. Because few heterozy- gotes (theoretically 1.5625%, in reality 3.23% averaged over 141 markers) for each marker were possible, the genotype heterozygous at a particular marker was treated as missing data. Recombination fractions between pairs of linked mark- ers were calculated using both Map Manager Version 2.5 (MANLY 1993) and Mapmaker (LANDER el al. 1987; LIN(:OI.N et al. 1992a). Both estimates were in good agreement. The RIderived RFLP map reported here was constructed using MAPMAKER/EXP. Version 3.0 (LANDER et al. 1987; L,IN(:OI.N et al. 1992a) on a Sun I1 workstation. All RFLP markers were allocated to linkage groups by pairwise analyses with a thresh- old of LOD score 4.0. The framework of the map was estab- lished by analyses of highly informative and well spaced mak- ers. The order of RFLP markers on each linkage group (frame) had an at least 1000-fold higher likelihood (LOD score 3.0) compared with any alternative order. The re- maining markers were assigned to their corresponding link- age groups with a LOD score > 2.0. The final order of markers on each linkage group was reconfirmed using "ripple" com- mand with a LOD score 2 2.0.
QTL analyses: For simplicity and other purposes such as phenotypic comparison between heterozygous and homozy- gous genotypes, the allele at the nth locus from I is designated as In, Jn for the allele from J. The analyses of QTLs linked to markers for each trait in each of the two BCIF7 populations were performed using both single point analysis (TANKSIXY et al. 1982) and interval mapping (LANDER and BOTSTEIN 1989). Single point analysis for detecting the association of a marker with a QTL lying at or close to the marker in this study was tested using one-way analysis of variance (ANOVA) from Data Desk 4.0 (Data Description Inc. 1992) with each marker con- sidered as a treatment with two levels and the phenotype of each trait as the dependent variable. This analysis involved comparing, for each trait and each RFLP marker, the pheno- typic means of heterozygous and homozygous classes (ZnJn us. ZnZn or JnJn) of BCIF7 lines, for the two BCIFt populations. The difference between the phenotypic means of heterozy- gous and homozygous marker classes was used as an estimate of the phenotypic effect of different marker genotypes. The proportion of the total phenotypic variation explained by each marker associated with a QTL was calculated as an X' value (sR' = ratio of the sum of squares explained by the marker locus to the total sum of squares). Interval mapping developed by LANDER and BOTSTEIN (1989), able to define the most likely position of a QTL and precisely estimate the phenotypic effect of the QTL if it does not lie exactly at the marker locus, was also employed for QTLs analysis for each trait. A LOD score threshold of 2.4 would be needed to test at the P = 0.001 level of significance per test, or P = 0.05 for the entire rice genome (LANDER and BOTSTEIN 1989). To reduce type I1 errors, a LOD score of 2.0 was chosen as the threshold for the analysis presented in this paper for declaring a QTL present or not in " A K E R / Q T L 1 . 1 program (P.4T- ERSON et al. 1988; LINCOLN et al. 1992b). LOD peaks for each significant QTL were used to position the QTL on the RI/ RFLP map. The proportion of the total phenotypic variation
Genetic Basis of Heterosis
TABLE 1
Means of quantitative traits over replications for F1 and its parents and F1 heterosis
Heterosis (%)
Trait 9024 (I) Fl LH422 u) BP MP
Plant height 94.20 114.30 104.00 9.90"" 15.34"" Days to heading 83.00 86.00 86.00 0.00 1.78** Days to maturity 118.00 129.00 125.00 3.20** 6.17"" Panicle length 21.98 25.09 23.88 5.07** 9.42** Panicles per plant 11.40 10.80 8.60 -5.26 8.00* Spikelets per panicle 118.07 126.52 151.16 - 16.30** -6.01 Grains per panicle 84.21 93.07 105.88 -12.10" -2.08 Percent seed set 71.41 73.59 70.03 3.05 4.05 1000-grain weight 24.60 27.09 22.18 10.12** 15.83** Spikelets per plant 1346.00 1366.42 1299.93 1.52 3.28 Grains per plant 959.99 1005.16 910.57 4.71 7.47* Grain yield 6.53 7.88 6.02 20.67** 25.58**
BP, better parent; MP, middle parent. Significance for heterosis, *P 5 0.05 and **P 5 0.01.
747
explained by each QTL was calculated as an iR2 value (iR' = ratio of the sum of squares explained by the QTL to the total sum of squares). In cases where more than one peak was found on a chromosome for the same trait, multiple-QTL models were employed to determine whether the chromo- some possessed single or multiple QTLs.
Epistasis analysis: Two-way interactions were performed between significant markers linked to QTLs and all other marker loci by the PROC GLM in SAS (SAS Institute 1988). For example, pl , pn, ps, and p4 were designated for the pheno- typic effects of BCIFi lines with genotypes I&& I&g IJ;II and rJ;g respectively, in the population backcrossed to I (hereaf- ter referred as to BC/I), and J,J, J,g IJ;J and rJ;g respec- tively, in the population backcrossed to J (hereafter referred as to BC/J). The null hypothesis (no epistasis) for this test is: (pl + p4) - ( p n + pR) = 0, with a degree of freedom of 1 [ (2 - 1) x (2 - 1 ) = 11.
Relationship between genome heterozygosity and expres- sion of traits: Hypergene (YOUNG and TANKS~XY 1989) was used for calculating genome ratios (percentage of total ge- nome originated from one parental genome) for each line in the RI population. The rules for genome calculation are as followings: if two consecutive markers delimiting the chro- mosome region in the line were from the same parent, the interval between them was considered to have the parental genome. If an interval was bounded by consecutive markers with alleles from the two parents respectively, then one half of the interval was considered to be from one parent one half from the other parent. The genome heterozygosity of a BC,Fi line in the BC/I is equal to the percentage of J genome in the F7 line which was used to be backcrossed to generate the BCIF7 line. The genome heterozygosity of a BCIF7 line in the BC/J is equal to the percentage of I genome in the Fi line that was backcrossed to generate the BCIF7 line. The relationships between genome heterozygosity and expression of traits were tested by regressing trait values on the genome heterozygosity in the 194 BCIF7 lines for each of the two BCIFi populations.
RESULTS
F1 heterosis: The F1 and parental means for each trait as well as the percent heterosis are given in Table 1. For heterobeltiosis (heterosis over the better parent), grain yield showed the strongest significant heterosis
(20.6%), followed by 1000-grain weight ( l O . l % ) , plant height (9.9%), panicle length (5.0%), days to maturity (3.2%); number of grains per plant, percent seed set, and spikelets per plant also exhibited positive heterosis, but not significant; no heterosis was observed for days to heading; number of spikelets per panicle (-16.3%) and number of grains per panicle (-12.1%) showed significant negative heterosis. Panicles per plant, days to heading, and grains per plant, for which no hetero- beltiosis was observed, showed significantly positive het- erosis over the midparent. The grain yield is the func- tion of three yield components: number of plants per unit area, number of grains per plant and grain weight. In the field trial of this study, the number of plants per unit area was held constant, i.e., 300,000 plants per hectare. For the other two components, the increased grain weight, measured in 1000-grain weight, accounted for 73% of the increased grain yield in this heterotic F1 hybrid (1.61 tons/Ha over the midparent or 1.35 tons/Ha over better parent), which benefited from het- erosis, the other 27% was due to the increased number of grains per plant.
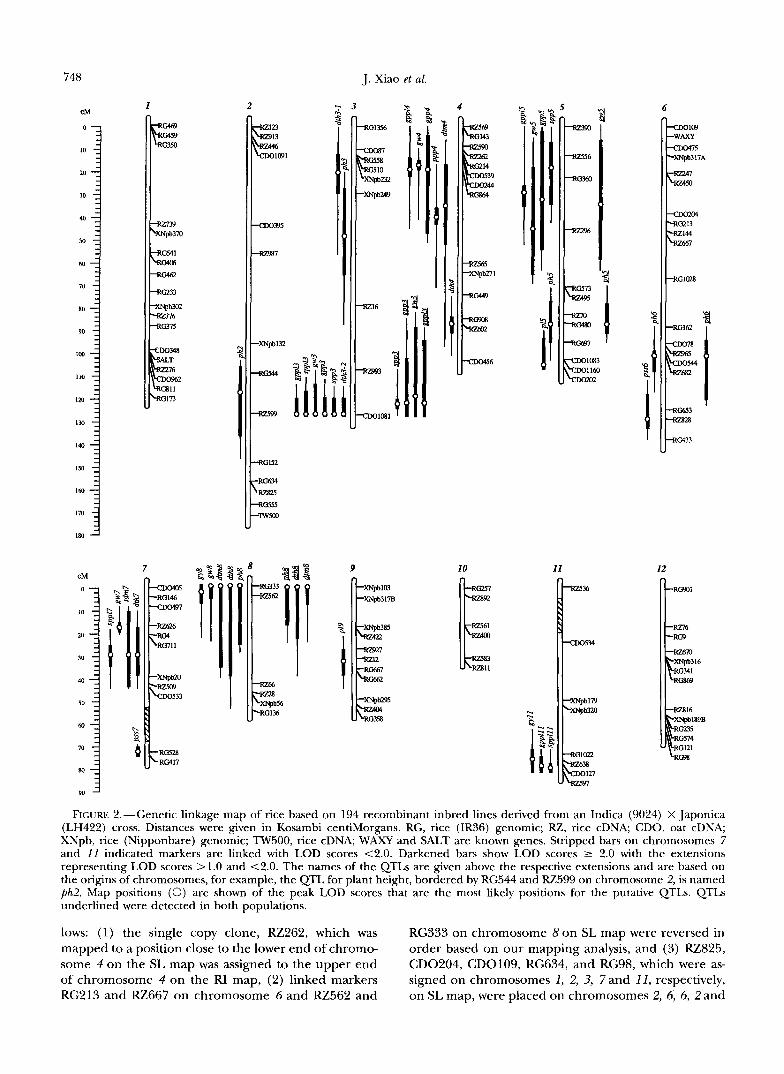
Genetic map: The genetic map shown in Figure 2 was based on 141 RFLP markers segregating in the RI population with 194 lines that served as the base popula- tion for generating the two backcross populations em- ployed in this study. Those 141 markers are estimated to cover -95% of the rice genome in comparison with the high density molecular map of rice (CAUSSE et al. 1994). All FWLP markers had been previously placed on either the SL map based on a interspecific BC popu- lation generated at Cornel1 University (CAUSSE et al. 1994) or the map derived from a inter subspecific (in- dica/ja~onica) F2 population developed at National In- stitute of Agrobiological Resources, Japan (SAITO et al. 1991). The marker order on this RI map was in good agreement with that of the two maps mentioned above. A few exceptions were observed on this RI map as fol-
I
7
- RG528 -RG417
J. Xiao et al.
2 B s 4
IO
6
12
RZlh m m
FIGURE 2,"Genetic linkage map of rice based on 194 recombinant inbred lines derived from an Indica (9024) X Japonica (LH422) cross. Distances were given in Kosambi centihlorgans. RG, rice (IR36) genomic; RZ, rice cDNA; CDO, oat cDNA; XNpb, rice (Nipponbare) genomic; TW500, rice cDNA, WAXY and SALT are known genes. Stripped bars on chromosomes 7 and 11 indicated markers are linked with LOD scores <2.0. Darkened bars show LOD scores 2 2.0 with the extensions representing LOD scores >1.0 and <2.0. The names of the QTLs are given above the respective extensions and are based on the origins of chromosomes, for example, the QTL for plant height, bordered by RG544 and RZ599 on chromosome 2, is named ph2. Map positions (0) are shown of the peak LOD scores that are the most likely positions for the putative QTL,s. QTLs underlined were detected in both populations.
lows: (1) the single copy clone, RZ262, which was RG333 on chromosome 8 on SL map were reversed in mapped to a position close to the lower end of chromo- order based on our mapping analysis, and (3) RZ825, some 4 on the SL map was assigned to the upper end CD0204, CD0109, RG634, and RG98, which were as- of chromosome 4 on the RI map, (2) linked markers signed on chromosomes 1, 2, 3, 7 and 11, respectively, RG213 and RZ667 on chromosome 6 and E 5 6 2 and on SL map, were placed on chromosomes 2, 6, 6, 2and
Genetic Basis of Heterosis 749
12 respectively on the RI map. We checked the mapping films and found those five clones had two or more cop- ies on the both mapping populations. Presumably, dif- ferent copies of the same clone were mapped on the two mapping populations.
Mapping QTLs underlying traits: Each trait was sub- jected to QTL detection based on single point analysis (one-way ANOVA) and interval mapping for each of the two BCIF7 populations. The results for each trait, for each of the two BC1F7 populations are presented in Table 2. Single point analysis and interval analysis gave basically the same result in detecting QTLs for each trait, but single point analysis usually underestimated the phenotypic effect of a QTL that did not lie exactly at the marker locus. This can be seen for the QTL for plant height on chromosome 3 and the QTLs for days to maturity and panicles per plant on chromosome 4 in the BC/I. Because the interval mapping more precisely estimates the phenotypic effects of the QTLs, all further analyses were based on the results output from the in- terval mapping.
Plant height: Five QTLs were detected in the BC/I. For three of these QTLs (chromosomes 2, 3, and 8), the heterozygotes increased plant height compared with the respective homozygotes. The QTL bordered by markers XNpb249 and RZ16 on chromosome 3 ac- counted for 26% of the total phenotypic variation. For the other two QTLs (chromosomes 5 and 6), the het- erozygotes caused a decrease in plant height.
Three QTLs in approximately the same map position (chromosomes 5, 6 and 8) were also detected in the BC/J. For the QTLs on chromosomes 5 and 6, the heterozygotes were superior to the homozygotes-a re- sult compatible with additive gene action. The re- maining QTL on chromosome 8 resulted in the hetero- zygote with reduced height, also suggesting additive gene action.
Days to heading: Three QTLs were revealed in the BC/I. For the two QTLs on chromosomes 3 and 4, the heterozygotes reduced days to heading. The heterozy- gote for the QTL on chromosome 8, which contributed to 36.6% of the total phenotypic variation, increased days to heading. In the BC/J, three QTLs were detected on chromosomes 3, 7and 8. The two QTLs on chromo- somes ? and 7 increased days to heading in the hetero- zygotes; the QTL on chromosome 8 was found at the same map position as the QTL in the BC/I. However, in this case, the heterozygote decreased days to heading suggestive of additive gene action.
Days to maturity: Two QTLs were found in the BC/ I. The heterozygote for the QTL on chromosome 4 shortened growth duration; while for the QTL on chro- mosome 8, to which 41.6% of the total phenotypic varia- tion was attributable, the heterozygote lengthened growth duration. In the BC/J, two QTLs were identi- fied. The heterozygote of the QTL on chromosome 7 increased growth duration; but the QTL, which was
detected and mapped to the same chromosomal loca- tion on chromosome 8 in the BC/I, shortened growth duration.
Panicle length: Only two QTLs, on chromosomes 4 and 8, were detected in the BC/I and the BC/J, respec- tively; and for both QTLs the heterozygotes demon- strated increased panicle length compared with homo- zygotes.
Panicles per plant: Only one QTL (chromosome 4) was detected in the BC/I, and heterozygote had fewer panicles per plant. No QTL was found over the thresh- old set for declaration in the BC/J.
Spikelets per panicle: One QTL was found on chromo- some ? in the BC/I for which the heterozygote had increased spikelets per panicle. Two QTL were revealed in the BC/J. For the QTL on chromosome 3, which was found in the same map position as in BC/I, the heterozygote decreased spikelets per panicle. For the QTL on chromosome 5, the heterozygote had in- creased spikelets per panicle.
Grains perpanicle: Two QTLs were detected on chro- mosomes 3 and 4 in the BC/I, and their heterozygotes had increased grains per panicle. Two QTLs were found in the BC/J. For the QTL at the same map position as in BC/I on chromosome 3, the heterozygote of the QTLs decreased grains per panicle in comparison with the homozygote. The heterozygote of the QTL on chro- mosome 5 enhanced grains per panicle.
Percent seed set: Two QTLs were mapped to chromo- some 6 in the BC/I and to chromosome 7 in the BC/ J, respectively. For the QTLs, the heterozygote of the QTL raised seed set rate compared with homozygotes.
1000-grain weight: Three QTLs were detected in the BC/I. For the QTL on chromosome 3, the heterozygote lowered grain weight, while the heterozygotes of QTLs on chromosomes 5 and 8 increased grain weight. Four QTLs were identified in the BC/J. For the QTLs on chromosomes 3, 4 and 7, the heterozygotes enhanced grain weight compared with their corresponding homo- zygotes. The heterozygote of the QTL on chromosome 5 decreased grain weight. The QTLs on chromosomes 3 and 5 were detected in the two backcross populations and had the same map positions.
Spikelets per plant: Three QTLs were identified in the BC/I on chromosomes 3, 5 and 11. In all of cases, the heterozygotes of the QTLs had an increased spikelets per plant. No significant QTL for this trait were found in the BC/J.
Grains per plant: Three QTLs on chromosomes 3, 4 and 1 I were detected in the BC/I, and all the heterozy- gotes increased grains per plant. Two QTLs were found for the BC/J. For the QTL on chromosome 3 (found at the same map position as in the BC/I) , the heterozy- gote reduced grains per plant, when compared to the homozygote. The heterozygote of the QTL on chromo- some 5 enhanced grains per plant.
Grain yield: Two significant QTLs were found-one

750 J. Xiao et al.
TABLE 2
Characteristics of QTLs detected affecting traits in populations backcrossed to 9024 and LJ3422
Phenotype Markers comparison
bordering Peak iR2 Phenotypic of different Trait Population QTL the QTL Pvalue LOD (%) effect genotypes
Plant height
Days to heading
Days to maturity
Panicle length
Panicles per plant
Spikelets per panicle
Grains per panicle
Percent seed set
1000-grain weight
Spikelets per plant
Grains per plant
Grain yield
BC/I
BC/J
BC/I
BC/J
BC/I
BC/J
BC/I BC/J
BC/I
BC/I BC/J
BC/I
BC/J
BC/I BC/J
BC/I
BC/J
BC/I
BC/I
BC/J
BC/I BC/J
Ph2 Ph3 Ph5 Ph6 Ph8 Ph5 Ph6 Ph8 dth3-1 dth4 dth8
dth7 dth8
dtm4 dtm8 dtm 7 dtm8
dth3-2
$5 P19
PPP4
sPP3 sPP3 sPP5
gPP3 gPP4 gPP3 gPP5 par6 p - 7
P 3 gw5 gW8 P 3 gw4 P 5 P 7
sPPl3 sPPl5 sppll I
gPPl3 gPPl4 gPPl11 gPPl3 gPPl5
all
RG544RZ599 XNpb249-RZ16 RG480-RG697 RZ682-RG653 RG333-RZ562 RG480-RZ70 RZ682-RG653 RG333-RZ562
CD01081-RZ993 RZ602-CD0456 RG333-RZ562
RG711-XNpb20 XNph232-XNpb249
RG33-RZ562
RG864RZ565 RG333-RZ562 CD0533-RZ509 RG333-RZ562
CD01160-CD0202 RZ12-RG667
RG864RZ565
CD01081-RZ993 CD01081-RZ993 RG360-RZ556
CD01081-RZ993 CD0244RG864 CD01081-RZ993 RG360-E296
RZ828-RG653 RG528-RG417
CD01081-RZ993 RZ296-RG360 RG333-RZ562 CD01081-RZ993 RG864CD0244 RZ296-RG360 RZ626-RG4
CD01081-RZ993 RG71l-XNpb20 RZ597-CD0127
CD01081-RZ993 CD0244RG864 RZ597-CD0127 CD01081-RZ993 RG360-RZ296
RZ638-CDO127 RZ562-RG333
0.0001 0.0005
<0.0001 0.001 1
<0.0001 0.0001
<0.0001 <0.0001
0.0006 0.0011
<0.0001 0.001 1 0.0008
<0.0001
0.0007 <0.0001
0.0001 0.0012
0.0004 0.0004
0.0181
0.0006 0.0044 0.0019
0.0009 0.0001
<0.0001 <0.0001
0.0011 0.0007
<0.0001 <0.0001
0.0004 <0.0001
0.0043 0.0009 0.0038
0.0006 0.0078 0.0016
0.0012 0.001 1 0.0006
<0.0001 0.0035
0.001 1 0.0008
3.69 11.40 3.69 26.00 5.20 12.20 2.28 5.30 6.73 15.10 3.36 8.20 4.92 11.10 3.94 9.00
2.47 6.10 2.32 5.40
18.29 36.60 2.68 8.10 3.16 10.20 5.69 12.70
2.99 16.80 20.50 41.60
3.43 10.00 2.62 6.10
3.20 7.80 2.74 6.60
2.14 18.30
2.65 6.50 2.02 7.00 2.55 7.30
2.50 6.20 3.18 8.50 5.35 16.70 4.49 17.30
2.52 6.20 2.22 5.30
3.87 9.60 4.36 11.60 2.55 6.10 7.84 25.00 2.00 5.20 3.21 12.40 2.00 4.70
2.60 6.50 2.15 7.30 2.18 5.10
2.37 6.00 2.16 5.70 2.55 6.00 5.53 17.60 2.13 8.10
2.64 6.80 2.49 6.30
4.35 6.63
-4.53 -3.12
5.37 3.80 4.61
-4.26
- 1.45 -1.38
3.85 1.13 1.24
-1.47
-3.11 5.30 1.91
-1.58
0.75 0.78
-0.64
9.62
11.08
5.73 6.68
-10.26 10.44
2.44 2.98
-1.00 1.11 0.86 1.74 0.80
- 1.22 0.78
86.96 93.69 76.94
49.77 48.50 49.72
63.60
0.32
- 10.84
-93.72
-0.33 a8 P value refers to the probability that the marker listed on the left and having a higher sR2 does not have effect on the trait.
The signs, + (omitted) and - preceding phenotypic effects indicate that the heterozygote had a higher phenotypic effect than the respective homozygote, and the heterozygote had a higher phenotypic effect than the respective homozygote, respectively. I and Jin the genotypes represent the alleles of the locus originating from 9024 and LH422, respectively.
Genetic Basis of Heterosis 751
TABLE 3
Correlation coefficients (r) between the genome heterozygosity and traits in the 194 BClF, families
for the two BCIF, populations
Trait BC/I BC/J
Plant Height 0.204** 0.081 Days to heading -0.004 0.021 Days to maturity -0.027 0.026 Panicle length 0.143” -0.021 Panicles per plant -0.082 -0.048
Spikelets per panicle 0.062 -0.013 Grains per panicle 0.069 -0.026 Percent seed set 0.028 -0.016 1000-grain weight 0.068 0.099 Spikelets per plant 0.026 -0.041 Grains per plant 0.037 -0.057 Grain yield 0.091 0.017
* P 5 0.05 and **P 5 0.01.
on chromosome 11 in the BC/I and one on chromo- some 8 in the BC/J, respectively. For the QTL on chro- mosome 8, the heterozygote decreased grain yield with comparison with the homozygote. The heterozygote of the QTL on chromosome I 1 increased grain yield.
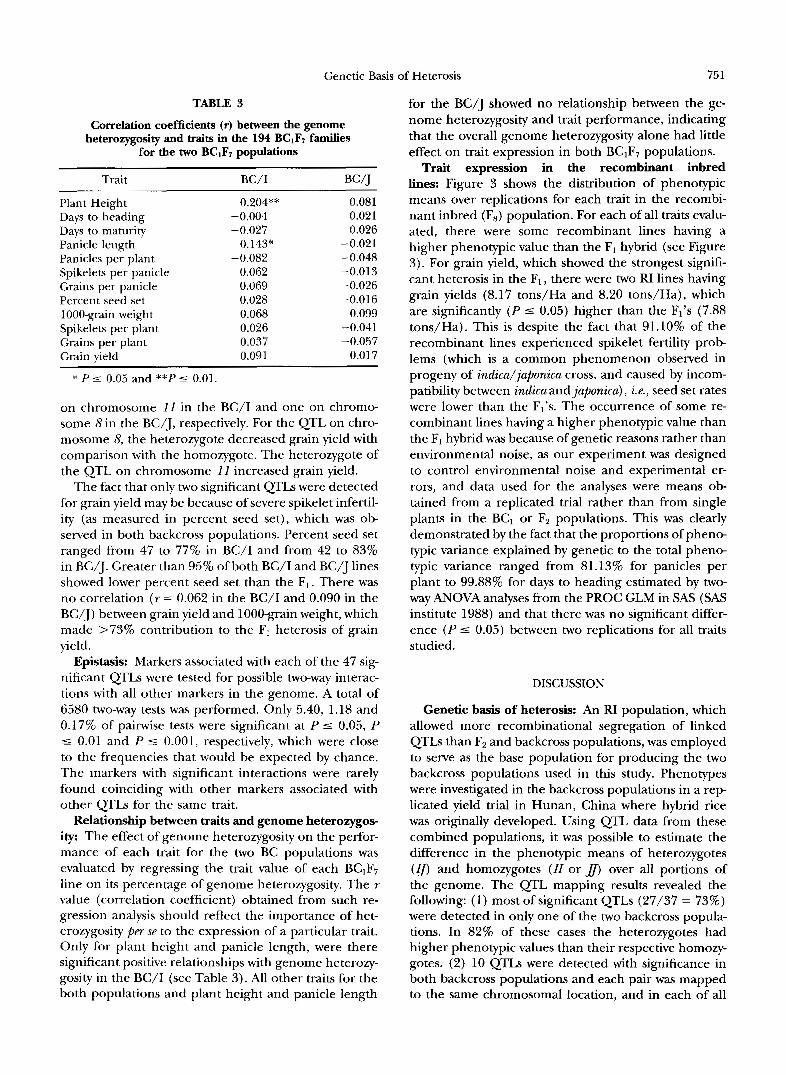
The fact that only two significant QTLs were detected for grain yield may be because of severe spikelet infertil- ity (as measured in percent seed set), which was ob- served in both backcross populations. Percent seed set ranged from 47 to 77% in BC/I and from 42 to 83% in BC/J. Greater than 95% of both BC/I and BC/J lines showed lower percent seed set than the F1. There was no correlation ( r = 0.062 in the BC/I and 0.090 in the BC/J) between grain yield and 1000-grain weight, which made >73% contribution to the F1 heterosis of grain yield.
Epistasis: Markers associated with each of the 47 sig- nificant QTLs were tested for possible two-way interac- tions with all other markers in the genome. A total of 6580 two-way tests was performed. Only 5.40, 1.18 and 0.17% of painvise tests were significant at P 5 0.05, P 5 0.01 and P 5 0.001, respectively, which were close to the frequencies that would be expected by chance. The markers with significant interactions were rarely found coinciding with other markers associated with other QTLs for the same trait.
Relationship between traits and genome heterozygos ity: The effect of genome heterozygosity on the perfor- mance of each trait for the two BC populations was evaluated by regressing the trait value of each BC1F7 line on its percentage of genome heterozygosity. The r value (correlation coefficient) obtained from such re- gression analysis should reflect the importance of het- erozygosity per se to the expression of a particular trait. Only for plant height and panicle length, were there significant positive relationships with genome heterozy- gosity in the BC/I (see Table 3). All other traits for the both populations and plant height and panicle length
for the BC/J showed no relationship between the ge- nome heterozygosity and trait performance, indicating that the overall genome heterozygosity alone had little effect on trait expression in both BCIF, populations.
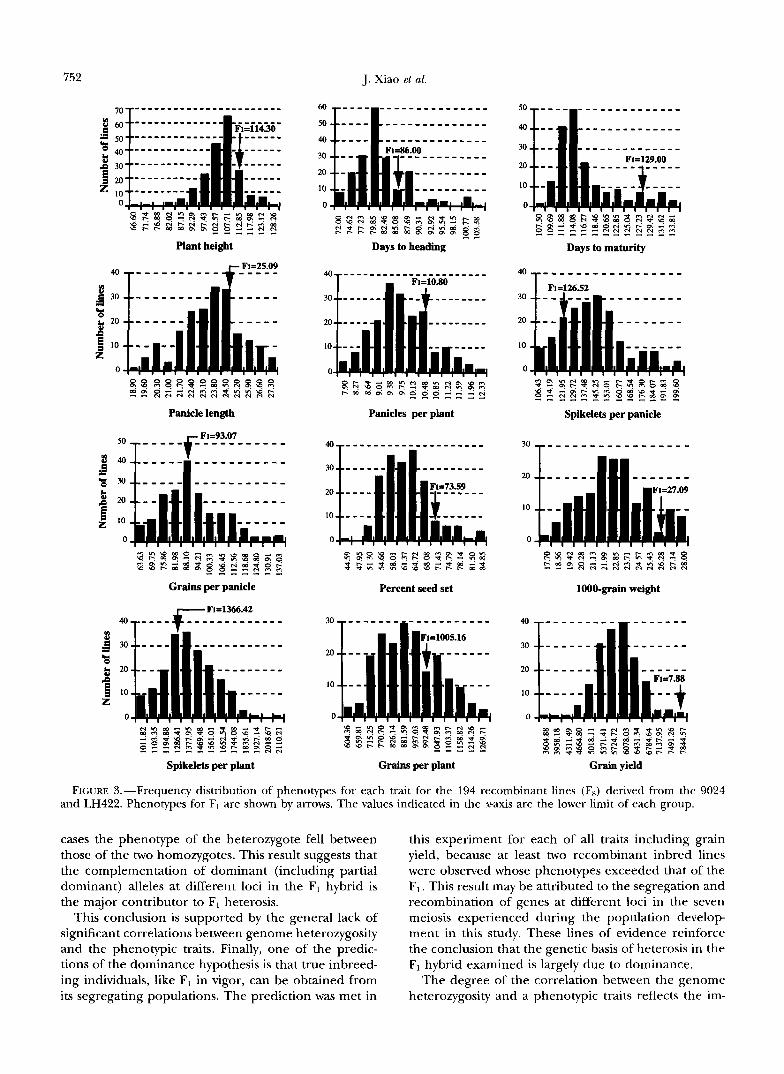
Trait expression in the recombinant inbred lines: Figure 3 shows the distribution of phenotypic means over replications for each trait in the recombi- nant inbred (F,) population. For each of all traits evalu- ated, there were some recombinant lines having a higher phenotypic value than the F1 hybrid (see Figure 3). For grain yield, which showed the strongest signifi- cant heterosis in the F1, there were two RI lines having grain yields (8.17 tons/Ha and 8.20 tons/Ha), which are significantly ( P 5 0.05) higher than the Fl’s (7.88 tons/Ha). This is despite the fact that 91.10% of the recombinant lines experienced spikelet fertility prob- lems (which is a common phenomenon observed in progeny of indica/japonica cross, and caused by incom- patibility between indica and japonica), i.e., seed set rates were lower than the Fl’s. The occurrence of some re- combinant lines having a higher phenotypic value than the F1 hybrid was because of genetic reasons rather than environmental noise, as our experiment was designed to control environmental noise and experimental er- rors, and data used for the analyses were means ob- tained from a replicated trial rather than from single plants in the BCI or F2 populations. This was clearly demonstrated by the fact that the proportions of pheno- typic variance explained by genetic to the total pheno- typic variance ranged from 81.13% for panicles per plant to 99.88% for days to heading estimated by two- way ANOVA analyses from the PROC GLM in SAS (SAS institute 1988) and that there was no significant differ- ence ( P s 0.05) between two replications for all traits studied.
DISCUSSION
Genetic basis of heterosis: An RI population, which allowed more recombinational segregation of linked QTLs than F2 and backcross populations, was employed to serve as the base population for producing the two backcross populations used in this study. Phenotypes were investigated in the backcross populations in a rep- licated yield trial in Hunan, China where hybrid rice was originally developed. Using QTL data from these combined populations, it was possible to estimate the difference in the phenotypic means of heterozygotes (I$ and homozygotes (IZ or _In over all portions of the genome. The QTL mapping results revealed the following: (1) most of significant QTLs (27/37 = 73%) were detected in only one of the two backcross popula- tions. In 82% of these cases the heterozygotes had higher phenotypic values than their respective homozy- gotes. (2) 10 QTLs were detected with significance in both backcross populations and each pair was mapped to the same chromosomal location, and in each of all
752 J. Xiao et al.
20 """""
10 """""
4OT """"""""_ 40T"""""""""'"" I F1=10.80 I F1=126.52
Panicle length
40,"""""""""" 3 0 T """""""" - """"_ 8~73.59
"""-
10
0
Grains per panicle
F14366.42
"""""_ 3oi;;& """_ 20 """ """
10 ""_ 0
Spikelets per plant Grains per plant Grain yield
FIGURE 3.-Frequency distribution of phenotypes for each trait for the 194 recombinant lines (F,) derived from the 9024 and LH422. Phenotypes for F, are shown by arrows. The values indicated in the x-axis are the lower limit of each group.
cases the phenotype of the heterozygote fell between those of the two homozygotes. This result suggests that the complementation of dominant (including partial dominant) alleles at different loci in the F1 hybrid is the major contributor to F, heterosis.
This conclusion is supported by the general lack of significant correlations between genome heterozygosity and the phenotypic traits. Finally, one of the predic- tions of the dominance hypothesis is that true inbreed- ing individuals, like F1 in vigor, can be obtained from its segregating populations. The prediction was met in
this experiment for each of all traits including grain yield, because at least two recombinant inbred lines were observed whose phenotypes exceeded that of the F1. This result may be attributed to the segregation and recombination of genes at different loci in the seven meiosis experienced during the population develop ment in this study. These lines of evidence reinforce the conclusion that the genetic basis of heterosis in the F1 hybrid examined is largely due to dominance.
The degree of the correlation between the genome heterozygosity and a phenotypic traits reflects the im-
Genetic Basis of Heterosis 753
portance of overall genome heterozygosity to the trait expression. For most of traits, such correlation is very low and not significant (see Table 3). This is consistent with QTLs mapping results. As shown in Table 2, for most of traits, not all QTLs detected for the trait had higher phenotypes in heterozygotes than in respective homozygotes, i.e., for some of the QTLs, heterozygotes showed higher phenotypes than the respective homozy- gotes; for the other of the QTLs, the heterozygotes exhibited lower phenotypes than the respective homo- zygotes. Therefore, the overall genome heterozygosity would show no correlation with the trait.
Digenic interactions between markers associated with significant QTLs and all other markers were not found significant in this study. This suggests that strong epista- sis is not likely to be involved in this study. However, as discussed by TANKSLEY (1993), marker-based QTL studies are inherently inefficient at detecting epistasis and one cannot exclude the possibility that some level of epistasis is occurring.
Genotype by environment interaction is interesting to geneticists and breeders. Since molecular markers were introduced in quantitative genetics, a number of QTL studies have been carried out to detect possible QTL by environment interaction. While QTL by envi- ronment interaction has been detected in some in- stances, it is usually of the type where QTLs found in one of environments, differ in the magnitude of their effects in different environments. To our knowledge, there are no instances where the gene action of a QTL has changed, e.g., change from dominance to reces- siveness, partial dominance to overdominance, from one environment to another. Although the conclusion that heterosis in rice is largely because of dominance is drawn from QTL study in one environment, we be- lieve that this conclusion is likely to extend to other environments.
Comparison with maize: The conclusion that hetero- sis in rice is largely due to dominance contrasts with QTL studies in maize which suggest that overdomi- nance is implicated as the prominent factor condition- ing heterosis (STLJBER et al. 1992). One possible expla- nation for this difference is that maize actually possesses a large number of genes for which alleles interact in a truly overdominant manner whereas rice does not. Rice and maize are both members of the Gramineae, evolved from a common ancestor and share many orthologous genes ( A H N and TANKSLEY 1993). For maize alone to harbor alleles that are truly overdominant would be remarkable. An alternative explanation is that maize does not contain a higher frequency of overdominant alleles and that the observed overdominant gene action detected in QTL studies is due to pseudo-overdomi- nance or the occurrence of dominant and recessive alleles in coupling at closely linked loci (CROW 1952).
In this regard, it is important to note that the QTLs discovered from mapping studies are defined with only
limited resolution. From a primary mapping study it is normally not possible to localize a QTL to a region < 10 cM. This leaves open the possibility that an overdomi- nant QTL may actually be a deleterious recessive allele at one locus in cis with a beneficial dominant allele at a closely linked locus. This would be detected in a mapping study as a QTL with overdominant gene ac- tion. This phenomenon was termed pseudo-overdomi- nance and has been acknowledged as a possible expla- nation for some of the overdominant gene action observed in maize (STUBER et al. 1992). One might pre- dict that pseudo-overdominance would be more likely to occur in plants in which deleterious recessive alleles are more abundant. Breeding and genetic studies would suggest that deleterious recessives are more fre- quent in maize and other out-crossing species than in self-pollinated species like rice (AL,LD 1960).
The difference in the reproductive biology of maize and rice could account for the greater accumulation of deleterious recessives in maize than in rice. In maize and other out-crossing species, recessive alleles are usu- ally masked by their corresponding dominant counter- parts. In rice and other self-pollinated species, popula- tions and individuals are more highly inbred, a condition in which deleterious recessive mutations are more likely to be eliminated by natural and artificial selections.
To distinguish definitively overdominance from pseudo-overdominance will require fine mapping of QTLs displaying overdominant gene action. In the case of pseudo-overdominance, it should be possible to break the tight linkage of the dominant and recessive alleles which would result in loss of the observed over- dominance behavior. In the case of true single gene overdominance, fine mapping will more precisely de- fine the position of the locus, but the overdominant gene action will persist. In the past, fine mapping of overdominant loci was impractical. Now, with the avail- ability of high-density molecular linkage maps, fine mapping is a feasible proposition and the hypothesis that overdominant QTLs in maize are a result of tight linkage of dominant and recessive alleles can be tested empirically (PATERSON et d. 1989; JANSEN and STAM 1994).
Thanks t o Drs. SUSAN R. M(;(:OLTH and OI.IVI’.R PANALII) for helpful comments.This research was supported by grants from The Rockefel- ler Fonndation to S.D.T. and L.Y. J.X. was supported by a predoctoral fellowship from The Rockefeller Foundation.
LITERATURE CITED
A H N , S., and S. D. TANKSLEY, 1993 Comparative linkage maps of the rice and maize genomes. Proc. Natl. Acad. Sci. USA 90: 7980- 7984.
AILARD, R. W., 1960 Inbreeding depression and heterosis, pp, 219- 223 in Principles ofPlunl Breuding edited by R. W. AI.I.ARD. John Wiley & Sons, New York.
BRUCE, A. B., 1910 The Mendelian theory of heredity and the aug- mentation of vigor. Science 32: 627-628.
754 J. Xiao et (11.
BURR, B., F. A. BURR, K. H. THOMPSON, M. C:. ALBERTSEN and C . W. STUBER, 1988 Gene mapping with recombinant inbreds in maize. Genetics 118: 519-526.
CAUSSE, M., T. M. FULTON, Y. G. CHO, S. N. AHN, K. WU et al., 1994 Saturated molecular map of the rice genome based on an inter- specific backcross population. Genetics 138 1251-1274.
CROW, J. F., 1952 Dominance and overdominance, pp. 282-297 in Heterosis, edited byJ. W. GOWEN. Iowa State College Press, Ames, L4.
DARWIN, C., 1876 TheEJects of Cross and SelfFertilization in the Vegetable Kingdom. John Murray, London.
DATA DESCXUPTION, INC:., 1992 Data Desk: Statistics Guide. Data De- scription, Inc., Ithaca, NY.
DAVENPORT, C . B., 1908 Degeneration, albinism and inbreeding. Science 28: 454-455.
DE VICENTE, M. C., and S. D. TANKSLEY, 1992 QTL analysis of trans- gressive segregation in an interspecific tomato cross. Genetics
EAST, E. M., 1908 Inbreeding in corn. Reports of The Connecticut Agricultural Experiment Station for years 1907-1908, 419-428.
EAST, E. M., 1936 Heterosis. Genetics 21: 375-397. EDWARDS, M. D., C. W. STUBER and J. F. WENDEI., 1987 Molecular-
marker-facilitated investigations of quantitative-trait loci in maize. I. Numbers, genomic distribution, and types of gene ac- tion. Genetics 116 113-125.
JANSEN, C. J., and P. STAM, 1994 High resolution of quantitative traits into multiple loci via interval mapping. Genetics 136: 1447- 1455.
JI, D., 1979 Inbreeding and heterosis, pp. 85-98 in Gmetics (in Chinese), edited by Zhangjiang Agricultural University and Beijing Agricultural University. China Agriculture Press, Beijing.
JONES, D, F., 1917 Dominance of linked factors as a means of ac- counting for heterosis. Proc. Natl. Acad. Sci. USA 3: 310-312.
KEEBLE, F., and C. PEI.I.EW, 1910 The mode of inheritance of stature and of time of flowering in peas (Pisum sativum). .J. Genetics 1: 47-56.
KOSAMBI, D. D., 1944 The estimation of map distances from reconl- bination values. Ann. Eugen. 12: 172-175.
LANDEK, E. S., and D. BOTSTEIN, 1989 Mapping Mendelian factors underlying quantitative traits using RFLP linkage maps. Genetics
IANDER, E. S., P. GREEN, J. ABRAHAMSON, A. BARI.OW, M. J. DALY et al., 1987 Mapmaker: an interactive computer package for constructing primary genetic linkage maps of experimental and natural populations. Genomics 1: 174-181.
LINCOLN, S., M. DALY and E. LANDEK, 1992a Constructing genetics maps with MAF"AKER/EXP. 3.0. Whitehead Institute Technical Report. Ed. 3.
LINCOI.N, S., M. DM.Yand E. LANDER, 1992b Mapping genes control- ling quantitative traits with MAPMAKER/QTL 1.1. Whitehead Institute Technical Report. Ed. 2.
LO, X., and I,. YUAN, 1987 Annual report on progress on hybrid rice breeding at Hunan Hybrid Rice Research Center. Hunan Hybrid Rice Research Center.
MANI.Y, K. F., 1993 A Macintosh program for storage and analysis
134: 585-596.
121: 185-199.
of experimental genetic mapping data. Mamm. Genome 4 303- 313.
MCCOUCH, S. R., G. KOCHERT, 2. H. Yu, Z. Y. WANC;, G. S. KHUSH et al.,
Genet. 76: 815-829. 1988 Molecular mapping of rice chromosomes. Theor. Appl.
PATERSON, A. H., E. S. LANDER, J. D. HEWITT, S. PETERSON, S. E. LINCOLN et al., 1988 Resolution of quantitative traits into Men- delian factors by using a complete RFLP linkage map. Nature 335 721 -726.
PATERSON, A. H., J. W. DEVERNA, B. MINI and S. D. TANKXEY, 1990 Fine mapping of quantitative trait loci using selected overlapping recombinant chromosomes in an interspecies cross of tomato. Genetics 124: 735-742.
PATERSON, A. H., S. DAMON, J. D. HEWITT, D. ZAMIR, H. D. UBINO- UTTCFI et al., 1991 Mendelian factors underlying quantitative traits in tomato: comparison across species, generations, and environments. Genetics 127: 181-197.
SAITO, A,, M. Y ~ o , N. KISHIMOTO, M. NAKAGNHRA, A. YOsltlM~rR4 el aL, 1991 Linkage map of restriction fragment length polymor- phism loci in rice. Jpn. J. Breed. 41: 665-670.
SAS Institute, Inc., 1988 SAS Users Guide: Slati.rtic. SAS Institute, Gary, NC.
SHUI.I., G. H., 1908 The composition of a field of maize. Am. Breed. Assn. 4: 296-301.
STUBER, C. W., M. D. EDWARDS and J. F. WENDEL, 1987 Molecular marker-facilitated investigations of quantitative trait loci in maize. 11. factors influencing yield and its component traits. Crop Sci. 27: 639-648.
STUBER, C. W., S. E. LINCOLN, D. W. W O I . ~ , T. HEIXN'IJARIS and E. S. LANDER, 1992 Identification of genetic factors contributing to heterosis in a hybrid from two elite maize inbred lines using molecular markers. Genetics 132: 823-839.
TANKSLEY, S. D., 1993 Mapping polygenes. Annu. Rev. Genet. 27:
TANKSLEY, S. D., H. MEDINA-FII.HO and C. M. RICK, 1982 Use of naturally-occurring enzyme variation to detect and map genes controlling quantitative traits in an interspecific backcross of tomato. Heredity 49: 11 -25.
TANKSLEY, S. D., N. D. YOUNG, A. H. PATTERSON and M. W. BONIERBAIX, 1989 RFLP mapping in plant breeding: new tools for an old science. Biotechnology 7: 247-264.
TANKSIXY, S., M. CAUSSE, T. FUI.TON, N. A H N , Z. WANG rt al., 1992 A high density molecular map of the rice genome. Rice Genet. Newsl. 9: 111-115.
WANG, G., D. J. MACKIL.L., J. M. BONMAN, S. R. MCCOUCH, M. C:. CHAMPOUX et al., 1994 RFLP mapping of genes conferring com- plete and partial resistance to blast in a durably resistant rice cultivar. Genetics 136 1421-1434.
YOUNG, N. D., and S. D. TANKSLEY, 1989 Restriction fragment length polymorphism maps and the concept of graphical genotypes. Theor. Appl. Genet. 77: 95-101.
YUAN, 1.. P., 1992 Development and prospects of hybrid rice breed- ing, pp. 97- 105 in Agn'cullural Biotechnology, Proceeding of Asian- Par@ Confirmre on Ap'cultural Biotechnology, edited by C. B. YOU and Z. L. CHEN. China Agriculture Press, Beijing.
205-233.
Communicating editor: J. A. BIRCHLER