is targeting deprived areas an effective means to reach
TRANSCRIPT

i
Is Targeting Deprived Areas an Effective Means to Reach Poor People? An assessment of one rationale for area-
based funding programmes
Rebecca Tunstall Ruth Lupton
Contents 1. Introduction.................................................................................................................. 1
Scope ........................................................................................................................... 1 Area-based targeting in policy...................................................................................... 1 The rationales for area-based targeting ......................................................................... 4
2. The area-based indices used in targeting funding.......................................................... 8 DOE/DETR indices of deprivation ............................................................................... 8 Indices used to target health care spending ................................................................... 9 Other indices .............................................................................................................. 10 Indices of social exclusion.......................................................................................... 11 Which areas are identified by the indices? .................................................................. 12 Summary.................................................................................................................... 14
3. The effectiveness of area-based targeting in reaching poor individuals ....................... 15 Targeting different spatial scales ................................................................................ 16 Using the IMD 2000 to target subgroups of the poor .................................................. 21
4. Conclusion: Is targeting deprived areas using area deprivation indices an effective means to reach poor people?....................................................................................... 25
Appendix 1: The indicators and statistical processes used in the major area-based indices... 30 Appendix 2: The eighty-eight local authorities eligible for the Neighbourhood Renewal Fund:
The ‘high ranking 25% districts’ ................................................................................ 33 References........................................................................................................................... 34 CASEpaper 70 Centre for Analysis of Social Exclusion June 2003 London School of Economics Houghton Street London WC2A 2AE CASE enquiries – tel: 020 7955 6679

ii
Centre for Analysis of Social Exclusion The ESRC Research Centre for Analysis of Social Exclusion (CASE) was established in October 1997 with funding from the Economic and Social Research Council. It is located within the Suntory and Toyota International Centres for Economics and Related Disciplines (STICERD) at the London School of Economics and Political Science, and benefits from support from STICERD. It is directed by Howard Glennerster, John Hills, Kathleen Kiernan, Julian Le Grand, Anne Power and Carol Propper. Our Discussion Paper series is available free of charge. We also produce summaries of our research in CASEbriefs, and reports from various conferences and activities in CASEreports. To subscribe to the CASEpaper series, or for further information on the work of the Centre and our seminar series, please contact the Centre Administrator, Jane Dickson, on:
Telephone: UK+20 7955 6679 Fax: UK+20 7955 6951 Email: [email protected] Web site: http://sticerd.lse.ac.uk/Case
Rebecca Tunstall
Ruth Lupton All rights reserved. Short sections of text, not to exceed two paragraphs, may be quoted without explicit permission provided that full credit, including notice, is given to the source.

iii
Editorial Note
Rebecca Tunstall is a Lecturer in Housing in the Department of Social Policy, LSE, and an associate of the ESRC Research Centre for Analysis of Social Exclusion (CASE). Ruth Lupton is a Research Officer in CASE.
Acknowledgements
The research on which this paper was based was funded by the New Opportunities Fund and managed by Michael Clegg, who provided valuable advice and support. Joe Murray gathered the literature and carried out much of the data analysis. Anne Power and John Hills of CASE gave important guidance and advice. Thanks also for their advice and help to Tanvi Desai of LSE, Ben Jupp, Peter Phillimore, John Pike of the Countryside Agency, and to Carol Propper and Liz Richardson of CASE.
Abstract
Area-based programmes have long been a feature of urban policy in the UK. One rationale is that they are an effective means to target poor people. Area deprivation indices are used to identify areas for targeting. This paper reviews the different results produced by these indices. It then examines the effectiveness of the current Index of Multiple Deprivation in targeting the poor, demonstrating that area targeting using the IMD 2000 is a more complete way of reaching the poor than has been claimed by opponents of area-based targeting in the past. However, it is more effective in reaching some sub-groups, particularly children, than others, and is also relatively inefficient. There is a trade off between efficiency and completeness. The use of area targeting should depend on the type of intervention, the costs and benefits of producing complex targeting mechanisms, and the particular balance between completeness and efficiency in each case. Keywords: area targeting, deprivation, area-based initiatives, neighbourhoods, poverty JEL number: I30, R00

1
1. Introduction
Scope Area-based policy, with special funding and in some cases legal and governance arrangements for particular areas, has been central to urban policy since the launch of the Urban Programme and Educational Priority Areas (EPAs) in the late 1960s, and has been widely used by both Conservative and Labour governments. The current government particularly favours area-based measures and has introduced a range of policies and programmes that are geographically limited, ranging from the ubiquitous Zones – for education, health, employment and sport, to the Neighbourhood Renewal Fund, Sure Start and New Deal for Communities. One rationale for area-based funding is that targeting deprived areas is an effective means to target poor people, although there are several others, mostly more pragmatic. This paper firstly describes some of the major area-based indices of deprivation that have been used in targeting funding, shows how they can identify different areas and therefore different individuals, and shows how the index currently most commonly used in England, the Index of Multiple Deprivation (IMD) 2000, relates to others in content and results. The paper then assesses the validity of the effectiveness rationale for using area-based indices to target funding. It demonstrates how effective the IMD 2000 is in reaching poor individuals, with effectiveness expressed formally in terms of ‘completeness’ (what proportion of the target population of poor individuals is reached) and ‘efficiency’ (what proportion of the total individuals reached are poor). It considers how different uses of the index influence its effectiveness, and how effectiveness can vary for different sub-groups of the poor. Area-based targeting in policy Area-based targeting in regeneration and social policy has been used by governments since the 1960s. All formal allocation criteria have used some measure of need. However, there has been great variety in the kinds of criteria used, and needs-based criteria have often been supplemented with other concerns. Under the Thatcher and Major governments in the 1980s and early 1990s, the potential for an area to improve was a feature of the allocation of funds for area-based programmes, particularly after the introduction of competition and ‘challenge’ funding with the City Challenge programme in 1991. The competitive Single Regeneration Budget (launched in 1994) became the main programme of area regeneration of the 1990s, with annual bidding rounds.

2
With the election of the New Labour government in 1997, emphasis shifted back to need, although competition, innovation and improvement potential remain features of some programmes. For example the Education Action Zone initiative was designed to tackle under-achievement and low educational standards in deprived areas, but partnerships in any area could apply and three criteria were used to determine which areas were funded: the need for a zone, the level of innovation, and the ability of the partnership to deliver its plans. However, in general, funds have been increasingly targeted to areas of highest need, with central government determining which are to be included. The Single Regeneration Budget in rounds 5 and 6 was open to bids from partnerships anywhere in England, but 80% of the fund was available only for the most deprived local authority areas. Since April 2002, there have been no new SRB schemes, the funding being allocated by Regional Development Agencies as part of their broader economic regeneration role, with no government-fixed area criteria. The government has also introduced its Neighbourhood Renewal Fund, limited to eighty-eight deprived local authorities; Excellence in Cities, a programme to boost educational attainment in specific local education authorities serving areas of high deprivation; Employment Zones, programmes for the long term unemployed in fifteen areas of high unemployment: and New Deal for Communities, its main area-based regeneration programme in thirty nine areas, one in each authority selected by the government on the basis of the 1998 Index of Local Deprivation. Some of these programmes target areas because they have large numbers of individuals in need. However, others target areas because of the area characteristics themselves. For example New Deal for Communities partnerships must, by definition, be based on defined areas whose regeneration is the focus of the programme. Neighbourhood management, similarly, must be defined by neighbourhoods. Table 1 sets out the targeting criteria and indices used by programmes operating since 1997.

3
Table 1: Area-based programmes and the targeting criteria and indices used
Programme No. of LAs (percentage of total)
Size of areas Criteria Deprivation Index used or specific indicators
Other factors Bids required
Single Regeneration Budget (SRB) rounds 5 and 6
65 districts (18%)
Whole district (thematic programme) or smaller area within
Deprivation: districts that came in top 50 on any domain
ILD 1998 20% of funding goes to other areas, particularly those identified by Rural Development Commission
Yes
Education Action Zones (EAZ)
99 (27%) Clusters of schools Innovation
Delivery potential
Need
Specific indicators: Free School meals, low achievement, absence
Yes
Neighbourhood management pilot
83 districts (23%)
Neighbourhoods of 2000-5000 households
Deprivation: districts with more than one ward in top 10%
IMD 2000 NDC districts excluded Yes
Health Action Zones (HAZ)
26 in 73 districts (20%)
Health authorities Deprivation
Quality of bid (one aim is to modernise services)
ILD 1998 and specific indicators
Yes
Excellence in Cities (EiC)
29 so far (8%)
Districts and district clusters
Deprivation
Low educational attainment
Specific indicators: free school meals and attainment
No
New Deal for Communities (NDC)
39 (11%) Neighbourhoods of 1,000-4,000 households
Deprivation ILD 1998 At least one in each DETR/RDA region. Some flexibility
No
Neighbourhood Renewal Fund (NRF)
88 districts (25%)
Districts Deprivation: districts that came in top 50 on any domain
IMD 2000 An additional 7 districts added for transitional funding
No
Employment Zones (EZ)
15 (4%) Districts and district clusters. Up to 48,000 people
High long term unemployment
Low employment rate
Specific indicators: unemployment rates
No
Sure Start 130 (By March 2001) (36%)
Neighbourhoods with 400-800 children aged 0-4
Child poverty ILD 1998 and IMD 2000 boosted with specific indicators - low birth weight and teenage pregnancy
Regional spread and spread of types of areas: inner city, suburban, rural and coalfield
No
Sources: Various. ILD = Index of Local Deprivation; IMD = Index of Multiple Deprivation

4
Table 1 shows that the DoE/DETR family of deprivation indices are widely used, and that all programmes that started after the IMD 2000 was available are making use of it. Likewise, the indices used for deciding which areas should benefit from these programmes do differ from one to another. Programmes which target specific needs (eg unemployment) tend to use specific measures, while programmes that have area regeneration as their focus tend to use composite measures of area deprivation, such as the Index of Multiple Deprivation. The IMD 2000 and earlier DoE/DETR/DTLR measures are also used in combination with specific measures in cases like Sure Start. Section 2 of this report describes some of the major area-based indices of deprivation that have been used in targeting funding. It shows how they can identify different areas and therefore different individuals, and shows how the index currently most commonly used in England, the Index of Multiple Deprivation (IMD) 2000, relates to others in content and results. The rationales for area-based targeting There are several rationales for using area-based deprivation measures to target government funding on some areas and not others. One very important rationale is that the spatial concentration of poor individuals in particular areas means that area-based targeting can be an effective way of reaching poor individuals, offering high level of ‘completeness’ and ‘efficiency’. The spatial patterning of deprivation is an established feature of industrial Britain. As early as the 1840s, Fredrich Engels was investigating the concentration of poverty, deprivation and wealth in Manchester. Spatial patterning of the residence of different class, income, employment and ethnic groups has been a key theme of social investigation and analysis throughout its history (Booth, 1891; Park et al. 1967; Glennerster et al., 1990). A second major rationale for area-based targeting is that concentrated poverty may have cumulative and qualitatively different effects on individuals, organisations, and infrastructure than less concentrated poverty, forming one category of ‘area effects’. This means that in addition to any intervention to support to poor individuals, additional special interventions may be needed to support individuals, organisations and infrastructure in these areas. Thirdly, area-based funding can be used as a form of rationing funding. In some cases, the government makes available new money for a specific purpose which will only be targeted towards areas with specific needs, usually fewer than the total number of areas with those needs, because resources are limited.

5
Administrative convenience can make it simpler to target defined geographical areas than to find other ways of rationing funding between individuals. Competitive bidding may be a feature of the allocation process, but more often the government will specify the areas that will be funded, provided they produce satisfactory plans for how to spend the money. Fourthly, area-based funding may be used to fund some areas not others if the programme is a pilot, which may eventually be rolled out more widely, possibly even nationwide. In these cases, need is a criteria, but so is the ability to innovate and to deliver effectively, so as to develop good models for the future. Areas helped by these kinds of programmes are not always the most needy, because the ability to demonstrate success is an important part of the programme. Competitive bidding is almost always a feature of the allocation process in these cases. Fifthly, an area focus brings additional benefits to programme deliverers, such as the input of residents or partnership between different agencies. Some of these benefits could spin off to policy or the work of agencies in other areas. Policy-makers often use more than one rationale for area-based targeting, but usually include the ‘effectiveness’ explanation amongst their arguments. Certainly it would seem a wasteful and unfair use of public money if it targeting was very incomplete, so that tiny proportions of the poor were in the areas benefiting, or very inefficient, so that huge proportions of residents in areas benefiting were not poor. This makes it a particularly important rationale. Throughout their history, area-based funding policies, and particularly the first two rationales for them, have come in for criticism. Many of the objections have been levelled at the idea that small geographical areas such as wards or groups of wards within cities are a sensible unit around which to organise and implement policy. This relates to the second rationale, about additional area effects, which implies that area-based policies may have a role. Oatley (2000) suggested that by focusing on area the government is positioning area as the unit at which remedies can be implemented – ‘a new pragmatism’ that denies the structural roots of economic and social problems. Similarly, Plewis (1998) suggested that Education Action Zones were a high profile sticking plaster – a way for the government to be seen to be doing something while actually impacting on a very small proportion of the affected population. He noted that the first round of EAZs covered 2% of schools, whereas one-third of children were living in households with below half average income. And practitioners often criticise area-based policies for being short term and time-limited, iniquitous because they require equally needy areas

6
to bid against each other, undemocratic because they are often controlled by unelected partnerships, and a vehicle for central control under the guise of local flexibility. These arguments have been very well rehearsed elsewhere (see in particular Smith 1999). We suggest that area-based policies may be particularly useful where they tackle the decline in spatially located phenomena such as housing, facilities and services, where it is the area itself which is the intended unit of change. Another major set of objections to area-based policy addresses the first rationale. In cases where the intended beneficiary of the funding is not an area but a collection of individuals (e.g. people who are poor, people who have health problems or people who are unemployed) or institutions (eg poorly performing schools). The question here is whether area can effectively be used as a mechanism for targeting these beneficiaries. Assuming populations are not perfectly segregated by income and that all areas are therefore to some degree mixed, a degree of inefficiency is built into targeting by area, because people who are not the intended beneficiaries will be included. At the same time, the targeting will be incomplete, because intended beneficiaries living outside the area will be excluded. This is the criticism levelled in the very early stages of area-based targeting of policy in the 1960s. Barnes and Lucas argued in 1975 that Educational Priority Areas (EPAs), not unlike today’s Education Action Zones (EAZs), were flawed because they were incomplete, and that for every two disadvantaged children who were in EPA schools there were five outside them. Townsend, in his landmark study of poverty, made the very strong claim that:
however we care to define economically or socially deprived areas, unless we include over half the areas in the country there will be more poor persons or poor children living outside them than in them (1979, p560).
In a major 1990s study comparing the content and results of a set of ten deprivation indices, many of which had been used by government in targeting funding, Lee et al. (1995) found that on average, the poorest 10% of wards identified by the indexes included 29% of the total unemployed, 29% of the total households with no cars and 37% of the total overcrowded households in the areas they covered. Deprived individuals were concentrated in these areas. However, the majority of unemployed people, households without cars and overcrowded households were found in other wards, outside the top 10%, whichever index was used.
7
While completeness can be increased simply by adding more areas, this seems likely to lead to increased inefficiency. If we assume that the areas included initially were those where the intended beneficiaries were concentrated, adding areas can only become a more and more inefficient process. Intuitively, it appears likely that there will be a trade-off between completeness and efficiency. However, in some areas targeting may be both relatively complete and efficient, because of the extent or patterning of deprivation. Research by CASE found clusters of up to twenty-six contiguous ‘poverty wards’, making very large areas which dominated parts of Liverpool, Manchester, Birmingham. This ‘clustering’ pattern means that residents of poor wards can make up the majority of the population in some urban districts. CASE found that 57% of Tower Hamlets’ population lived in areas defined as ‘poverty wards’ in the top 3% nationwide (Glennerster et al., 1999). Danson and Mooney (1998) questioned the idea of a spatially concentrated, distinct group of poor people within Strathclyde, because serious deprivation was so widespread across the area. Shucksmith et al. (1996) also argued that in some remote rural areas almost the whole population is poor. Similarly, greater completeness and efficiency may be achieved for some measures of deprivation than for others. Smith (1999) found that exactly half of the nation’s unemployed lived in the sixty five most deprived districts on the Index of Local Deprivation (ILD) 1998 that had been targeted for the Single Regeneration Budget, and that these made up only a fifth of the total districts, although they were likely to contain more than a fifth of the population. Compared to the notorious methodological challenges of identifying and measuring ‘area effects’ that investigation of the second rationale for area-based targeting presents, testing the first rationale is a fairly straightforward empirical process. However, it has not been carried out very often or in great depth, particularly so since the development of a new wave of area targeting since 1997 and the new comprehensive index for this purpose, the IMD 2000. In section 3 this paper aims to fill this gap, to update and broaden the assessment of the validity of the effectiveness rationale for using area-based indices to target funding. It demonstrates how effective the IMD 2000, used to target several current funding programmes (Table 1) is in reaching poor individuals. It looks at effectiveness in terms of ‘completeness’ (what proportion of the target population is reached) and ‘efficiency’ (what proportion of the total individuals reached are poor). It considers how different uses of the index such as its use at region, district and ward scales, influence its effectiveness, whether the intuitive trade-offs between completeness and

8
efficiency are found in practice and how effectiveness can vary for different sub-groups of the poor.
2. The area-based indices used in targeting funding
In considering the extent to which area-based indices are effective in targeting needy individuals, a first issue is to establish what indices are being used and what elements of need they are attempting to measure. Over the last century, a plethora of measures of area deprivation have been developed (eg. Lee et al., 1995; Dorling, 1997), identifying areas as absolutely or relatively deprived, or as containing greater or lesser concentrations of deprived individuals or households, using different measures of ‘deprivation’, and weighted differently. Some measures produce an absolute score for deprivation but many give a relative outcome, usually expressed in a ranking of different areas. Despite the fact that it has been the sponsor and user of a large number of influential area-based indices of deprivation, the DETR stated on its website, “there is no definite way of deciding which areas are deprived and which are not” (www.detr.gov.uk/regeneration accessed 2001). Appendix 1 includes a summary of the main indices of area deprivation used over the last twenty years. We briefly introduce these here. They include Census-dependent indices developed for the Department of the Environment (DoE) and Department of the Environment, Transport and the Regions (DETR)
1
principally to aid targeting of urban regeneration funding, indices developed for the purposes of targeting health care spending, and a range of other indices developed for different purposes. DOE/DETR indices of deprivation These indices were principally developed for England,
2 beginning with the 1981
DoE Index of Deprivation based on the Census of that year. This contained three ‘domains’ or conceptual and empirical sub-areas (economic activity, housing and social groups), which were used as indirect measures of deprivation. It used very simple weighting, with unemployment being double-weighted. This index was also widely used by local authorities at ward level. In 1991 it was updated by researchers at Manchester University (Robson et al, 1995). This 1991 Index of Local Conditions (ILC) used a wider range of
1 From 2001 DTLR, the Department of Transport, Local Government and the Regions,
and since 2002 ODPM, the Office of the Deputy Prime Minister.
2 They have also been applied to Scotland and Wales (Lee et al., 1995), and separate but related indices have been developed for Scotland and Wales.
9
indicators, including economic inactivity, low income, education and health, and more complex statistical processes. In turn this was updated in 1995, when Carstairs (2000, p56) noted that the DoE 1995 index variables “do not focus specifically on a concept of deprivation”, and included general ‘local conditions’. In 1998 a further Index of Local Deprivation (ILD) was developed by DETR. The most recently developed index is the Index of Multiple Deprivation (IMD) 2000. This was developed by researchers at Oxford University for the DETR from the earlier DoE indices (1981; 1991; 1995; and 1998). The IMD 2000 has broken new ground. It covers a wide range of domains of deprivation, including income, employment, health and disability, education, skills and training, housing, and access to services. It has a very large number of indicators (thirty-three compared to twelve in the 1998 ILD), and makes use of new data sources including administrative sources which are more up to date and comprehensive than survey or Census data. It includes specific indicators for different age groups and gives heavy weight to indicators in the income and employment domains, together counting for half of the final score. Indices used to target health care spending The ‘Jarman’ index, described in the 1990s as ‘probably the most ubiquitous’ (Lee et al., 1995 p23) alongside DoE and DETR indices, was developed to guide the targeting of funding for primary health care (Jarman, 1983; 1984). It used a survey of doctors to develop a list of indicators, including the presence of particular social and demographic groups, associated with higher demand for services. Data were drawn from the Census, the indicators were weighted (with, for example, elderly people living alone scoring 6.62 and unemployment scoring 3.34) and results checked with the survey. The ‘Carstairs’ index was developed in the mid 1980s to measure relative material deprivation using the Census (McLoone, 1994). It has been widely used to investigate the relationship between deprivation and ill health (Carstairs and Morris, 1990). It initially used 1981 Census data on male unemployment, car ownership, overcrowded households, and social class, and was later updated with 1991 Census data. The ‘Arbuthnott’ index was developed by the Scottish Executive to update the twenty-year old formula used to distribute funding between health authorities in Scotland. Statistical analysis was used to identify indicators that appeared best correlated with differences in health service use. These included standardised mortality rate, the proportion of households having two or more deprivation indicators taken from the Scottish Area Deprivation Index (known as ‘Scotdep’; see below), unemployment benefit and elderly people claiming Income Support.

10
Other indices Over the last two decades, a number of other Census-dependent and area-based indices have been developed which both draw on and challenge the DoE and DETR indices. The ‘Townsend’ index focuses on material deprivation. It has been used extensively to investigate health inequalities and poverty (eg. Townsend, 1987; Townsend and Davison, 1988). The ‘Scotdep’ index also focuses on material deprivation. It was developed to investigate health inequalities and deprivation in Scotland, and is similar to Townsend index except that it does not use a housing tenure indicator, which was seen as less desirable as an indirect rather than direct measure (Carstairs and Morris, 1990). The ‘Oxford’ index was developed by researchers at Oxford University, who wanted to focus on low income rather than deprivation. Administrative data on benefit take-up, seen as a direct measure of low income, was used to identify indicators available in the Census which were most closely associated with low income, which were weighted complexly and checked against the benefit data. The ‘Bradford’ index was developed by Bradford MBC as an alternative to the DoE’s 1981 index, which had been seen as favouring London and the south over northern local authorities, and to identify areas of absolute ‘stress’ rather than relative deprivation (Lee et al., 1995). Like the DoE’s 1981 index, it included economic, social and housing domains, but added an income domain and used administrative data not available in the Census. Researchers at Bristol University developed two indices to make use of the 1991 Census, ‘Matdep’ and ‘Socdep’. They wanted to establish a clear separation between measures of material deprivation and those for social deprivation, which is closer to social exclusion, and to maintain the distinction between direct and indirect measures (Forrest and Gordon, 1993). The ‘Breadline Britain’ index used data from a survey of public opinion, originally carried out in 1983 and updated in 1990, on activities and possessions to develop a list of publicly perceived necessities (Townsend, 1979; Mack and Lansley, 1985). These data were used to establish an income threshold and to identify indicators which, when weighted, were associated with people falling below this threshold, which could be checked back to the survey data. CASE developed a measure to identify areas of extreme poverty at ward level in England and Wales, indentifying wards that appeared in the top 5% on the Breadline Britain index and the top 5% for the proportion of people of working age who were not working, studying or on a government training scheme from the Census 1991. This comprised 284 wards or about 3% of the total (Glennerster et al., 1999).

11
Indices of social exclusion It is worth noting that although the focus of current government policy is social exclusion, rather than the more limited concept of multiple deprivation, none of the indices thus far mentioned measure social exclusion directly. The concept of social exclusion is inherently multi-dimensional, and domains of social exclusion that have been identified include economic activity, income, housing, education, health and others (Room, 1995; Barry, 1998; Burchardt et al., 1999; Byrne, 1999), but it also incorporates elements that go beyond material deprivation and poverty, such as lack of social interaction and participation, the agency of the excluded and the excluders, and the role of subjective attitudes. Social exclusion is concerned with process, and may develop if poverty or disadvantage are sustained over time. All of these elements make social exclusion difficult to define and measure. Indeed, some researchers have argued that it is not possible or desirable to develop a measure of social exclusion, as the concept is inherently qualitative or dynamic, or because this might stigmatise those identified as ‘the excluded’. We have identified four major attempts in the UK to measure social exclusion. Burchardt et al. (1999) used the British Household Panel Study to measure the amount of exclusion in Britain over a range of domains between 1991 and 1995. They considered how different cut- off points in the indicators would yield different results for the extent of exclusion, the relationships between different exclusion domains, and the persistence of exclusion over time. Disaggregation to regional level is possible in theory but has not yet been carried out. The Department of Social Security (DSS) developed a set of thirty two indicators designed to measure six aspects of social exclusion, incomes, employment, health, housing, fuel poverty and fear of crime, with separate indicators for children, people of working age and people of retirement age (DSS, 1999). This was intended as a tool for central government to assess progress on social exclusion and to monitor the effects of national policy. It has been disaggregated to regional level (Bardgett and Vidler, 2000). Gordon et al. (2000) have developed the ideas of poverty as measured by the inability to afford items which the majority defined as ‘necessities’ used for the Breadline Britain index, using a survey of public opinion, a wide range of administrative data, and a concept of social exclusion rather than deprivation. And finally, Rahman et al (2000) developed a range of measures of social exclusion, rather than a single index. It was intended to measure trends over time and includes society-wide measures such as the degree of income inequality overall as well as measures relating to individuals, households, and different demographic groups. The team has produced a series of annual reports (Howarth et al., 1998; Howarth et al., 1999; Rahman et al., 2000).
12
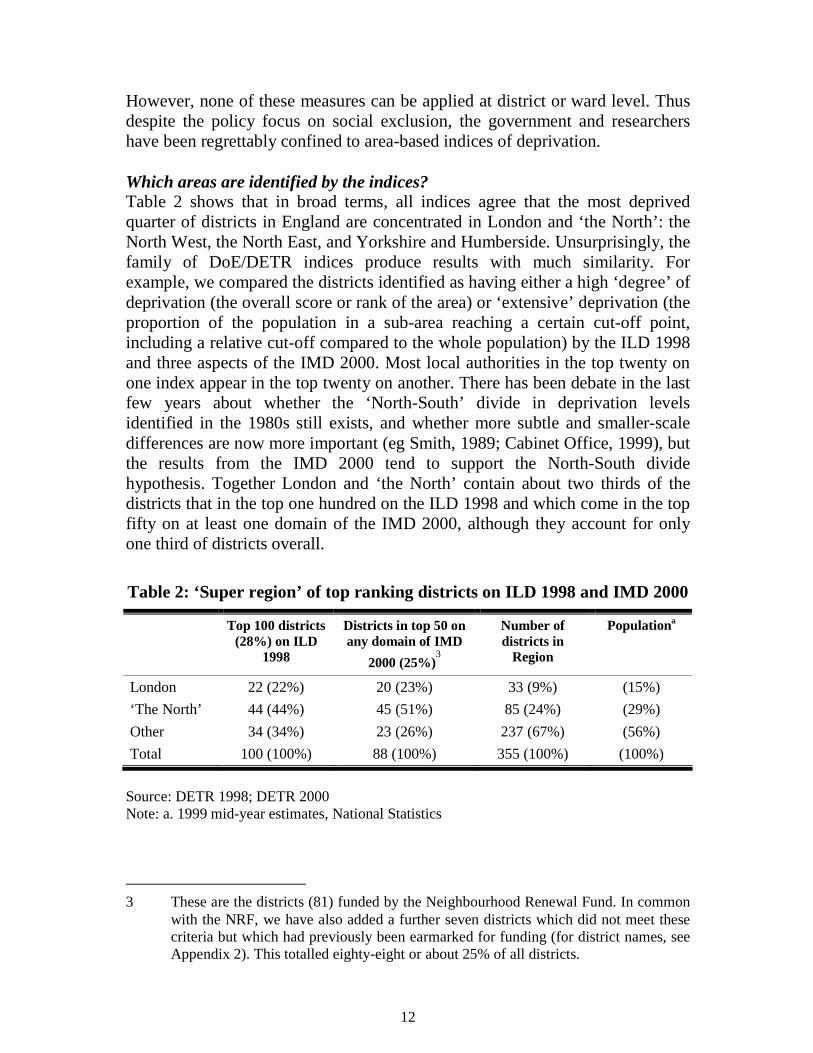
However, none of these measures can be applied at district or ward level. Thus despite the policy focus on social exclusion, the government and researchers have been regrettably confined to area-based indices of deprivation. Which areas are identified by the indices? Table 2 shows that in broad terms, all indices agree that the most deprived quarter of districts in England are concentrated in London and ‘the North’: the North West, the North East, and Yorkshire and Humberside. Unsurprisingly, the family of DoE/DETR indices produce results with much similarity. For example, we compared the districts identified as having either a high ‘degree’ of deprivation (the overall score or rank of the area) or ‘extensive’ deprivation (the proportion of the population in a sub-area reaching a certain cut-off point, including a relative cut-off compared to the whole population) by the ILD 1998 and three aspects of the IMD 2000. Most local authorities in the top twenty on one index appear in the top twenty on another. There has been debate in the last few years about whether the ‘North-South’ divide in deprivation levels identified in the 1980s still exists, and whether more subtle and smaller-scale differences are now more important (eg Smith, 1989; Cabinet Office, 1999), but the results from the IMD 2000 tend to support the North-South divide hypothesis. Together London and ‘the North’ contain about two thirds of the districts that in the top one hundred on the ILD 1998 and which come in the top fifty on at least one domain of the IMD 2000, although they account for only one third of districts overall.
Table 2: ‘Super region’ of top ranking districts on ILD 1998 and IMD 2000
Top 100 districts (28%) on ILD
1998
Districts in top 50 on any domain of IMD
2000 (25%)3
Number of districts in
Region
Populationa
London 22 (22%) 20 (23%) 33 (9%) (15%)
‘The North’ 44 (44%) 45 (51%) 85 (24%) (29%)
Other 34 (34%) 23 (26%) 237 (67%) (56%)
Total 100 (100%) 88 (100%) 355 (100%) (100%)
Source: DETR 1998; DETR 2000 Note: a. 1999 mid-year estimates, National Statistics
3 These are the districts (81) funded by the Neighbourhood Renewal Fund. In common
with the NRF, we have also added a further seven districts which did not meet these criteria but which had previously been earmarked for funding (for district names, see Appendix 2). This totalled eighty-eight or about 25% of all districts.

13
Yet the indices do produce important differences. These are particularly clear when examining which individual areas are identified. For example, only Hackney, Liverpool, Manchester and Tower Hamlets are in the top twenty on all indices shown. The total number of local authorities that reach top twenty positions is over fifty. Great Yarmouth is ranked fifth in the country on the extent of deprivation on the IMD 2000, but does not feature in the top twenty on the degree of deprivation on the same index, or on the ILD 1998. It is not clear the extent to which changes in index position reflect ‘real change’ or changes in measurement. However, they clearly have significant policy implications when they are used in targeting funding. Table 3 moves to the regional distribution of deprived wards, and shows that 45% of the English wards in the top 3% in Great Britain on DoE 1991 were in London, while only 18% were on IMD 2000, and only 11% were on CASE’s index. 7% of the English wards in the top 3% in Great Britain on DoE 1991 were in the North East, while 21% were on CASE. The proportion of the top ranking 3% of wards identified in all regions except the West Midlands and Yorkshire and Humberside varied between the indices by a factor of at least two. The differences between indices in Table 3 are greater than those in Table 2 partly because the analysis is at ward level, and also because it covers a smaller fraction of potentially more extreme areas, and a wider range of indices. Different indices appear to emphasise different areas, because of the measures and statistical process used to create them. For example, it has been noted that London is emphasised by indices that use overcrowding (Lee et al., 1995 p 59), children in unsuitable accommodation, non-ownership of cars and rented tenure (Green, 1994), which are all prevalent there (see Appendix 1 for details on the indicators used in different indices). London is disfavoured by measures that include income, because while incomes are higher there than in other parts of the country, so is the cost of living. Both poverty and wealth are manifested distinctively in London (CACI, 1999 p 8), with different correlations between income and home and car ownership, for example. Indices that tend to favour London compared to other indices examined include DoE 1981, DoE 1991, Jarman, Oxford, Bradford, and Matdep. Carstairs and Morris (1990) noted that Jarman was often criticised for favouring inner city areas. Significantly, the IMD 2000 tends to disfavour London compared to earlier indices used by the DETR. There have been successive moves towards indices that de-emphasise London. The Mayor of London, and the Association of London Government have criticised the IMD 2000 for reducing the emphasis on London seen in the ILD 1998 (West, 2000). The DoE 1991 index reduced the emphasis on London seen in the DoE 1981 index. Socdep and CASE also appear to disfavour London.

14
Table 3: Regional location of top ranking 3% of wards in the UK on a range of indices as a percentage of English total
Jarm
an
Tow
nsen
d
DoE
198
1
DoE
199
1
Bre
adlin
e
Scot
dep
Socd
ep
Mat
dep
CA
SEc
Bra
dfor
d 19
93
Oxf
ord
IMD
200
0
Tot
al p
opul
atio
nd
Englanda 83 71 86 73 71 72 80 75 90 74 75 100
‘Super-Region’b
London 36 39 45 45 30 31 18 33 11 33 40 18 15
North’ 35 32 28 31 50 49 52 38 56 46 42 45 29
Other 29 29 27 24 20 20 30 29 34 21 18 37 56
Region
London 36 39 45 45 30 31 18 33 11 33 40 18 15
N.East 10 14 6 7 21 17 20 5 21 13 13 15 5
N. Weste 17 18 15 15 21 21 23 21 28 22 22 21 14
Yorks/Humber 8 7 7 9 8 11 9 12 7 11 7 9 10
W. Mids 7 7 7 7 7 8 5 8 6 5 7 9 11
E. Mids 6 6 5 3 6 6 6 4 5 4 5 10 8
Eastern 1 1 1 1 1 1 1 1 1 1 1 5 11
S. East 11 6 11 9 4 6 4 9 1 4 5 7 16
S. West 4 1 4 3 3 3 1 8 1 3 3 6 10
Sources: Adapted from Lee et al., 1995; DETR, 2000; Glennerster et al., 1999 Note: a. Some of the indices were applied to the whole UK or to England and Wales, so that not all the top 3% wards were in England; b. As a percentage of those in England; c. Slightly more than 3% as based on 284 ‘poverty wards’ rather than 250; d. 1999 mid-year estimates, National Statistics; e. ‘North West’ includes Merseyside category from CASE index. Summary A large number of indices of deprivation, need for health care spending and other indices of needs are available, although there are none that identify socially excluded areas below regional scale. Different indices have been developed for different purposes, and are based on different concepts, measures and statistical processes. In very broad terms, the different indices produce similar results, for example in identifying high proportions of districts and wards that are deprived or which

15
require high health care spending in the ‘super regions’ of London and the North of England. However, there are important differences in the areas identified by different indices, even within the family of deprivation indices. This is particularly true when targeting a smaller proportion of areas, or areas with a smaller population such as wards rather than districts or regions. As the indices are used in targeting government spending these differences in areas targeted have important implications, and mean that different areas and different individuals will benefit. As the IMD 2000 has become the most up to date and widely used index for policy purposes (Table 1), and as we must limit analysis of effectiveness in targeting individuals to just one index, it is this index that we use for the remainder of the analyses in this paper. Compared to other indices, the IMD 2000 appears to favour the West Midlands, the East Midlands, the Eastern region and the South West (Table 3). Objective changes in regional conditions between the development of earlier indices and the IMD 2000 could explain at least some of this difference. However, the distinctive characteristics of the concepts behind the IMD 2000, the domains and indicators used and the way they are combined together must also be at least partly responsible (see Appendix 1). This should be borne in mind when interpreting information on the location and targeting of deprivation through the IMD 2000.
3. The effectiveness of area-based targeting in reaching poor individuals
In this section we look at how efficiently and completely the Index of Multiple Deprivation 2000 targets individuals, when used in different ways. As discussed above, none of the measures of individual social exclusion we have described can be disaggregated below regional level. The indices of deprivation are mostly not applicable to individuals. Therefore, we cannot assess how well the IMD 2000 captures socially excluded or multiply-deprived individuals. What can be assessed at local level is how well the IMD 2000 captures those on low incomes as measured by the number of people claiming

16
income-based Job Seeker’s Allowance or Income Support.4,5
For greater accuracy and for ease of expression, we refer hereafter to ‘targeting the poor’, rather than targeting social exclusion. However, it is important to note that, while the JSA/IS measure is the only measure of low income that is reliable at small area level, it defines poverty narrowly. Only adult claimants are included, not their dependants. In-work poverty is not included, which may lead to an underestimation of poverty in low wage areas. There is no way of taking account of low benefit take-up: more people may be eligible for these benefits than claim them. On the other hand, some JSA claimants may not be in long-term poverty, just experiencing a short period of unemployment. Other indicators of poverty, were they available at small area level, would produce different results. However, the use of this measure does enable us to gain an indication of the correspondence between area measures and individual measures. Section 2 showed that the extent of differences in areas identified by different indices varied by spatial scales, and suggested that differences in the concepts and measures used in indices could affect the individuals identified. In this section, we examine how complete and how efficient it is to reach poor individuals by targeting poor areas identified by the IMD 2000. We look at different spatial scales, regions, then districts and wards. Then we examine how complete and how efficient the area targeting was in identifying sub-groups amongst the poor: the rural poor, the unemployed poor and children in poor households. Targeting different spatial scales REGIONAL LEVEL Tables 2 and 3 demonstrate that targeting ‘the North’ and London is a fairly complete way to capture deprived districts and wards. 73% of the top ranking 25% of districts and 63% of the top ranking 3% of wards are in London or ‘the North’. In terms of capturing poor individuals, as defined by IS/JSA claims, targeting London and the North super regions captures over half of the complete population of poor individuals, as well as over half of the deprived areas. 54% 4 These measures are of course inter-related with the IMD to some extent since the
index incorporates measures of the numbers of people claiming JSA/IS (Appendix 2). The data used in this paper was taken from the 1998 DSS benefit scan.
5
To compare percentages of people on low incomes with perecentages of people covered by the IMD 2000 at its different cut-off points, we have used population counts taken from the Oxford 1998 estimates.
17
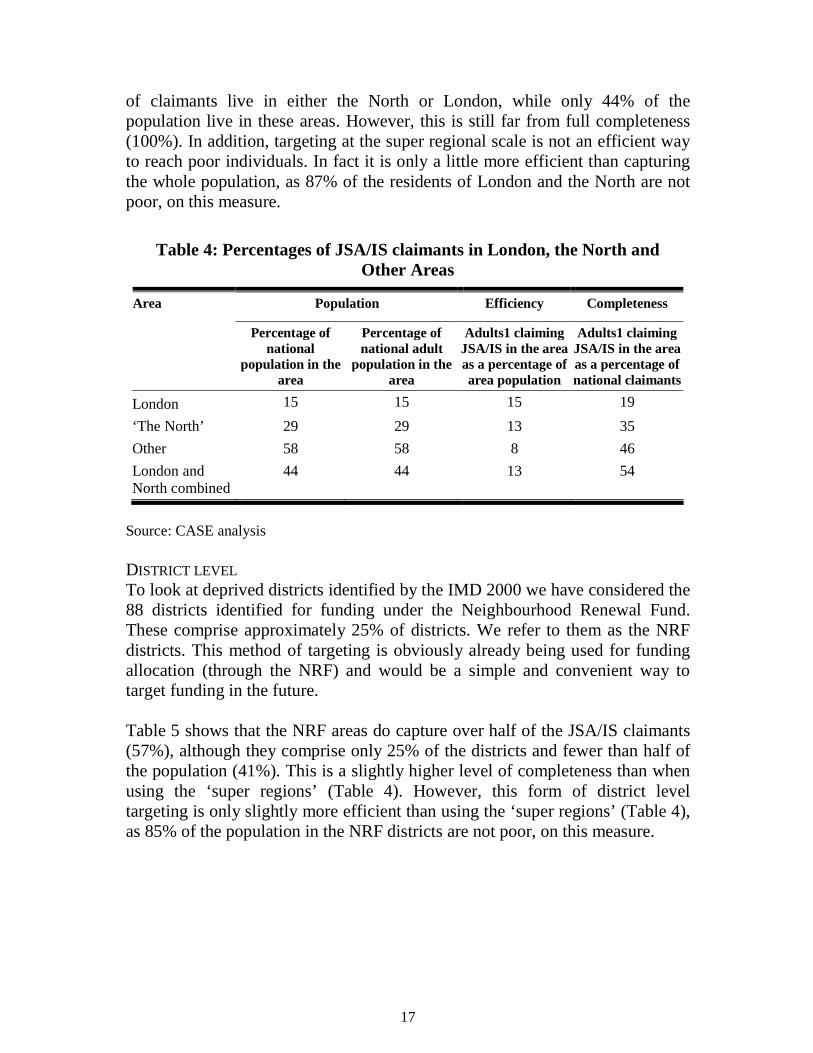
of claimants live in either the North or London, while only 44% of the population live in these areas. However, this is still far from full completeness (100%). In addition, targeting at the super regional scale is not an efficient way to reach poor individuals. In fact it is only a little more efficient than capturing the whole population, as 87% of the residents of London and the North are not poor, on this measure.
Table 4: Percentages of JSA/IS claimants in London, the North and Other Areas
Population Efficiency Completeness Area
Percentage of national
population in the area
Percentage of national adult
population in the area
Adults1 claiming JSA/IS in the area as a percentage of area population
Adults1 claiming JSA/IS in the area as a percentage of national claimants
London 15 15 15 19
‘The North’ 29 29 13 35
Other 58 58 8 46
London and North combined
44 44 13 54
Source: CASE analysis DISTRICT LEVEL To look at deprived districts identified by the IMD 2000 we have considered the 88 districts identified for funding under the Neighbourhood Renewal Fund. These comprise approximately 25% of districts. We refer to them as the NRF districts. This method of targeting is obviously already being used for funding allocation (through the NRF) and would be a simple and convenient way to target funding in the future. Table 5 shows that the NRF areas do capture over half of the JSA/IS claimants (57%), although they comprise only 25% of the districts and fewer than half of the population (41%). This is a slightly higher level of completeness than when using the ‘super regions’ (Table 4). However, this form of district level targeting is only slightly more efficient than using the ‘super regions’ (Table 4), as 85% of the population in the NRF districts are not poor, on this measure.

18
Table 5: Percentage of JSA/IS claimants in districts identified by the IMD 2000
Population Efficiency Completeness Area
Percentage of national
population in the area
Percentage of national adult
population in the area
Adults1 claiming JSA/IS in the area as a percentage of area population
Adults1 claiming JSA/IS in the area as a percentage of national claimants
England
100
100
10
100
NRF districts
41
40
15
57
Source: CASE analysis As Neighbourhood Renewal funding and some other programmes (Table 1) are being targeted on these districts, it means that they will miss 43% of poor individuals nationwide, while 85% of individuals in districts receiving funding will not be poor according to the JSA/IS measure. Local authorities are asked by central government to target funding further on particular neighbourhoods, and have some freedom to choose targeting mechanisms. They may be able to achieve greater effectiveness and efficiency in reaching the poor residents within these districts. Our analysis suggests that this will be critical, since overall, in terms of effectiveness in reaching poor individuals, district-level targeting offers no more what seems like the very crude option of targeting all districts in London and the North. Both reach around the same proportion of the total population: 44% for the super regions and 41% for the NRF districts. Of course, government may have had other rationales for district-based targeting, such as piloting public service reforms in a range of areas, or other motivations beyond needs-based criteria, such as perceived fairness to different regions. However, this evidence shows that the super region targeting strategy would have been just as fair, in terms of its coverage of poor individuals, as the one adopted. WARD LEVEL We then looked at targeting using deprived wards as identified by the IMD 2000. We examined the effect of targeting at a full range of cut-off points at 10% intervals, to investigate potential trade-offs between completeness and efficiency. We were particularly interested in the 20% and 10% cut offs, as they have been used in targeting policy (Table 1), and added an additional cut-off point at the top ranking 5% of wards (420 wards).

19
Using the top 20% of wards is slightly less complete as a targeting tool than using the NRF districts, although it still captures over half the claimants (51%). However, using the ward mechanism is more efficient than using the districts, as the 20% of wards contain together much less than half the population (29%), and lower number and proportions of non-low income individuals. 19% of people in the top 20% of wards are poor, compared with 10% nationally and 15% in the NRF districts. Table 6 demonstrates that there is a trade-off between completeness and efficiency, so that including a smaller number of wards is less effective in terms of completeness, but more efficient.
Table 6: Percentages of JSA/IS claimants in wards identified by the IMD 2000
Area Population Efficiency Completeness
Percentage of national
population in the area
Percentage of national adult
population in the area
Adults claiming JSA/IS in the area as a percentage of area population
Adults claiming JSA/IS in the area as a percentage of national claimants
All wards 100 100 10 100 Top 90% wards 91 91 11 97
Top 80% wards 84 83 12 94
Top 70% wards 76 76 12 90
Top 60% wards 72 71 13 88
Top 50% wards 60 59 14 80
Top 40% wards 51 50 15 73
Top 30% wards 40 39 17 64
Top 20% wards 29 28 19 51
Top 10% wards 15 14 22 31
Top 5% wards 8 7 26 18
Source: CASE analysis This table could be a useful support to targeting policy. Different policies may want to pick different combinations of completeness and efficiency, depending on total resources to be distributed and the nature of the programme. However, all these targeting options are of limited efficiency because in each group of wards, including the group of the 5% highest-ranking wards, the vast majority of residents are non-poor, according to this definition of poverty. While completeness more than quadruples when moving from the top 5% of

20
wards to the top 50%, efficiency only doubles when moving from the top 50% of wards to the top 5%. SUMMARY This evidence on the effectiveness of area targeting in reaching poor individuals has shown that Townsend’s claim, referred to in the introduction, that, “however we care to define economically or socially deprived areas, unless we include over half the areas in the country there will be more poor persons or poor children living outside them than in them” (1979, p560), can be disproven, whether deprived areas are defined as the London and the North super regions, the high ranking 25% of districts or the top ranking 20% wards. This table compares the effectiveness of targeting poor individuals through areas of different spatial scales, but with similar total populations.
Table 7: Effectiveness of targeting areas at different spatial scales
Population Efficiency Completeness Area
Percentage of national
population in the area
Percentage of national adult
population in the area
Adults claiming JSA/IS in the area as a proportion of area population
Adults claiming JSA/IS in the area as a proportion of national claimants
London and ‘the North’
44 44 13 54
NRF districts 41 40 15 57
Top 30% wards 4% 39 17 64
Source: CASE analysis Both completeness and efficiency can be improved by targeting areas at smaller spatial scales, while holding total population constant. While the difference between super region scale and NRF district scale is limited, the difference between super region scale and ward scale is important, and there is a particular improvement in completeness. However, Townsend’s claim actually set a fairly low standard of effectiveness for area targeting. The evidence has also demonstrated a clear trade-off between completeness and efficiency in targeting differing proportions of the total number of areas, although the pattern is not perfectly linear. It is not possible to achieve high levels of completeness and efficiency, given the current patterning of poor individuals generally. In addition, while completeness more than quadruples when moving from the top 5% of wards on the IMD 2000 to the top
21
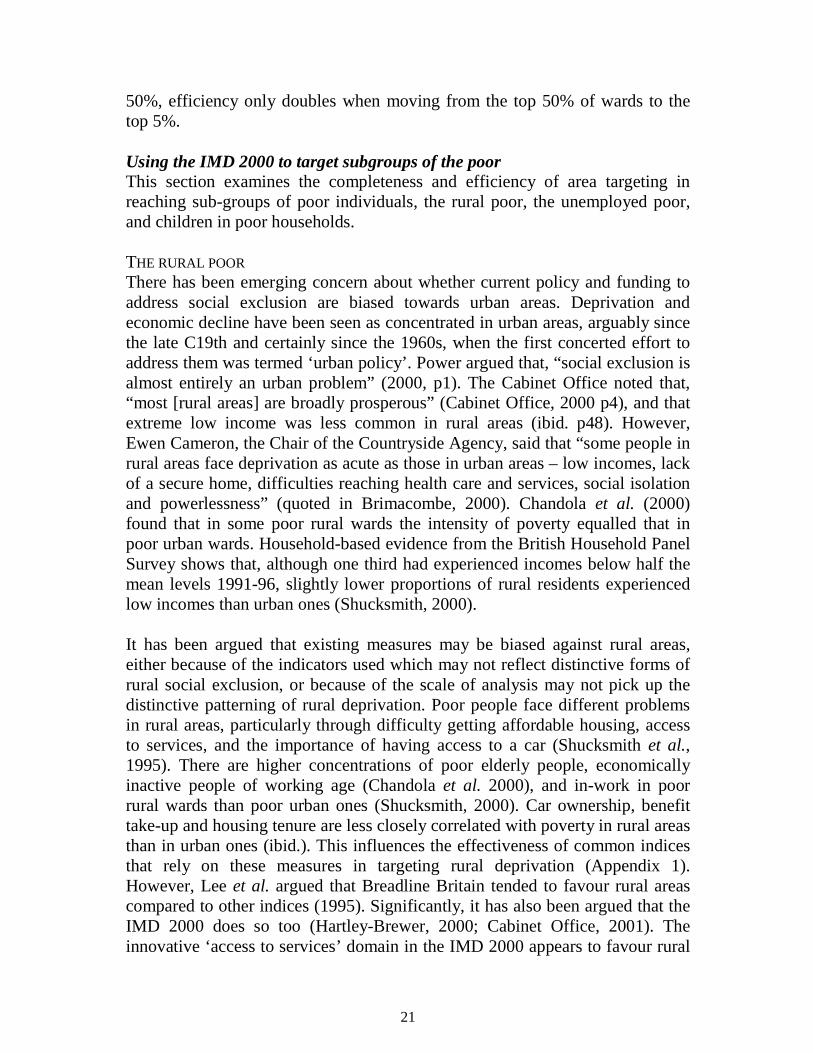
50%, efficiency only doubles when moving from the top 50% of wards to the top 5%. Using the IMD 2000 to target subgroups of the poor This section examines the completeness and efficiency of area targeting in reaching sub-groups of poor individuals, the rural poor, the unemployed poor, and children in poor households. THE RURAL POOR There has been emerging concern about whether current policy and funding to address social exclusion are biased towards urban areas. Deprivation and economic decline have been seen as concentrated in urban areas, arguably since the late C19th and certainly since the 1960s, when the first concerted effort to address them was termed ‘urban policy’. Power argued that, “social exclusion is almost entirely an urban problem” (2000, p1). The Cabinet Office noted that, “most [rural areas] are broadly prosperous” (Cabinet Office, 2000 p4), and that extreme low income was less common in rural areas (ibid. p48). However, Ewen Cameron, the Chair of the Countryside Agency, said that “some people in rural areas face deprivation as acute as those in urban areas – low incomes, lack of a secure home, difficulties reaching health care and services, social isolation and powerlessness” (quoted in Brimacombe, 2000). Chandola et al. (2000) found that in some poor rural wards the intensity of poverty equalled that in poor urban wards. Household-based evidence from the British Household Panel Survey shows that, although one third had experienced incomes below half the mean levels 1991-96, slightly lower proportions of rural residents experienced low incomes than urban ones (Shucksmith, 2000). It has been argued that existing measures may be biased against rural areas, either because of the indicators used which may not reflect distinctive forms of rural social exclusion, or because of the scale of analysis may not pick up the distinctive patterning of rural deprivation. Poor people face different problems in rural areas, particularly through difficulty getting affordable housing, access to services, and the importance of having access to a car (Shucksmith et al., 1995). There are higher concentrations of poor elderly people, economically inactive people of working age (Chandola et al. 2000), and in-work in poor rural wards than poor urban ones (Shucksmith, 2000). Car ownership, benefit take-up and housing tenure are less closely correlated with poverty in rural areas than in urban ones (ibid.). This influences the effectiveness of common indices that rely on these measures in targeting rural deprivation (Appendix 1). However, Lee et al. argued that Breadline Britain tended to favour rural areas compared to other indices (1995). Significantly, it has also been argued that the IMD 2000 does so too (Hartley-Brewer, 2000; Cabinet Office, 2001). The innovative ‘access to services’ domain in the IMD 2000 appears to favour rural

22
areas (Appendix 1). The map of the poor access to services domain in the Welsh IMD 2000 closely relates to the location of rural areas, and is almost the opposite to maps identifying low income and low employment domains (Crompton and Blair, 2000). The debate over the ‘urbanity’ of deprivation and low income is hampered by difficulties in the definition of ‘rural’ and ‘urban’ areas (Cabinet Office, 2000). We have used the Countryside Agency’s definition of rural districts using ‘SOCCODE’, which identified 146 of districts or 41% of the total, as rural. SOCCODE was derived from work by the Rural Development Commission, with adjustments for the 1998 changes to district boundaries. Researchers at Oxford University modelled SOCCODE down from district level to create a ward classification, ‘Oxford-CA’, using the variables of population density, the ratio of economically active population to economically inactive population, people who use public transport, people engaged in primary production and agriculture, and percentage of non-white residents. It identified 4,078 wards as rural, or 48% of the total. The areas identified as deprived through the IMD 2000 are predominantly urban. This is particularly stark at district level. The proportion of the NRF districts which are rural according to SOCCODE is 6%, compared to 41% for English districts overall. The proportion of wards in the top 5% on the IMD 2000 that are rural according to Oxford-CA is 5%. For the top 10% wards on the IMD 2000 the figure is 9% and for the top 20% it is 13%, compared to 48% of English wards overall. As a result, few of the rural poor live in district or ward areas identified as deprived by the IMD 2000. Nearly a fifth (18%) of all JSA/IS claimants are in rural areas but only 5 per cent of these rural poor live in NRF districts, and 16 per cent in the top 20% of wards on the IMD 2000. Figure 1 demonstrates that the IMD 2000 is much less complete in capturing the rural poor than the urban poor. Using the top 20% of wards on the IMD 2000 is the most complete mechanism. Because the rural poor are concentrated in smaller pockets than the urban poor, using high-ranking districts (the NRF districts) to target the rural poor is highly incomplete. Targeting the rural poor using the IMD 2000 is also less efficient than targeting the urban poor. Even in the more deprived rural areas, the concentration of claimants is slightly lower than in similarly deprived urban areas. There are similar losses in efficiency when additional wards are included (Figure 2).

23
Figure 1: Percentage of Urban and Rural Claimants Captured by NRF districts and IMD 2000
68
58
36
22
5
16
62
0
10
20
30
40
50
60
70
80
NRF IMD Top 20% wards IMD Top 10% wards IMD Top 5% wards
Urban
Rural
Source: CASE analysis
Figure 2: Percentage of Urban and Rural Adults Who Are Claimants
12
15
19
23
26
7
12
15
18
20
0
5
10
15
20
25
30
England All NRF districts 20% IMD wards 10% IMD wards 5% IMD wards
Urban
Rural
Source: CASE analysis

24
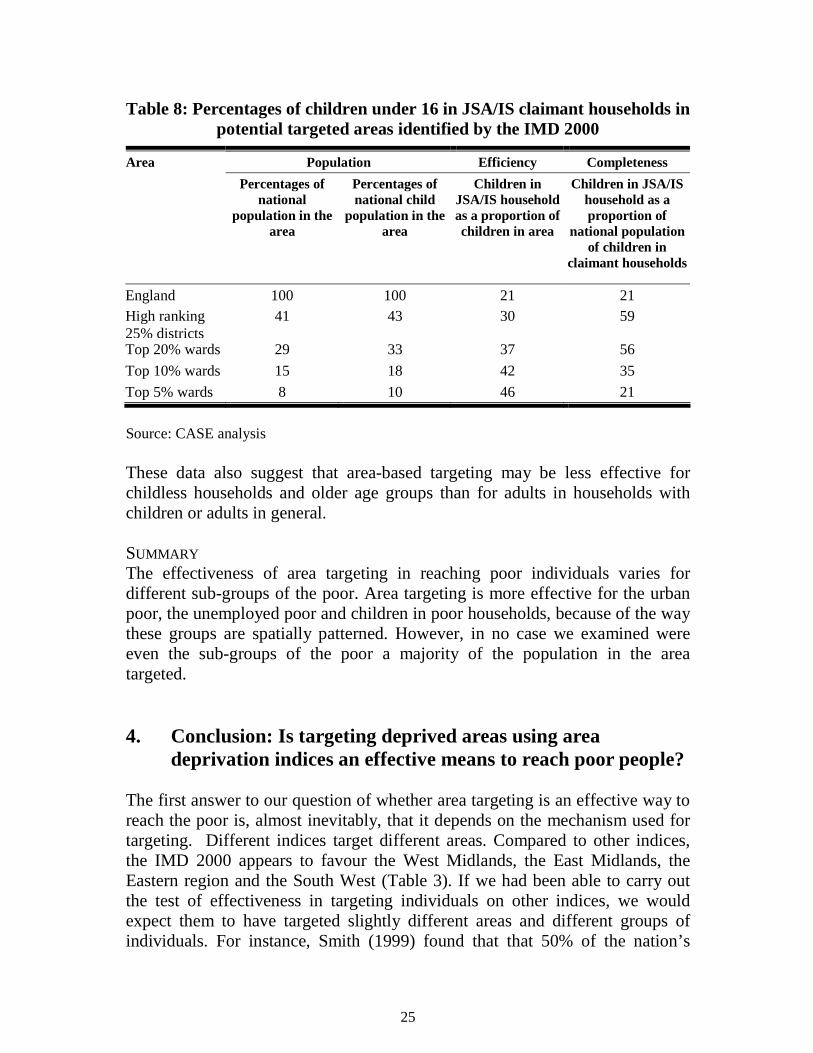
Overall, these data suggest strongly that area targeting using the IMD 2000 is likely to be more complete and efficient in targeting the urban poor than the rural poor and that targeting urban areas is a more complete and efficient means of targeting people on low incomes than targeting rural areas. If area targeting is to be used in rural areas, sub-ward level targeting - for example to enumeration districts – would be likely to improve completeness, and possibly could be used to supplement ward-level targeting in urban areas. Data for enumeration districts are currently available for the ILD 1998, but not yet for the IMD 2000. THE UNEMPLOYED POOR We also briefly examined JSA and IS claiming separately. JSA is only available for unemployed people who are actively seeking work. IS is available for those who are economically inactive such as pensioners, the disabled and lone parents. The NRF districts contained 62% of the total JSA claimants, compared to 57% of the JSA/IS total. This shows that unemployed people are more concentrated in the NRF districts than economically inactive people. This means that this type of area-based targeting is likely to be more complete and more efficient for unemployed poor people than for pensioners, the disabled and lone parents. CHILDREN IN POOR HOUSEHOLDS We also examined the effectiveness of area targeting in reaching children in JSA/IS claiming households. Table 8 shows that poor children are significantly more spatially concentrated in areas identified by the IMD 2000 at district and ward level than poor adults. This means that area-based targeting is likely to be more complete and more efficient for children than adults, both at district and at ward level. While the top 5% of wards capture 18% of poor adults, they capture 21% of poor children. However, the findings on efficiency are most dramatic. In these wards 26% of adults are poor, but fully 46% of children are poor. This is the highest figure for efficiency we have found.
25
Table 8: Percentages of children under 16 in JSA/IS claimant households in potential targeted areas identified by the IMD 2000
Population Efficiency Completeness Area
Percentages of national
population in the area
Percentages of national child
population in the area
Children in JSA/IS household as a proportion of children in area
Children in JSA/IS household as a proportion of
national population of children in
claimant households
England 100 100 21 21 High ranking 25% districts
41 43 30 59
Top 20% wards 29 33 37 56
Top 10% wards 15 18 42 35
Top 5% wards 8 10 46 21
Source: CASE analysis These data also suggest that area-based targeting may be less effective for childless households and older age groups than for adults in households with children or adults in general. SUMMARY The effectiveness of area targeting in reaching poor individuals varies for different sub-groups of the poor. Area targeting is more effective for the urban poor, the unemployed poor and children in poor households, because of the way these groups are spatially patterned. However, in no case we examined were even the sub-groups of the poor a majority of the population in the area targeted.
4. Conclusion: Is targeting deprived areas using area deprivation indices an effective means to reach poor people?
The first answer to our question of whether area targeting is an effective way to reach the poor is, almost inevitably, that it depends on the mechanism used for targeting. Different indices target different areas. Compared to other indices, the IMD 2000 appears to favour the West Midlands, the East Midlands, the Eastern region and the South West (Table 3). If we had been able to carry out the test of effectiveness in targeting individuals on other indices, we would expect them to have targeted slightly different areas and different groups of individuals. For instance, Smith (1999) found that that 50% of the nation’s

26
unemployed lived in the sixty-five most deprived districts targeted by the ILD 1998, roughly the top ranking 20% districts, while our analysis found that 62% of JSA claimants were in the NRF districts, which form the top ranking 25% of districts two years later. While part of the difference between the results is likely to be due to the different number of districts and to change between 1998 and 2000, this may also suggest that the IMD 2000 is slightly more complete than the recent ILD 1998 at district level. Section 2 found that most indices developed before the IMD 2000 would have targeted fewer areas in the West Midlands, the East Midlands, the Eastern region and the South West. Thus it is worth reminding ourselves that what is being measured determines who is being targeted. The second answer is that different area measures will be more or less effective in reaching different sub-groups of ‘the poor’. Our analysis suggests that area-based targeting is more complete and efficient for the urban poor, for the unemployed poor and for poor children. The concentration of poor children is particularly significant, and suggests that the effectiveness rationale for area targeting of programmes to help children is particularly valid. The rural poor are not well targeted by area measures at ward level and above, although the IMD 2000, with greater emphasis the East and the South West-City HSG, would appear to capture more rural areas and poor individuals in rural areas than other indices. The relative effectiveness of the IMD 2000 and other indices in capturing the unemployed poor sub-groups and the children in poor households subgroups depends on whether these two groups are more concentrated in the regions that the IMD 2000 emphasises or in the London and the North super-regions which are the most important for all the indices. Thirdly, we conclude that area targeting using the IMD 2000 is a more complete way of reaching the poor than has been claimed by opponents of area-based targeting in the past (Tables 4, 5, 6). It is possible to target a majority of adults on low incomes, as measured by JSA and IS claimancy, at super region, district and ward levels. However, as one would expect, empirical testing demonstrates a trade off between efficiency and completeness in targeting. As efficiency rises, completeness falls (Table 6). Moreover, all of the measures we looked at are relatively inefficient. Although the concentration of poor people is higher in deprived areas, the majority of people in these areas are not poor. For example, even in the top 5% wards on the IMD 2000, while 26% of the adult population are claiming IS/JSA, 74% are not. While Townsend’s 1979 claim about completeness has been disproved, it could be reformulated as a critique of efficiency: “however we care to define economically or socially deprived areas, unless we target less than 5% of all areas, more than half of the people contained in them – close to three quarters – will not be deprived”.

27
Potentially, the logical consequence of this argument might be that we should dispense with the effectiveness rationale for area targeting. Area targeting could be replaced by targeting individuals directly, or targeting social groups or institutions, such as schools. However, the value of targeting by these methods depends on the intervention being considered. Targeting individuals is straightforward enough if the intervention is, for example, an enhanced level of benefits, which can be administered through the existing national system. It would be easy enough to target certain client groups for enhanced payouts. However, if the intervention being considered involves face-to-face service delivery, such as youth work, individual targeting makes less sense. Such interventions are, by their nature, area-based, because workers must be physically located in the same places as clients. Where there are more clients, more workers will be needed, and where there are very few individuals in need, it may not be possible to justify the employment of a worker. For these kinds of interventions, targeting individuals might well result in the same distribution of services as targeting areas. Area targeting is a more straightforward way to the same result and, depending on the number of areas selected, can reach majorities of the national total of potential clients. Targeting institutions may lead to very inefficient targeting. If the interventions benefit large groups of people or everyone in the area (eg improvements to infrastructure, hospitals or schools), then our evidence on the spatial patterning of low-income individuals shows that even in the most deprived areas, a great many more non-poor than poor will benefit. The use of district-level targeting and in particular, ward-level targeting, can reduce this problem by targeting initiatives at areas where efficiency is greatest, but targeting cannot overcome it. This discussion suggests that, in reality, the use of area-based, individual-based or institution-based targeting mechanisms depends on the type of intervention, the costs and benefits of producing complex targeting mechanisms, and the optimum balance, for each intervention, between completeness and efficiency, which will itself depend on the amount of funding available. If resources are limited and efficiency is at a premium, for example, it might be more desirable to target a smaller number of higher-ranking areas. While no form of area targeting will be completely effective, careful use of area targeting, considering the balance between completeness and efficiency in each case, may maximise effectiveness. Different tranches of funding within single programmes could, for example, be distributed in different ways, to supplement efficient targeting with increased completeness. And both completeness and efficiency can be improved by area targeting at smaller spatial scales. Deprivation indices at sub-ward scale would allow significant gains in potential completeness and efficiency. However, here again, the administrative costs of such detailed targeting would need to be considered. Finally, thus, we come back to a note of pragmatism, and with it the fact that the effectiveness of area-based targeting in

28
reaching poor individuals can only be one consideration in the use of area programmes, which will continue to be supported by other rationales, such as belief in the existence of area effects, as a rationing mechanism, or to pilot programmes for wider use.

29

30
Appendix 1: The indicators and statistical processes used in the major area-based indices
The following table sets out the indicators used in the major indices introduced above. The different definitions of the indicators used in each case are lettered and given below.
Table A1: Indicators used in major indices of health need, deprivation and social exclusion
Health need
Deprivation Social exclusion
Jarm
an
Car
stai
rs 1
991
Arb
uthn
ott
1999
Tow
nsen
d
Gre
en 1
994
DoE
198
1
DoE
199
1
ILD
199
8
IMD
200
0
SAD
I 19
88
Bre
adlin
e
Scot
dep
Scot
dep
1998
Socd
ep
Mat
dep
CA
SE
Bra
dfor
d
Oxf
ord
Bur
char
dt e
t al.
Rah
man
et
al
.,
DSS
199
9
Cro
mpt
on,
Bla
ir
2000
Number of indices using the domain/ indicator
A b b b b b b b b b b b 11 B b b b b b b b b b 9 C b b b b b b b 7 D b b b b b 5 E b 1 F b 1
Inco
me
G b 1
21
A b b b b b b b b b b b b b b b b b b b 19 B b b b b b 5 C b b b b 4 D b b 2
Eco
nom
ic
E b 1
20
A b b b b b b b b b b b b b 13 B b b b b b b 6 C b b b 3 D b 1
Hou
sing
E b 1
15
A b b b b b b 6 B b b b b b b 6 C b b 2 D b b 2
Hea
lth
E b 1
10

31
A b b b b b b b 7 B b b b b b 5 C b 1 D b 1 E b 1
Edu
catio
n
F b 1
7
A b b b b b b b 7 B b b b b 4 C b b b b 4 D b b 2 E b 1 F b 1 G b 1 H b 1
Oth
er
I b 1
13
Sources: As indicated Note 1: Indicators are defined as follows: Income: A = No car; B = Low income; C = Home rented; D = Low social class E = GDP; F = Income inequality; G = Consumption; Economic activity: A = Unemployment; B = Economic inactivity; C = Non-earning D= Employment; E = Unfilled vacancies; Housing: A = Home overcrowded; B = Home lacking in amenities; C = Unsuitable home; D = Mortgage arrears; E = Vacant homes
Health: A = Mortality; B = Limiting long term illness; C = Health behaviour; D = Low birth weight E = Mental health; Education: A = Qualifications; B= 16-17s not in education; C = School exclusions; D = Literacy; E = Numeracy; F = Other measures Other: A = Household composition; B = Crime; C = Ethnicity; D = Social interaction E = Derelict land; F = Access to services; G = Deprivation; H = Mobility; I = Savings;
Different indices have combined different indicators together in different ways and using different statistical techniques (Carstairs, 2000).

32
Statistical methodology can influence results considerably, and may lead to counterintuitive or distorting effects. Statistical processes have been the subjects of considerable debate. For example, Lee et al. criticised double weighting of unemployment in DoE 1981 as arbitrary (1995). The widely used Z-score technique reduces proportions to a standardised value with a mean of zero and a standard deviation of one, so they can be added together, but this means implicit weighting of variables by the different original distributions (DETR, 2000) and can reduce the ability to see trends over time (McLoone, 1994; Carstairs, 2000). Noble et al. argued that the signed chi-squared tests used in the 1998 ILD meant that the amount and seriousness of deprivation was conflated (2000). Chi-squared tests were not used in the IMD 2000, which used ‘shrinkage estimation’ to smooth out the greater variance seen in areas with small populations (DETR, 2000). Noble et al. also felt that the exponential transformation used in the 1998 ILD meant that areas with larger populations tended to have more extreme figures (2000). Recently, researchers have sought to avoid these problems and to maximise transparency while focusing on nation-wide trends over time, by producing sets of indicators which are not combined into a single index but are listed in full (Burchardt et al., 1999, Crompton and Blair, 2000; DSS, 1999; Rahman et al., 2000). These measures are less appropriate for examining small differences between a large number of different areas than combined indices which can be used for ranking (eg. DoE, 1981, 1991; DETR, 1998, 2000).

33
Appendix 2: The eighty-eight local authorities eligible for the Neighbourhood Renewal Fund: The ‘high ranking 25% districts’
This table shows the eighty eight local authorities eligible for the Neighbourhood Renewal Fund: the ‘high ranking 25% districts’. It includes the eighty-one authorities that ranked in the top fifty on at least one domain of the IMD 2000, and the seven ‘transitional’ authorities that did not rank in the top fifty on any domain in the IMD 2000 but were also included as eligible for the Neighbourhood Renewal Fund’s support, which are marked with an asterisk. Allerdale Ashfield Barking and Dagenham Barnsley Barrow-in-Furness Birmingham Blackburn-with-Darwen Blackpool Bolsover Bolton Bradford Brent Brighton Bristol Burnley Camden Coventry Croydon Derby Derwentside Doncaster Dudley Ealing Easington Enfield Gateshead Great Yarmouth Greenwich Hackney Halton Haringey Hartlepool Hastings Hyndburn Islington Kerrier Kingston-upon-Hull Kirklees
Knowsley Lambeth Leeds Leicester Lewisham Lincoln Liverpool Manchester Mansfield Middlesbrough Newcastle-upon-Tyne Newham North Tyneside Nottingham Oldham Pendle Penwith Plymouth Preston Redcar and Cleveland Rochdale Rotherham Salford Sandwell Sedgefield Sefton Sheffield South Tyneside Southwark St Helens Stockton-on-Tees Stoke-on-Trent Sunderland Tameside Tower Hamlets Wakefield Walsall Waltham Forest
Wansbeck Wear Valley Wigan Wirral Wolverhampton *Hammersmith and Fulham *Kensington and Chelsea *Luton *Portsmouth *Southampton *Wandsworth *Westminster
34
References
Bardgett, L and Vidler, G (2000) Regional social exclusion indicators, Research Paper 00/71. London: House of Commons Library
Barnes, JH and Lucas, H (1975) ‘Positive discrimination: Individuals, groups and institutions’, in Barnes, JH (ed.), Educational Priority, Vol. 3. London: HMSO
Barry, B (1998) Social exclusion, social isolation, and the distribution of income, CASEpaper 12. London: London School of Economics
Bennett, K, Hudson, R and Benyon, H (2000) Coalfields regeneration: Dealing with the consequences of industrial decline. Bristol: Policy Press
Booth, C (1891) Life and labour of the people of London. London and Edinburgh: Williams and Norgate
Brimacombe, M (2000) ‘Mowlam promises to ease rural deprivation’, New Start, 23rd June
Burchardt, T, Le Grand, J and Piachaud, D (1999) ‘Social exclusion in Britain 1991-1995’, Social Policy and Administration, 33(3): 227-244
Byrne, D (1999) Social exclusion. Buckingham: Open University Press
Cabinet Office (1999) Sharing the nation’s prosperity: Variation in economic and social conditions across the UK. London: Cabinet Office
Cabinet Office (2000) Sharing the nation’s prosperity: Economic, social and environmental conditions in the countryside: A report to the Prime Minister. London: Cabinet Office
Cabinet Office (2001) A new commitment to neighbourhood renewal. London: Cabinet Office
CACI (1999) 1999 PayCheck report: CACI’s income model. London: CACI
Carstairs, V (2000) ‘Socio-economic factors at area level and their relationship with health’, Spatial Epidemiology
Carstairs, V and Morris, R (1990) Deprivation and health in Scotland. Aberdeen: Aberdeen University Press
Chandola, M, Lloyd, T, Wigglesworth, R and Wright, G (2000) Report to the Countryside Agency – Rural Deprivation: An analysis of the Indices of Deprivation 2000 for rural areas. Oxford: The Social Disadvantage Research Group, Department of Social Policy and Social Work, Oxford University

35
Crompton, A and Blair, D (eds.) (2000) Mapping social exclusion in Wales. Cardiff: National Assembly for Wales
Danson, M and Mooney, G (1998) ‘Glasgow: A tale of two cities? Disadvantage and exclusion on the European periphery’ in Lawless, P, Martin, R and Handy, S (eds.), Unemployment and social exclusion: Landscapes of labour inequality, Regional Studies Association. London: Jessica Kingley
Department of Social Security (1999) Opportunity for all: Tackling poverty and social exclusion. London: Department of Social Security
Department of the Environment (1995) 1991 Deprivation Index: A review of approaches and a matrix of results. London: Department of the Environment
Department for the Environment, Transport and the Regions (DETR) (1998) 1998 Index of Local Deprivation. London: DETR
DETR (1999) The 1998 Index of Local Deprivation: Patterns of Deprivation and 1991-6 Change. London: DETR
DETR (2000) Measuring Multiple Deprivation at the Small Area Level: The Indices of Deprivation 2000. London: DETR
Dorling, D (1997) Death in Britain: How local mortality rates have changed: 1950s-1990s. York: Joseph Rowntree Foundation
Engels, F (1968) The condition of the working class in England. London: Allen and Unwin (orginally published in 1847)
Forrest, R and Gordon, D (1993) People and places: A 1991 census atlas of England. Bristol: SAUS Publications
Glennerster, H., Lupton, R., Noden, P., and Power, A. (1999) Poverty, social exclusion and neighbourhood: Studying the area bases of social exclusion. CASEpaper 22. London: London School of Economics
Gordon, D, Adelman, L, Ashworth, K, Bradshaw, J, Levitas, R, Middleton, S, Pantazis, C, Patsios, D, Payne, S, Townsend, P and Williams, J (2000) Poverty and social exclusion in Britain. York: Joseph Rowntree Foundation
Green, A (1994) The geography of poverty and wealth: Evidence on the changing spatial distribution and segregation of poverty and wealth from the Census of Population, 1991 and 1981. Coventry: University of Warwick, IER
Hartley-Brewer, J (2000) ‘Cities lose out in poverty league table, Rural areas set to gain more funding as new index changes priorities’, The Guardian, 3 April 2000

36
Howarth, C, Kenway, P, Palmer, G and Miorelli, R (1999) Monitoring poverty and social exclusion 1999. York: York Publishing Services
Howarth, C, Kenway, P, Palmer, G and Street, C (1998) Monitoring poverty and social exclusion – Labour’s inheritance. York: Joseph Rowntree Foundation
Jarman, B (1983) ‘Identification of underprivileged areas’, British Medical Journal, 286: 1705-1708
Jarman, B (1984) ‘Underprivileged areas: Validation and distribution of scores’, British Medical Journal, 289: 1587-1592
Jordan, B (1996) A theory of poverty and social exclusion. Oxford: Polity Press
Lee, P and Murie, A (1999) Literature review of social exclusion. Edinburgh: Scottish Office
Lee, P, Murie, A. and Gordon, D (1995) Area measures of deprivation: A study of current methods and best practices in Great Britain. Birmingham: CURS, The University of Birmingham
Mack, J and Lansley, S (1985) Poor Britain. London: Allen and Unwin
McLoone, P (1994) Carstairs scores for Scottish postcode sector from the 1991 Census. Glasgow: Public Health Unit, University of Glasgow (Reprinted 2000)
Noble, M, Penhale, B, Smith, G, Wright, G, Dibben, C, Owen, T, Lloyd, M, Firth, D and Payne, C (2000) Indices of deprivation 2000. London: DETR
Oatley, N (2000) ‘New Labour’s Approach to Age-old Problems: Renewing and Revitalising Poor Neighbourhoods – the national strategy for neighbourhood renewal’, Local Economy, 15(2)
Park, RE, Burgess, EW and McKenzie, RD (1967) The City. London: University of Chicago Press (originally published 1925)
Peach, C (1996) ‘Does Britain have ghettos?’, Transcriptions of the Institute of British Geographers, 21: 216-235
Plewis, I (1998) ‘Inequalities, targets and zones: Current policies to raise standards could increase inequality’, New Economy, 5(2)
Power, A (2000), ‘Poor areas and social exclusion’, in A Power and W J Wilson, Social Exclusion and the Future of Cities, CASEpaper 35. London: London School of Economics
Prince’s Trust (2000) Mapping disadvantage: Young people who need help in England and Wales. London: Prince’s Trust
Rahman, M, Palmer, G, Kenway, P and Howarth, C (2000) Monitoring poverty and social exclusion 2000. York: Joseph Rowntree Foundation
37
Robson, B, Bradford, M and Tye, R (1995) ‘The development of the 1991 Local Deprivation Index’, in Room, G (ed.), Beyond the threshold: The measurement and analysis of poverty and social exclusion. Bristol: Policy Press
Room, G (1995) (ed.) Beyond the threshold: The measurement and analysis of social exclusion. Bristol: The Policy Press
Rural Development Commission (1993) Report on the rural economy. London: RDC
Scottish Executive (2000) Fair shares for all: Final report. Edinburgh: Scottish Executive
Seymour, J (2000) Poverty in plenty: A human development report for the UK. London: Earthscan Books
Shucksmith, M (2000) Exclusive countryside? Social inclusion and regeneration in rural Britain. York: Joseph Rowntree Foundation
Shucksmith, M, Chapman, P and Clark, GM (1996) Rural Scotland today: The best of both worlds? London: HMSO
Smith, D (1989) North and south: Britain’s economic, social and political divide. London: Penguin
Smith, G (1999) Area-based initiatives: The rationale for and options for area targeting, CASEpaper 25. London: London School of Economics
Social Exclusion Unit (1998) Bringing Britain together: A National Strategy for Neighbourhood Renewal. London: Cabinet Office
Townsend, P (1979) Poverty in the United Kingdom. Harmondsworth: Penguin
Townsend, P (1987) Poverty and labour in London: Interim report of a centenary survey. London: Low Pay Unit
Townsend, P and Davison, N (1988) Inequalities in Health – The Black Report. London: Penguin
Walker, R (1997) ‘The dynamics of poverty and social exclusion’ in Room, G (ed), Beyond the threshold: The measurement and analysis of social exclusion. Bristol: The Policy Press
West, T (2000) ‘London lashes out as poverty index highlights northern need’, New Start, 1 September