is small beautiful? small enterprise, aid and employment ... · pdf fileis small beautiful?...
TRANSCRIPT

Is Small Beautiful? Small Enterprise, Aid and Employment in Africa
John Page1 and Måns Söderbom
2
Abstract
Aid providers frequently link supporting small firms to job creation. Small firms create about half of new jobs in Africa, but they also have higher failure rates. Ignoring firm exit exaggerates net employment growth. Using panel data for Ethiopia, we find that small and large enterprises create similar numbers of net jobs. Moreover, wages in small firms are persistently lower. To create more ‘good’ jobs aid should target the constraints to the growth of firms of all sizes. Improving the ‘investment climate’ and new programmes to increase firms’ capabilities—through for example management training—offer better prospects for employment creation. Keywords: aid, small enterprise, employment, firm exit, Africa JEL classification: J23, O14, O17, O19

UNU-WIDER is pleased to give Brookings Institution permission to reproduce the WIDER
Working Paper 2012/94, ‘Is Small Beautiful? Small Enterprise, Aid and Employment in
Africa’, authored by John Page and Måns Söderbom. We ask, as per standard reproduction
protocol, that for each reproduction and/or extraction UNU-WIDER is cited as the original
source and copyright holder. The following is how we prefer to be acknowledged:
This working paper is reproduced here by permission of UNU-WIDER, who commissioned
the original research and holds copyright thereon.
Copyright UNU-WIDER 2012 1Brookings Institution, USA, email: [email protected]; 2University of Gothenburg, Sweden, email:
This study has been prepared within the UNU-WIDER project ‘Foreign Aid: Research and Communication–
ReCom’, directed by Tony Addison and Finn Tarp.
UNU-WIDER gratefully acknowledges specific programme contributions from the governments of Denmark
(Ministry of Foreign Affairs, Danida) and Sweden (Swedish International Development Cooperation Agency—
Sida) for ReCom. UNU-WIDER also gratefully acknowledges core financial support to its work programme from
the governments of Denmark, Finland, Sweden, and the United Kingdom.
ISSN 1798-7237 ISBN 978-92-9230-558-1
1 Introduction
Small firms are big business in the aid industry. Why? In a word, jobs. Globally, small
and medium firms—those with less than 250-workers—account for nearly 80 per cent of
employment in the formal sector in low-income countries (Ayyagari et al. 2011). When
micro and informal firms are counted—and they are not counted very well—the
employment share of micro- small and medium enterprises (MSMEs) in developing
countries rises to an estimated 90 per cent of all workers. Not surprisingly, in the wake of
the Arab Spring supporting micro and small enterprises has increasingly come to be
viewed by the donor community as a ‘quick fix’ to boost job creation for the young and
growing populations of Africa, the Middle East, and Asia.
At the 2012 spring meetings of the IMF and World Bank, Andrew Mitchell, then the UK
Secretary of State for International Development, announced his government’s intention
to provide funds for a seven-year programme designed to help 250,000 small businesses
in Africa and Asia create one million jobs. In launching the initiative Mitchell said,
‘Small and medium enterprises are a vital engine of job creation in developing countries.
Yet they face a huge financing gap—especially in Africa, where SMEs need three times
more funding than is currently available’.1
Mitchell is not alone. The G-20 created the Financial Inclusion Experts Group (FIEG) in
September 2009 to focus on promoting public-, private-, and social-sector finance to
MSMEs in developing countries (McKinsey 2011). And, the European Union has
asserted, ‘For developing countries, the expansion of the private sector, notably MSMEs
is a powerful engine of economic growth and the main source of job creation (emphasis
in original)’ (EU 2012).
Donor enthusiasm for small enterprises arises from a happy coincidence of objectives and
instruments. Job creation is the objective, and money—in the form of development
finance or funding for technical assistance—is the instrument. There are an estimated
365-445 million, formal and informal, MSMEs in the developing world.2 Of these
approximately 70 per cent report that they do not use any external financing, although
they would do so if financing were available. Another 15 per cent are underfinanced. The
financing gap is estimated at US$2.1 trillion to US$2.5 trillion (McKinsey 2010, 2011).
Filling such a large financing gap in the pursuit of jobs is an attractive objective for both
public and private development actors.
1 The Guardian, 15 April 2012.
2 Only 25 million to 30 million of these firms are formal SMEs (5 to 250 employees). More than 90 per
cent are either formal enterprises with fewer than 5 employees or enterprises that are not formally
registered (McKinsey 2011). Data on micro enterprise of the type we use in this paper are virtually
impossible to come by in Africa. For this reason we do not assess job creation and the quality of
employment in micro enterprises. There is an abundant literature, however, to suggest that many of our
conclusions with respect to small firms hold a fortiori with respect to micro enterprises.
In this paper we ask whether aid programmes targeted to small and medium enterprises
(SMEs) in Africa are the best way to create jobs. Following this introduction, Section 2
describes the current state of donor assistance to SMEs. There are more than 300 public
and private investment funds for SMEs in low-income countries and almost a quarter of
their investments in 2010 went to Africa. Official development assistance to SMEs
totalled more than US$1 billion in 2009.
Section 3 surveys the cross-country evidence on SMEs and job creation. The data
available indicate that when a cut off of 100 employees is used SMEs employ nearly 60
per cent of workers in low-income countries. Firms in the size range 5-19 workers create
the greatest share of new jobs in low-income countries, more than 58 per cent, although
the data available do not tell anything about how long those jobs last. There are also
substantial differences in wages and productivity growth between small and large firms.
Small firms consistently trail large firms in wages paid, wage growth and productivity
growth.
In Africa firms with more than 100 workers employ about 50 per cent of the labour force.
Medium-scale enterprises (20-99 workers) constitute the second leading employment
category with about 27 per cent of the labour force, and small firms employ a further 23
per cent. However, consistent with the evidence for developing countries in general,
small firms in Africa appear to create a disproportionate share of new jobs. In the median
African country about 47 per cent of new jobs were created in firms with 5-19 workers.
There are, however, several methodological problems that bedevil attempts to draw
strong conclusions from the data available about the ability of small firms to create jobs.
The most critical of these is the inability to distinguish between gross and net job
creation. Small firms indisputably create new jobs, but if small firms also have higher
exit rates, ignoring firm exit, will tend to exaggerate their role in employment creation.
The cross-country data are also wholly uninformative with respect to wages and wage
growth.
Section 4 attempts to deal with productivity and wages by using a more restricted set of
data drawn from enterprise surveys of nine African countries. There is a strong positive
relationship between productivity and firm size. The average worker in a 160-worker
firm produces as much value-added in 15 minutes as the average worker in a 5-worker
enterprise does in an hour. Not surprisingly, workers in small African firms are paid far
less than employees in larger firms. The earnings of the average worker in a 100-worker
firm are about 80 per cent higher than the earnings of someone working in a 5-worker
enterprise. This evidence is consistent with other studies using labour market data that
find that the quality of jobs in small firms in Africa is lower than those in large firms.
Because the cross-country data cannot tell us anything about firm entry and exit, we turn
in Section 5 to panel data from one African country, Ethiopia. Here we find a striking
result: small enterprises are not a superior source of job creation. Although small firms
that survive grow faster than large firms, they also have higher mortality rates. When we
take into account the significantly lower survival rates of small firms, expected job
growth for large and small firms is essentially the same. What about wages? In Ethiopia
there is a persistent difference in wages between large and small firms. Although wages
rise in growing firms, regardless of size, they grow at the same rate. Firms starting small
do not close the wage gap, even if they survive.
Taken together the various strands of evidence suggest that it is time to rethink aid
strategies for job creation based on support to small enterprises. Section 6 offers some
preliminary suggestions on how this can be achieved. If more rapid growth of ‘good’
jobs—jobs capable of sustaining employment, paying decent wages, and allowing for
wage growth—is the objective, programmes based on firm size are too blunt an
instrument.
Our evidence indicates that once firm survival is taken into account, small firms and large
firms perform essentially the same in creating new net jobs over the medium term.
Moreover small firms have higher job turnover and persistently lower wages than larger
firms. Aid should target those firms that are successful at creating ‘better’ jobs. These are
growing firms, and this argues in the first instance for policies and programmes that
reduce the constraints to the growth of firms, regardless of size.
As a first step, aid can accelerate the growth of good jobs by supporting public actions to
improve the ‘investment climate’—the regulatory, institutional and physical environment
within which firms of all sizes operate. Investment climate reforms are a traditional
‘product’ of the aid industry in Africa, but the way in which the international community
has chosen to define priorities for the reform of the investment climate needs to be
changed. Too much donor effort has been expended on achieving easily measured but
low impact regulatory reforms and too little effort on relieving an important physical
constraint to firm growth, lack of infrastructure.
Beyond investment climate reforms, it may be possible to design programmes aimed at
improving the growth prospects of firms. In our view, public policy, whether by
governments or donors, should start with the proposition that entrepreneurs and business
people are much better than policy makers and academics at identifying potentially
successful business opportunities and binding constraints. This suggests that aid agencies
might usefully support efforts to design close co-ordination mechanisms between
business and governments. We also think there is room for experimentation and
evaluation of the impact of programmes to improve the capabilities of firms—both small
and large—provided that governments and donors work with the market and not against
it.
2 Small enterprises are big business
At the end of 2010 the total global commitments of multilateral development banks
(MDBs), bilateral donor agencies, and development finance institutions (DFIs) to support
SMEs totalled around US$24.5 billion (Siegesmund and Glisovic 2011).3 In addition
3 In addition there are a large number of non-governmental organizations (NGOs) that deal with MSMEs.
Some of these are financed by official development assistance, but a growing number are funded

private philanthropies such as the Citi foundation and for profit ‘social’ investors are also
active in SME finance.
More than 300 public and private investment funds for SMEs in emerging markets
committed more than US$21 billion through wholesale investment facilities in 2010.
Almost half of these investments went to sub-Saharan Africa (SSA) (24 per cent) and
South Asia (22 per cent). The largest aid actors included the European Investment Bank
(EIB), International Finance Corporation (IFC), World Bank, Netherlands Development
Finance Company (FMO), European Bank for Reconstruction and Development (EBRD),
Germany’s Kreditanstalt für Wiederaufbau (KfW), and the Asian Development Bank.
Each had programmes of SME support in excess of US$500 million in 2010 (Siegesmund
and Glisovic 2011).
Official development assistance (ODA) to SMEs—the component of financing carrying
at least a 25 per cent grant element and with an explicit objective to promote economic
development and welfare—is estimated to have exceeded US$1 billion in 2009.4 Forty
eight per cent of this ODA went to Asia, 19 per cent to the Middle East and North Africa,
and 18 per cent to SSA (Siegesmund and Glisovic 2011).
All the multilateral development banks have programmes that address SME access to
finance. Some invest directly in enterprises through loans or equity; others provide loans
to financial intermediaries—typically commercial banks—which in turn lend directly to
enterprises. The majority of the multilateral banks also provide technical assistance (TA)
to governments on a wide range of policy reforms that affect the business environment,
such as: business registration, licensing, labour regulations, contract enforcement,
corporate taxation, and ease of exporting.
The bilateral donor community is highly fragmented, and donor strategies to finance
small and medium enterprises vary greatly. Some focus on institutional, legal, and
regulatory reforms to improve the investment climate. Other aid actors focus on
interventions to remove the constraints to growth faced by small businesses. Some
finance SMEs directly, and others provide wholesale finance through financial
intermediaries. Some donors provide technical assistance advisory services to train banks
in lending practices for SMEs. Donors have also provided TA to SMEs to prepare
bankable proposals.5 In general individual development agencies are not fully aware of
the projects and policies of their peers, and there is little co-ordination, either globally or
at the country level.
wholly or partly by private philanthropy. While they are not the subject of this paper, which is focused
on ‘aid and employment’, many of these organizations have similar rationales for their SME activities
and the results apply equally.
4 These estimates are approximate. There are data gaps in what donors and DFIs self-report, and the
information is not reported consistently across organizations.
5 For example, USAID’s Development Credit Authority (DCA) office typically looks for a local project
that can assist SMEs to prepare bankable proposals in connection with a loan portfolio guarantee.
Direct assistance by bilaterals at the firm level usually consists of equity or debt financing
and technical assistance for business support (to improve business practices). Value-chain
programmes where donors work with large corporations to connect them to small
enterprises as suppliers or distributers have become increasingly popular. In addition,
donors work directly with enterprises or through business and trade associations to help
build supplier relationships and to help small businesses gain access to market
information. The cluster development approach, popularized by Japan, aims to increase
co-ordination among businesses, suppliers, trade associations, local universities, and local
government to promote the growth of a strategic sector, help businesses gain access to
inputs, and stimulate greater levels of innovation and technology transfers.
Development finance institutions are risk capital investment funds. The International
Finance Corporation is the largest DFI supporting SMEs. In 2009, IFC committed
US$6.1 billion to its SME finance portfolio. IFC financial intermediaries had an
outstanding portfolio of 1.3 million SME loans that totalled US$90.6 billion. IFC’s equity
investment portfolio—77 funds that target SMEs—had committed US$765 million to
over 775 SMEs by 2011. Only two per cent of the IFC portfolio is in Africa. IFC also
provides a range of advisory services both to enterprises and financial intermediaries
(OECD 2009).
There are a total of 16 European DFIs and collectively in 2008 they had an investment
portfolio of EUR 16.7 billion in a total of 4,221 projects. The four largest European DFIs
are owned by the governments of Germany, the Netherlands, the United Kingdom, and
France. They specialize primarily in making direct investments in enterprises. The
European funds differ from the MDBs and bilaterals because they only make investments
in firms or financial institutions. Equity (53 per cent) is the most common financing
product used by the European DFIs, followed by loans (40 per cent) and guarantees (7
per cent). The average project size is about EUR 4 million. Between 2007 and 2008 the
European fund’s Africa portfolios grew by 10 per cent (Dalberg 2009).
3 What do we know about small enterprises and job creation?
Despite the fact that the rationale for aid to small enterprises is centered on their role in
creating jobs, we in fact know relatively little about small enterprises and job creation in
low-income countries, especially in Africa. In part this is due to definitional problems.
The definition of ‘small’ varies by country and by income level. Richer economies like
the member states of the OECD use cut-off points of fewer than 500 workers to classify
SMEs. In developing countries, where market size and average firm size are both much
smaller, cut-off points of fewer than 100 workers or 250 workers are often used.
In Africa even these cut-offs often seem high. A recent compilation of evidence on SME
characteristics based on World Bank enterprise surveys finds a median employment share
of 77 per cent in firms of 250 workers or fewer in Africa, compared with 66 per cent in
high-income countries. The median employment share is 39 per cent in firms of less than
50 workers, compared to 29 per cent in richer countries, and the median share of workers
in the size category 5-19 is 10 percentage points higher in Africa than in high-income
countries (Ayyagari et al. 2011).
Small enterprises are also heterogeneous—ranging from small workshops making
furniture, metal parts and clothing to medium-sized manufacturers of machinery. Some
are services providers, such as restaurants, consulting and computer software firms. Some
are traditional, ‘craftsman’ enterprises that are satisfied to remain small, while others—
epitomized by the Silicon Valley start-up—are innovation based and growth-oriented. All
of this suggests that the romantic stereotype of the small business as Bill Hewlett and
David Packard in a garage in Palo Alto growing into a global manufacturing giant is
likely to be the exception rather than the rule.
There are several methodological problems that bedevil attempts to draw strong
conclusions from the evidence available on job creation by small firms. The first and
most critical is to distinguish between gross and net job creation. Small firms
indisputably create new jobs, but they can also destroy jobs through higher failure rates.
Assessing the magnitude of the latter effect requires longitudinal (panel) firm-level data
that record exit and entry. Unfortunately, for developing countries in general, and for
Africa in particular, such datasets are very scarce. As a consequence, researchers often
attempt to study the association between size and growth based on recall data. Since
small firms have higher exit rates, ignoring firm exit, will tend to exaggerate the role of
small firms in creating new jobs. We show in Appendix A1 how researchers basing their
research on recall data may come to conclude that small firms create more jobs than large
firms when in fact the opposite is the case.
Second, there are some statistical issues with the time frame over which the data are
measured. Some very large firms may shrink and some small firms may grow in a given
year, even though no systematic relationship exists between size and employment growth
over longer time periods.6 Third, the cut-off points used to define size classes in the base-
year may cause employment in small firms to be overstated. If formerly medium-sized
firms shrink into the small-firm size category before the base year, job creation can look
to be disproportionately large in small firms, even where panel (firm-year) data would
show job creation to be an increasing function of size (Davis et al. 1996). Finally, when
economic statistics are collected at the establishment—as opposed to the enterprise-
level—the role of new or small establishments owned by large firms in generating jobs is
over reported (Dunne et al. 1988).
The focus on job creation also begs another important question: what is the quality of
jobs created? There is a large body of empirical evidence from developed and developing
countries showing that large firms offer higher wages than small firms, even when
differences in worker education and experience and the nature of the industry are
considered.7 If the objective of aid policy is not just to create any job, but to create a
6 This is a manifestation of the regression to the mean fallacy in the statistical analysis of economic data.
See Davis et al. (1996).
7 See for example Teal (2010).
good job—in terms of wages, employment duration and working conditions—the quality
of jobs is also relevant.
3.1 What does the global evidence show?
The role of small businesses in creating employment has been most intensively studied in
the United States. Indeed, the development orthodoxy that smaller firms are more
efficient at job creation appears to be largely the product of pronouncements of the U.S.
Small Business Administration and by a range of US political leaders (up to and
including those in the current US presidential campaign) that 8 out of 10 new jobs in the
USA are generated by firms with fewer than 100 employees (Birch 1987).
More recent work by Haltiwanger, Jarmin, and Miranda (2010) (HJM) on the US data
attempts to come to grips with the methodological problems outlined above and tells a
more cautionary tale. Mature, large firms account for most employment in the US (about
45 per cent) and, not surprisingly therefore, proportionately most of the job creation and
destruction. As they put it, ‘the firms that have the most jobs create the most jobs—so if a
worker is looking for the places where the most jobs are being created they should go
where the jobs are—large and mature firms’ (Haltiwanger, Jarmin, and Miranda 2010:
10). However, as they point out, from the perspective of public (and aid) policy the more
interesting question is what types of firms create a disproportionate share of new net jobs.
In the US economy age, not size, is the relevant factor. HJM emphasize the critical role
played by start-ups in US employment growth dynamics. They find that start-ups and
surviving young businesses contribute disproportionately to net employment growth.
Firm start-ups account for only 3 per cent of employment but almost 20 per cent of gross
job creation and conditional on survival, young firms grow more rapidly than their more
mature counterparts. Importantly, HJM find no systematic relationship between firm size
and employment growth, controlling for firm age. This does not mean that size is
irrelevant to job creation—in the USA most new firms start small—but it cautions against
policies that favour various simply defined size classes of businesses on the grounds of
job creation.
The US evidence also highlights the importance of addressing the issue of firm
survivorship. While the greatest contribution to job creation in the US is among start-ups
(small, young firms), HJM also document an ‘up or out’ dynamic among young firms.
Young firms have a much higher likelihood of failure and have very high job destruction
rates. After five years about 40 per cent of the jobs initially created by start-ups in the US
have been eliminated by exit.
It is not entirely clear how much of the US experience carries over to developing
countries. Biggs and Shah (1998) analyze panel data from World Bank enterprise surveys
in five countries in SSA covering a three year period in the early 1990s. They find that
large firms (which they define as larger than 100 employees) were the dominant source of
net job creation in manufacturing in four of the five countries. Large firms in their sample
contributed 56 per cent of net job creation in Ghana, 74 per cent in Kenya, 76 per cent in
Zimbabwe, and 66 per cent in Tanzania. In Zambia, where there was an overall net fall in
employment for the period, small firms out performed larger firms in net job creation.
As in the USA, the Africa data also showed higher rates of enterprise failure at the small
end of the size distribution. Exit by small enterprises was an important factor determining
the difference between gross and net job creation in small enterprises (Biggs 2002). This
is consistent with evidence from OECD countries, some economies in transition, and
Latin America that entering and exiting firms account for about 30-40 per cent of total
job flows, and that small firms account disproportionately for firm turnover (Haltiwanger,
Scarpetta, and Schweiger 2010).
Ayyagari, Demirgüç-Kunt and Maksimovic (2011) (ADM) analyze the contribution of
SMEs and young firms to total employment, job creation, and growth for 99 developing
economies, based on World Bank enterprise survey data. To these they add data for
another 44 countries, mainly high-income economies drawn from other comparable
sources. These data are limited in two important respects. First, because they are not
panel (firm-year) data it is impossible to deal with the question of firm survival. While
the authors’ acknowledge this shortcoming, they are somewhat off hand about it, arguing
that the ‘churning’ characteristic of the US and other mature economies is less present in
developing countries. Second, their data only cover registered firms with more than five
employees. Neither small, formal firms (those with less than 5 workers) nor informal
enterprises are covered. Nevertheless, the ADM study represents the most comprehensive
analysis of the relationship between firm size, firm age and job creation in developing
countries available.
Small and medium enterprises—defined as those with fewer than 250 employees—make
up the largest share of employment in developing countries. In the median country firms
with 5-250 employees employed 67 per cent of the total permanent, full-time work force.
SMEs in their sample have a higher share of employment in low-income countries (78
per cent) than in high-income countries (66 per cent).
We have argued that the definition of an SME as a firm with less than 250 workers may
be excessively large, especially in low-income countries. ADM provide data on
alternative size classifications of SME. When a cut off of 100 employees is used SMEs
employ about 50 per cent of workers in the median country and nearly 60 per cent of
workers in low-income countries. In contrast to the advice to US job seekers, job seekers
in low-income countries would seem better advised to look for work among smaller
firms.
ADM find that small, mature firms have the largest share of job creation in developing
countries. At the median of the 81 developing countries in their sample that experienced
job growth SMEs (with less than 100 employees) generated 77 per cent of the new jobs.
Firms in the size range 5-19 workers created the greatest share of new jobs in low-income
countries (with rising employment), more than 58 per cent. They also find that young
firms have higher employment growth than old firms, controlling for firm size.
While the ADM study provides some valuable insights into the role of small firms in job
creation in developing countries, it is silent on the subject of the quality of the jobs
created. In advanced countries, the wage differential between large and small firms for
similar job categories is found to be as much as 35 per cent (Brown et al. 1990). In
developing countries it can be as large as 50 per cent (Mazumdar 1999; Rosenzweig
1988). Large employers also offer better benefits in the form of pension plans, and life,
health and accident insurance. Large firms, generally have better working conditions,
especially in developing countries where working conditions in the informal sector can be
particularly harsh. Finally, the jobs generated by large firms generally provide greater
security than those generated by small firms (Biggs 2002).
ADM also provide some indirect evidence on the potential for small firms to generate
good jobs. To the extent that wage levels and duration of employment are determined by
firm level productivity growth their key result is that SMEs productivity growth is not as
high as that of large firms. In cross-country regressions they find that small firms have
significantly lower productivity growth than large firms controlling for firm age. These
results hold for the manufacturing sector and the non-manufacturing sector separately.
This is consistent with other evidence from developing countries that finds that larger
firms are more productive (Hseih and Klenow 2009).
3.2 What do we know about SMEs and jobs in Africa?
The database compiled by Ayyagari et al. (2011) contains firm survey data from 35
African countries. In this section we use that data to place the role of SMEs as job
creators in Africa in international context. When we break the Africa data out from the
ADM cross-country aggregates a number of interesting regional patterns appear.
Figure 1 shows the distribution of total employment by firm size and region. We have
chosen to present the data in four size categories firms with 2-19 employees which we
define as small enterprises in the African context, firms in the size ranges 20-49 and 50-
99 employees which we define as medium-scale enterprises and firms with more than
100 employees which we define as large. Using these definitions, large firms are the
largest employers in all six developing regions.
In Africa large firms employ about 50 per cent of the labour force. Medium-scale
enterprises constitute the second leading employment category with about 27 per cent of
the labour force, and small firms employ a further 23 per cent.8 The largest proportion of
African formal sector workers is found in firms more than 10 years old with more than
100 employees (Figure 2). Interestingly this is similar to the HJM result for the United
States, but it emphasizes the critical role played by the definition of ‘small’. Had we used
a cut-off 250 employees for large enterprises, two-thirds of African jobs would have been
found in SMEs.
Small firms in Africa do, however, create a disproportionate share of new jobs—in those
African economies in which formal sector employment is growing (Figure 3). In the
8 This of course excludes micro enterprises (of less than 5 employees) and informal enterprises.
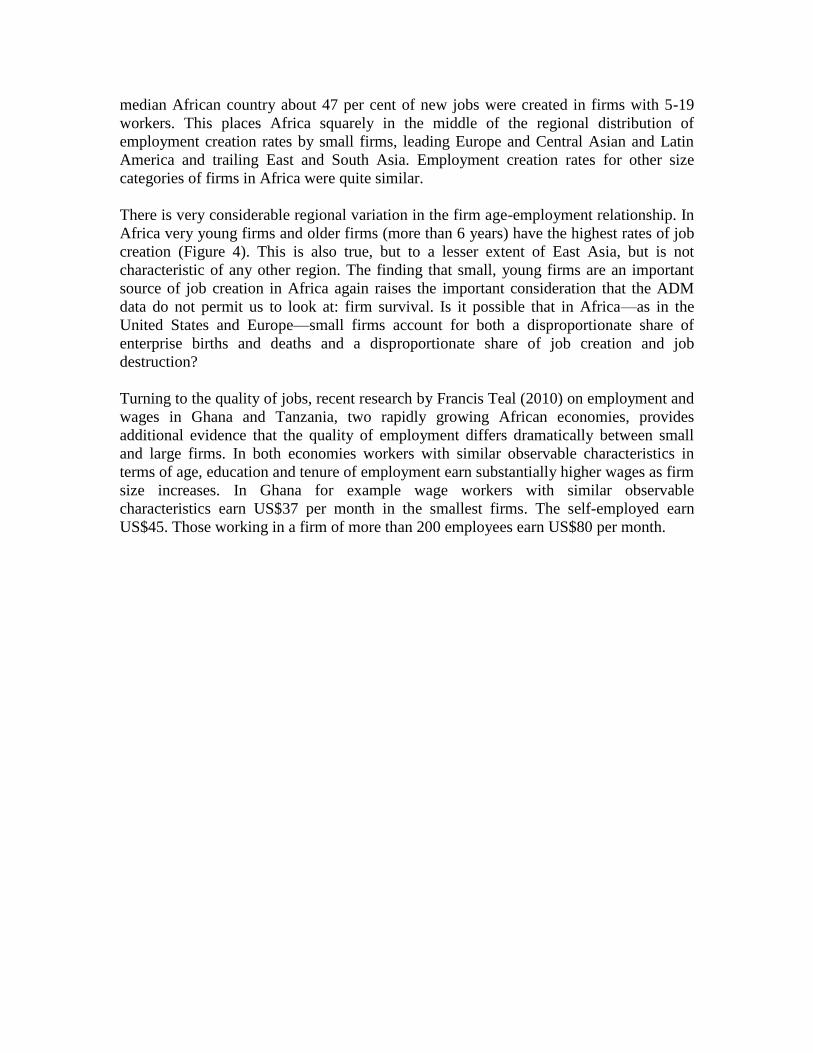
median African country about 47 per cent of new jobs were created in firms with 5-19
workers. This places Africa squarely in the middle of the regional distribution of
employment creation rates by small firms, leading Europe and Central Asian and Latin
America and trailing East and South Asia. Employment creation rates for other size
categories of firms in Africa were quite similar.
There is very considerable regional variation in the firm age-employment relationship. In
Africa very young firms and older firms (more than 6 years) have the highest rates of job
creation (Figure 4). This is also true, but to a lesser extent of East Asia, but is not
characteristic of any other region. The finding that small, young firms are an important
source of job creation in Africa again raises the important consideration that the ADM
data do not permit us to look at: firm survival. Is it possible that in Africa—as in the
United States and Europe—small firms account for both a disproportionate share of
enterprise births and deaths and a disproportionate share of job creation and job
destruction?
Turning to the quality of jobs, recent research by Francis Teal (2010) on employment and
wages in Ghana and Tanzania, two rapidly growing African economies, provides
additional evidence that the quality of employment differs dramatically between small
and large firms. In both economies workers with similar observable characteristics in
terms of age, education and tenure of employment earn substantially higher wages as firm
size increases. In Ghana for example wage workers with similar observable
characteristics earn US$37 per month in the smallest firms. The self-employed earn
US$45. Those working in a firm of more than 200 employees earn US$80 per month.
4 Size, productivity and wages: evidence from the enterprise survey data
In this section we use a subset of the data analyzed by ADM to study how simple
measures of firm performance differ across firms of differing size. We have assembled
data on the following nine African countries: Ethiopia (year 2002; 186 surveyed firms);
Ghana (2007; 293 firms); Kenya (2007; 416 firms); Mozambique (2007; 347 firms);
Nigeria (2007; 1,001 firms); Rwanda (2006; 77 firms); Senegal (2007; 262 firms);
Tanzania (2006; 302 firms); and Uganda (2006; 358 firms).
In all countries, the size range is wide. The smallest firm in our dataset employs two
people while the largest firm has 7,200 employees. The median employment is 14, the
sample average is 57.5, and the coefficient of variation is 3.72. Sixty-one per cent of the
firms in the pooled sample belong to the smallest size group of less than 20 employees,
19 per cent employ between 20 and 49 workers; only 9 per cent of the firms have 50-99
workers and 11 per cent of the firms have more than 100 workers.
Next, we compute differences in simple measures of firm performance for firms of
differing size. Using the pooled dataset, we begin by regressing the logarithm of value-
added per worker on a third-degree polynomial in log employment plus a full set of
country dummies. Based on this regression we plot predicted value-added per worker
normalized by predicted value-added per worker for a firm with 5 employees. The result
is shown in Figure 5.
There is a strong positive relationship between value-added per employee and firm size.
Firms with 30 employees have, on average, twice as much value-added per worker as
firms with 5 employees; hence the size-productivity differential is very pronounced, even
amongst small firms. For firms with 100 employees, value-added per worker is more than
three times higher than that of firms with 5 employees, and for firms with 200 employees,
it is 3.5 times higher. In other words, the average worker in a 200-worker firm produces
as much value-added in 17 minutes as the average worker in a 5-worker enterprise does
in an hour. Note that both types of firms would be categorized as SMEs by the global
definition. This provides further support to our argument, outlined above, that it is
inappropriate to group together, into a single size category, firms that differ so much in
terms of labour productivity.
An important reason why small African firms have much lower labour productivity than
large African firms is that capital intensity varies strongly with firm size. Figure 6 shows
predicted capital intensity computed using the same methodology as for labour
productivity. The patterns are very similar: large African firms use much more capital
stock per worker than do small African firms. The magnitude of the capital intensity
wedge is considerable: a firm with 100 employees uses on average 3 times as much
capital per employee as a firm with 10 employees. Beyond 100 employees, however, the
positive relationship between capital intensity and size disappears.
Figure 7 shows how the average wage paid to workers varies with firm size. The pattern
is the same as for labour productivity and capital intensity: workers in small African
firms are paid far less than employees in larger firms. The earnings of the average worker
in a 100-worker firm are about 80 per cent higher than the earnings of someone working
in a 5-worker enterprise. A significant portion of the size-wage gap is attributable to
differences in skills: large firms tend to hire better educated and more experienced
workers than small firms. However, conditional on skills, there still remains a large,
statistically significant wage difference across small and large firms (e.g. Oi and Idson
1999; Söderbom et al. 2005).
5 The dynamics of jobs and wages: evidence from Ethiopia
We have discussed the limitations inherent in cross-sectional (or recall) data if the
purpose is to study the dynamics of employment. In this section we use detailed
longitudinal data on Ethiopian manufacturing firms to characterize patterns of
employment and wage growth across firms of differing size. Before reporting the results,
we briefly discuss the context and the dataset.
5.1 Industry and development in Ethiopia
Ethiopia is one of the world’s poorest countries, and it has the structural characteristics of
an economy at an early stage of development. Even though agriculture employs 85 per
cent of the labour force, the agricultural sector contributes less to Ethiopia’s gross
domestic product (GDP) than the economy’s other sectors taken together. The differences
in value added per worker across sectors are huge.
Diversification out of agriculture is often argued to be the way forward for Ethiopia.
However, growth in Ethiopia’s non-farm sector has been slow. Even compared to other
countries in SSA, industry and manufacturing in Ethiopia contribute relatively little to the
overall economy: industry contributes about 15 per cent and manufacturing about 5 per
cent. Like many other African countries, the industrial sector in Ethiopia is characterized
by a large number of very small enterprises and a small number of large firms.
Unlike most other African countries, Ethiopia has collected a lot of data on performance
and employment in the manufacturing sector. Most of the existing data derive from
surveys conducted by the Central Statistical Agency (henceforth CSA) of Ethiopia. The
most comprehensive dataset is that based on the Large and Medium Manufacturing
Industries Survey (LMMS), which attempts to cover all manufacturing establishments in
the country that engage ten persons or more and use power-driven machinery.
The survey is conducted every year. In 2007/08 it covered a total of 1,930 firms, and 71
per cent of these had less than 50 employees.9 Hence, by international standards, most
firms included in the survey would be categorized as small firms. Total employment is
133,673 individuals, which amounts to about 0.4 per cent of Ethiopia’s total workforce
and approximately 10 per cent of those in urban wage employment. Hence, from the
point of view of offering jobs, this class of firms currently plays a small role.
9 Authors’ calculations based on data collected by the Central Statistical Agency of Ethiopia as part of
the Large and Medium Manufacturing Industries Surveys (www.csa.gov.et).
Nevertheless, this is the only dataset that contains information on firms and their
development over several years. One of our key objectives is to shed light on the
employment dynamics of small and large firms, and for this purpose the LMMS data are
very useful.10
5.2 The dynamics of job creation
We combine all LMMS datasets from 1995/6 to 2006/07. This yields nearly 10,000 firm-
year observations. Most of these firms entered the market before the first survey year,
1995/6. Because we do not observe the firms that entered and exited the market before
1995/6, by definition, these are surviving firms. This may lead to a selection problem. For
example, the small firms that entered before 1995/6 and survived to be observed after
1995/6 may be particularly good at surviving. Indeed, if we hypothesize that firm
survival depends positively on firm size and some unobserved survival ability, the
existing old small firms observed in 1995/6 will have higher unobserved survival ability
than existing old large firms. Comparing the subsequent survival rates across large and
small firms may lead us to overestimate the ability of small firms to survive.
To tackle the selection problem we focus exclusively on the subsample of new entrants
over the period 1995/6-2005/6. Their existence, by definition, has not been determined by
past survival outcomes. We have identified a total of 133 confirmed true new entrants in
Ethiopian formal manufacturing over this period, so we are dealing with a small sample.
Still, as we shall see, the data appear to be of sufficient quality to reveal some interesting
patterns.
Figure 8 illustrates the dynamics for the new entrants firms after start-up. The horizontal
axis measures time since start-up and the vertical axis shows employment, on a
logarithmic scale. Clearly there is enormous diversity in the growth outcomes of these
firms. A frequent outcome for smaller firms is to go out of business, especially relatively
soon after start-up. For the firms that survive, however, we often observe growth,
especially among smaller firms.
To illustrate the broad patterns in the data better we model firm survival and, conditional
on survival, employment growth for the subset of new entrants only. Table 1 shows the
results from a probit regression model in which exit is the dependent variable, and initial
size (log employment at start-up) and years since start-up (age) are the key explanatory
variables (we also control for year effects but do not report the results in order to
conserve space). The results in specification 1 imply that a 10 per cent increase in
employment reduces the predicted probability of exit by 0.2 per cent. Similarly, a 1 year
increase in firm age reduces the predicted probability of exit by 0.2 per cent. This
10 Manufacturing enterprises which use power-driven machinery and which engage fewer than 10 people
are covered in the Small-Scale Manufacturing Industries Survey. To date, three rounds of this survey
are available, generating data for 2001/02, 2005/06, and 2007/08. It has been estimated that there
existed a total number of 43,338 such micro enterprises in 2007/08, employing 139,000 people, which
corresponds to 0.4 per cent of Ethiopia’s workforce. Unfortunately there is not enough information in
these data to enable researchers to construct a panel data-set; hence these data are not well suited for
analysis of enterprise dynamics.
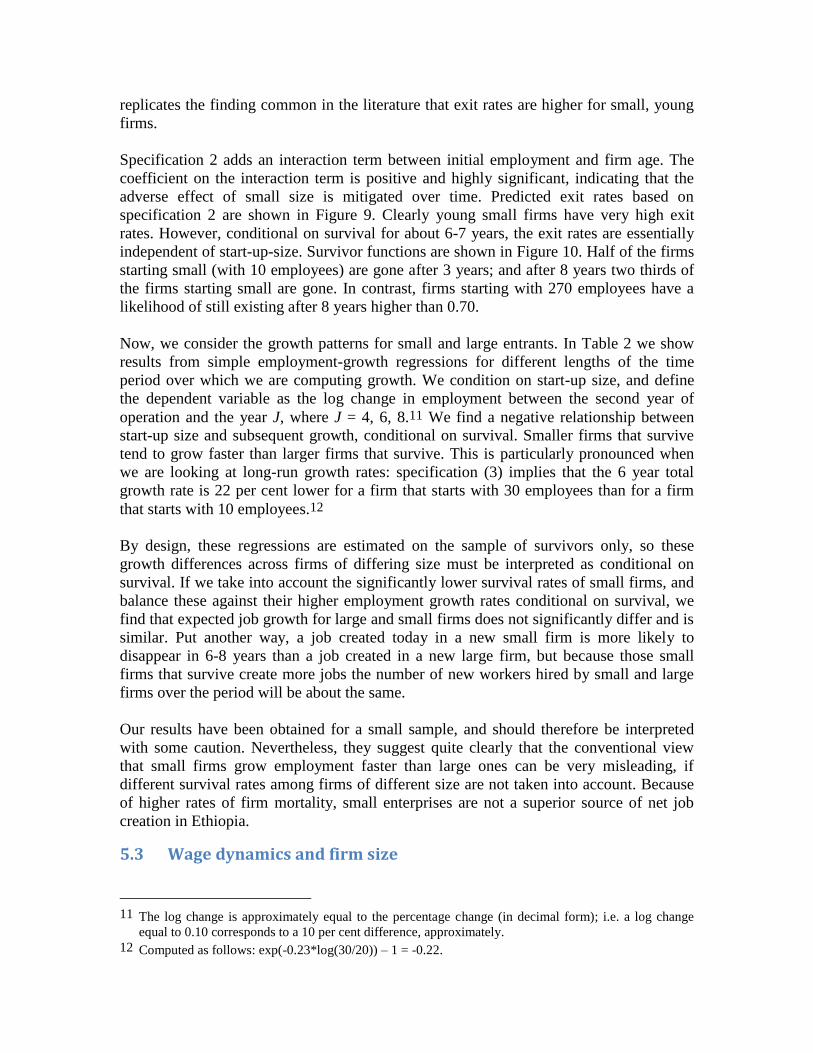
replicates the finding common in the literature that exit rates are higher for small, young
firms.
Specification 2 adds an interaction term between initial employment and firm age. The
coefficient on the interaction term is positive and highly significant, indicating that the
adverse effect of small size is mitigated over time. Predicted exit rates based on
specification 2 are shown in Figure 9. Clearly young small firms have very high exit
rates. However, conditional on survival for about 6-7 years, the exit rates are essentially
independent of start-up-size. Survivor functions are shown in Figure 10. Half of the firms
starting small (with 10 employees) are gone after 3 years; and after 8 years two thirds of
the firms starting small are gone. In contrast, firms starting with 270 employees have a
likelihood of still existing after 8 years higher than 0.70.
Now, we consider the growth patterns for small and large entrants. In Table 2 we show
results from simple employment-growth regressions for different lengths of the time
period over which we are computing growth. We condition on start-up size, and define
the dependent variable as the log change in employment between the second year of
operation and the year J, where J = 4, 6, 8.11 We find a negative relationship between
start-up size and subsequent growth, conditional on survival. Smaller firms that survive
tend to grow faster than larger firms that survive. This is particularly pronounced when
we are looking at long-run growth rates: specification (3) implies that the 6 year total
growth rate is 22 per cent lower for a firm that starts with 30 employees than for a firm
that starts with 10 employees.12
By design, these regressions are estimated on the sample of survivors only, so these
growth differences across firms of differing size must be interpreted as conditional on
survival. If we take into account the significantly lower survival rates of small firms, and
balance these against their higher employment growth rates conditional on survival, we
find that expected job growth for large and small firms does not significantly differ and is
similar. Put another way, a job created today in a new small firm is more likely to
disappear in 6-8 years than a job created in a new large firm, but because those small
firms that survive create more jobs the number of new workers hired by small and large
firms over the period will be about the same.
Our results have been obtained for a small sample, and should therefore be interpreted
with some caution. Nevertheless, they suggest quite clearly that the conventional view
that small firms grow employment faster than large ones can be very misleading, if
different survival rates among firms of different size are not taken into account. Because
of higher rates of firm mortality, small enterprises are not a superior source of net job
creation in Ethiopia.
5.3 Wage dynamics and firm size
11 The log change is approximately equal to the percentage change (in decimal form); i.e. a log change
equal to 0.10 corresponds to a 10 per cent difference, approximately.
12 Computed as follows: exp(-0.23*log(30/20)) – 1 = -0.22.
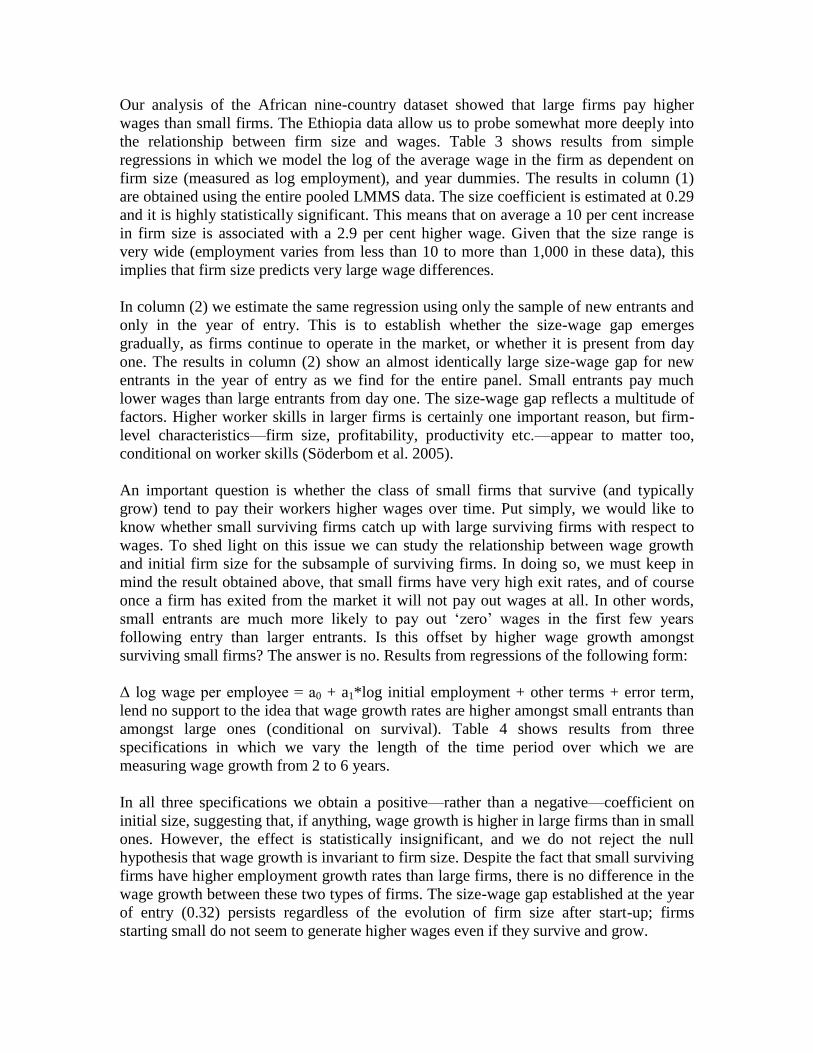
Our analysis of the African nine-country dataset showed that large firms pay higher
wages than small firms. The Ethiopia data allow us to probe somewhat more deeply into
the relationship between firm size and wages. Table 3 shows results from simple
regressions in which we model the log of the average wage in the firm as dependent on
firm size (measured as log employment), and year dummies. The results in column (1)
are obtained using the entire pooled LMMS data. The size coefficient is estimated at 0.29
and it is highly statistically significant. This means that on average a 10 per cent increase
in firm size is associated with a 2.9 per cent higher wage. Given that the size range is
very wide (employment varies from less than 10 to more than 1,000 in these data), this
implies that firm size predicts very large wage differences.
In column (2) we estimate the same regression using only the sample of new entrants and
only in the year of entry. This is to establish whether the size-wage gap emerges
gradually, as firms continue to operate in the market, or whether it is present from day
one. The results in column (2) show an almost identically large size-wage gap for new
entrants in the year of entry as we find for the entire panel. Small entrants pay much
lower wages than large entrants from day one. The size-wage gap reflects a multitude of
factors. Higher worker skills in larger firms is certainly one important reason, but firm-
level characteristics—firm size, profitability, productivity etc.—appear to matter too,
conditional on worker skills (Söderbom et al. 2005).
An important question is whether the class of small firms that survive (and typically
grow) tend to pay their workers higher wages over time. Put simply, we would like to
know whether small surviving firms catch up with large surviving firms with respect to
wages. To shed light on this issue we can study the relationship between wage growth
and initial firm size for the subsample of surviving firms. In doing so, we must keep in
mind the result obtained above, that small firms have very high exit rates, and of course
once a firm has exited from the market it will not pay out wages at all. In other words,
small entrants are much more likely to pay out ‘zero’ wages in the first few years
following entry than larger entrants. Is this offset by higher wage growth amongst
surviving small firms? The answer is no. Results from regressions of the following form:
Δ log wage per employee = a0 + a1*log initial employment + other terms + error term,
lend no support to the idea that wage growth rates are higher amongst small entrants than
amongst large ones (conditional on survival). Table 4 shows results from three
specifications in which we vary the length of the time period over which we are
measuring wage growth from 2 to 6 years.
In all three specifications we obtain a positive—rather than a negative—coefficient on
initial size, suggesting that, if anything, wage growth is higher in large firms than in small
ones. However, the effect is statistically insignificant, and we do not reject the null
hypothesis that wage growth is invariant to firm size. Despite the fact that small surviving
firms have higher employment growth rates than large firms, there is no difference in the
wage growth between these two types of firms. The size-wage gap established at the year
of entry (0.32) persists regardless of the evolution of firm size after start-up; firms
starting small do not seem to generate higher wages even if they survive and grow.

We can now put the two dimensions of firm dynamics—growth and survival—together,
to say something about the overall potential of small and large firms to create and sustain
jobs and high wages. The bottom line is this:
In terms of jobs, there is not much of a difference on average. In small firms jobs tend to disappear at a high rate because of high exit rates for such firms; but if small firms survive they grow faster than larger firms. These two effects roughly balance each other out, so that the expected job growth across small and large entrants is about the same.
In terms of ‘job security’, however, large firms offer the prospect of much more secure employment because they have much higher survival rates.
And, in terms of wages there is a big, big difference. Small firms create low-wage jobs and the evidence suggests wages in small firms do not catch up to those in large firms, even if they grow.
6 Implications for aid
What are the implications for aid—and industrial policy more generally—of our analysis
of employment and wage growth in small and large firms? In a nutshell, we find that if
‘good’ jobs—jobs capable of sustaining employment, paying decent wages, and allowing
for wage growth—are the objective, firm size alone is too blunt an instrument to use in
programmes to support job creation. An effective approach to create good jobs in Africa
needs more subtlety and more imagination. In this section we consider a number of ideas
for a more effective set of public actions to support job creation.
6.1 Aiming at the right target
While—depending on the size cut-off used—small enterprises may be where ‘most of the
jobs are’ in Africa, our evidence indicates that once firm survival is taken into account,
small firms and large firms perform essentially the same in generating new jobs over the
medium term. At least in Ethiopia, the romantic notion that small enterprises are a
powerful engine of job creation is not supported by the evidence. And our Ethiopian
evidence is consistent with what we know about small enterprises and job creation in
other economies. Moreover, the jobs that small firms create are less attractive than those
in larger enterprises. Small firms across Africa have higher job turnover and persistently
lower wages than larger firms. In sum, small firms are the wrong target.
Aid needs to target those firms that are successful at creating ‘better’ jobs. Our evidence
tells us—not surprisingly—that growing firms regardless of size are the ones that create
net new employment and offer the potential for wage growth. But, size alone cannot
predict which firms will grow. Indeed, we know that a small firm is more likely to die
than a larger firm, despite the fact that if the small firm survives it will grow faster. This
argues in the first instance for policies and programmes that reduce the constraints to the
growth of firms, regardless of size.
6.2 Strengthening the investment climate
Aid can reduce the constraints to firm growth by supporting public actions to improve the
‘investment climate’—the regulatory, institutional and physical environment within
which firms operate. Investment climate reforms are a traditional ‘product’ of the aid
industry in Africa. Around one quarter of official development assistance, some US$21
billion per year, currently supports investment climate improvements (Page 2012).
However, the way in which the international community has chosen to define priorities
for the reform of the investment climate needs to be changed. Too much donor effort has
been expended on achieving easily measured but low impact regulatory reforms and too
little effort on relieving an important physical constraint, lack of infrastructure.
Institutional and regulatory reform
The donor agenda for the investment climate has largely centered on changes in trade,
regulatory, and labour market policies designed to reduce the role of government in
economic management. This is not inappropriate. Surveys of manufacturing firms in
Africa highlight a number of areas in which regulatory or administrative burdens impose
cost penalties that limit the growth of firms (Clarke 2005; Yoshino 2008; Farole 2011).
The cost of doing business in Africa is 20–40 per cent above that for other developing
regions.13 But, both the main instrument used by the aid community and the approach to
identifying the binding constraints to enterprise growth have been misguided.
The most widely used global benchmark of regulatory burden is the World Bank Doing
Business ranking. In 2011 Africa’s average rank (moving from 1 as the best country-level
environment to 183 as the worst) was 137. It is therefore tempting to argue that African
governments should target rapid progress in moving up the Doing Business rankings as
the primary objective of the institutional and regulatory reform agenda. And indeed,
driven in part by the relentless promotion of the World Bank, Doing Business has become
the centerpiece of the donor dialogue on the investment climate in many African
countries (Page 2011).
But Doing Business is not an appropriate instrument to identify the regulatory constraints
that actually inhibit the growth of firms at the country level. It was never designed to be
used as a country-level diagnostic tool; it is a cross-country benchmarking exercise. The
indicators were developed to support cross-country comparisons on the basis of common
criteria generated in Washington. They are also uniformly weighted. But at the country
level not all reforms will have equal impact.
Close co-ordination between the public and private sectors is needed to identify the
regulations and institutions which offer the greatest scope for growth enhancing reforms.
But, the massive literature on rent seeking and government failures suggests that in many
cases a close relationship between business and government can lead to inappropriate
policies. Helping governments manage the tension between close co-ordination and
13 There is by now a large literature on the costs of doing business in Africa. See for example the Africa
Competitiveness Report of the AfDB, World Economic Forum and the World Bank.
capture is an appropriate area for innovation in aid. Rather than leading the donor-country
dialogue, changes in the doing business ranking ought properly to be viewed as an
outcome not an objective of a well-designed regulatory reform programme.
Closing the infrastructure gap
Firm-level studies of productivity in Africa highlight infrastructure deficiencies as a
significant barrier to enterprise growth. SSA lags at least 20 percentage points behind the
average for low-income countries on almost all major infrastructure measures. In addition
the quality of service is low, supplies are unreliable, and disruptions are frequent and
unpredictable. African firms report losing 5 per cent of their sales because of frequent
power outages—a figure that rises to 20 per cent for firms unable to afford backup
generation (World Bank 2009).
Closing Africa’s infrastructure gap will require around US$93 billion a year, about 15 per
cent of the region’s GDP. Forty per cent of the total spending needs are for power, alone.
Until quite recently Africa’s traditional development partners have shown little
willingness to finance infrastructure. Despite the magnitude of the infrastructure gap,
infrastructure financing by the members of the OECD Development Assistance
Committee (DAC) has been falling as a share of ODA since the early 1970s. While it is
clearly unrealistic in the current fiscal environment in the OECD to count on aid to fill
the infrastructure financing gap, new approaches and products such as guarantee
instruments could leverage limited donor financing by reducing the perceived risk of
private debt financing for infrastructure.
6.3 Building firm capabilities
In most industries productivity and quality are determined by a set of interlocking
elements of ‘know how’, ‘tacit knowledge’ or ‘working practices’ of the individuals who
comprise the firm’s workforce—both managers and workers (Nelson and Winter 1982;
Sutton 2004). These ‘firm capabilities’ are used either in the course of production or in
developing new products (Sutton 2005). A central insight of the capabilities literature is
that in most industries capability is not codified in a piece of knowledge that can be
embodied in a blueprint or ‘technology’ it is the result of learning. Capabilities are a
critical constraint to the growth of firms and jobs in Africa. Aid agencies can support the
acquisition and dissemination of firm capabilities by supporting government efforts to
attract foreign direct investment (FDI) and through management training.
Attracting foreign direct investment
Because firm capabilities are not codified, both the initial introduction of new capabilities
and their eventual transfer to other firms depend primarily on firm to firm interactions.
Foreign direct investment (FDI) is one means of introducing high capability firms into a
lower capability environment. Policies and institutions for attracting FDI are therefore a
key tool in capability building. This is an area where properly designed investment
climate reforms can have a large payoff by making it easier to attract FDI.
Moving beyond the investment climate, the work of Ireland’s Industrial Development
Authority in the 1960s has provided an institutional model for attracting and keeping FDI
that has become international best practice (Barry 2004). A small, elite agency under the
office of the president or prime minister is set up. Three features of this agency play a
crucial role in its success: independence, high quality personnel, and focus.
Best practice FDI agencies excel at three phases of the foreign investment cycle:
recruitment, embedding and after care. Active recruitment requires ‘selling the country’.
This is one reason why a formal link to and the active participation of the national chief
executive is critical. Embedding the new foreign investor involves acting as a middle-
man between the firm and the business environment. The domestic regulatory and
administrative requirements may be complex, and the job of the agency is to minimize
their costs to the new foreign investor. After-care is concerned with removing
unnecessary obstacles to the operation and growth of the enterprise.
Although this approach to FDI promotion has spread in Africa over the past decade,
implementation has not always yielded best practice results. Often agencies lack the
active support of the chief executive. Personnel practices and compensation policies may
not be sufficiently attractive to make it possible to recruit the high caliber staff needed,
and the agencies are frequently burdened with multiple objectives, diluting focus (Page
2011). Donors should assign priority to supporting the development of effective foreign
investment promotion agencies at the country level.
Management training
As economists have devoted increasing attention to the role of ‘capabilities’ in
determining productivity and growth of firms in developing countries, managerial human
capital and management practices have received increasing attention (Bloom and Van
Reenen 2007, 2010; Bloom et al. 2010, 2011; Syverson 2011). Case studies of the
development of manufacturing firms in Asia and Africa consistently show that better
management leads to improvements in productivity and profitability. Better managed
firms also have higher survival rates (Sonobe and Otsuka 2006, 2011). Randomized
experiments in Latin America have found that the majority of business owners—
especially among small firms—have inadequate knowledge of basic management and
that rudimentary management training can improve business practices (Bloom et al.
2010).
Since 2007, the World Bank and the Japan International Co-operation Agency (JICA)
have conducted pilot projects in which management training was provided free of charge
to small manufacturing firm owners in Ethiopia, Ghana, Kenya, and Tanzania. The
projects provide an elementary management training programme for micro and small-
scale firms in an industrial cluster. They attempt to test whether participants are willing to
learn about management and to what extent management training improves firms’
performance. Evaluations of the programmes found that participants had very limited
knowledge of standard management practices.

The training programmes had strong effects on the adoption of standard management
practices and on firm owner’s willingness to pay for admission to a similar training
programme in future. The majority of the invited participants attended the training
sessions, and many adopted the management practices taught in the programme (Mano et
al. 2011; Sonobe et al. 2011). Training increased the percentage of participants adopting
the recommended practices from near zero to 50 per cent (Sonobe et al. 2011). There was
also some evidence of information spillovers from the training participants to non-
participants, although very few of those in the untrained ‘control’ group adopted the
majority of the new practices available to the trainees. Importantly, the experimental data
also suggested that the training participants were less likely to exit the industry (Otsuka
and Sonobe 2011).
These results suggest that for donors interested in accelerating employment growth,
programmes of management and technical training have a potentially large payoff. But,
once again, managerial training initiatives should be size neutral. The work of Bloom and
his collaborators suggests that large scale firms (those with more than 250 workers)
benefit significantly from management training interventions in Asia and Latin America.
While there is far less evidence for Africa, there is no reason a priori to believe that
managers in firms with more than 100 workers in Africa possess superior management
skill to those found in India or Mexico. It is likely to be the case, however, that the
content of training programmes will need to be tailored to firms of different size. Further
research on the impacts of training, the content and design of training programmes, and
the way in which training is institutionalized and can be scaled up is warranted.
6.4 Targeting programmes at firms
An attractive characteristic of small enterprise programmes for donors is that they are
targeted, albeit at the wrong target. This provides a way to give a simple message of the
type quoted in the introduction linking jobs and aid. In this section we ask whether it is
feasible to introduce new, targeted programmes to address the specific constraints faced
by different size classes of firms. Our evidence suggests that to be effective at creating
more good jobs targeted programmes would need to act in one or more of the following
ways:
by increasing the survival rate of small firms,
by accelerating the growth rate of surviving firms, or
by closing the wage gap between small and large enterprises.
The enterprise surveys organized by the World Bank have generated some data on the
perceived obstacles to investment and growth by firms. Each respondent participating in
the surveys was asked to indicate whether a particular issue presented ‘no obstacle’, ‘a
minor obstacle’, ‘a moderate obstacle’, ‘a major obstacle’ or a ‘very severe obstacle’ to
the operations of the firm. Using these data for the nine African countries identified
above, we coded the answers from zero to four, with high numbers implying a more
serious constraint.
Figure 11 summarizes sample averages for small (less than 50 employees) and large (50
or more employee) firms. The constraints faced by African firms are somewhat different
depending on firm size, but the difference is perhaps less striking than one might expect.
Quite clearly many respondents in both small and large firms perceive electrical power to
be a serious problem. Transportation is particularly problematic for large firms. These
results reinforce our message on the need to close the infrastructure gap, but they do not
call for differing policy responses for small and large enterprises.
Access to finance is ranked as the second biggest problem on average for small firms, but
it is less of a problem for larger firms. The financial constraints faced by firms are likely,
however, to be much more nuanced than the ICA survey questions are able to capture.
For example, micro-finance may be an effective instrument for alleviating financial
constraints for small firms, while developing equity markets may help larger firms.
Corruption and crime appear to be more problematic for large than for small firms. Small
firms identify access to land as a more serious obstacle than do larger firms. Small firms
in particular claim not to be very constrained by insufficient labour skills. Given the
broad definitions of the questions asked in the ICA surveys and the diversity of
responses, it will be difficult to design effective reforms aimed at the constraints to
growth for firms of different size from such surveys.
A better way for aid to address the specific constraints to job creation and growth in
Africa might be to experiment more boldly with interventions designed to identify firms
with the potential for growth. Rather than providing targeted support (such as training or
subsidized loans) to small firms at start-up, donors might consider, for example, giving an
unconditional small grant to new entrants below a certain size in some sector.
We know small new entrants have high exit rates, and it seems possible finance and lack
of working capital is part of the reason; but we do not know for sure. We can observe
over a period of, say, two years which firms have been able to survive and, because the
business environment is slow-changing, infer that these firms are likely to survive for
several more years. Government and donors can use information gathered from the
surviving firms to provide them with support tailored to their needs. At that point the
bottleneck might not be finance (after all, the firms have by now had some time to
accumulate own savings); perhaps inadequate marketing skills or distribution channels
will matter more.
7 Conclusions
The events of the Arab Spring have put job creation on the front burner of development
assistance. In Africa, which faces a demographic threat (or dividend) every bit as large as
the Middle East, this has led to a search for solutions to the ‘employment problem’. One
such solution has been to support the growth of small-scale enterprises. Based largely on
the political rhetoric of the developed world, donors have assumed that small enterprises
are ‘where the jobs are’ and that by growing this size class of firms, net employment can
be increased rapidly in low-income countries.
In this paper we have focused on the performance of small and large firms in the formal
sector—operationally defined as those that use power and keep some rudimentary
books—and on their ability to generate good jobs. We find no difference between small
and large firms in their ability to generate net new jobs. Panel data on Ethiopian
manufacturing firms indicate that the more rapid growth of small firms is offset by a very
high rate of firm failures.
Our data on firms in nine SSA countries show that large firms have substantially higher
levels of productivity and pay much higher wages than small firms. And, we find from
the Ethiopian data that wages remain low over time in small surviving firms, despite
rapid employment growth. These results—coupled with the finding that most small firms
die young—lead us to conclude that small enterprises in Africa have limited ability to
offer good jobs. If a worker finds a place in a small firm he is more likely to lose his job,
less likely to improve his skills and unlikely ever to catch up in terms of wages to
workers in a larger firm.
From a policy point of view, perhaps the main insight of our analysis is that firm size
alone is too crude a measure of employment potential for it to be of much use to policy
makers. Some small firms manage to survive and grow but many fail and die, and our
understanding of why some firms ‘make it’ and others do not is poor. It is true that many
small firms identify access to finance as an important obstacle to business operation. But
no compelling evidence exists indicating that better access to finance would lead to more
rapid growth and higher survival rates for small firms. Moreover, finance is far from the
only constraint.
More broadly, our results provide a caution against targeting programmes of support to
firms on the basis of ex ante criteria, no matter how appealing and apparently grounded in
‘fact’. If we take as a starting point that:
business people know far better than policy makers and academics what works in business and what does not, and
improving the business climate will take several years,
it follows that policy should be reasonably hands-off (due to the information problem)
and long-term (due to the time problem). Exactly what would be effective policy in a
particular setting is likely to be idiosyncratic to the specific context. Accurate diagnosis at
a level of detail relevant to effective policy making takes an exchange of information
between government and business and time. This in turn suggests that much closer co-
ordination with the private sector will be needed to identify the ‘binding constraints’ to
firm growth.
What do our results mean for aid? First and foremost, that it is time to stop overselling
small enterprise development as the panacea for employment creation in Africa. While it
is popular to extoll the virtues of small businesses both in high-income and developing
countries, their supposed preeminence as ‘job creators’ is not supported by the evidence
in either setting. Moreover, if the objective is to create ‘good’ jobs, and not just any job, a
much more nuanced approach to aid and employment will be needed.
A more productive approach for aid would be to support the more rapid growth of firms
of any size. One traditional ‘product line’ of the aid industry can be redesigned and
expanded to support the growth of firms: reform of the investment climate. A better
policy, regulatory, and physical environment would benefit all firms in Africa, large and
small. But much more thought and attention needs to be given to how aid can support
investment climate reforms.
Moving beyond the investment climate, operations and research aimed at increasing firm
capabilities may offer some prospect of helping African firms of all sizes to grow and
create better jobs. In one area—promotion of FDI—we are reasonably confident that
better efforts to support the establishment of world class FDI promotion agencies would
yield benefits in excess of their costs. We also believe that management training can play
a positive role in capabilities building, but here we are more agnostic as to how the
beneficiaries of such training efforts should be identified, and indeed what the content of
the training should cover. More innovations by aid providers, supported by impact
evaluation, will be needed to get a fix on the costs and benefits of such programmes.
Small enterprises are not the magic bullet to solve Africa’s growing employment
problem. Neither are they irrelevant. The hard work for aid policy remains, as it always
has, to find programmes that boost private investment in the growth of good jobs for
firms of all sizes.
References
Ayyagari, M., A. Demirgüç-Kunt, and V. Maksimovic (2011). ‘Small vs. Young Firms
Across the World’. Policy Research Working Paper 5631, Washington, DC: World
Bank.
Barry, F. (2004). ‘Export Platform FDI: the Irish Experience’. EIB Papers, 9(2): 8-37.
Biggs, T. (2002). ‘Is Small Beautiful and Worthy of Subsidy? Literature Review’.
Washington, DC: International Finance Corporation.
Biggs, T., and M.K. Shah (2005). ‘African SMES, Networks, and Manufacturing
Performance’. Washington, DC: World Bank.
Birch, D.L. (1987). Job Creation in America: How Our Smallest Companies Put the Most
People to Work. New York: Free Press.
Brown, C., J. Hamilton, and J. Medoff (1990). Employers: Large and Small. Cambridge.
MA: Harvard University Press.
Bloom, N., and J. Van Reenen (2007). ‘Measuring and Explaining Management Practices
Across Firms and Countries’. The Quarterly Journal of Economics, 122(4): 1351-
1408.
Bloom, N., A. Mahajan, D. McKenzie, and J. Roberts (2010). ‘Why Do Firms in
Developing Countries Have Low Productivity?’ American Economic Review: Papers
and Proceedings, 100(2), 619-23.
Bloom, N., and J. Van Reenen (2010). ‘Why Do Management Practices Differ Across
Firms and 26 Countries?’. Journal of Economic Perspectives, 24(1): 203-22.
Bloom, N., B. Eifert, A. Mahajan, D. McKenzie, and J. Roberts (2011). ‘Does
Management Matter? Evidence from India’. Policy Research Working Paper No.
5573, World Bank.
Clarke, G.R.G. (2005). ‘Beyond Tariffs and Quotas: Why Don’t African Manufacturer
Export More?’ Policy Research Working Paper 4317, Washington, DC: World Bank.
Dalberg (2011). Report on Support to SMEs in Developing Countries through Financial
Intermediaries Geneva: Dalberg Global Development Advisors.
Davis, S.J., J.C. Haltiwanger, and S. Schuh (1996). Job Creation and Destruction.
Cambridge, MA: MIT Press.
Dunne, T., M.J. Roberts, and L. Samuelson (1988). ‘Patterns of Firm Entry and Exit in
U.S. Manufacturing Industries’. The RAND Journal of Economics, 19:(4): 495-515.
EU (2012). ‘Accountability Report 2012’. Review of Progress of the EU and its Member
States Financing for Development. Brussels: EU.
Farole, T. (2011). Special Economic Zones in Africa: Comparing Performance and
Learning from Experience. Washington, DC: World Bank.
Haltiwanger, J., S. Scarpetta, and H. Schweiger (2010). ‘Cross Country Differences in
Job Reallocation: the Role of Industry, Firm Size and Regulations’. Working Papers
116, European Bank for Reconstruction and Development, Office of the Chief
Economist.
Haltiwanger, J.C., R.S. Jarmin, and J. Miranda (2010). ‘Who Creates Jobs? Small vs.
Large vs. Young’. NBER Working Paper No. 16300. Cambridge, MA: NBER.
Hsieh, C.-T., and P. Klenow (2009). ‘Misallocation and Manufacturing TFP in China and
India’. Quarterly Journal of Economics, CXXIV (4): 1403-48.
Mano, Y., A. Iddrisu, Y. Yoshino, and T. Sonobe (2011). ‘How Can Micro and Small
Enterprises in Sub-Saharan Africa Become More Productive? The Impacts of
Experimental Basic Managerial Training’. Tokyo: National Graduate Institute for
Policy Studies.
Mazundar, D. (1999). ‘Employment and Inequality Outcomes in India’. Paris: OECD.
McKinsey and Co. (2010). Two Trillion and Counting Assessing the Credit Gap for
Micro, Small, and Medium-size Enterprises in the Developing World. Washington,
DC: IFC http://mckinseyonsociety.com/downloads/reports/Economic-
Development/Two_trillion_and_counting.pdf
McKinsey (2011). Micro-, Small- and Medium-sized Enterprises in Emerging Markets:
How Banks can Grasp a $350 Billion Opportunity. New York: McKinsey and
Company.
Nelson, R., and S. Winter (1982). An Evolutionary Theory of Economic Change.
Cambridge, MA: Harvard University Press.
OECD (2009). ‘The Growing Role of the Development Finance Institutions in
International Development Policy’. Paris: OECD.
Oi, W.Y., and T.L. Idson (1999). ‘Firm Size and Wages’. In O. Ashenfelter and D. Card
(eds), Handbook of Labor Economics, Vol. 3B, Handbooks in Economics, Vol. 1.
Elsevier, North-Holland, pp. 2165-2214.
Otsuka, K., and T. Sonobe (2011). ‘A Cluster-Based Industrial Development Policy for
Low-Income Countries’. Policy Research Working Paper No. 5703. Washington, DC:
World Bank.
Page, J. (2012). ‘Aid, the Private Sector and Structural Transformation in Africa’. UNU-
WIDER Working Paper, 2012/21. Helsinki: UNU-WIDER.
Rosenzweig, M.R. (1988). ‘Labor Markets in Low-Income Countries’. In Handbook of
Development Economics, Vol. 1, H.B. Chenery and T.N. Srinivasan (eds).
Amsterdam: North-Holland.
Siegesmund, P., and J. Glisovic (2011). ‘Estimating Funder Support for Small and
Medium Enterprises (SMEs). Washington, DC: CGAP.
Söderbom, M., F. Teal, and A. Wambugu (2005). ‘Unobserved Heterogeneity and the
Relation between Earnings and Firm Size: Evidence from Two Developing Countries’.
Economics Letters, 87: 153-59.
Sonobe, T., A. Suzuki, and K. Otsuka (2011). KAIZEN for Managerial Skills
Improvement in Small and Medium Firms: An Impact Evaluation Study, Japan PHRD
Trust Fund No. TF096317. Washington, DC: World Bank.
Sutton, J. (2005). ‘Competing in Capabilities: An Informal Overview’. London: London
School of Economics.
Sutton, J. (2004). ‘Competing in Capabilities’. Clarendon Lectures, University of Oxford.
Oxford: University of Oxford.
Syverson, C. (2011). ‘What Determines Productivity?’. Journal of Economic Literature,
49(2): 326-65.
Teal, F. (2010). ‘Higher Education and Economic Development in Africa: A Review of
Channels and Interactions’. CSAE WPS/2010-25, Centre for the Study of African
Economies, University of Oxford.

World Bank (2009). Transforming Africa’s Infrastructure. Washington, DC: World
Bank.
Yoshino, Y. (2008). ‘Domestic Constraints, Firm Characteristics, and Geographical
Diversification of Firm-Level Manufacturing Exports in Africa’. Policy Research
Working Paper, 4575. Washington, DC: World Bank.
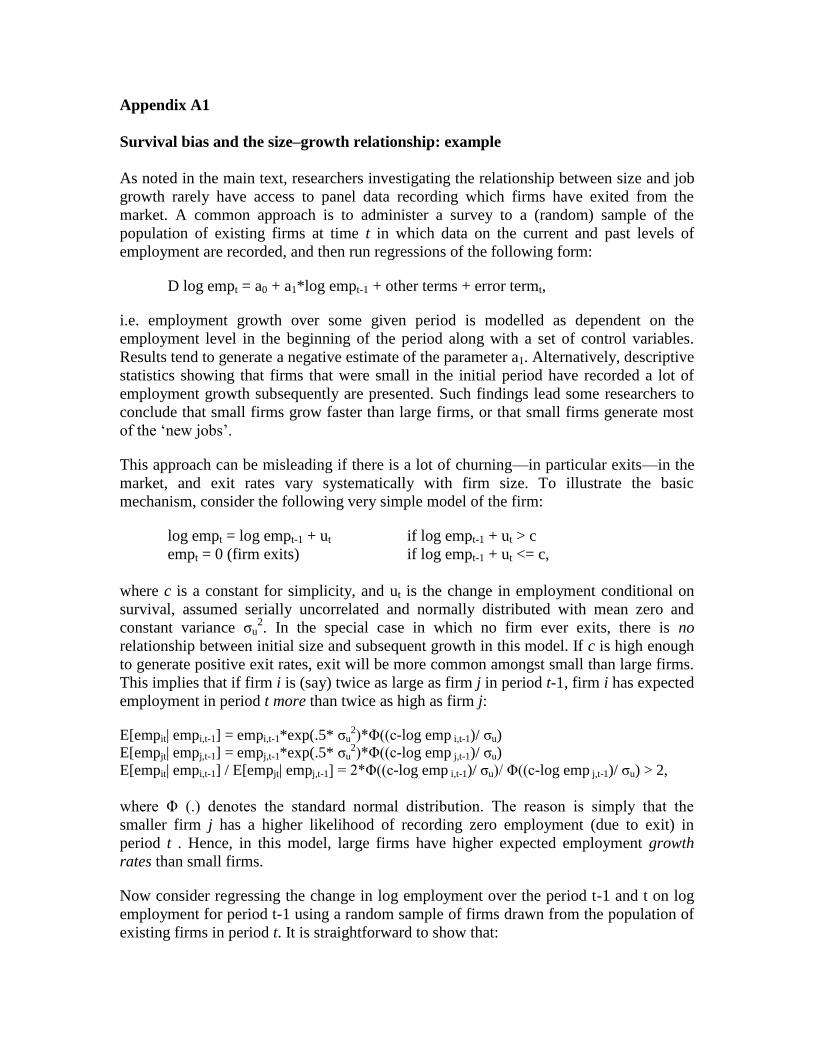
Appendix A1
Survival bias and the size–growth relationship: example
As noted in the main text, researchers investigating the relationship between size and job
growth rarely have access to panel data recording which firms have exited from the
market. A common approach is to administer a survey to a (random) sample of the
population of existing firms at time t in which data on the current and past levels of
employment are recorded, and then run regressions of the following form:
D log empt = a0 + a1*log empt-1 + other terms + error termt,
i.e. employment growth over some given period is modelled as dependent on the
employment level in the beginning of the period along with a set of control variables.
Results tend to generate a negative estimate of the parameter a1. Alternatively, descriptive
statistics showing that firms that were small in the initial period have recorded a lot of
employment growth subsequently are presented. Such findings lead some researchers to
conclude that small firms grow faster than large firms, or that small firms generate most
of the ‘new jobs’.
This approach can be misleading if there is a lot of churning—in particular exits—in the
market, and exit rates vary systematically with firm size. To illustrate the basic
mechanism, consider the following very simple model of the firm:
log empt = log empt-1 + ut if log empt-1 + ut > c
empt = 0 (firm exits) if log empt-1 + ut <= c,
where c is a constant for simplicity, and ut is the change in employment conditional on
survival, assumed serially uncorrelated and normally distributed with mean zero and
constant variance σu2. In the special case in which no firm ever exits, there is no
relationship between initial size and subsequent growth in this model. If c is high enough
to generate positive exit rates, exit will be more common amongst small than large firms.
This implies that if firm i is (say) twice as large as firm j in period t-1, firm i has expected
employment in period t more than twice as high as firm j:
E[empit| empi,t-1] = empi,t-1*exp(.5* σu2)*Φ((c-log emp i,t-1)/ σu)
E[empjt| empj,t-1] = empj,t-1*exp(.5* σu2)*Φ((c-log emp j,t-1)/ σu)
E[empit| empi,t-1] / E[empjt| empj,t-1] = 2*Φ((c-log emp i,t-1)/ σu)/ Φ((c-log emp j,t-1)/ σu) > 2,
where Φ (.) denotes the standard normal distribution. The reason is simply that the
smaller firm j has a higher likelihood of recording zero employment (due to exit) in
period t . Hence, in this model, large firms have higher expected employment growth
rates than small firms.
Now consider regressing the change in log employment over the period t-1 and t on log
employment for period t-1 using a random sample of firms drawn from the population of
existing firms in period t. It is straightforward to show that:
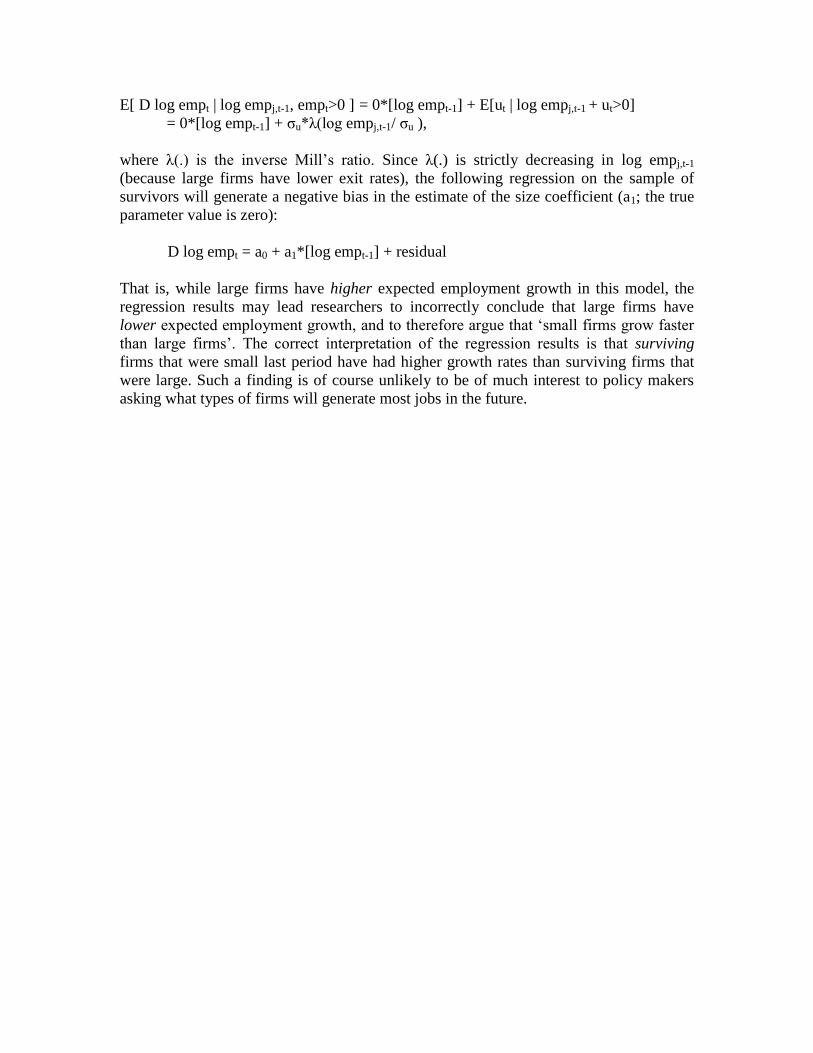
E[ D log empt | log empj,t-1, empt>0 ] = 0*[log empt-1] + E[ut | log empj,t-1 + ut>0]
= 0*[log empt-1] + σu*λ(log empj,t-1/ σu ),
where λ(.) is the inverse Mill’s ratio. Since λ(.) is strictly decreasing in log empj,t-1
(because large firms have lower exit rates), the following regression on the sample of
survivors will generate a negative bias in the estimate of the size coefficient (a1; the true
parameter value is zero):
D log empt = a0 + a1*[log empt-1] + residual
That is, while large firms have higher expected employment growth in this model, the
regression results may lead researchers to incorrectly conclude that large firms have
lower expected employment growth, and to therefore argue that ‘small firms grow faster
than large firms’. The correct interpretation of the regression results is that surviving
firms that were small last period have had higher growth rates than surviving firms that
were large. Such a finding is of course unlikely to be of much interest to policy makers
asking what types of firms will generate most jobs in the future.
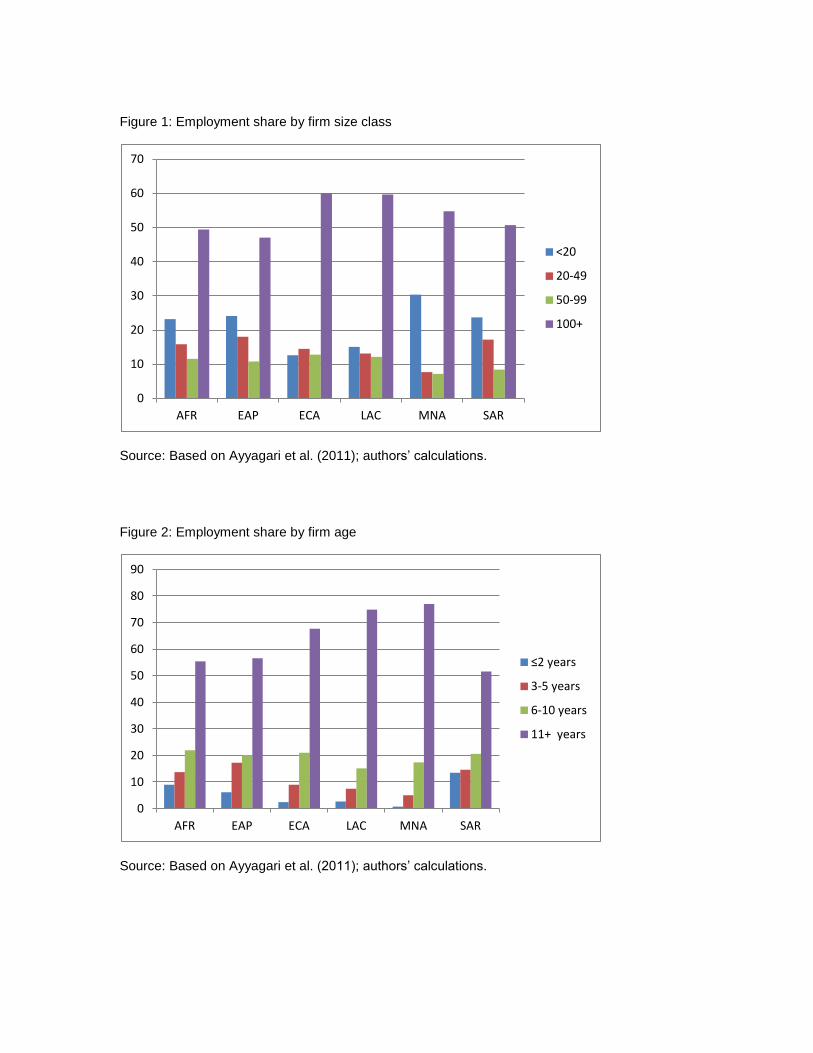
Figure 1: Employment share by firm size class
Source: Based on Ayyagari et al. (2011); authors’ calculations. Figure 2: Employment share by firm age
Source: Based on Ayyagari et al. (2011); authors’ calculations.
0
10
20
30
40
50
60
70
AFR EAP ECA LAC MNA SAR
<20
20-49
50-99
100+
0
10
20
30
40
50
60
70
80
90
AFR EAP ECA LAC MNA SAR
≤2 years
3-5 years
6-10 years
11+ years

Figure 3: Job creation as a share of total job creation by firm size class
Source: Based on Ayyagari et al. (2011); authors’ calculations. Figure 4: Job creation as a share of total job creation by firm age
Source: Based on Ayyagari et al. (2011); authors’ calculations.
-60
-40
-20
0
20
40
60
80
100
120
AFR EAP ECA LAC SAR
<20
20-49
50-99
100+
-80
-60
-40
-20
0
20
40
60
80
100
AFR EAP ECA LAC SAR
≤2 years
3-5 years
6-10 years
11-20 years

Figure 5: Value-added per worker and firm size in nine African countries
Note: The graph shows predicted value added per worker based on a regression of log value added per worker on a third-order polynomial in log employment and country dummies. The predictions are normalized at 100 for a firm with five employees. Source: Authors’ calculations based on firm-level data from Ethiopia (year 2002), Ghana (2007), Kenya (2007), Mozambique (2007), Nigeria (2007), Rwanda (2006), Senegal (2007), Tanzania (2006), and Uganda (2006), collected as part of the World Bank’s Enterprise Surveys (www.enterprisesurveys.org).
10
015
020
025
030
035
0
Afr
ica
0 100 200 300Employment
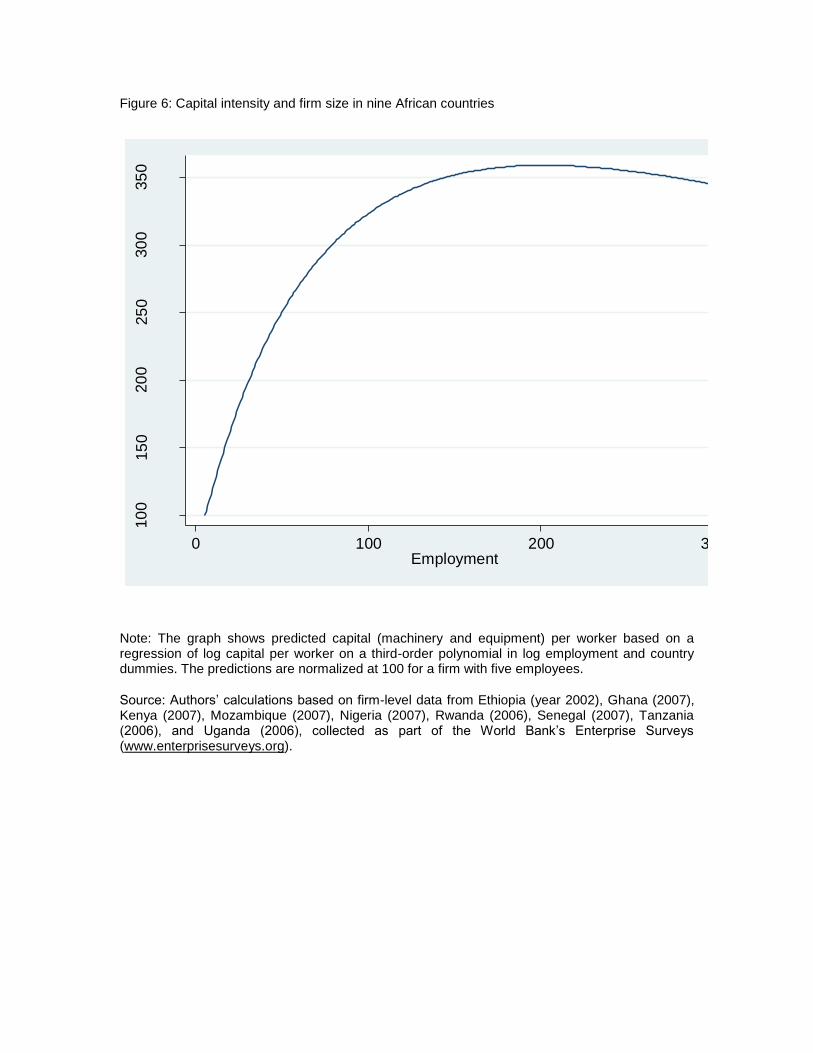
Figure 6: Capital intensity and firm size in nine African countries
Note: The graph shows predicted capital (machinery and equipment) per worker based on a regression of log capital per worker on a third-order polynomial in log employment and country dummies. The predictions are normalized at 100 for a firm with five employees.
Source: Authors’ calculations based on firm-level data from Ethiopia (year 2002), Ghana (2007), Kenya (2007), Mozambique (2007), Nigeria (2007), Rwanda (2006), Senegal (2007), Tanzania (2006), and Uganda (2006), collected as part of the World Bank’s Enterprise Surveys (www.enterprisesurveys.org).
10
015
020
025
030
035
0
Afr
ica
0 100 200 300Employment
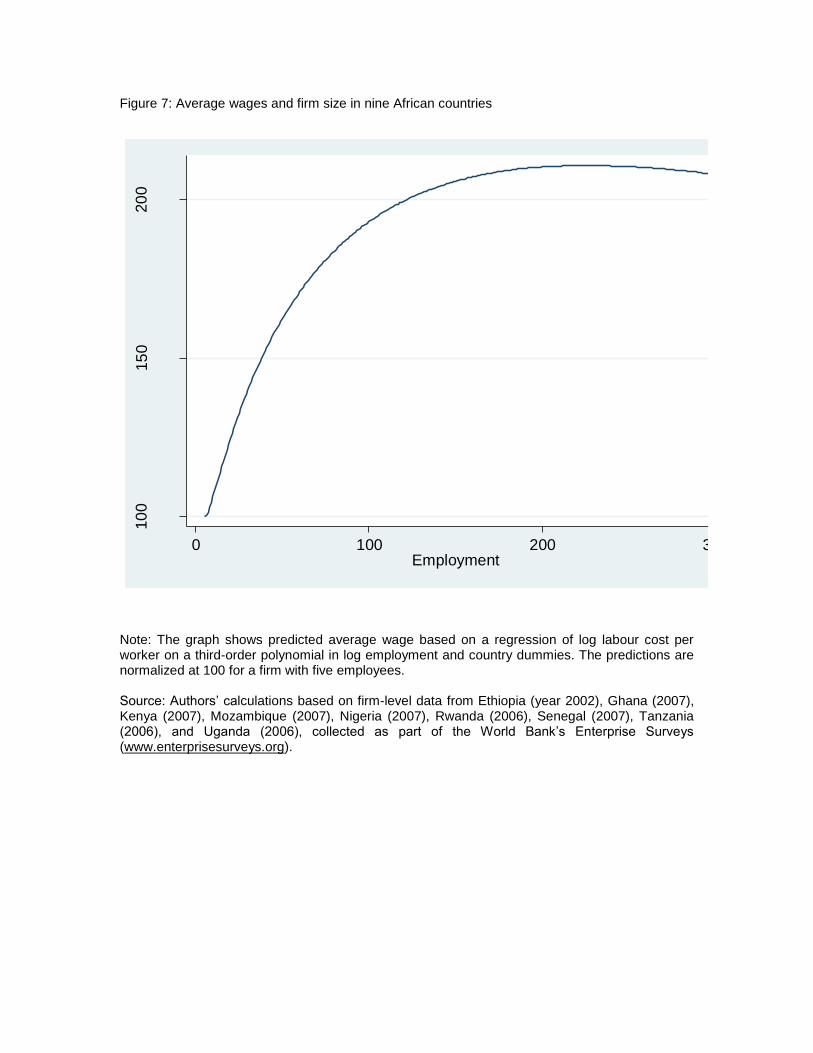
Figure 7: Average wages and firm size in nine African countries
Note: The graph shows predicted average wage based on a regression of log labour cost per worker on a third-order polynomial in log employment and country dummies. The predictions are normalized at 100 for a firm with five employees. Source: Authors’ calculations based on firm-level data from Ethiopia (year 2002), Ghana (2007), Kenya (2007), Mozambique (2007), Nigeria (2007), Rwanda (2006), Senegal (2007), Tanzania (2006), and Uganda (2006), collected as part of the World Bank’s Enterprise Surveys (www.enterprisesurveys.org).
10
015
020
0
Afr
ica
0 100 200 300Employment

Figure 8: The dynamics of new entrants in Ethiopian manufacturing

Source: Authors’ calculations based on data collected by the Central Statistical Agency of Ethiopia as part of the Large and Medium Manufacturing Industries Surveys (www.csa.gov.et).
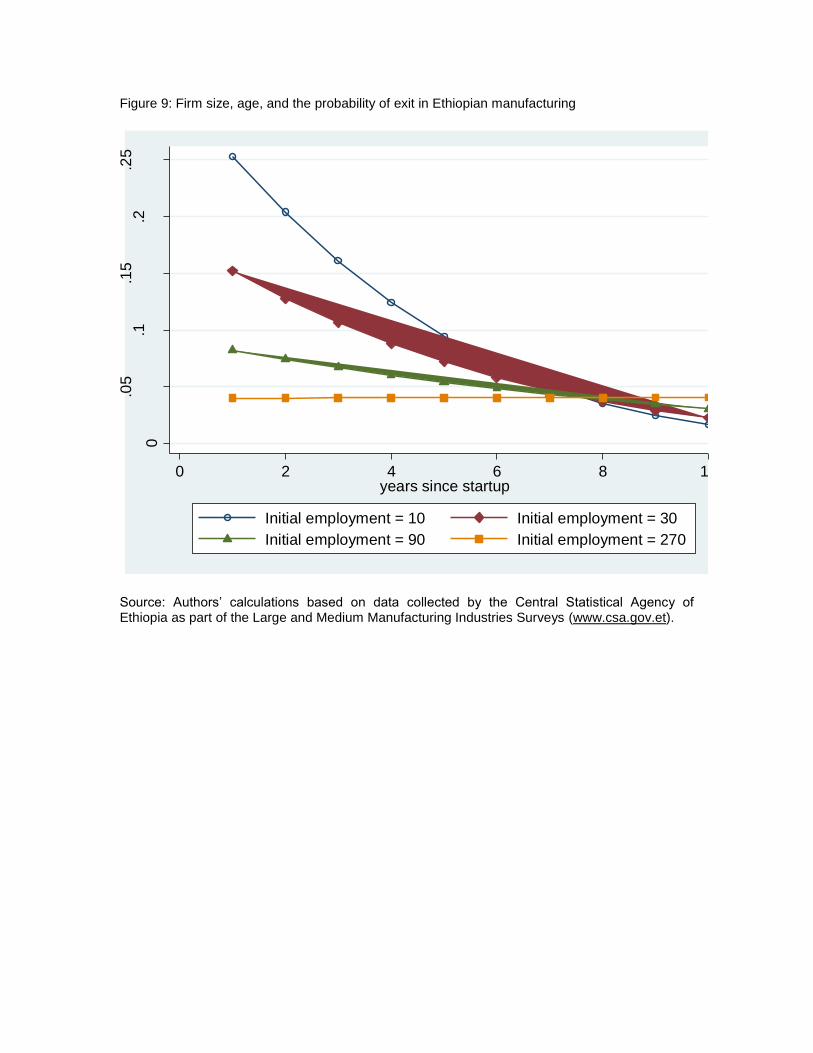
Figure 9: Firm size, age, and the probability of exit in Ethiopian manufacturing
Source: Authors’ calculations based on data collected by the Central Statistical Agency of Ethiopia as part of the Large and Medium Manufacturing Industries Surveys (www.csa.gov.et).
0
.05
.1.1
5.2
.25
0 2 4 6 8 10years since startup
Initial employment = 10 Initial employment = 30
Initial employment = 90 Initial employment = 270
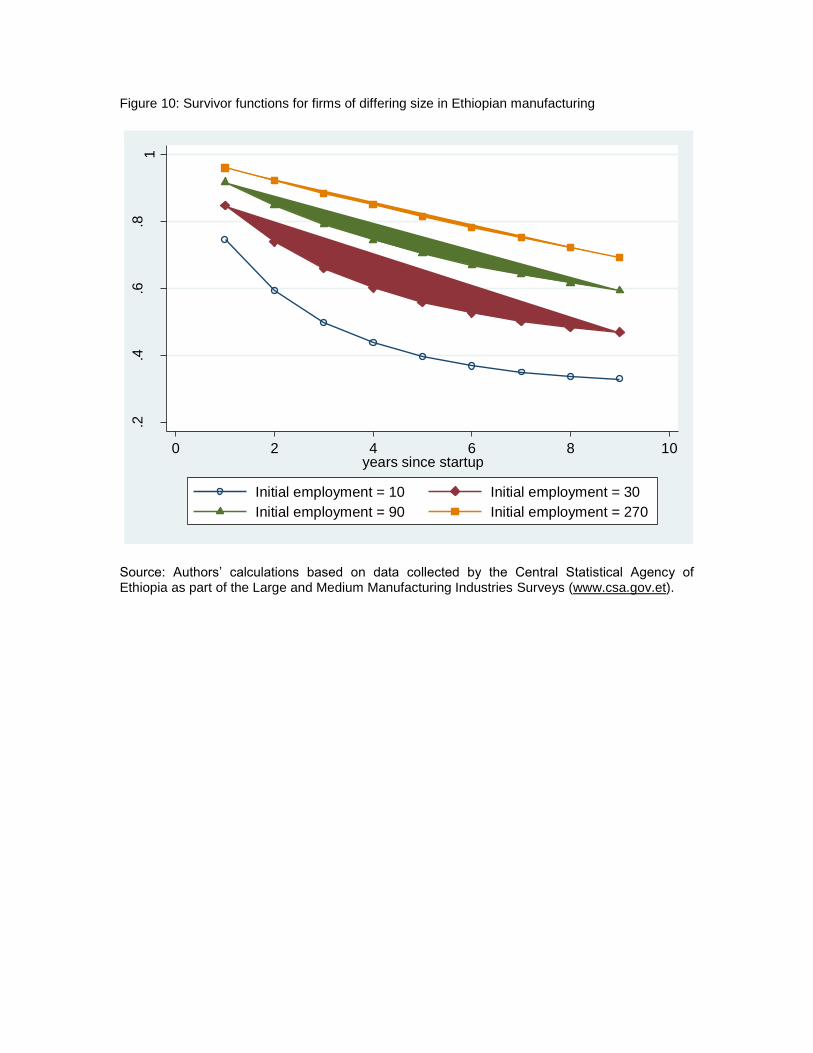
Figure 10: Survivor functions for firms of differing size in Ethiopian manufacturing
Source: Authors’ calculations based on data collected by the Central Statistical Agency of Ethiopia as part of the Large and Medium Manufacturing Industries Surveys (www.csa.gov.et).
.2.4
.6.8
1
0 2 4 6 8 10years since startup
Initial employment = 10 Initial employment = 30
Initial employment = 90 Initial employment = 270
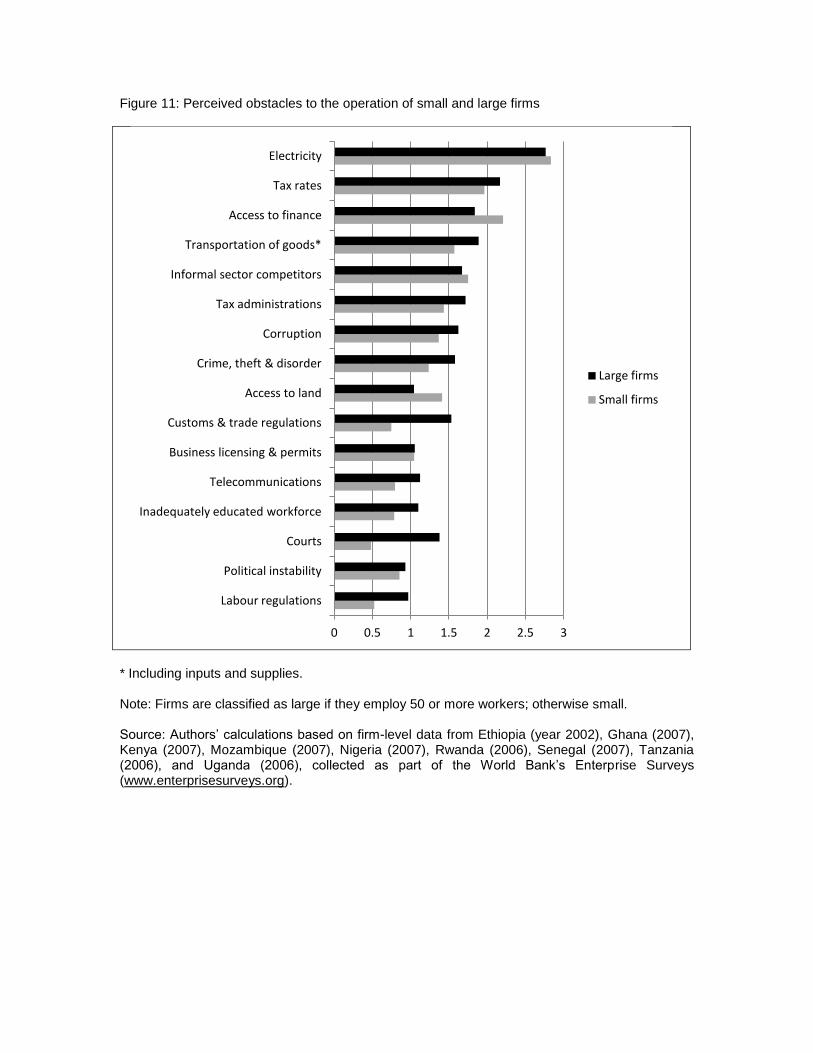
Figure 11: Perceived obstacles to the operation of small and large firms
* Including inputs and supplies. Note: Firms are classified as large if they employ 50 or more workers; otherwise small. Source: Authors’ calculations based on firm-level data from Ethiopia (year 2002), Ghana (2007), Kenya (2007), Mozambique (2007), Nigeria (2007), Rwanda (2006), Senegal (2007), Tanzania (2006), and Uganda (2006), collected as part of the World Bank’s Enterprise Surveys (www.enterprisesurveys.org).
0 0.5 1 1.5 2 2.5 3
Labour regulations
Political instability
Courts
Inadequately educated workforce
Telecommunications
Business licensing & permits
Customs & trade regulations
Access to land
Crime, theft & disorder
Corruption
Tax administrations
Informal sector competitors
Transportation of goods*
Access to finance
Tax rates
Electricity
Large firms
Small firms
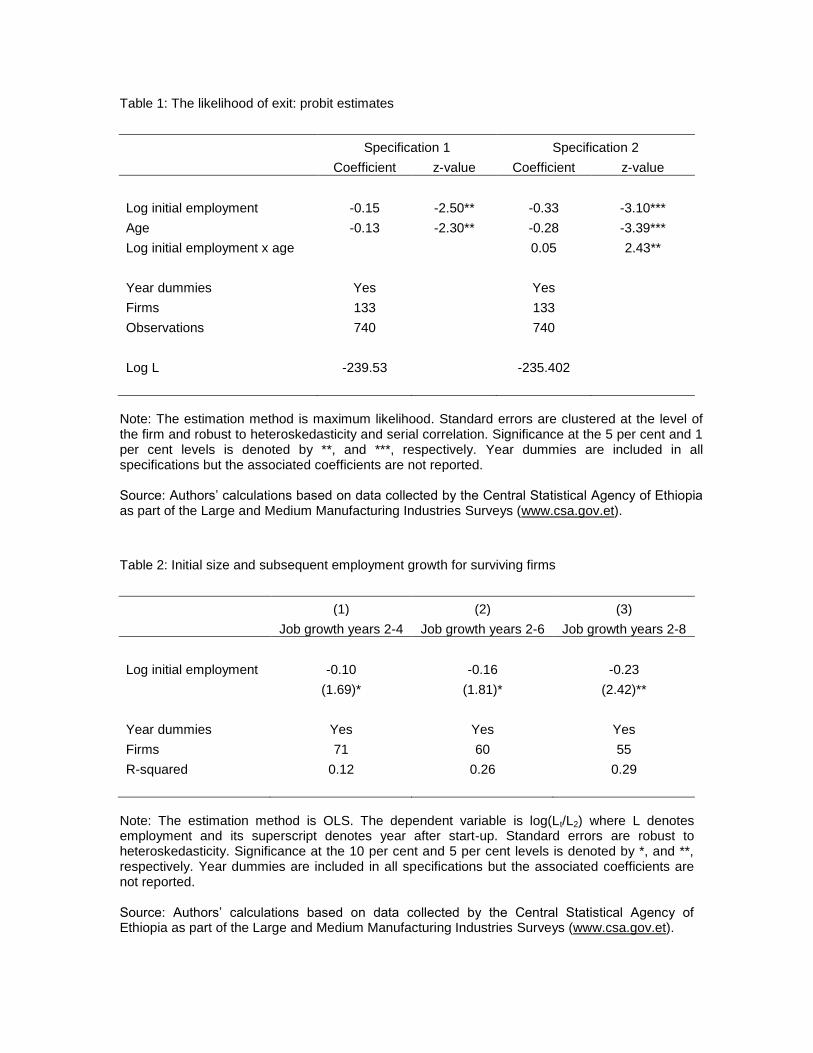
Table 1: The likelihood of exit: probit estimates
Specification 1 Specification 2
Coefficient z-value Coefficient z-value
Log initial employment -0.15 -2.50** -0.33 -3.10***
Age -0.13 -2.30** -0.28 -3.39***
Log initial employment x age
0.05 2.43**
Year dummies Yes Yes
Firms 133
133 Observations 740
740
Log L -239.53
-235.402
Note: The estimation method is maximum likelihood. Standard errors are clustered at the level of the firm and robust to heteroskedasticity and serial correlation. Significance at the 5 per cent and 1 per cent levels is denoted by **, and ***, respectively. Year dummies are included in all specifications but the associated coefficients are not reported. Source: Authors’ calculations based on data collected by the Central Statistical Agency of Ethiopia as part of the Large and Medium Manufacturing Industries Surveys (www.csa.gov.et).
Table 2: Initial size and subsequent employment growth for surviving firms
(1) (2) (3)
Job growth years 2-4 Job growth years 2-6 Job growth years 2-8
Log initial employment -0.10 -0.16 -0.23
(1.69)* (1.81)* (2.42)**
Year dummies Yes Yes Yes
Firms 71 60 55
R-squared 0.12 0.26 0.29
Note: The estimation method is OLS. The dependent variable is log(Lt/L2) where L denotes employment and its superscript denotes year after start-up. Standard errors are robust to heteroskedasticity. Significance at the 10 per cent and 5 per cent levels is denoted by *, and **, respectively. Year dummies are included in all specifications but the associated coefficients are not reported. Source: Authors’ calculations based on data collected by the Central Statistical Agency of Ethiopia as part of the Large and Medium Manufacturing Industries Surveys (www.csa.gov.et).

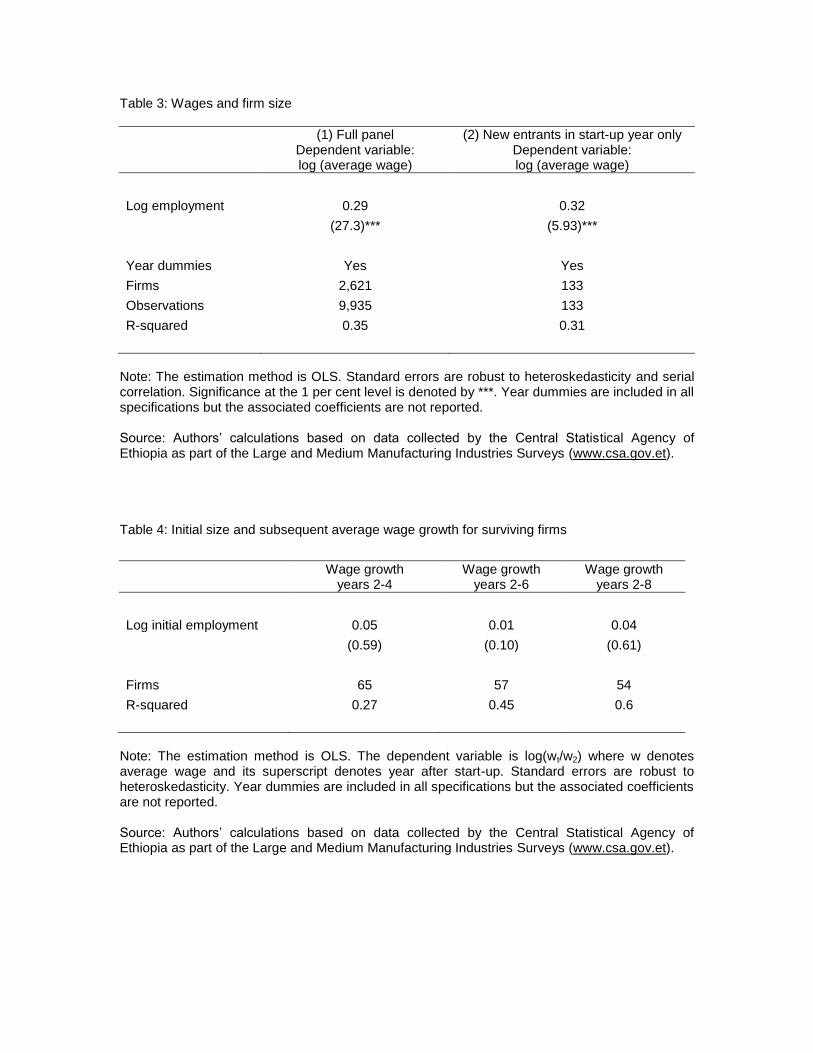
Table 3: Wages and firm size
(1) Full panel Dependent variable: log (average wage)
(2) New entrants in start-up year only Dependent variable: log (average wage)
Log employment 0.29 0.32
(27.3)*** (5.93)***
Year dummies Yes Yes
Firms 2,621 133
Observations 9,935 133
R-squared 0.35 0.31
Note: The estimation method is OLS. Standard errors are robust to heteroskedasticity and serial correlation. Significance at the 1 per cent level is denoted by ***. Year dummies are included in all specifications but the associated coefficients are not reported. Source: Authors’ calculations based on data collected by the Central Statistical Agency of Ethiopia as part of the Large and Medium Manufacturing Industries Surveys (www.csa.gov.et). Table 4: Initial size and subsequent average wage growth for surviving firms
Wage growth years 2-4
Wage growth years 2-6
Wage growth years 2-8
Log initial employment 0.05 0.01 0.04
(0.59) (0.10) (0.61)
Firms 65 57 54
R-squared 0.27 0.45 0.6
Note: The estimation method is OLS. The dependent variable is log(wt/w2) where w denotes average wage and its superscript denotes year after start-up. Standard errors are robust to heteroskedasticity. Year dummies are included in all specifications but the associated coefficients are not reported. Source: Authors’ calculations based on data collected by the Central Statistical Agency of Ethiopia as part of the Large and Medium Manufacturing Industries Surveys (www.csa.gov.et).