is innovation really in a place? accelerator program impacts on …€¦ · is innovation really in...
TRANSCRIPT

Is Innovation Really in a Place? Accelerator Program
Impacts on Firm Performance
By Sheharyar Bokhari, Andrea Chegut ∗, Dennis Frenchman and
Isabel Tausendschoen
Draft: March 5, 2018
We investigate the impact of a nascent urban entrepreneurial
amenity, accelerator programs, upon start-up firm’s private equity
performance. Accelerators are firm development programs that uti-
lize physical space, mentorship, capital, and community engage-
ment to accelerate the financial feasibility of start-up firms. A
sample of US accelerator treated and matched control firm’s over
the 2005 to 2015 period yields a study of 16,720 firms. Results indi-
cate that there is statistically significantly more cumulative funding
for accelerated firms, when taking into consideration the endoge-
nous choice and selection of start-up firms into programs and se-
ries stage in cumulative funding. Secondly, we assess variation
across accelerator participation timing and find that firms with
pre-funding when coming into an accelerator leads to higher cu-
mulative funding. Lastly, we document accelerator amenities like
free physical space, program length, program cohort size, investor
equity stake and scale of capital injection impacts cumulative fund-
ing. This study supports evidence of correlation between start-up
firm performance, as measured by increased cumulative funding,
and accelerator program amenities.
JEL: R11, R12, L26
Keywords: Entrepreneurship, accelerator programs, firm perfor-
mance, innovation ecosystems1
2 MONTH YEAR
Bricks and Mortar and their impact on entrepreneurial development and eco-
nomic growth has become an issue of 21st century public policy. Creating ur-
ban development, so-called innovation ecosystems, that support firm formation
and success is at the core of a nascent development in urban planning and eco-
nomic development programs (Jaroff, Frenchman and Rojas 2009, Marshall 1920,
Porter 1990). Innovation ecosystem creation is justified by a broad body of re-
search documenting the correlation between local entrepreneurship and economic
growth (Delgado, Porter and Stern 2010a, Delgado, Porter and Stern 2010b, Gen-
naioli et al. 2012, Gennaioli et al. 2012, Glaeser et al. 1992, Glaeser, Kerr and
Kerr 2012, Rosenthal and Strange 2003). Furthermore, new private and pub-
lic sector programs aim to catalyze firm development to promote local economic
development and curate so-called micro-innovation ecosystems. One such inter-
vention is the rise of firm accelerators.
Accelerators are nascent firm development programs that utilize physical space,
networks, mentorship, capital financing, and community engagement to accelerate
the financial feasibility of a pool of firms. These programs are generally a private
sector initiative that aims to transition firms out of early stage development chal-
lenges to advance their skills and networks through their programs. Importantly,
accelerator programs are differentiated by accepting a cohort of firms from an ap-
plicant pool to a program that has a start and end date. Since the development
of the first so-called accelerator program, there has been at least 500+ programs
of their kind across the US. Publicly funded business development tools like incu-
bators1 do not have start and end dates and generally do not discriminate access
∗ Corresponding Author: Andrea Chegut: Massachusetts Institute of Technology, 77 MassachusettsAvenue, [email protected]. Acknowledgements: We are grateful for the financial support of MITs SamTak Lee Laboratory. In addition, we are grateful for the research assistance provided by Annie Ryan,James Scott, Yair Titelboim and Daniel Fink. We are also grateful for the comments received at theFrontiers of Entrepreneurship Conference.
1The key elements of accelerators differentiate them from other institutions in the entrepreneurialecosystem such as incubators or angel investors. Incubators are primarily real-estate based ventureswhich offer office space at a reduced rent. Incubators, unlike accelerators, do not have a fixed start orend date. There is an ongoing entry or exit of the startups. According to Cohen (2013) the startups stayresident for about 1-5 years. Many incubators offer professional services such as legal, human resourceor tax counseling, however, the startups must pay for these services (Allen and Mccluskey 1991). Noinvestments are made in the startups by the incubator. If mentorship is provided it is minimal. The

VOL. VOLUME NO. ISSUEAN EXAMINATION OF ACCELERATOR PROGRAM IMPACTS ON FIRM PERFORMANCE3
based on firm characteristics, where these programs are in contrast to accelerators
who are a private sector development initiated by the venture and angel capital
community.2 Cohen and Hochberg (2014) define accelerators as ”A fixed-term,
cohort-based program, including mentorship and educational components, that
culminates in a public pitch event or demo-day.”
Demand for accelerator programs are on the rise, as we see that entrepreneurial
activity is increasing, there is more and more need for training, development and
networks. Today the Kauffman Foundations Startup Activity Index has gone
up three years in a row, reaching close to the peak before the Great Recession
drop. In 2017 the Kauffman Foundations Startup Activity Index has gone up
three years in a row, reaching close to the peak before the Great Recession drop
(?). Moreover, capital financing of start-ups is growing. 2017 was the second
biggest year of investments. Total annual funding increased 17% in 2017, as
$71.9B was invested across 5,052 deals (Insights 2017). Much work has been
done, to measure entrepreneurial activity, but there is limited evidence on the
factors that tie entrepreneurial performance to the amenities and programming
within these innovation ecosystems. Given the importance of start-ups on local
economic development, our aim is to investigate the tools that are targeted to
increase the chances that start-ups survive. In this way, this study examines
the impact of accelerator experiences on the firm performance of private equity
start-ups.
A body of research examines the impact of small and young firms on local
economic growth. Small, new firms face many liabilities of newness as these
young companies do not have sufficient financial capital for long-term survival,
underdeveloped operational and managerial skills and those firms that lack le-
gitimacy with customers, employees and other key stakeholders (Gavetti and
Rivkin 2007, Levinthal 1997, Siggelkow 2001, Stinchcombe and March 1965).
stage of the venture is not crucial, varying from early to late (Cohen 2013).2There is no hard or soft line about the financing sources of accelerator programs, but generally these
programs are of a private enterprise nature as they offer capital in exchange for equity in the firms.
4 MONTH YEAR
Some ventures may overcome these issues through the knowledge and networks of
their founders (Dencker, Gruber and Shah 2009, Eesley and Roberts 2012, Eisen-
hardt and Schoonhoven 1990). However, many start-up founders do not have the
knowledge, network, capital or physical space to overcome these challenges.
To investigate the impact of accelerator programs upon private equity start-up
performance, we pair two unique US data sets. First we use the MIT Real Estate
Innovation Labs accelerator database which includes details on equity provisions,
capital investments and detailed programming by the accelerators for firms. Sec-
ond, we match to CB Insights private company funding data to follow private
equity firm performance over the 2005 to 2015 period. In this panel data set, we
follow those firms over time that have had an accelerator experience and those
that have not and control for firm funding, investor experience and investment
stage characteristics as well as deal event timing conditions and the urban area
context. In addition, our data enables us to understand the timing of the ac-
celerator experience as well as characteristics of the accelerators themselves in
providing amenities to these start-up firms. As part of our identification strategy,
we have considered multiple aspects of the accelerator program experiences for
firms and have controlled for where engaging in an accelerator experience is an
endogenous choice and(or) selection through a 2SLS estimation procedure in a
fixed-effect panel estimator framework.
For a sample of over 38,000 start-up deals and 16,720 firms, our results indi-
cate that there is statistically significantly more funding for accelerated relative to
non-accelerated firms, even when taking into consideration the endogenous choice
and selection of start-up firms into programs. This finding is robust to the stages
of private equity funding that firms proceed through. Furthermore, we assess
variation across accelerator experiences and find that firms with prior funding
before entering into an accelerator program leads to higher cumulative funding
overall. In addition, we assess accelerator characteristics and identify that firms
that experience longer acceleration program periods and not surprisingly more
VOL. VOLUME NO. ISSUEAN EXAMINATION OF ACCELERATOR PROGRAM IMPACTS ON FIRM PERFORMANCE5
capital in their program leads to higher cumulative funding later on. Perhaps, a
so-called early signal of firm quality to later stage financiers. Moreover, the offer-
ing of physical space and on-site programming leads to higher cumulative funding,
which suggests that the absence of programming and physical space, amenities
that are not uniform across all accelerators, are important to firm formation and
capital accumulation.
These results indicate that there is evidence of correlation between start-up firm
performance and accelerator program activities. Furthermore, programming vari-
ation has significant impact on the life-long performance of the firms. In this way,
when designing accelerator programs, we should take note of programming char-
acteristics that may not help the firms over the course of their funding life-cycle.
Moreover, these findings are relevant for the creation of innovation ecosystems
and that the use of accelerators may be an important ingredient in the ecosys-
tem’s framework. However, other factors necessary for ecosystem creation like
employment growth, employee skill diversity, the availability of necessary equip-
ment and physical space after accelerator graduation are necessary for completing
a more holistic picture of innovation ecosystem performance.
The remainder of our analysis is structured as follows. In section I we examine
the body of literature that links innovation ecosystems to entrepreneurship. In
section II we present the data and descriptive statistics of our analysis. In the
third section, we present our estimation strategy and approach to measuring an
endogenous choice to engage in entrepreneurial amenities. Lastly, in section IV
we review our results and in section V, conclude.
I. Literature Review
This study draws upon different literature domains to inform our hypothesis
about how accelerator experiences that have formed at a micro-urban scale can
change the intersection of innovation, firm performance and place. Three domains
regional and economic planning, entrepreneurship formation and ties to economic
6 MONTH YEAR
growth and firm performance are all interrelated in understanding the production
of goods and services.
A. Planning for Regional Growth
Innovation districts are growing in numbers; there are 41 established or planned
innovation districts around the globe. Large scale Innovation Districts like 22@
Barcelona or the Boston Innovation District integrate a planned ecosystem of
innovation, cutting edge patenting firms, universities and research centers that
aim to transfer technology. Agglomeration of innovative firms, mixed-use retail
amenities, small workshops, events, and services are all used to program a pro-
ductive economic urban fabric. Innovation Districts are an evolution in urban
planning and development away from science parks, industrial districts and new
century cities. The observation of innovation districts and the first theories con-
cerning their development give rise to the question of how do they arise and how
do they support entrepreneurial growth.
Historically, nineteenth century and early 20th century, industrial districts were
characterized by a high concentration of manufacturing enterprises that were en-
gaged in similar or complimentary work (e.g., Manchester, Milan, Baltimore,
Detroit). At this time, industry clustering had a unique advantage: the faster
supply of materials and parts from one company to the other, a large industrial
worker supply and neighborhood amenities to support their activities outside of
manufacturing (Muller and Groves 1979). This shifted with the arrival of science
or research parks that came with the arrival of the automobile oriented suburban
and isolated laboratory and firm clusters. Suburban clusters were developed to
commercialize research, attract scientists with an entrepreneurial attitude from
industry and academia (Dahlstrand and Smith n.d.) and develop a secrecy cul-
ture stemming from patenting policies at this time (Katz and Bradley 2013).
However, government and industry stakeholders began to undertake action to cre-
ate new geographic clusters so-called New Century City developments (”NCC”)
VOL. VOLUME NO. ISSUEAN EXAMINATION OF ACCELERATOR PROGRAM IMPACTS ON FIRM PERFORMANCE7
which were established within large-scale real estate development project areas
and ”driven by inter-organization and cross-industry collaboration to the open
innovation ecosystem for R&D of the company towns of past” (Jaroff, Frenchman
and Rojas 2009).
This trend has culminated in the arrival of innovation districts. Bugliarello
(2004) identified the emergence of urban knowledge parks that represented a new
tool for the transformation of cities into knowledge cities where urban parks ”de-
velop around a knowledge institution in a city, provide public space or spaces for
community activities, and possess high levels of density.” Florida (2014) found
an emergent shift of high tech startup activity and venture investment to ”ur-
ban centers and also to close-in, mixed-use, transit-oriented walk-able suburbs.”
Importantly, planning policy understood the formation of a new urban form to
support the so-called ”innovation district,” but its emergence can either occur
organically or in a planned way. Even if districts form naturally, e.g., Silcon
Valley in California or Kendall Square in Massachusetts, to scale them up to a
neighborhood size, a structured intervention is necessary (Cosgrave, Arbuthnot
and Tryfonas 2013). Katz and Wagner (2014) lists the following institutions that
drive the growth of innovation districts: Mayors and local governments, major
real estate developers and land owners, managers of research campuses, anchor
companies, advanced research institutions, advanced medical campuses, philan-
thropic investors, incubators, accelerators, and other economic cultivators, and
social networking programmers. Thus, an important component of planning pol-
icy today is to focus on micro-agglomeration centers like accelerators, incubators
and other centers for entrepreneurial development.
B. Entrepreneurship, Innovation and Local Growth
A body of research has investigated the economic consequences of innovation
and entrepreneurship. While there is little doubt on the correlation between
smaller firms and local growth, endogeneity issues exist in this context. Instead
8 MONTH YEAR
of explaining the correlation by the impact of small, young firms on local growth,
it might be the case that start-ups are attracted by rapid and fast-growing cities.
Chatterji, Glaeser and Kerr (2013) who provide a review of recent studies on the
clusters of entrepreneurship and innovation conclude that more research on the
causal assessment of this relationship needs to be done. Yet, there are numer-
ous urban economic studies that have contributed to our understand of the ties
between innovation, entrepreneurship and economic growth.
Chinitz (1961) was the first who pointed to the important impact of local en-
trepreneurship on local growth, when he contrasted New York and Pittsburgh
he concluded that Pittsburghs historical concentration in the steel industry sup-
pressed entrepreneurial activity. While New Yorks early engagement in the decen-
tralized garment industry encouraged vibrant entrepreneurship. A more recent
and famous case-study was done by Saxenian (1994). When comparing the re-
gional performance of Boston and Silicon Valley, Saxenian (1994) suggested that
the regional structure and the local entrepreneurial culture encouraged Silicon
Valley to crowd out Boston as the center for semiconductor manufacturing even
though Boston had a more advantaged position after World War II. Empirical
evidence confirms the findings of these two case-studies. The findings of Glaeser
et al. (1992) display a strong correlation between small company size and sub-
sequent growth in employment across sectors within U.S. cities. Rosenthal and
Strange (2010) extend a core urban model by incorporating entrepreneurship in a
way that the connection between entrepreneurship and local success and certain
causes for entrepreneurship are captured, where employment growth is predicted
by an abundance of small entrepreneurial firms both across cities and across in-
dustries within cities. Importantly, this finding is robust (Delgado, Porter and
Stern 2010a, Delgado, Porter and Stern 2010b, Gennaioli et al. 2012). A recent
study by Glaeser, Kerr and Kerr (2012) also shows that entrepreneurship spurs
employment growth in U.S. cities since the 1970s where a large part of employ-
ment growth can be attributed to companies that became large employers rather
VOL. VOLUME NO. ISSUEAN EXAMINATION OF ACCELERATOR PROGRAM IMPACTS ON FIRM PERFORMANCE9
than to the ”endless replication of small businesses.”
Duranton (2007) developed a theoretical model that shifted the focus from en-
trepreneurship to innovation and its link to city performance. The underlying
premise of the model is that the place where past breakthrough inventions occur
determines the location of industries. Kerr (2009) evaluates the validity of this
model. After identifying the top 1% of new patents in 36 patenting technologies
for the time between 1975 and 1984, Kerr (2009) evaluates the subsequent patent-
ing growth in the ten cities that have the highest concentration of top patents
with the next ten cities with the second highest concentration. The development
of the cities is quite similar for the considered time period, but over the next 20
years the patenting growth was 20% higher in the group of cities with the largest
share of breakthrough patent inventions. Agrawal, Cockburn and Rosell (2010)
analyze the traits of innovation in cities that are dominated by large companies,
so-called ”company towns.” The findings show that large companies often be-
come less inclined to conduct exploratory R&D efforts and more insular in their
innovation. Agrawal et al. (2014) built on the previous study and analyze what
an optimal mix of large and small companies leads to the most productive and
innovative environment. The results show that a mixing of large innovative and
a sufficient number of small innovative firms, that are often founded by former
employees of incumbent firms, have a positive impact on patenting growth.
Beyond the optimal mix of large and small corporations, universities have the
power to stimulate economic growth by being an anchor. Hausman (2013) anal-
yses the extent to which universities impact local economic growth. The find-
ings show that long-run employment and wages increase in industries close to
local universities pre-existing strengths in innovation. Further studies by Moretti
(2004) and Glaeser and Saiz (2004) examine the influence of local universities
on economic growth and find an empirical relation between education and local
success. Yet, this is most closely associated with positive spillover effects that are
generated by clusters represent a general feature of the economic landscape ?.
10 MONTH YEAR
Marshall (1920) was the first who wrote about clusters and identified three
advantages that occur in agglomeration economies: knowledge spillover, skilled
labor pool, development of support industries and shared resource input. Porter
(1990) built on Marshalls clustering theory by using empirical evidence to ana-
lyze how the localized benefits that Marshall introduced actually drive firms to
agglomerate. He found that ”enduring competitive advantages in a global econ-
omy lie increasingly in local things knowledge, relationships, motivation that
distant rivals cannot match.” Ellison and Glaeser (1997) develop a metric that
captures the relation between the spatial concentration of an industry and the
general population. Their findings show that 446 out of 459 manufacturing indus-
tries had a higher spatial concentration than the general population. However,
Ellison and Glaeser (1997) state that this clustering ”can either represent spillover
across firms or an uneven distribution of productive factors across space.” Chat-
terji, Glaeser and Kerr (2013) find that some key aspects of entrepreneurship
and innovation have even a higher spatial concentration than general industry.
This is especially the case for VC-backed investments; in 2011 40% of total VC-
backed funding can be found in Silicon Valley and 10% in Boston and New York.
This is true although these areas only account for 11% of the US population.
Additionally, Chatterji, Glaeser and Kerr (2013) show that patenting is spatially
concentrated during the period 1990-2005. Further empirical evidence on the spa-
tial concentration of patenting in the US was done by (Kerr and Kominers 2010),
(Carlino, Chatterjee and Hunt 2007) and (Murata et al. 2014).
C. Accelerator Program Impacts
Previously, we have discussed the urban context necessary for invention and
innovation, but to genuinely intervene to catalyze growth, accelerator programs
are increasingly being developed. Startups are exposed to a high risk of failure and
limited growth as these young companies have not sufficient resources for long-
term survival, have underdeveloped operational and managerial skills and lack
VOL. VOLUME NO. ISSUEAN EXAMINATION OF ACCELERATOR PROGRAM IMPACTS ON FIRM PERFORMANCE11
legitimacy with customers, employees and other key stakeholders (Gavetti and
Rivkin 2007, Levinthal 1997, Siggelkow 2001). Some ventures may overcome these
issues through the knowledge and networks of their founders (Dencker, Gruber
and Shah 2009, Eesley and Roberts 2012, Eisenhardt and Schoonhoven 1990), but
many founders do not have the knowledge or the networks. Importantly, there is
a literature growing that works to understand the impact of accelerator programs
on startup firm performance.
Hallen, Bingham and Cohen (2014) examine the impact of accelerator programs
on the start-up companies. They compare the start-ups that received a treatment
by an accelerator with start-ups that did not. To construct their sample they
gathered information on 328 ventures, with 164 ventures participating in eight
different accelerator programs and 164 non-accelerated matches. The results show
that accelerator programs accelerate the time for reaching key milestones, such as
raising VC funding, being acquired or increasing web traffic. However, this effect
is observed unevenly across accelerators and no statistically significant overall
effect was found.
Another study that examined the performance of accelerator and non-accelerator
ventures was done by Smith and Hannigan (2015). They compare ventures that
were accepted into and received financing from two of the leading accelerators,
TechStars and Y Combinator, to similar ventures that did not participate in these
programs but instead raised angel funding. The sample covers 619 companies,
389 accelerator-backed startups and 230 angel group backed startups, over the
2005 to 2011 period. Their findings show that accelerator-ventures achieve exit
(acquisition or failure) faster than their matched, angel-funded counterparts. The
accelerator start-ups had higher acquisition rates and higher failure rates than the
angel-funded start-ups.
Fehder and Hochberg (2014) examine the local impacts of accelerator programs.
More specifically, they assess whether accelerators have an effect on the level
and availability of VC funding in their region. The initial sample consists of 59

12 MONTH YEAR
accelerators that were founded in 38 metropolitan statistical areas (MSAs) in the
US between 2005 and 2012. Their results show that MSAs where an accelerator is
established subsequently have more seed and early-stage entrepreneurial financing
activity. Furthermore, this activity appears not to be restricted to accelerated
startups themselves, as much of the funding events involves investments made in
companies that were not part of an accelerator program.
Barnes (2016) examines whether the increasing cohort-sizes have resulted in
longer or shorter timeframes for companies to achieve an exit via acquisition or
initial public offering. To answer that question Y Combinator is used as a single
case study in which 991 YC companies for the time period 2005 to 2016 are
analyzed. The results show that the time until an exit for Y Combinator startups
is reducing even while the cohort sizes has been increased (the first cohort in
2005 consisted of 10 companies; over the last decade it has grown launching 200
companies a year). No statistically significant correlation is found between the
cohort size and the initial money raised during the program.
Our contribution to the existing literature is that we analyze a larger body of
accelerator programs namely xx accelerators within the US. Secondly we take into
consideration the different stages of the financial lifecycle. Thirdly we add the
II. Start-up and Accelerator Data Characteristics
Data that identifies early, middle and later stage investors across capital sources
for private equity firms is a challenge. Moreover, being able to identify by one
source the early stage treatments of firms by accelerators or incubators was pos-
sible through the use of CB Insights data. CB Insights is a global data analytics
firm leveraging machine learning algorithms that scans news media, firm and in-
vestor websites and parses that data into private equity firm identification, capital
deal flows, news, job postings and social media impact.3 We extract firm data
3The CB Insights houses data on over 118,000 firms and 191,861 deal transactions worth $1.8 tln.Their collection strategy is based on machine learning algorithms that crawl through media sourcesto identify private equity firms, their news and financing events. For more details on their data col-
VOL. VOLUME NO. ISSUEAN EXAMINATION OF ACCELERATOR PROGRAM IMPACTS ON FIRM PERFORMANCE13
from the CB Insights database - collecting data on some 89,000 private equity
firms over the 2005 to 2015 period. We then identify within this sample every
firm that has undergone an accelerator program per CB Insights identification.
To eliminate erroneous flagging of accelerator programs we cross reference this
firm list with the MIT Real Estate Innovation Lab’s database of accelerator pro-
grams. We then pair this urban areas between the treatment and control groups,
remove unicorns from the sample and identify any areas of missing data. After
this identification procedure, just over 16,720 firms, approximately 38,865 fund-
ing events in 145 urban areas are identified. When broken down by accelerator
experience 3,569 firms and 7,628 funding events are identified as going through
an accelerator program and 13,151 firms and 31,237 funding events are for the
control sample. Lastly, we verify for each non-accelerated firm that it did not
go through an accelerator program by cross-referencing financing sources against
our accelerator program database.
To parse our data, we are examining the impact of accelerators upon private
equity firm performance in three ways. First, we are exploring the variation be-
tween accelerator treated and non-treated firms across deal frequency, quantity
of investors per round, the cumulative number of investors for a firm, the to-
tal previous experience of those investors (as measured by frequency of investor
experiences in the CB Insights database), cumulative funding that the firm has
received as well as the amount of funding for each individual deal. Lastly, we
are able to breakdown the distinction across equity and debt funding vehicles, as
well as extent of funding within the debt or equity funding. Second, we exam-
ine the variation across accelerated firm experiences. We identified six patterns
for firms that went through an accelerator treatment, which breaks down around
the timing of funding before or after the accelerator experience and(or) the num-
ber of accelerator experiences. Third, we look at cross-sectional variation across
accelerator programs. Using the Real Estate Innovation Lab’s database of 512
lection strategy please see: https://www.cbinsights.com/research/team-blog/private-company-financing-data-sources-cruncher/.

14 MONTH YEAR
unique US accelerator programs, we are able to pair, 56 number of accelerators
that includes data on the amount of capital invested, the equity stake taken, the
time spent in the program, the number of firms in the class as well as services
provided by the accelerators that are publicly stated.4
A. Accelerator Treated and Control Firms
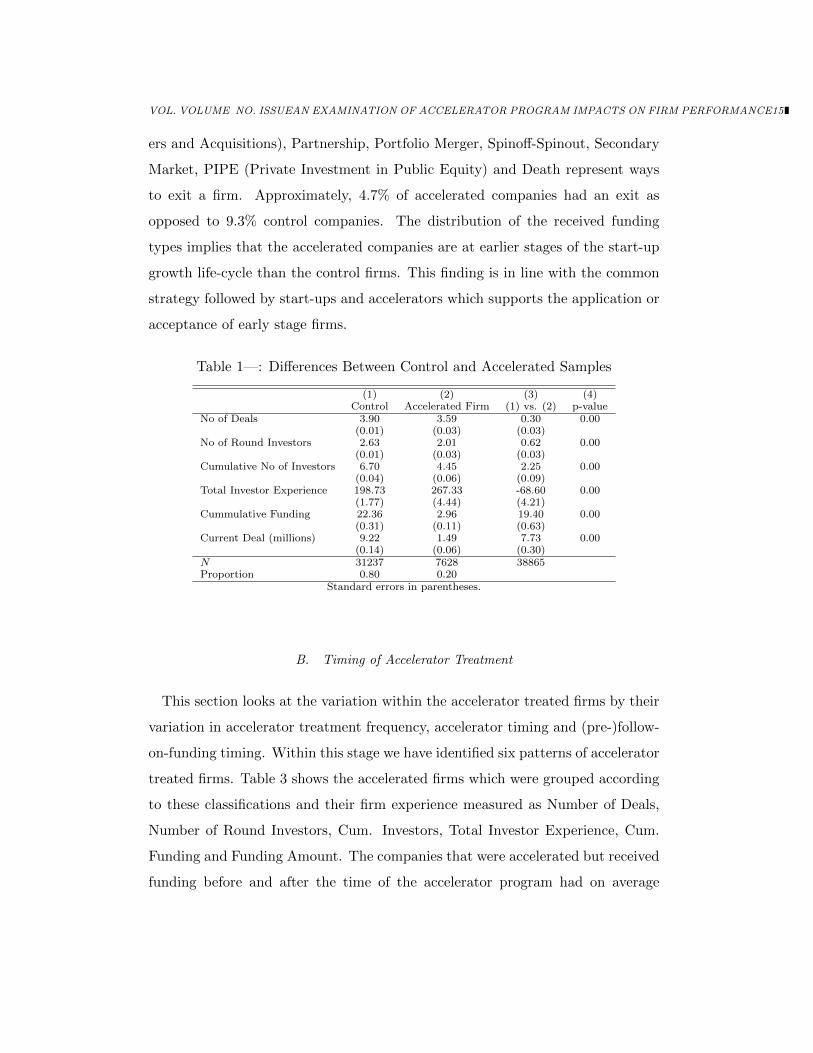
Table 1 documents the differences between accelerator treated and non-treated
firms over the 2005 to 2015 period. Variation between the sample occurs with
the number of deals, total investor experience, cumulative total funding and the
amount of funding. The number of deals is just 30 percent more on average for
accelerated firms. The number of round investors is about 62 percent less and
the cumulative total of round investors is about 2.25 investors less. In contrast,
the total investor experience (as measured by the cumulative number of deals
accumulated in the CB Insights database), is approximately 69 deals more in
experience for the accelerated sample. However, cumulative funding is almost
$19.4 mln less for accelerated firms. Lastly, the amount of each deal is almost on
average $7.73 mln less for accelerator treated firms.
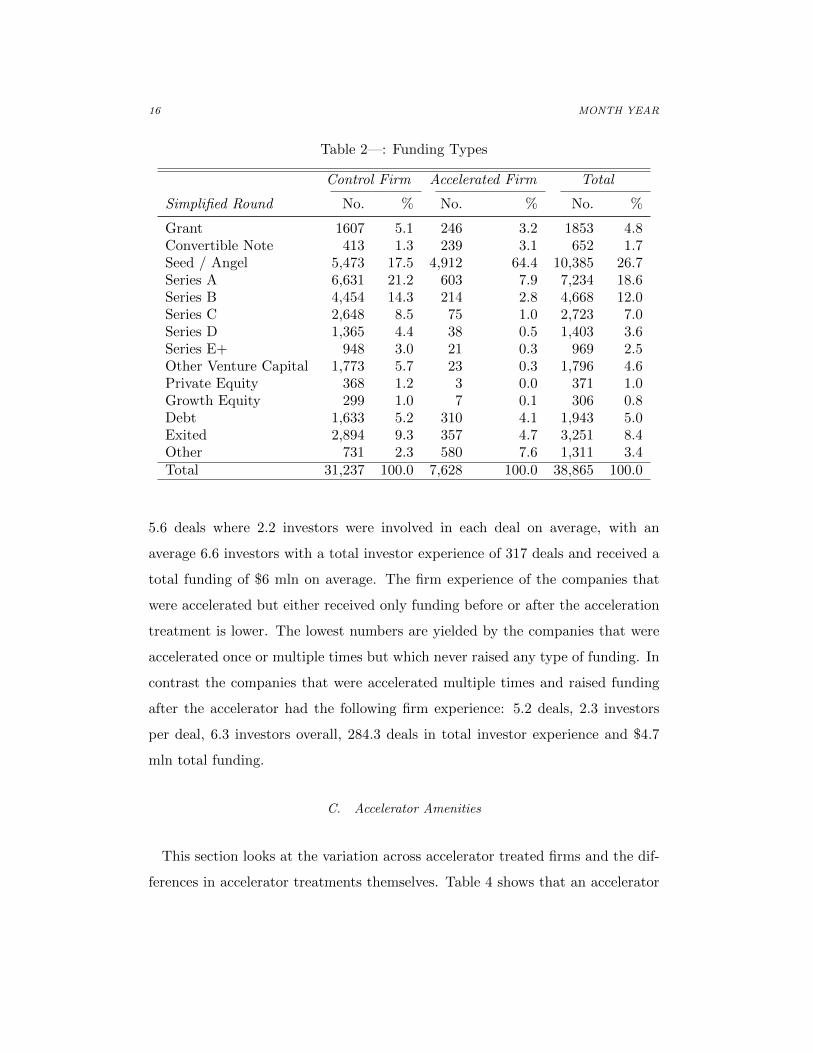
Table 2 shows what type of funding is received by the accelerated treated and
control firms per deal. Grant funding is raised by 5.1% of control firms and just
3.2% of accelerated firms. In 64.4% of the deals accelerated firms raise seed or
angel funding while only 17.5% of the control firms receive that early stage fi-
nancing. The next stage in the funding life-cycle of start-ups is ”Series A”, which
is raised by 21.2% of the control firms and 7.9% of the accelerated firms. To
finance their growth strategy Series B, Series C, and Series D is raised by 14.3%,
8.5%, 4.4% and 3.0% of the control firms whereas fewer accelerated firms get to
that later stage financing rounds (2.8%,0.5%, 0.3% and 0.3% respectively). The
funding type ”Exited represents ”IPO” (Initial Public Offering), ”M&A” (Merg-
4We flag firms that have had an exit experience within the database, and set the exit funding amountequal to zero. We do this because exit funding is equal to firm valuation at the time of exit and we aretracking capital accumulation as our dependent variable.
VOL. VOLUME NO. ISSUEAN EXAMINATION OF ACCELERATOR PROGRAM IMPACTS ON FIRM PERFORMANCE15
ers and Acquisitions), Partnership, Portfolio Merger, Spinoff-Spinout, Secondary
Market, PIPE (Private Investment in Public Equity) and Death represent ways
to exit a firm. Approximately, 4.7% of accelerated companies had an exit as
opposed to 9.3% control companies. The distribution of the received funding
types implies that the accelerated companies are at earlier stages of the start-up
growth life-cycle than the control firms. This finding is in line with the common
strategy followed by start-ups and accelerators which supports the application or
acceptance of early stage firms.
Table 1—: Differences Between Control and Accelerated Samples
(1) (2) (3) (4)Control Accelerated Firm (1) vs. (2) p-value
No of Deals 3.90 3.59 0.30 0.00(0.01) (0.03) (0.03)
No of Round Investors 2.63 2.01 0.62 0.00(0.01) (0.03) (0.03)
Cumulative No of Investors 6.70 4.45 2.25 0.00(0.04) (0.06) (0.09)
Total Investor Experience 198.73 267.33 -68.60 0.00(1.77) (4.44) (4.21)
Cummulative Funding 22.36 2.96 19.40 0.00(0.31) (0.11) (0.63)
Current Deal (millions) 9.22 1.49 7.73 0.00(0.14) (0.06) (0.30)
N 31237 7628 38865Proportion 0.80 0.20
Standard errors in parentheses.
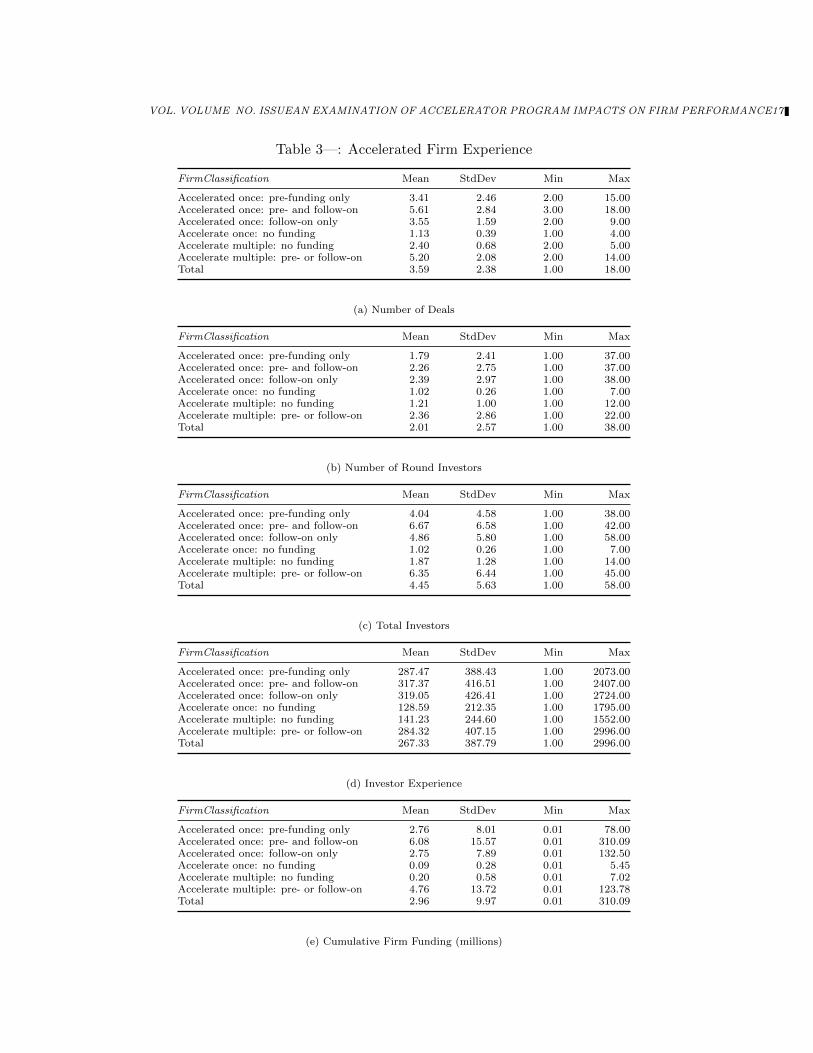
B. Timing of Accelerator Treatment
This section looks at the variation within the accelerator treated firms by their
variation in accelerator treatment frequency, accelerator timing and (pre-)follow-
on-funding timing. Within this stage we have identified six patterns of accelerator
treated firms. Table 3 shows the accelerated firms which were grouped according
to these classifications and their firm experience measured as Number of Deals,
Number of Round Investors, Cum. Investors, Total Investor Experience, Cum.
Funding and Funding Amount. The companies that were accelerated but received
funding before and after the time of the accelerator program had on average
16 MONTH YEAR
Table 2—: Funding Types
Control Firm Accelerated Firm Total
Simplified Round No. % No. % No. %
Grant 1607 5.1 246 3.2 1853 4.8Convertible Note 413 1.3 239 3.1 652 1.7Seed / Angel 5,473 17.5 4,912 64.4 10,385 26.7Series A 6,631 21.2 603 7.9 7,234 18.6Series B 4,454 14.3 214 2.8 4,668 12.0Series C 2,648 8.5 75 1.0 2,723 7.0Series D 1,365 4.4 38 0.5 1,403 3.6Series E+ 948 3.0 21 0.3 969 2.5Other Venture Capital 1,773 5.7 23 0.3 1,796 4.6Private Equity 368 1.2 3 0.0 371 1.0Growth Equity 299 1.0 7 0.1 306 0.8Debt 1,633 5.2 310 4.1 1,943 5.0Exited 2,894 9.3 357 4.7 3,251 8.4Other 731 2.3 580 7.6 1,311 3.4Total 31,237 100.0 7,628 100.0 38,865 100.0
5.6 deals where 2.2 investors were involved in each deal on average, with an
average 6.6 investors with a total investor experience of 317 deals and received a
total funding of $6 mln on average. The firm experience of the companies that
were accelerated but either received only funding before or after the acceleration
treatment is lower. The lowest numbers are yielded by the companies that were
accelerated once or multiple times but which never raised any type of funding. In
contrast the companies that were accelerated multiple times and raised funding
after the accelerator had the following firm experience: 5.2 deals, 2.3 investors
per deal, 6.3 investors overall, 284.3 deals in total investor experience and $4.7
mln total funding.
C. Accelerator Amenities
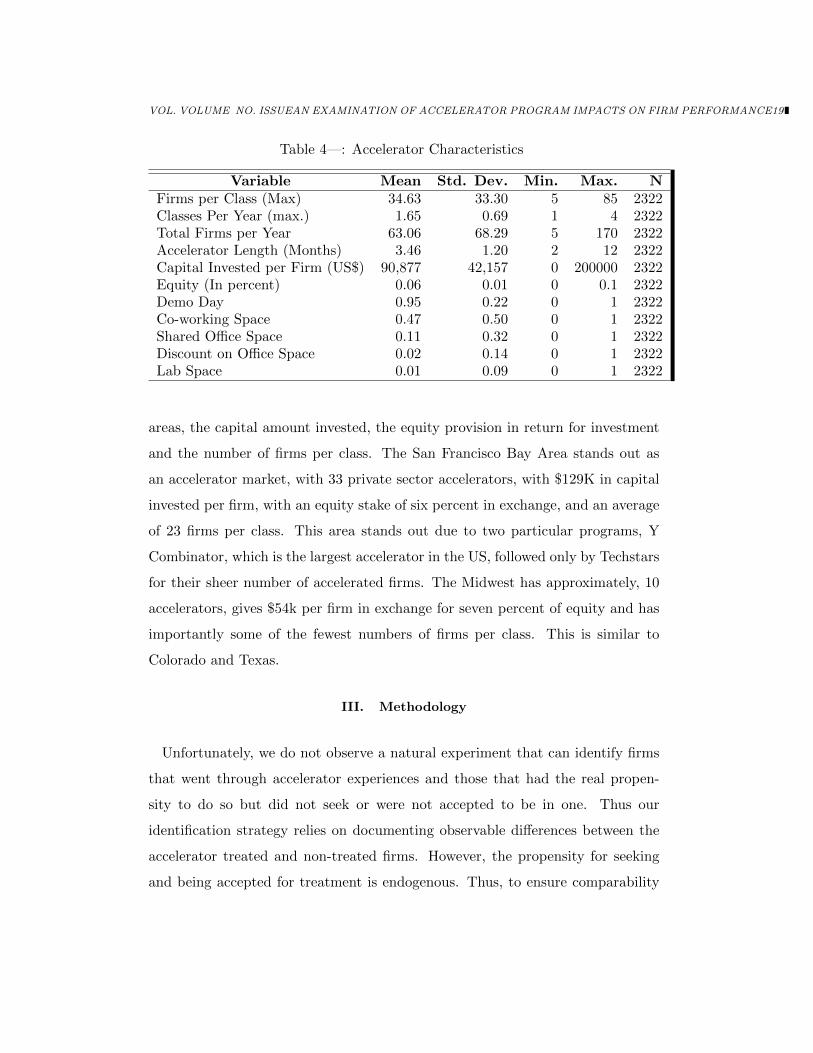
This section looks at the variation across accelerator treated firms and the dif-
ferences in accelerator treatments themselves. Table 4 shows that an accelerator
VOL. VOLUME NO. ISSUEAN EXAMINATION OF ACCELERATOR PROGRAM IMPACTS ON FIRM PERFORMANCE17
Table 3—: Accelerated Firm Experience
FirmClassification Mean StdDev Min Max
Accelerated once: pre-funding only 3.41 2.46 2.00 15.00Accelerated once: pre- and follow-on 5.61 2.84 3.00 18.00Accelerated once: follow-on only 3.55 1.59 2.00 9.00Accelerate once: no funding 1.13 0.39 1.00 4.00Accelerate multiple: no funding 2.40 0.68 2.00 5.00Accelerate multiple: pre- or follow-on 5.20 2.08 2.00 14.00Total 3.59 2.38 1.00 18.00
(a) Number of Deals
FirmClassification Mean StdDev Min Max
Accelerated once: pre-funding only 1.79 2.41 1.00 37.00Accelerated once: pre- and follow-on 2.26 2.75 1.00 37.00Accelerated once: follow-on only 2.39 2.97 1.00 38.00Accelerate once: no funding 1.02 0.26 1.00 7.00Accelerate multiple: no funding 1.21 1.00 1.00 12.00Accelerate multiple: pre- or follow-on 2.36 2.86 1.00 22.00Total 2.01 2.57 1.00 38.00
(b) Number of Round Investors
FirmClassification Mean StdDev Min Max
Accelerated once: pre-funding only 4.04 4.58 1.00 38.00Accelerated once: pre- and follow-on 6.67 6.58 1.00 42.00Accelerated once: follow-on only 4.86 5.80 1.00 58.00Accelerate once: no funding 1.02 0.26 1.00 7.00Accelerate multiple: no funding 1.87 1.28 1.00 14.00Accelerate multiple: pre- or follow-on 6.35 6.44 1.00 45.00Total 4.45 5.63 1.00 58.00
(c) Total Investors
FirmClassification Mean StdDev Min Max
Accelerated once: pre-funding only 287.47 388.43 1.00 2073.00Accelerated once: pre- and follow-on 317.37 416.51 1.00 2407.00Accelerated once: follow-on only 319.05 426.41 1.00 2724.00Accelerate once: no funding 128.59 212.35 1.00 1795.00Accelerate multiple: no funding 141.23 244.60 1.00 1552.00Accelerate multiple: pre- or follow-on 284.32 407.15 1.00 2996.00Total 267.33 387.79 1.00 2996.00
(d) Investor Experience
FirmClassification Mean StdDev Min Max
Accelerated once: pre-funding only 2.76 8.01 0.01 78.00Accelerated once: pre- and follow-on 6.08 15.57 0.01 310.09Accelerated once: follow-on only 2.75 7.89 0.01 132.50Accelerate once: no funding 0.09 0.28 0.01 5.45Accelerate multiple: no funding 0.20 0.58 0.01 7.02Accelerate multiple: pre- or follow-on 4.76 13.72 0.01 123.78Total 2.96 9.97 0.01 310.09
(e) Cumulative Firm Funding (millions)
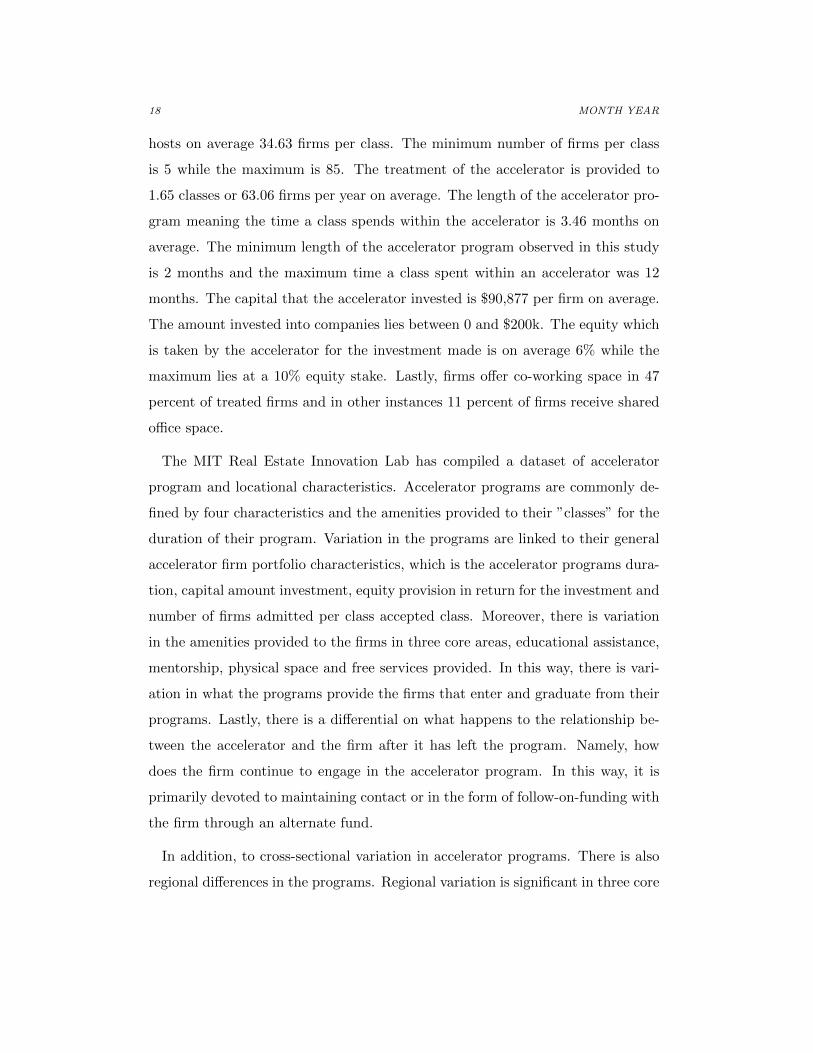
18 MONTH YEAR
hosts on average 34.63 firms per class. The minimum number of firms per class
is 5 while the maximum is 85. The treatment of the accelerator is provided to
1.65 classes or 63.06 firms per year on average. The length of the accelerator pro-
gram meaning the time a class spends within the accelerator is 3.46 months on
average. The minimum length of the accelerator program observed in this study
is 2 months and the maximum time a class spent within an accelerator was 12
months. The capital that the accelerator invested is $90,877 per firm on average.
The amount invested into companies lies between 0 and $200k. The equity which
is taken by the accelerator for the investment made is on average 6% while the
maximum lies at a 10% equity stake. Lastly, firms offer co-working space in 47
percent of treated firms and in other instances 11 percent of firms receive shared
office space.
The MIT Real Estate Innovation Lab has compiled a dataset of accelerator
program and locational characteristics. Accelerator programs are commonly de-
fined by four characteristics and the amenities provided to their ”classes” for the
duration of their program. Variation in the programs are linked to their general
accelerator firm portfolio characteristics, which is the accelerator programs dura-
tion, capital amount investment, equity provision in return for the investment and
number of firms admitted per class accepted class. Moreover, there is variation
in the amenities provided to the firms in three core areas, educational assistance,
mentorship, physical space and free services provided. In this way, there is vari-
ation in what the programs provide the firms that enter and graduate from their
programs. Lastly, there is a differential on what happens to the relationship be-
tween the accelerator and the firm after it has left the program. Namely, how
does the firm continue to engage in the accelerator program. In this way, it is
primarily devoted to maintaining contact or in the form of follow-on-funding with
the firm through an alternate fund.
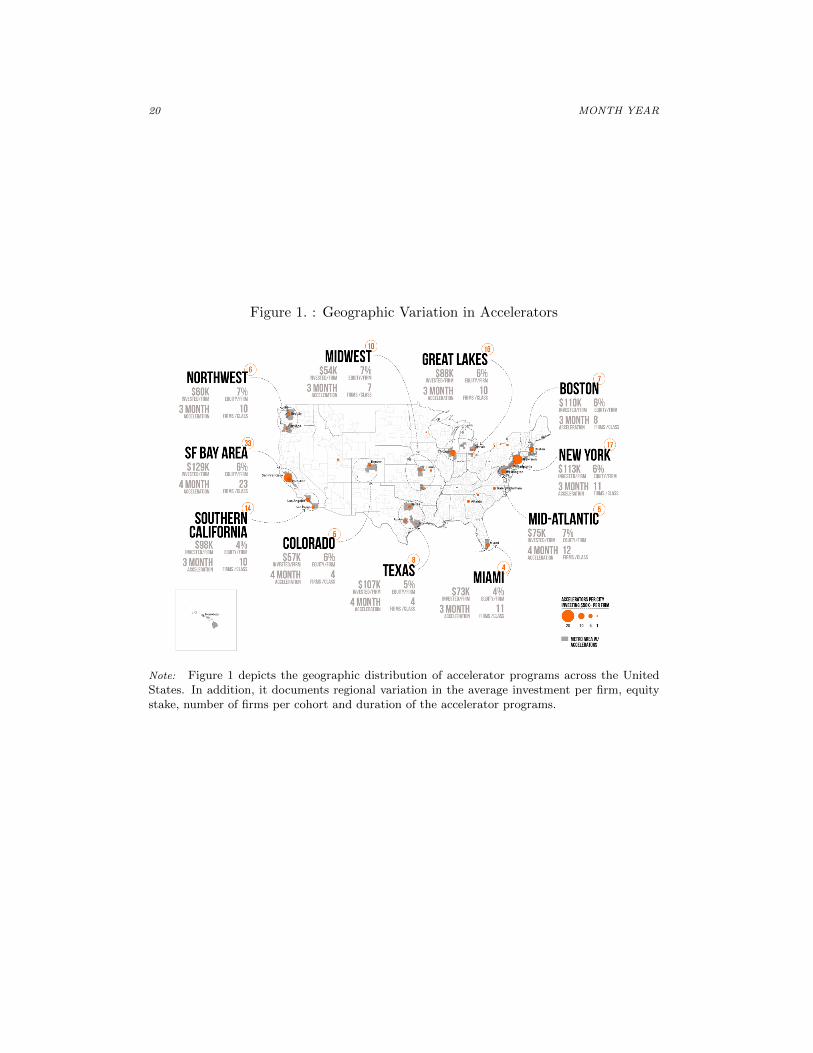
In addition, to cross-sectional variation in accelerator programs. There is also
regional differences in the programs. Regional variation is significant in three core
VOL. VOLUME NO. ISSUEAN EXAMINATION OF ACCELERATOR PROGRAM IMPACTS ON FIRM PERFORMANCE19
Table 4—: Accelerator Characteristics
Variable Mean Std. Dev. Min. Max. NFirms per Class (Max) 34.63 33.30 5 85 2322Classes Per Year (max.) 1.65 0.69 1 4 2322Total Firms per Year 63.06 68.29 5 170 2322Accelerator Length (Months) 3.46 1.20 2 12 2322Capital Invested per Firm (US$) 90,877 42,157 0 200000 2322Equity (In percent) 0.06 0.01 0 0.1 2322Demo Day 0.95 0.22 0 1 2322Co-working Space 0.47 0.50 0 1 2322Shared Office Space 0.11 0.32 0 1 2322Discount on Office Space 0.02 0.14 0 1 2322Lab Space 0.01 0.09 0 1 2322
areas, the capital amount invested, the equity provision in return for investment
and the number of firms per class. The San Francisco Bay Area stands out as
an accelerator market, with 33 private sector accelerators, with $129K in capital
invested per firm, with an equity stake of six percent in exchange, and an average
of 23 firms per class. This area stands out due to two particular programs, Y
Combinator, which is the largest accelerator in the US, followed only by Techstars
for their sheer number of accelerated firms. The Midwest has approximately, 10
accelerators, gives $54k per firm in exchange for seven percent of equity and has
importantly some of the fewest numbers of firms per class. This is similar to
Colorado and Texas.
III. Methodology
Unfortunately, we do not observe a natural experiment that can identify firms
that went through accelerator experiences and those that had the real propen-
sity to do so but did not seek or were not accepted to be in one. Thus our
identification strategy relies on documenting observable differences between the
accelerator treated and non-treated firms. However, the propensity for seeking
and being accepted for treatment is endogenous. Thus, to ensure comparability
20 MONTH YEAR
Figure 1. : Geographic Variation in Accelerators
Note: Figure 1 depicts the geographic distribution of accelerator programs across the UnitedStates. In addition, it documents regional variation in the average investment per firm, equitystake, number of firms per cohort and duration of the accelerator programs.
VOL. VOLUME NO. ISSUEAN EXAMINATION OF ACCELERATOR PROGRAM IMPACTS ON FIRM PERFORMANCE21
between accelerator treated firms and the control firms, we employ the following
identification strategies.Second, we understand that the seeking of being in an
accelerator or acceptance for being in an accelerator are endogenous.
A. Identifying Entrepreneurial Acceleration
First, we create a matched sample on the basis of urban area and detailed
industry classification.5 As described in Section II, we first collect a sample
of accelerator treated firms that have been identified by CBInsights as having
gone through an accelerator program. Then we pair control firms by having
firms in the same urban areas and at least 5 firms in the same detailed industry
classification. This sampling procedure ensures that we measure firms propensity
to access capital regionally and within the same detailed industrial classification.
Conditional upon such observable characteristics, we thus eliminate differences
between regional and sector access to accelerator programs. We also include urban
area fixed effects to attribute geographical differences in construction costs as well
as fixed effects for building use.
To operationalize our estimation strategy we first estimate our model utilizing
our dataset as a pooled cross section. In this model, cumulative funding for
private equity firms are explained by their funding characteristics as detailed in
the equation below:
logCFi,t = α+ φAi + θXi,t + δTi + λRi + εi,(1)
where CF is the logged cumulative funding for firm i in period t. Our principal
variable of interest is a binary variable for accelerator treatment Ai, which equals
one if firm i has undergone an accelerator program, and zero otherwise. Xi
5Urban Areas are defined per the US Census Bureau as geographical areas of densely developedterritories encompassing residential, commercial and other non-residential urban land uses for areas with50,000 or more people. Industry classification is defined as the three levels of sector, industry andsub-industry definitions provided by CBInsights.

22 MONTH YEAR
captures factors contributing to the firms accumulation of funding as a vector
of control variables. It includes the firm’s number of deals, number of current
round investors, the cumulative number of investors to date, the investors deal
experience and also the current round of investment in period t. Ti is a vector of
time dummies, with a value of one in the quarter a current deal event is happening
for firm i and zero otherwise. Ri is a vector of urban-area fixed-effects and sector
fixed-effects, representing the region and sector of capital formation for firm i.
The estimated parameters are φ, θ, δ, and λ, α is a constant and εi is a vector
of regression disturbances for firm i. Our estimation procedure for Equation (1)
employs OLS corrected with firm clustered standard errors. However, this pooled-
cross section approach is subject to omitted-variable bias, where we cannot control
for unobserved firm characteristics.
In a second procedure, we view the accelerator treatment as a natural experi-
ment, where the accelerator program is seen as an exogenous event that changes
the cumulative funding environment of the accelerator treated firms and not those
in the control group. Unfortunately, in a panel estimator where we want to absorb
individual firm fixed-effects, we cannot observe treated effects, as the estimations
will be dropped from the specification. Thus, to control for systematic differences
between the accelerator treated and control group we are employing a fixed-effects
panel estimator where we define a policy period for each accelerator treatment
group. In this way, we re-define our treatment variable as an accelerator event
period, where it is unity for when the firm i is in a time period subject to an
accelerator experience and zero otherwise.
logCFi,t = α+ βEi,t + θXi,t + δTi,t + Fi + εi,t,(2)
where CFi is the logged cumulative funding for firm i in period t. Our new
principal variable of interest is the policy event period defined as the accelerator
VOL. VOLUME NO. ISSUEAN EXAMINATION OF ACCELERATOR PROGRAM IMPACTS ON FIRM PERFORMANCE23
experience Ei,t, which equals one if firm i is in the accelerator program in period t,
and zero otherwise. Similar to specification for Equation (1), Xi captures factors
contributing to the firms accumulation of funding as a vector of control variables.
It includes the firm’s number of deals, number of current round investors, the
cumulative number of investors to date, the investors deal experience and also
the current round of investment in period t. Ti is a vector of time dummies to
capture macro-economic conditions in the capital markets, with a value of one
in the quarter a current deal event is happening for firm i and zero otherwise.
Fi is a vector of firm dummies, that controls for individual firm fixed-effects
that also absorbs urban area and industry fixed-effects like in the specification
of Equation (1). The estimated parameters are β, θ, δ, α is a constant and
εi,t is a vector of regression disturbances for firm i in period t. Our estimation
procedure for Equation (2) employs OLS corrected with firm clustered standard
errors. In this specification, the timing of an accelerator experience is taken into
explcit consideration, but it does not take into account the endogenous seeking
or acceptance of engaging in an accelerator experience.
B. Endogenous Seeking and Acceptance
In some cases, the accelerator experience may not be an exogenous event. First,
the choice to apply and be accepted into an accelerator experience is conditional
upon the availability of accelerators and accelerator class spots to the firm, as
well as their existing financial capital and growth needs. Second, the current
early stage capital market conditions within ones urban area may also impact a
firm’s choice for applying and being accepted into an accelerator program. In this
case we move towards applying instrumental variable (IV) methods by applying
2SLS to our pooled-cross section and fixed-effects panel estimator.
To instrument for the endogenous choice of applying and being accepted into
an accelerator, we estimate the propensity of being accepted into an accelerator
program based on the number of accelerators in an urban area at the time of the

24 MONTH YEAR
accelerator experience and the number of firms admitted per class in an urban
area, which both give an indication of the acceptance rate. At the same time, the
capital markets are competing with accelerator programs by offering experienced
investors and other financial capital within in the urban area. We choose this level
of aggregation as early stage investing is based on relationships and networking
in a local environment. The logit model is specified as follows:
Pr(Ei,t = 1|Zi,t) = E(Ei,t|Zi,t) = a+ bZi,t + νi,t(3)
where Ei,t is the accelerator experience in any time period and Z includes urban
area level variables such as the number of accelerators present at time t, the
total number of firms accepted by the accelerators present at time t, the total
capital invested by the accelerators and their average program length. We also
include the urban area total investor experience and cumulative funding at time
t. In the second stage of the 2SLS estimation, we instrument the accelerator
experience variable Ei,t in equation 2 by substituting in its place the predicted
value Pr(Ei,t) obtained from the logit regression in 3. Specifically, the second
stage regression can now be written as:
logCFi,t = α+ γ Pr(Ei,t) + θXi,t + δTi,t + Fi + εi,t,(4)
C. Within Accelerator Experiences
In the third stage of our analysis, we examine within the accelerator sample
the variation in accelerator experience timing by adding to the specified model
a decomposition factor of when acceleration occurs in the funding cycle. In the
final stage, we amend the specification to control for variation in the accelerator
VOL. VOLUME NO. ISSUEAN EXAMINATION OF ACCELERATOR PROGRAM IMPACTS ON FIRM PERFORMANCE25
experiences that each firm is treated with. The full specification is operationalized
as follows:
logCFi,t = α+ χWi,t + λCi,t + θXi,t + δTi,t + Fi + εi,t.(5)
Similar to specification for Equation (2) where CFi is the logged cumulative
funding for firm i in period t. Xi captures factors contributing to the firms
accumulation of funding as a vector of control variables. It includes the firm’s
number of deals, number of current round investors, the cumulative number of
investors to date, the investors deal experience and also the current round of
investment in period t. Ti is a vector of time dummies to capture macro-economic
conditions in the capital markets, with a value of one in the quarter a current
deal event is happening for firm i and zero otherwise. Wi is a vector of accelerator
timing experiences. Ci is a vector of accelerator characteristics, program length,
capital invested in each firm, equity stake taken in the firm and the number of
classes per year. Ti is a vector of time dummies, with a value of one in the quarter
a current deal event is happening for firm i and zero otherwise. Ri is a vector
of urban-area fixed-effects and sector fixed-effects, representing the region and
sector of capital formation for firm i. The estimated parameters are χ, θ, δ, and
λ, α is a constant and εi is a vector of regression disturbances for firm i. Our
estimation procedure for Equation (5) employs OLS corrected with firm clustered
standard errors.
IV. Estimation Results
A. Variation Between Accelerator Treated and Control Firms
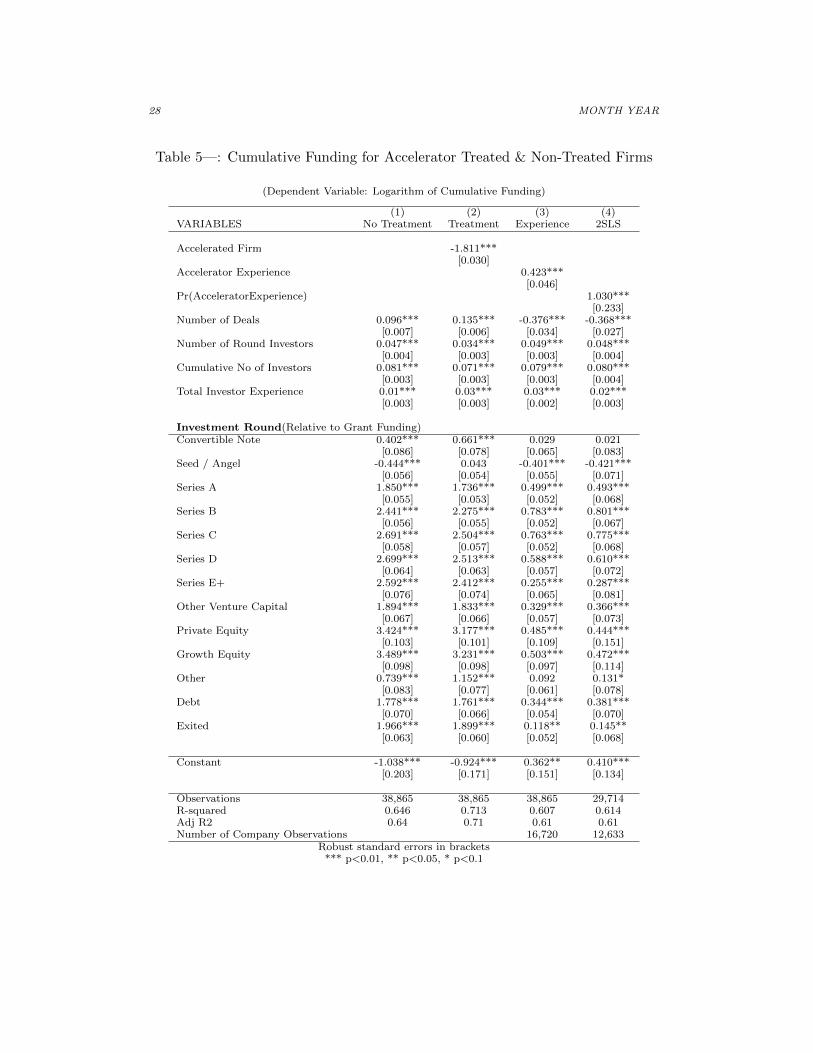
The first four columns of Table 5 present the regression results for Models (1)
to (4), relating the logarithm of cumulative funding per firm to the accelerator

26 MONTH YEAR
treatment variable and a set of funding, investor and investment round character-
istics with urban area and time-fixed effects. Results are clustered by firm. The
model explains up to 71 percent of the variation in the log cumulative funding.
Column (1) reports the results for the most parsimonious model, where fund-
ing, investor and investment round characteristics, urban area and deal quarter
fixed-effects are included in the model. The results of this analysis suggest that as
the number of deals increases the cumulative funding amount increases by about
9.6 percent, when more round investors are included in the deal cumulative fund-
ing increases by 4.7 percent. As a firm increases its number of investors, the
total cumulative funding increases by 8.1 percent. Lastly, as the total number
of deals an investor has done increases, it increases cumulative funding by .06
percent. Relative to Convertible Notes, private equity investment leads to over
300 percent more in cumulative funding and as expected increases from Series
A to E+ increase the total cumulative funding amount. In contrast, relative to
Convertible Notes, Grant funding and Seed or Angel Funding decrease the total
cumulative funding amount by 40 and 84 percent, respectively.
In Column (2), we introduce the accelerator treatment variable into the spec-
ification, where accelerated firms experience approximately 181 percent less cu-
mulative funding then control firms over the sample period. The number of deals
and round investors has a decreased impact on cumulative funding by 13 and 34
percent, respectively. Grant investments lead to less cumulative funding by 66
percent and seed/angel investments lead to 62 percent less funding.
In Column (3), we estimate a fixed-effect panel estimator as specified in Equa-
tion 2 on smaller sub-sample of our firms, where we are able to identify the
accelerator experience for each firm over time. In this case, we find that the
accelerator experience variable increases cumulative funding by 42 percent. How-
ever, at the point of means this cumulative funding increases drops to just 7.6
percent. In addition, the other funding variables change in under the panel spec-
ification. Namely, as the number of round investors increases cumulative funding
VOL. VOLUME NO. ISSUEAN EXAMINATION OF ACCELERATOR PROGRAM IMPACTS ON FIRM PERFORMANCE27
increases by 4.9 percent. Lastly, grant investments are no longer statistically
significant, but seed/angel investments lead to just 4 percent less funding.
In Column (4), we estimate a 2SLS model to account for the endogenous choice
of entering into an accelerator program as specified by Equation 4. The results of
taking into account the endogenous choice of entering into an accelerator program
suggest that cumulative funding increases by 94 percent, but at the point of means
funding increases by just 16 percent. In this way, the probability of undergoing
an accelerator experience yields similar results to specification in Column (3).
As a robustness check we investigate the role of the stage in funding upon this
analysis. Accelerated firms have a small population as accelerator programs did
not begin until 2005 and the number of firms that they accelerator treats per
year is not numerous enough to go through all of the stages of development.
Thus, we estimate our final specification as specified by Equation 4 after each
stage of series funding, e.g., Series A, Series B, etc.. The results suggest that
there is significant variation in those firms that have gone through an accelerator
experience as the cumulative funding increases across the stages of private equity
investment. In Column (1), we document that there is no statistically significantly
different cumulative funding experience for firms that are in the Seed/Angel stage
of investment. In addition, the financial variables are in line with the results from
Table 5. In Column (2), there is a similar experience. However, in Columns (3)
and (4), we find that the marginal increase in cumulative funding occurs for firms
who have reached the Series B and Series C levels of funding.
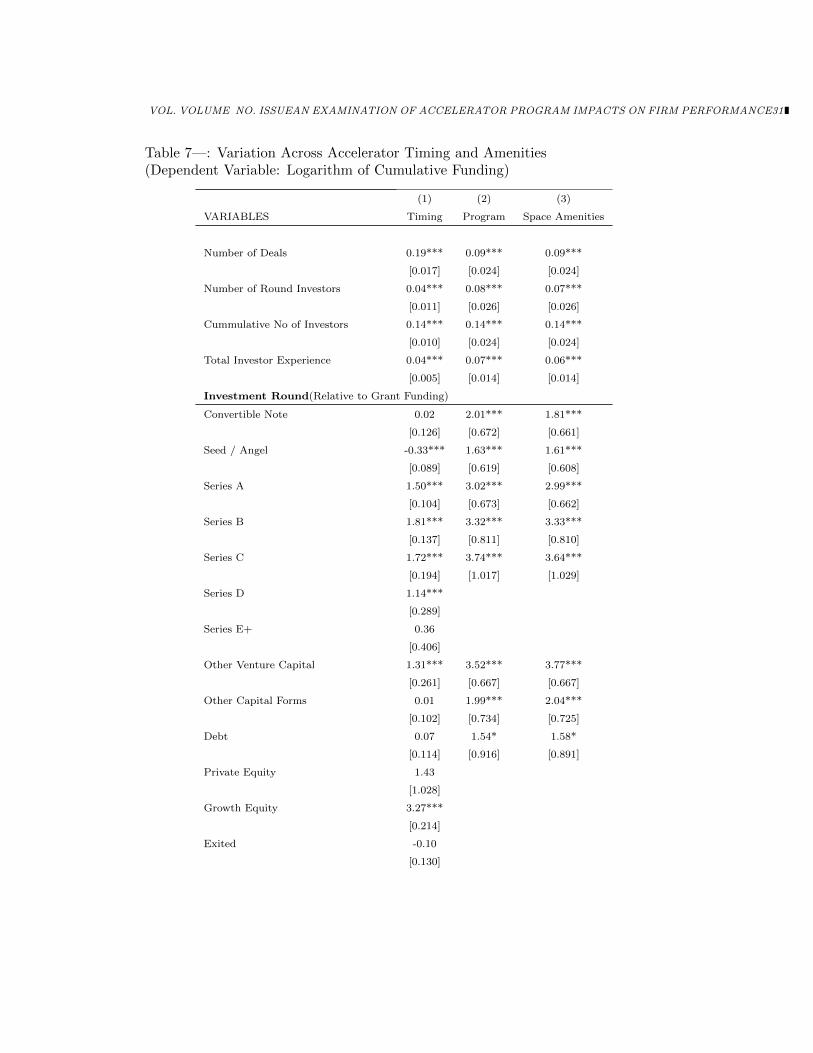
B. Variation Within Accelerator Treated Experiences
The first two columns of Table 7 present the regression results for specification
5, relating the logarithm of cumulative funding per firm to a set of funding,
investor and investment round characteristics with urban area and time-fixed
effects. Results are clustered by firm. The model explains up to 76 percent of the
variation in the log cumulative funding. Importantly, these specifications examine
28 MONTH YEAR
Table 5—: Cumulative Funding for Accelerator Treated & Non-Treated Firms
(Dependent Variable: Logarithm of Cumulative Funding)
(1) (2) (3) (4)VARIABLES No Treatment Treatment Experience 2SLS
Accelerated Firm -1.811***[0.030]
Accelerator Experience 0.423***[0.046]
Pr(AcceleratorExperience) 1.030***[0.233]
Number of Deals 0.096*** 0.135*** -0.376*** -0.368***[0.007] [0.006] [0.034] [0.027]
Number of Round Investors 0.047*** 0.034*** 0.049*** 0.048***[0.004] [0.003] [0.003] [0.004]
Cumulative No of Investors 0.081*** 0.071*** 0.079*** 0.080***[0.003] [0.003] [0.003] [0.004]
Total Investor Experience 0.01*** 0.03*** 0.03*** 0.02***[0.003] [0.003] [0.002] [0.003]
Investment Round(Relative to Grant Funding)Convertible Note 0.402*** 0.661*** 0.029 0.021
[0.086] [0.078] [0.065] [0.083]Seed / Angel -0.444*** 0.043 -0.401*** -0.421***
[0.056] [0.054] [0.055] [0.071]Series A 1.850*** 1.736*** 0.499*** 0.493***
[0.055] [0.053] [0.052] [0.068]Series B 2.441*** 2.275*** 0.783*** 0.801***
[0.056] [0.055] [0.052] [0.067]Series C 2.691*** 2.504*** 0.763*** 0.775***
[0.058] [0.057] [0.052] [0.068]Series D 2.699*** 2.513*** 0.588*** 0.610***
[0.064] [0.063] [0.057] [0.072]Series E+ 2.592*** 2.412*** 0.255*** 0.287***
[0.076] [0.074] [0.065] [0.081]Other Venture Capital 1.894*** 1.833*** 0.329*** 0.366***
[0.067] [0.066] [0.057] [0.073]Private Equity 3.424*** 3.177*** 0.485*** 0.444***
[0.103] [0.101] [0.109] [0.151]Growth Equity 3.489*** 3.231*** 0.503*** 0.472***
[0.098] [0.098] [0.097] [0.114]Other 0.739*** 1.152*** 0.092 0.131*
[0.083] [0.077] [0.061] [0.078]Debt 1.778*** 1.761*** 0.344*** 0.381***
[0.070] [0.066] [0.054] [0.070]Exited 1.966*** 1.899*** 0.118** 0.145**
[0.063] [0.060] [0.052] [0.068]
Constant -1.038*** -0.924*** 0.362** 0.410***[0.203] [0.171] [0.151] [0.134]
Observations 38,865 38,865 38,865 29,714R-squared 0.646 0.713 0.607 0.614Adj R2 0.64 0.71 0.61 0.61Number of Company Observations 16,720 12,633
Robust standard errors in brackets*** p<0.01, ** p<0.05, * p<0.1

VOL. VOLUME NO. ISSUEAN EXAMINATION OF ACCELERATOR PROGRAM IMPACTS ON FIRM PERFORMANCE29
Table 6—: Cumulative Funding for Accelerator Treated & Non-Treated Firms
(Dependent Variable: Logarithm of Cumulative Funding)
(1) (2) (3) (4)VARIABLES Seed/Angel Series A Series B Series C
Pr(AcceleratorExperience) -0.52 0.34 0.98*** 0.95***[0.841] [0.525] [0.377] [0.301]
Number of Deals -0.28*** -0.59*** -0.61*** -0.65***[0.104] [0.063] [0.040] [0.034]
Number of Round Investors 0.06*** 0.06*** 0.05*** 0.05***[0.012] [0.008] [0.006] [0.005]
Cumulative No of Investors 0.16*** 0.13*** 0.11*** 0.10***[0.014] [0.009] [0.007] [0.005]
Total Investor Experience 0.00*** 0.00*** 0.00*** 0.00***[0.000] [0.000] [0.000] [0.000]
Investment Round(Relative to Grant Funding)Convertible Note 0.24 0.32** 0.32** 0.33**
[0.157] [0.143] [0.153] [0.154]Seed / Angel 0.21* 0.37*** 0.48*** 0.53***
[0.114] [0.108] [0.117] [0.118]Series A 0.45*** 1.11*** 1.39*** 1.56***
[0.147] [0.116] [0.124] [0.125]Series B 0.79*** 1.14*** 1.56*** 1.83***
[0.262] [0.192] [0.132] [0.132]Series C 0.67*** 0.80*** 1.07*** 1.71***
[0.242] [0.230] [0.203] [0.141]Series D -0.29 0.86*** 1.44*** 1.87***
[0.625] [0.187] [0.187] [0.300]Series E+ 0.78** 0.93*** 1.07*** 1.20***
[0.340] [0.269] [0.250] [0.257]Other Venture Capital 0.23 0.36 0.48* 0.52*
[0.324] [0.287] [0.284] [0.289]Growth Equity 0.96 1.34** 1.51*** 1.61***
[0.599] [0.525] [0.375] [0.299]Other Capital Forms -0.02 0.02 0.05 0.07
[0.149] [0.141] [0.150] [0.153]Debt 0.05 0.23* 0.30** 0.33**
[0.146] [0.134] [0.140] [0.144]Exited 0.68** 0.91*** 1.14*** 1.21***
[0.292] [0.232] [0.263] [0.255]Constant -2.03** -1.06** -0.66*** -0.05
[0.909] [0.436] [0.205] [0.185]
Observations 8,477 14,196 17,912 20,073R-squared 0.586 0.640 0.660 0.670Number of Company Observations 5,806 9,349 10,246 10,612Adj R2 0.58 0.64 0.66 0.67
Robust standard errors in brackets*** p<0.01, ** p<0.05, * p<0.1

30 MONTH YEAR
the subset of accelerator treated firms over the 2005 to 2015 period.
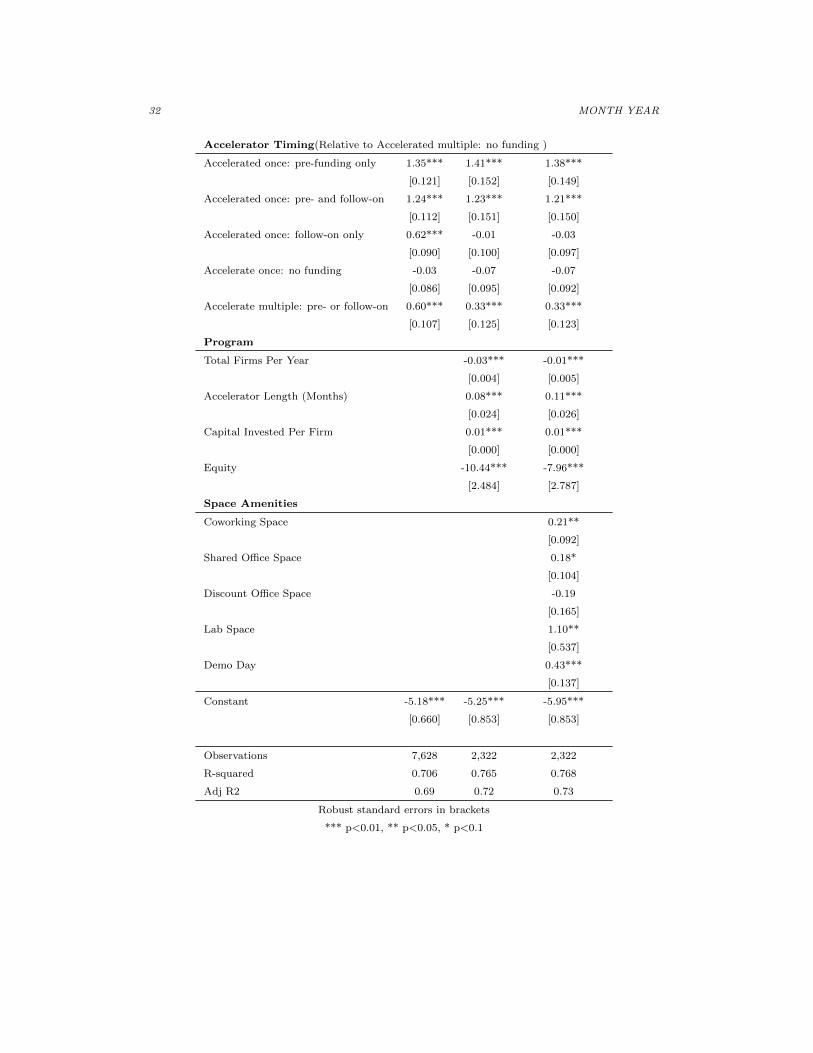
In Column (1), we examine the impact of accelerator timing upon the cumu-
lative funding of startup firms treated by accelerators. Relative to firms that
accelerated multiple times, and received no pre- or follow-on funding, firms that
accelerated once with pre-funding received 134 percent more in cumulative fund-
ing. In line with expectations, firms that accelerated once, but that did not
receive follow-on funding had no statistically significantly differentiating cumula-
tive funding events.
In Column (2), we asses the impact of accelerator program amenities, in this
case the total number of firms that an accelerator program treats per year is
correlated with .03 percent less cumulative funding. In addition, the more time
accelerator programs treat firms, leads to 8.3 percent more in cumulative fund-
ing for every month extra in an accelerator. Capital investment is statistically
significant, but economically negligible. Lastly, the equity stake taken be the
accelerator program impacts cumulative funding negatively, where a one percent
increase in an equity stake results in 104 percent decrease in cumulative funding
for the average accelerator treated firm.
In Column (3), we asses the impact of accelerator space amenities, the pres-
ence of space amenities is a statistically significant factor for cumulative funding.
Accelerator programs that provide co-working or shared office space for the dura-
tion of their program see firms with cumulative funding around 21 and 18 percent
more, respectively. Moreover, accelerator programs that supply lab space for the
firms accumulate approximately 110 percent more in funding. However, acceler-
ator programs that only offer discounts to office space do not show a statistically
or economically significant impact on cumulative funding. Lastly, accelerator
programs that offer a demo day, where firms are able to show-case their end
of program achievements to investors receive an average of 43 percent more in
cumulative funding.
VOL. VOLUME NO. ISSUEAN EXAMINATION OF ACCELERATOR PROGRAM IMPACTS ON FIRM PERFORMANCE31
Table 7—: Variation Across Accelerator Timing and Amenities(Dependent Variable: Logarithm of Cumulative Funding)
(1) (2) (3)
VARIABLES Timing Program Space Amenities
Number of Deals 0.19*** 0.09*** 0.09***
[0.017] [0.024] [0.024]
Number of Round Investors 0.04*** 0.08*** 0.07***
[0.011] [0.026] [0.026]
Cummulative No of Investors 0.14*** 0.14*** 0.14***
[0.010] [0.024] [0.024]
Total Investor Experience 0.04*** 0.07*** 0.06***
[0.005] [0.014] [0.014]
Investment Round(Relative to Grant Funding)
Convertible Note 0.02 2.01*** 1.81***
[0.126] [0.672] [0.661]
Seed / Angel -0.33*** 1.63*** 1.61***
[0.089] [0.619] [0.608]
Series A 1.50*** 3.02*** 2.99***
[0.104] [0.673] [0.662]
Series B 1.81*** 3.32*** 3.33***
[0.137] [0.811] [0.810]
Series C 1.72*** 3.74*** 3.64***
[0.194] [1.017] [1.029]
Series D 1.14***
[0.289]
Series E+ 0.36
[0.406]
Other Venture Capital 1.31*** 3.52*** 3.77***
[0.261] [0.667] [0.667]
Other Capital Forms 0.01 1.99*** 2.04***
[0.102] [0.734] [0.725]
Debt 0.07 1.54* 1.58*
[0.114] [0.916] [0.891]
Private Equity 1.43
[1.028]
Growth Equity 3.27***
[0.214]
Exited -0.10
[0.130]
32 MONTH YEAR
Accelerator Timing(Relative to Accelerated multiple: no funding )
Accelerated once: pre-funding only 1.35*** 1.41*** 1.38***
[0.121] [0.152] [0.149]
Accelerated once: pre- and follow-on 1.24*** 1.23*** 1.21***
[0.112] [0.151] [0.150]
Accelerated once: follow-on only 0.62*** -0.01 -0.03
[0.090] [0.100] [0.097]
Accelerate once: no funding -0.03 -0.07 -0.07
[0.086] [0.095] [0.092]
Accelerate multiple: pre- or follow-on 0.60*** 0.33*** 0.33***
[0.107] [0.125] [0.123]
Program
Total Firms Per Year -0.03*** -0.01***
[0.004] [0.005]
Accelerator Length (Months) 0.08*** 0.11***
[0.024] [0.026]
Capital Invested Per Firm 0.01*** 0.01***
[0.000] [0.000]
Equity -10.44*** -7.96***
[2.484] [2.787]
Space Amenities
Coworking Space 0.21**
[0.092]
Shared Office Space 0.18*
[0.104]
Discount Office Space -0.19
[0.165]
Lab Space 1.10**
[0.537]
Demo Day 0.43***
[0.137]
Constant -5.18*** -5.25*** -5.95***
[0.660] [0.853] [0.853]
Observations 7,628 2,322 2,322
R-squared 0.706 0.765 0.768
Adj R2 0.69 0.72 0.73
Robust standard errors in brackets
*** p<0.01, ** p<0.05, * p<0.1
VOL. VOLUME NO. ISSUEAN EXAMINATION OF ACCELERATOR PROGRAM IMPACTS ON FIRM PERFORMANCE33
V. Conclusion
The rise of accelerator programs offers a new unique set of urban amenities for
entrepreneurial firms and their laborers. Principally, accelerators expand financial
capital offerings for start-ups, but they also provide in many cases numerous
other amenities like educational programs, physical space, networks, mentorship,
capital financing, and community engagement. Ultimately, the programs’ goals
are to spur entrepreneurial development and garner financial success through an
alignment of financial incentives, e.g., equity.
Results documented here suggest that accelerator programs have an economi-
cally significant impact on the cumulative funding of early stage start-ups, where
our models explain up to 71 percent of the variation in cumulative funding for
start-ups in general. However, we also find that the choice to engage in an accel-
erator program is an endogenous choice made by firms. In addition, the selection
of firms by accelerator programs is also an endogenous choice. In this way, we
employ a 2SLS strategy, to instrument for engaging in an accelerator experience
and measuring both accelerator and control firm’s propensity to pursue acceler-
ator funding. Based on these findings we see that the contribution of accelerator
experiences to cumulative funding is financially positive, increasing cumulative
funding by 16 percent at the point of means, or by approximately $500K over the
firm’s life-cycle.
Furthermore, we have identified that the timing of entering an accelerator is
important. Pre-funding via grants or other seed/angel investments are a signal
to accelerator programs that other investors or capital providers have reviewed
the business and deemed it of investment quality. We also measure the impact
of follow-on funding. Follow-on funding does not harm firms, it is just estimated
that the marginal effects for signaling pre-funding capital are the most important
for cumulative funding investments.
Lastly, we also analyze data on accelerator amenities like the number of firms
that are in an accelerator cohort, the length of the accelerator program, the fi-
34 MONTH YEAR
nancial capital invested in each firm, the equity stake taken by the accelerator
in exchange for their capital or programmatic contributions as well as the supply
and type of physical space the accelerator program provides. Importantly, for
accelerator programmed firms, the number of firms that you interact with per
year decreases your cumulative funding, the length of the program and firm en-
gagement activities increases cumulative funding, whilst the increased amounts in
equity taken early on in a start-ups life decreases their overall cumulative funding.
Furthermore, the impact of enabling a place for innovation to really happen, has
a statistically and economically significant impact on cumulative funding, where
these firms receive approximately 18 to 21 percent more in cumulative funding if
given the early physical space to grow their businesses. These findings are im-
portant for accelerator program formation, as these programs are meant to be
helpful to the lifetime cumulative funding of firms, but if they are taking more
equity early on in the firm’s formation, then these firms will receive lower fund-
ing overall. Moreover, if accelerator programs are offering these amenities to too
many firms, then the overall cumulative funding of firm’s also decreases, albeit in
an economically insignificant way.
VOL. VOLUME NO. ISSUEAN EXAMINATION OF ACCELERATOR PROGRAM IMPACTS ON FIRM PERFORMANCE35
*
REFERENCES
Agrawal, Ajay, Iain Cockburn, Alberto Galasso, and Alexander Oettl.
2014. “Why are some regions more innovative than others? The role of small
firms in the presence of large labs.” Journal of Urban Economics, 81(Supplement
C): 149 – 165.
Agrawal, Ajay, Iain Cockburn, and Carlos Rosell. 2010. “Not Invented
Here? Innovation in company towns.” Journal of Urban Economics, 67(1): 78 –
89. Special Issue: Cities and Entrepreneurship.
Allen, David N., and Richard Mccluskey. 1991. “Structure, Policy, Services,
and Performance in the Business Incubator Industry.” Entrepreneurship Theory
and Practice, 15(2): 61–77.
Barnes, A. 2016. “Mass Producing Innovation: A Case Investigation on Why
Accelerators Might Not Be a Paradox.” Journal of STI Policy and Management,
1(2): 117–124.
Bugliarello, George. 2004. “Urban knowledge parks, knowledge cities and
urban sustainability.” International Journal of Technology Management, 28(3-
6): 388–394.
Carlino, Gerald A., Satyajit Chatterjee, and Robert M. Hunt. 2007. “Ur-
ban density and the rate of invention.” Journal of Urban Economics, 61(3): 389
– 419.
Chatterji, Aaron, Edward Glaeser, and William Kerr. 2013. “Clusters
of Entrepreneurship and Innovation.” National Bureau of Economic Research
Working Paper 19013.
Chinitz, Benjamin. 1961. “Contrasts in Agglomeration: New York and Pitts-
burgh.” American Economic Review, 51(2): 279–289.
36 MONTH YEAR
Cohen, Susan. 2013. “What Do Accelerators Do? Insights from Incubators and
Angels.” Innovations: Technology, Governance, Globalization, 8(3-4): 19–25.
Cohen, Susan, and Yael Hochberg. 2014. “Accelerating Startups: The Seed
Accelerator Phenomenon Accelerating Startups: The Seed Accelerator Phe-
nomenon Accelerating Startups: The Seed Accelerator Phenomenon.” Mas-
sachusetts Institute of Technology and NBER.
Cosgrave, Ellie, Kate Arbuthnot, and Theo Tryfonas. 2013. “Living Labs,
Innovation Districts and Information Marketplaces: A Systems Approach for
Smart Cities.” Procedia Computer Science, 16: 668–677.
Dahlstrand, Asa Lindholm, and Helen Lawton Smith. n.d.. “Science
Parks and Economic Development.” Globalization of Technology: Issues in Tech-
nology Transfer And Technological Capatibility Building, , ed. Prasada Reddy.
UNESCO-EOLSS.
Delgado, Mercedes, Michael Porter, and Scott Stern. 2010a. “Clusters
and Entrepreneurship.” Journal of Economic Geograpy, 10(4): 495–518.
Delgado, Mercedes, Michael Porter, and Scott Stern. 2010b. “Clusters,
Convergence and Economic Performance.” CES Working Paper, 10–34.
Dencker, John C., Marc Gruber, and Sonali K. Shah. 2009. “Individual
and Opportunity Factors Influencing Job Creation in New Firms.” Academy of
Management Journal, 52(6): 1125–1147.
Duranton, Gilles. 2007. “Urban Evolutions: The Fast, the Slow, and the Still.”
American Economic Review, 97(1): 197–221.
Eesley, Charles E., and Edward B. Roberts. 2012. “Are You Experienced
or Are You Talented?: When Does Innate Talent versus Experience Explain
Entrepreneurial Performance?” Strategic Entrepreneurship Journal, 6(3): 207–
219.
Eisenhardt, Kathleen M., and Claudia Bird Schoonhoven. 1990. “Organi-
zational Growth: Linking Founding Team, Strategy, Environment, and Growth

VOL. VOLUME NO. ISSUEAN EXAMINATION OF ACCELERATOR PROGRAM IMPACTS ON FIRM PERFORMANCE37
Among U.S. Semiconductor Ventures, 1978-1988.” Administrative Science Quar-
terly, 35(3): 504–529.
Ellison, Glenn, and Edward L Glaeser. 1997. “Geographic Concentration
in U.S. Manufacturing Industries: A Dartboard Approach.” Journal of Political
Economy, 105(5): 889–927.
Fehder, D., and Y. Hochberg. 2014. “Accelerating Startups: The Seed Ac-
celerator Phenomenon.” Working paper.
Florida, Richard. 2014. “Startup City. The Urban Shift in Venture Capital and
High Technology.” Martin Prosperity Institute.
Gavetti, Giovanni, and Jan W. Rivkin. 2007. “On the Origin of Strategy:
Action and Cognition over Time.” Organization Science, 18(3): 420–439.
Gennaioli, Nicola, Rafael La Porta, Florencio Lopez-de Silanes, and
Andrei Shleifer. 2012. “Human Capital and Regional Development.” Quarterly
Journal of Economics, forthcoming.
Glaeser, Edward, and Albert Saiz. 2004. “The Rise of the Skilled City.”
Brookings Wharton Papers on Urban Affairs 5, 47–94.
Glaeser, Edward, Hedi Kallal, Jose Scheinkman, and Andrei Shleifer.
1992. “Growth in Cities.” Journal of Political Economy, 100(6): 1126–1152.
Glaeser, Edward, Sari Kerr, and William Kerr. 2012. “Entrepreneurship
and Urban Growth: An Empirical Assessment with Historical Mines.” NBER
Working Paper 18333.
Hallen, Benjamin L, Christopher B Bingham, and Susan Cohen. 2014.
“Do Accelerators Accelerate? A Study of Venture Accelerators as a Path to
Success?” Academy of Management Annual Meeting Proceedings.
Hausman, Naomi. 2013. “University Innovation, Local Economic Growth, and
Entrepreneurship.” Working Paper.
Insights, PwC / CB. 2017. “MoneyTreeTM Report Q4 2017.” Report.
38 MONTH YEAR
Jaroff, Michael, Dennis Frenchman, and Francisca Rojas. 2009. “New
Century City Developments Creating Extraordinary Value.” Report.
Katz, Bruce, and Jennifer Bradley. 2013. The Metropolitan Revolution: How
Cities and Metros are Fixing our Broken Politics and Economy. Washington:The
Brookings Institution.
Katz, Bruce, and Julie Wagner. 2014. “The Rise of Innovation Districts: A
New Geography of Innovation in America.” Washington, DC: Brookings Insti-
tution.
Kerr, William R. 2009. “Breakthrough Inventions and Migrating Clusters of
Innovation.” National Bureau of Economic Research Working Paper 15443.
Kerr, William R., and Scott Duke Kominers. 2010. “Agglomerative Forces
and Cluster Shapes.” National Bureau of Economic Research Working Paper
16639.
Levinthal, Daniel A. 1997. “Adaptation on Rugged Landscapes.” Management
Science, 43(7): 934–950.
Marshall, A. 1920. Principles of Economics. London.
Moretti, Enrico. 2004. “Workers’ Education, Spillovers and Productivity: Ev-
idence from Plant-Level Production Functions.” American Economic Review,
94(3).
Muller, Edward K., and Paul A. Groves. 1979. “The Emergence of In-
dustrial Districts in Mid-Nineteenth Century Baltimore.” Geographical Review,
69(2): 159–178.
Murata, Yasusada, Ryo Nakajima, Ryosuke Okamoto, and Ryuichi
Tamura. 2014. “Localized knowledge spillovers and patent citations: A
distance-based approach.” Review of Economics and Statistics, 96(5): 967–985.
Porter, Michael. 1990. The Competitive Advantage of Nations. New York.
Rosenthal, Stuart, and William Strange. 2003. “Geography, Industrial Or-
ganization, and Agglomeration.” Review of Economics and Statistics, 85(2): 377–

VOL. VOLUME NO. ISSUEAN EXAMINATION OF ACCELERATOR PROGRAM IMPACTS ON FIRM PERFORMANCE39
393.
Rosenthal, Stuart, and William Strange. 2010. “Small Establishments/Big
Effects: Agglomeration, Industrial Organization and Entrepreneurship.” Ag-
glomeration Economics, , ed. Edward Glaeser. Chicago:University of Chicago
Press.
Saxenian, Anna Lee. 1994. Regional Advantage: Culture and Competition in
Silicon Valley and Route 128. Harvard University Press.
Siggelkow, Nicolaj. 2001. “Change in the Presence of Fit: the Rise, the Fall, and
the Renaissance of Liz Claiborne.” Academy of Management Journal, 44(4): 838–
857.
Smith, Sheryl, and Thomas J. Hannigan. 2015. “Swinging for the fences:
How do top accelerators impact the trajectories of new ventures?” Working
paper, , (1).
Stinchcombe, Arthur L, and JG March. 1965. “Social structure and orga-
nizations.” Handbook of organizations, 7: 142–193.